Article

Genetic Diversity and Structure of Geodorum eulophioides, a Plant Species with Extremely Small Populations in China

1
College of Forestry, Guizhou University, Guiyang 550025, China
2
Biodiversity and Nature Conservation Research Center, Guizhou University, Guiyang 550025, China
3
Guiyang Wild Animal and Plant Protection Station, Guiyang 550300, China
*
Author to whom correspondence should be addressed.
Diversity 2023, 15(9), 990; https://doi.org/10.3390/d15090990
Submission received: 19 June 2023 / Revised: 30 August 2023 / Accepted: 31 August 2023 / Published: 3 September 2023
(This article belongs to the Topic Plant Chloroplast Genome and Evolution)

Abstract

:
Geodorum eulophioides is a unique and endangered species belonging to the Orchidaceae family in China. It has great potential as an ornamental horticultural plant. However, little is known about its genetic diversity and reasons for being endangered due to its narrow distribution and few populations in the wild. To effectively evaluate and conserve available resources, the genetic diversity and population structure of G. eulophioides were analyzed in this study. A total of 94 individuals from 10 natural populations were studied using site-specific amplified fragment sequencing (SLAF-seq). Based on the 76,340 SNPs detected by SLAF-seq, genetic diversity analysis was performed and markers associated with environmental variables were determined. The results showed that the level of genetic diversity in the 10 natural populations studied was low, with PIC values ranging from 0.1874 to 0.2156. FIS values ranged from −0.2376 to 0.2658, with excess and deficiency in heterozygotes. FST values ranged from 0.0482 to 0.3144, with genetic variation among populations. AMOVA results showed that the genetic variation among populations accounted for 21.35% of the total variation, and the remaining genetic variation among individuals within populations was 78.65%. The results of the population structure analysis showed that 94 individuals were classified into three major groups and two subgroups. Environmental association analysis using Bayenv2 and LFMM yielded thirty and eighteen putative adaptive loci, respectively, and five specific functional genes were annotated. In summary, this study provides further insight into the genetic structure of G. eulophioides and provides a reference for protection and restoration.

1. Introduction

Geodorum Jacks is a small genus of Orchidaceae that has approximately ten species and is mainly distributed in tropical Asia to Australia and the South-West Pacific Islands [1] There are five species in China, namely, G. attenuatum Griff., G. densiflorum (Lam.) Schltr., G. eulophioides Schltr., G. pulchellum Ridl., and G. recurvum (Roxb.) Alston [2]. Among these, Geodorum eulophioides Schltr. (1921) is a critically endangered orchid (IUCN), is one of the major conservation targets, has unique morphological characteristics (rose-colored flowers), and grows in Guizhou and neighboring Yunnan and Guangxi provinces [2]. The species was discovered and named in 1921 by the German botanist Schlechter in Luodian County, Guizhou Province, China. Flora of China records of the species remain incomplete because there is no description of flower morphology. Other morphological records are described only by type specimens (Esquiol 3169, type, B, Berlin), and these observational data are incomplete, lacking descriptions of leaf size, fruit morphology, and fruit stage. The plant’s described flowering time in December is completely different from that of other species of this genus (flowering time is usually from April to July), which needs to be verified. The species was not found for the next 80 years, until 2004, when it was rediscovered in the Yachang Forestry Centre, Guangxi Province, where a nature reserve has been established to protect it [3]. With in-depth field investigations, 17 small populations of the species have been found in Guizhou, Guangxi, and Yunnan [4]. However, the species has a very low natural reproduction rate and there are few young plants, leading to the degradation of these populations. The entire population still shows a declining trend and is in danger of extinction. It is also treated as a plant species with extremely small populations (PSESP), and the main risk factors are lack of competitiveness of the population, fragmentation of habitat, very low natural reproduction rate, low seed germination rate, and human interference. To protect this species and to prevent extinction, protection measures are needed, and some researchers have studied the species in terms of its morphology, rapid tissue propagation, symbiotic bacteria, mechanism of endangerment, and conservation [3,5,6,7]. Genetic diversity refers to the largest genetic variation in the genetic composition of a specific species. It is an important part of species diversity, the product of the long-term evolution of a species, and the basis for species survival, adaptation, and development [8]. Conserving the genetic diversity of a species could ensure its ability to adapt to environmental changes. Therefore, it is crucial to understand the genetic structure and evolutionary history of endangered species to provide guidance for ex situ conservation, introduction, and cultivation of endangered species. The distribution of G. eulophioides in Guizhou is extremely narrow, and it is susceptible to extinction due to disturbance by human activities and other environmental changes (such as transitional grazing and wild collection). Therefore, there is an urgent need to carry out conservation biology research on G. eulophioides. An in-depth understanding of the genetic diversity of the population (e.g., genetic diversity and population structure) will help researchers formulate more appropriate and scientific conservation strategies.
Previous research on the genetic diversity and local adaptation of plants has been conducted at the DNA-based molecular level, such as random amplified polymorphic DNA (RAPD), inter-simple sequence repeat (ISSR), amplified fragment length polymorphism (AFLP), simple sequence repeat (SSR), sequence-related amplified polymorphism (SRAP), and single nucleotide polymorphism (SNP). Among these, single nucleotide polymorphisms (SNPs) based on next-generation sequencing (NGS) have become the markers of choice for determining population structure because they are abundant, stable in the genome, and can be accurately scored. A low-cost and high-throughput approach to discovering hundreds to thousands of SNPs in non-model species is restriction-site-associated DNA sequencing (RAD-seq). RAD-seq methods have been used on plant communities to reveal their evolutionary history and local adaptability, identify the genetic structure of populations, and determine how environmental and topographical elements affect genetic diversity and differentiation. They have also been used to identify genetic lineages of plants, thereby creating references for the conservation of rare species [9,10,11,12].
SLAF-seq is a whole genome sequence tag enrichment method based on second-generation sequencing technology for genome analysis and genetic map construction [13]. To date, there has been no study on the genetic diversity and population structure of the natural population of G. eulophioides in the entire known distribution. In this study, we attempted to assess the genetic diversity and population structure of ten field populations of ninety-four individuals of G. eulophioides in China and identify the potential local adaptation genes using SLAF-seq-identified SNPs. The results of this study will contribute to understanding the evolutionary history of G. eulophioides and provide a scientific basis for its conservation and management.

2. Materials and Methods

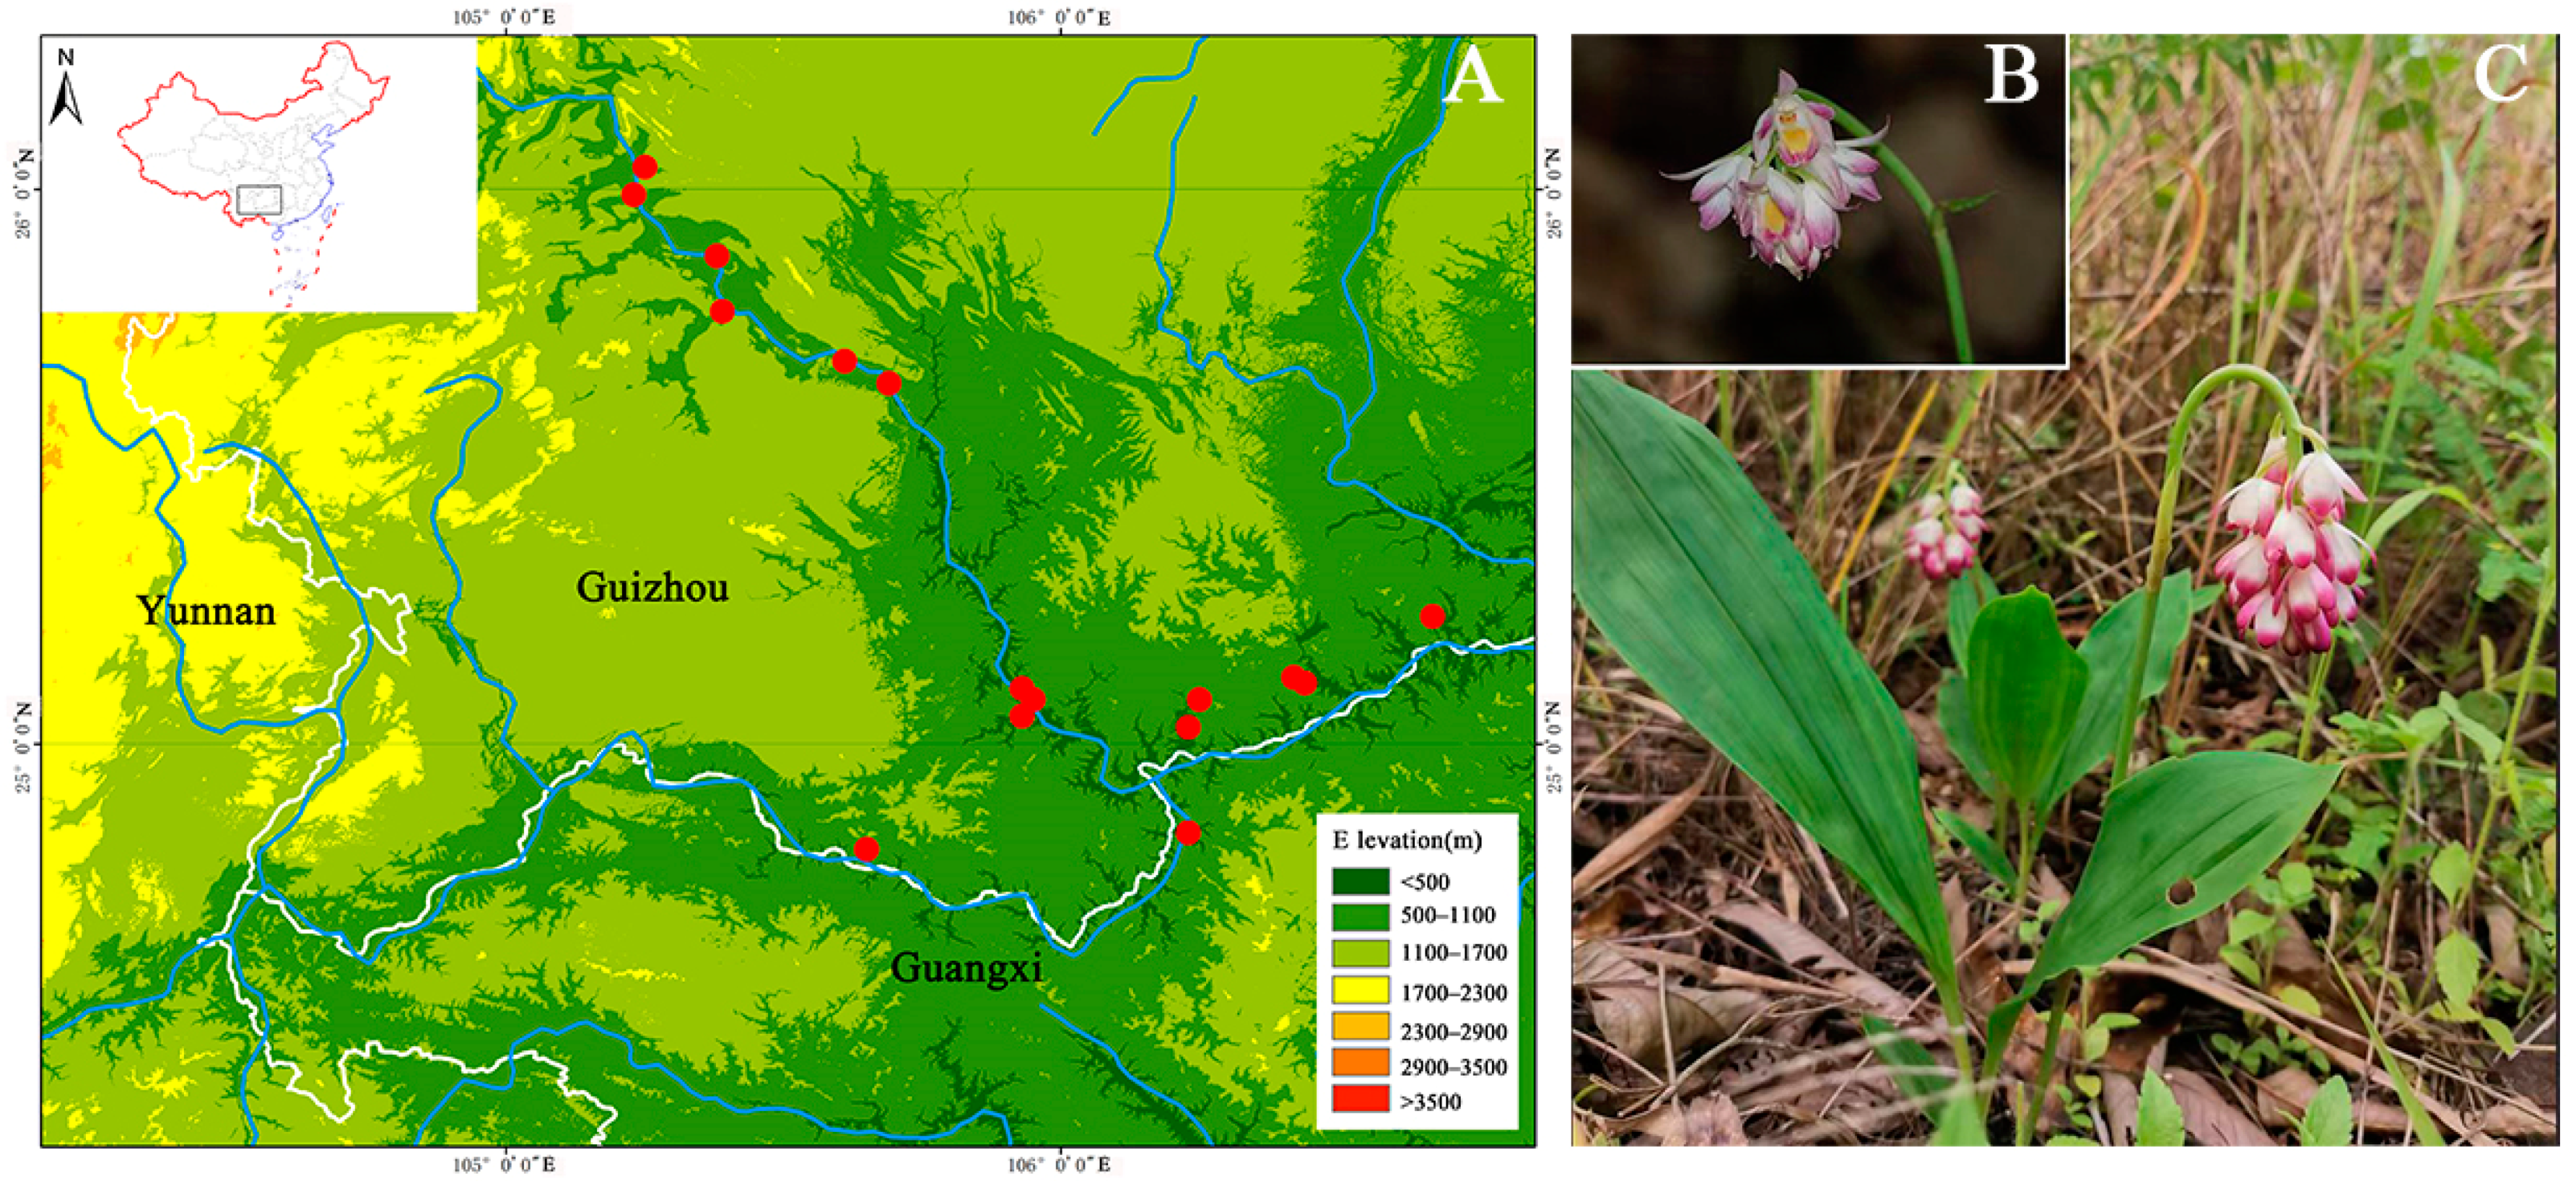
2.1. Plant Materials

A total of 94 individuals of 10 wild natural populations were collected in the present study from Guangxi Province and Guizhou Province from June to August 2021. The number of samples and geographic distribution of the plant material are provided in Table 1 and Figure 1. Most of the individuals were collected in Guizhou Province, except the samples belonging to the YC population, which were collected from Long Town, Leye City, Guangxi Province. Due to the small number of plants in the field population, we collected only fresh leaves from each plant. For each population, 8–11 individuals were sampled, with individuals at least 300 m apart. After collection, they were stored in a dry refrigerator below −20 °C until use in the laboratory.

2.2. Librarary Construction and SLAF Sequencing

Genomic DNA was extracted from the fresh leaves of G. eulophioides via the CTAB method [14], and DNA concentration and quality were assessed with a Nanodrop 1000 Spectrophotometer (Thermo Fisher Scientific, Wilmington, MA, USA) and 1.5% agarose gel electrophoresis. Quantified DNA samples were diluted to 100 ng/µL for the subsequent SLAF-seq analysis. SLAF-seq was performed according to a previous report [9], with some modifications. As no information on the sequence of G. eulophioide has been released, the dual-digestion scheme used Phalaenopsis equestris (Schauer) Rchb. (a similar species in Orchidaceae) for the prediction of enzyme digestion. Briefly, the reference genome of Phalaenopsis equestris was used to perform marker discovery surveys by simulating the number of markers obtained by various restriction enzymes in silico. One hundred nanograms of genomic DNA from each sample was digested with restriction enzymes, and HaeIII and Hpy166II were evaluated using control data to ensure the accuracy and validity of the data. Finally, sequences with enzyme section lengths of 500–550 bp were defined as SLAF tags, and the sequencing depth of each SLAF tag was recorded. The obtained enzymatically sliced segments (SLAF tags) were subjected to 3′ end plus single nucleotide (A) treatment and ligated with dual-index sequencing connectors [15]. The efficiency of enzyme digestion was important for reduced-representation sequencing. In this study, the optimal enzyme digestion scheme was used to carry out the enzyme digestion of G. eulophioides genomic DNA. We follow three principles that are the same as those in Xia et al. [16]: (1) the proportion of the enzymatic fragments in the repeated sequence should be as low as possible; (2) the length of the enzyme-cutting fragment should be consistent with the specific experimental system; and (3) as many enzyme-cutting fragments (SLAF tags) should be obtained as possible. After digestion, a single nucleotide (A) was added to the 3′ end using dATP at 37 °C, and then dual-index adapters were ligated to the A-tailed DNA fragments. PCR amplification was subsequently performed using diluted restriction-ligation DNA as the template. Finally, SLAF sequencing was carried out using an Illumina HiSeqTM 2500 (Illumina, Inc; San Diego, CA, USA) at the Biomarker Technologies Corporation in Beijing.

2.3. SLAF Tag Development and SNP Calling

Raw reads generated from the sequencing platform were first standardized by removing the adapter sequence included in the raw reads, and low-quality reads containing ambiguous barcodes were eliminated (quality scores < 20). Sequence quality was verified via Fastqc (http://www.bioinformatics.babraham.ac.uk/projects/fastqc/, accessed on 19 June 2023) low-quality reads and empty reads (reads containing only adapter sequences). High-quality paired-end reads were clustered using BLAT software based on sequence similarity [17]. Sequences with over 90% similarity among different individuals were identified as one SLAF locus [9]. SAMtools [18] and the Genome Analysis Toolkit (GATK) [19] were used for SNP calling, and their intersection was considered to indicate reliable SNPs. For the phylogenetic analysis, SNPs with a minor allele frequency (MAF) < 5% and missing rate > 0.2 were filtered [20].

2.4. Diversity Analysis

SNPs extracted from 94 individuals were used to study their genetic diversity and population structure. The commonly used indices of genetic diversity, including the observed allele number (Na), expected allele number (Ne), observed heterozygous number (Ho), expected heterozygous number (He), Nei’s diversity index (H), Shannon’s Wiener index (I), and polymorphism information content (PIC), were calculated using POPGENE [21]. These indices were calculated to estimate the degree of allele distribution (Na and Ne), genomic heterozygosity (Ho and He), gene diversity (H and I), and DNA polymorphism (PIC). To assess the population differentiation, analysis of molecular variance (AMOVA) was calculated to estimate the partitioning of genetic variance among populations. Meanwhile, the pairwise fixation index (Fst) among populations was also computed to detect how gene diversity was partitioned at each level. The interindividual fixation index (FIS) was analyzed to determine the deviation of genotype frequencies from Hardy–Weinberg proportions within each population. AMOVA, Fst, and FIS were estimated by Arlequin Ver 3.5.2.2 [22]. The neighbor-joining phylogenetic tree was constructed by MEGA X software with the following parameters: neighbor-joining method, Kimura 2-parameter model, and 1000 bootstrap replicates. The population structure was analyzed using Admixture [23] on the basis of the maximum-likelihood method. A number of populations (K), ranging from 1 to 10, was tested, and each individual was assigned to its respective population according to the maximum membership probability. Genetic relationships among the studied individuals were also assessed using principal coordinates analysis (PCoA) in EIGENSOFT [24] based on the Euclidian distances between individual genotypes.

2.5. Analysis of Environmental Adaptive Loci

The association analyses between SNPs and climatic variables were conducted using two programs, Bayenv2 [25,26] and Latent Factor Mixed Model (LFMM) [27]. First, we detected correlations between environmental variables and SNP allele frequencies using Bayenv2. For each tested SNP, this program generated a Bayes factor (BF) and nonparametric Spearman’s rank correlation coefficient (ρ) based on the Markov chain Monte Carlo (MCMC) method. In this study, the significance thresholds for the putative adaptive markers were those ranked among the top 1% of BF values (log10BF > 2.75) and top 5% of ρ values. The other software, LFMM, was also used for gene–climate association analysis. As it estimates the hidden impact of population structure, LFMM permits the presence of background levels of population structure (latent factors). The detected SNPs that exhibited an association with the environment were determined according to the z score. Bonferroni adjustment was used on the z score values for multiple tests. Markers with z scores > 2.8 and a p-value < 0.01 were considered to be significant. Putative functions for the identified outlier loci were annotated using the NCBI and UniProt databases.

3. Results

3.1. SNP Detection

A total of 222 Mb reads were generated via high-throughput SLAF-seq of the 94 G. eulophioides individuals, with a mean Q30 value of 91.94% and an average GC content of 35.55 (Table 2). We obtained a total of 1,625,234 high-quality SLAF tags for the 94 samples, with an average depth of 13.29× for each SLAF (Table 2). Of the SLAF tags, 146,035 were polymorphic. These polymorphic SLAFs contained 1,631,363 SNPs in total, and following application of the filtering criteria, 76,340 of these were utilized in further analyses.

3.2. SLAF Tags and SNP Calling

The SLAF tags and SNP markers of the ten G. eulophioides populations are shown in Table 3. The Q30 content ranged from 91.09% to 92.83% among different populations, with the highest being in the GLHJZ population and the lowest being in the WHBH population. The GC content ranged from 35.03% to 36.26%, with the highest being in the LZTXQ population and the lowest being in the WMPW population. The highest number of SLAF tags was LZTXQ at 180,194.04, and the lowest was CHBQ at 113,817.22. The sequencing depth ranged from 10.72× (WHBH) to 18.97× (LZTXQ), with an average depth of 13.29×. The LZTXQ population had the highest number of SNPs (850,901.19), and the CHBQ population had the lowest number of SNPs (515,665.52). The SNP completeness ranged from 31.60% to 52.16%, with an average of 42.76%. The SNP heterozygosity ranged from 7.06% to 12.17%, with an average of 9.45%; the largest was in the LZTXQ population and the smallest was in the CHBQ population.

3.3. Genetic Diversity and Genetic Differentiation

The value of the observed allele number (Na) ranged from 1.6796 (LZLJD) to 1.8342 (YC) across populations, and the values of the expected allele number (Ne) ranged from 1.3976 (GLHJZ) to 1.4469 (LZTXQ), with a mean value of 1.4193. The observed heterozygous (Ho) values were slightly higher than the He values, with values lying between 0.2074 (CHBQ) and 0.3169 (LZTXQ), and an average of 0.2600. The values of the expected heterozygous (He) number across the seven populations were between 0.2339 (LT) and 0.2670 (LZTXQ), with an average value of 0.2511. Nei’s diversity index (H) was within the range from 0.2499 (LT) to 0.2817 (LZTXQ/YC), with a mean value of 0.2673. Shannon’s Wiener index (I) varied from 0.3517 to 0.4059 for the LT and YC populations, respectively. The PIC values of the ten populations ranged from 0.1874 to 0.2156, with an average of 0.2030. The maximum value of PIC was presented in the LZTXQ/YC population, while the minimum value was found in the LT population. However, in the present study, we used FIS to evaluate intraplant selfing, with results ranging from −0.2376 (LT population) to 0.2658 (QLPJ population) (Table 4).
In this study, the pairwise fixation index (Fst) was used to measure genetic differentiation among populations. The results showed the greatest genetic differentiation values between the WMPW and LZTXQ populations (0.3144), indicating the greatest degree of differentiation. The smallest genetic differentiation values were found between the LT and GLHJZ populations (0.0482) (Table 5). AMOVA results showed that the genetic variation among populations accounted for 21.35% of the total variation, and the remaining genetic variation among individuals within populations was 78.65% (Table 6).

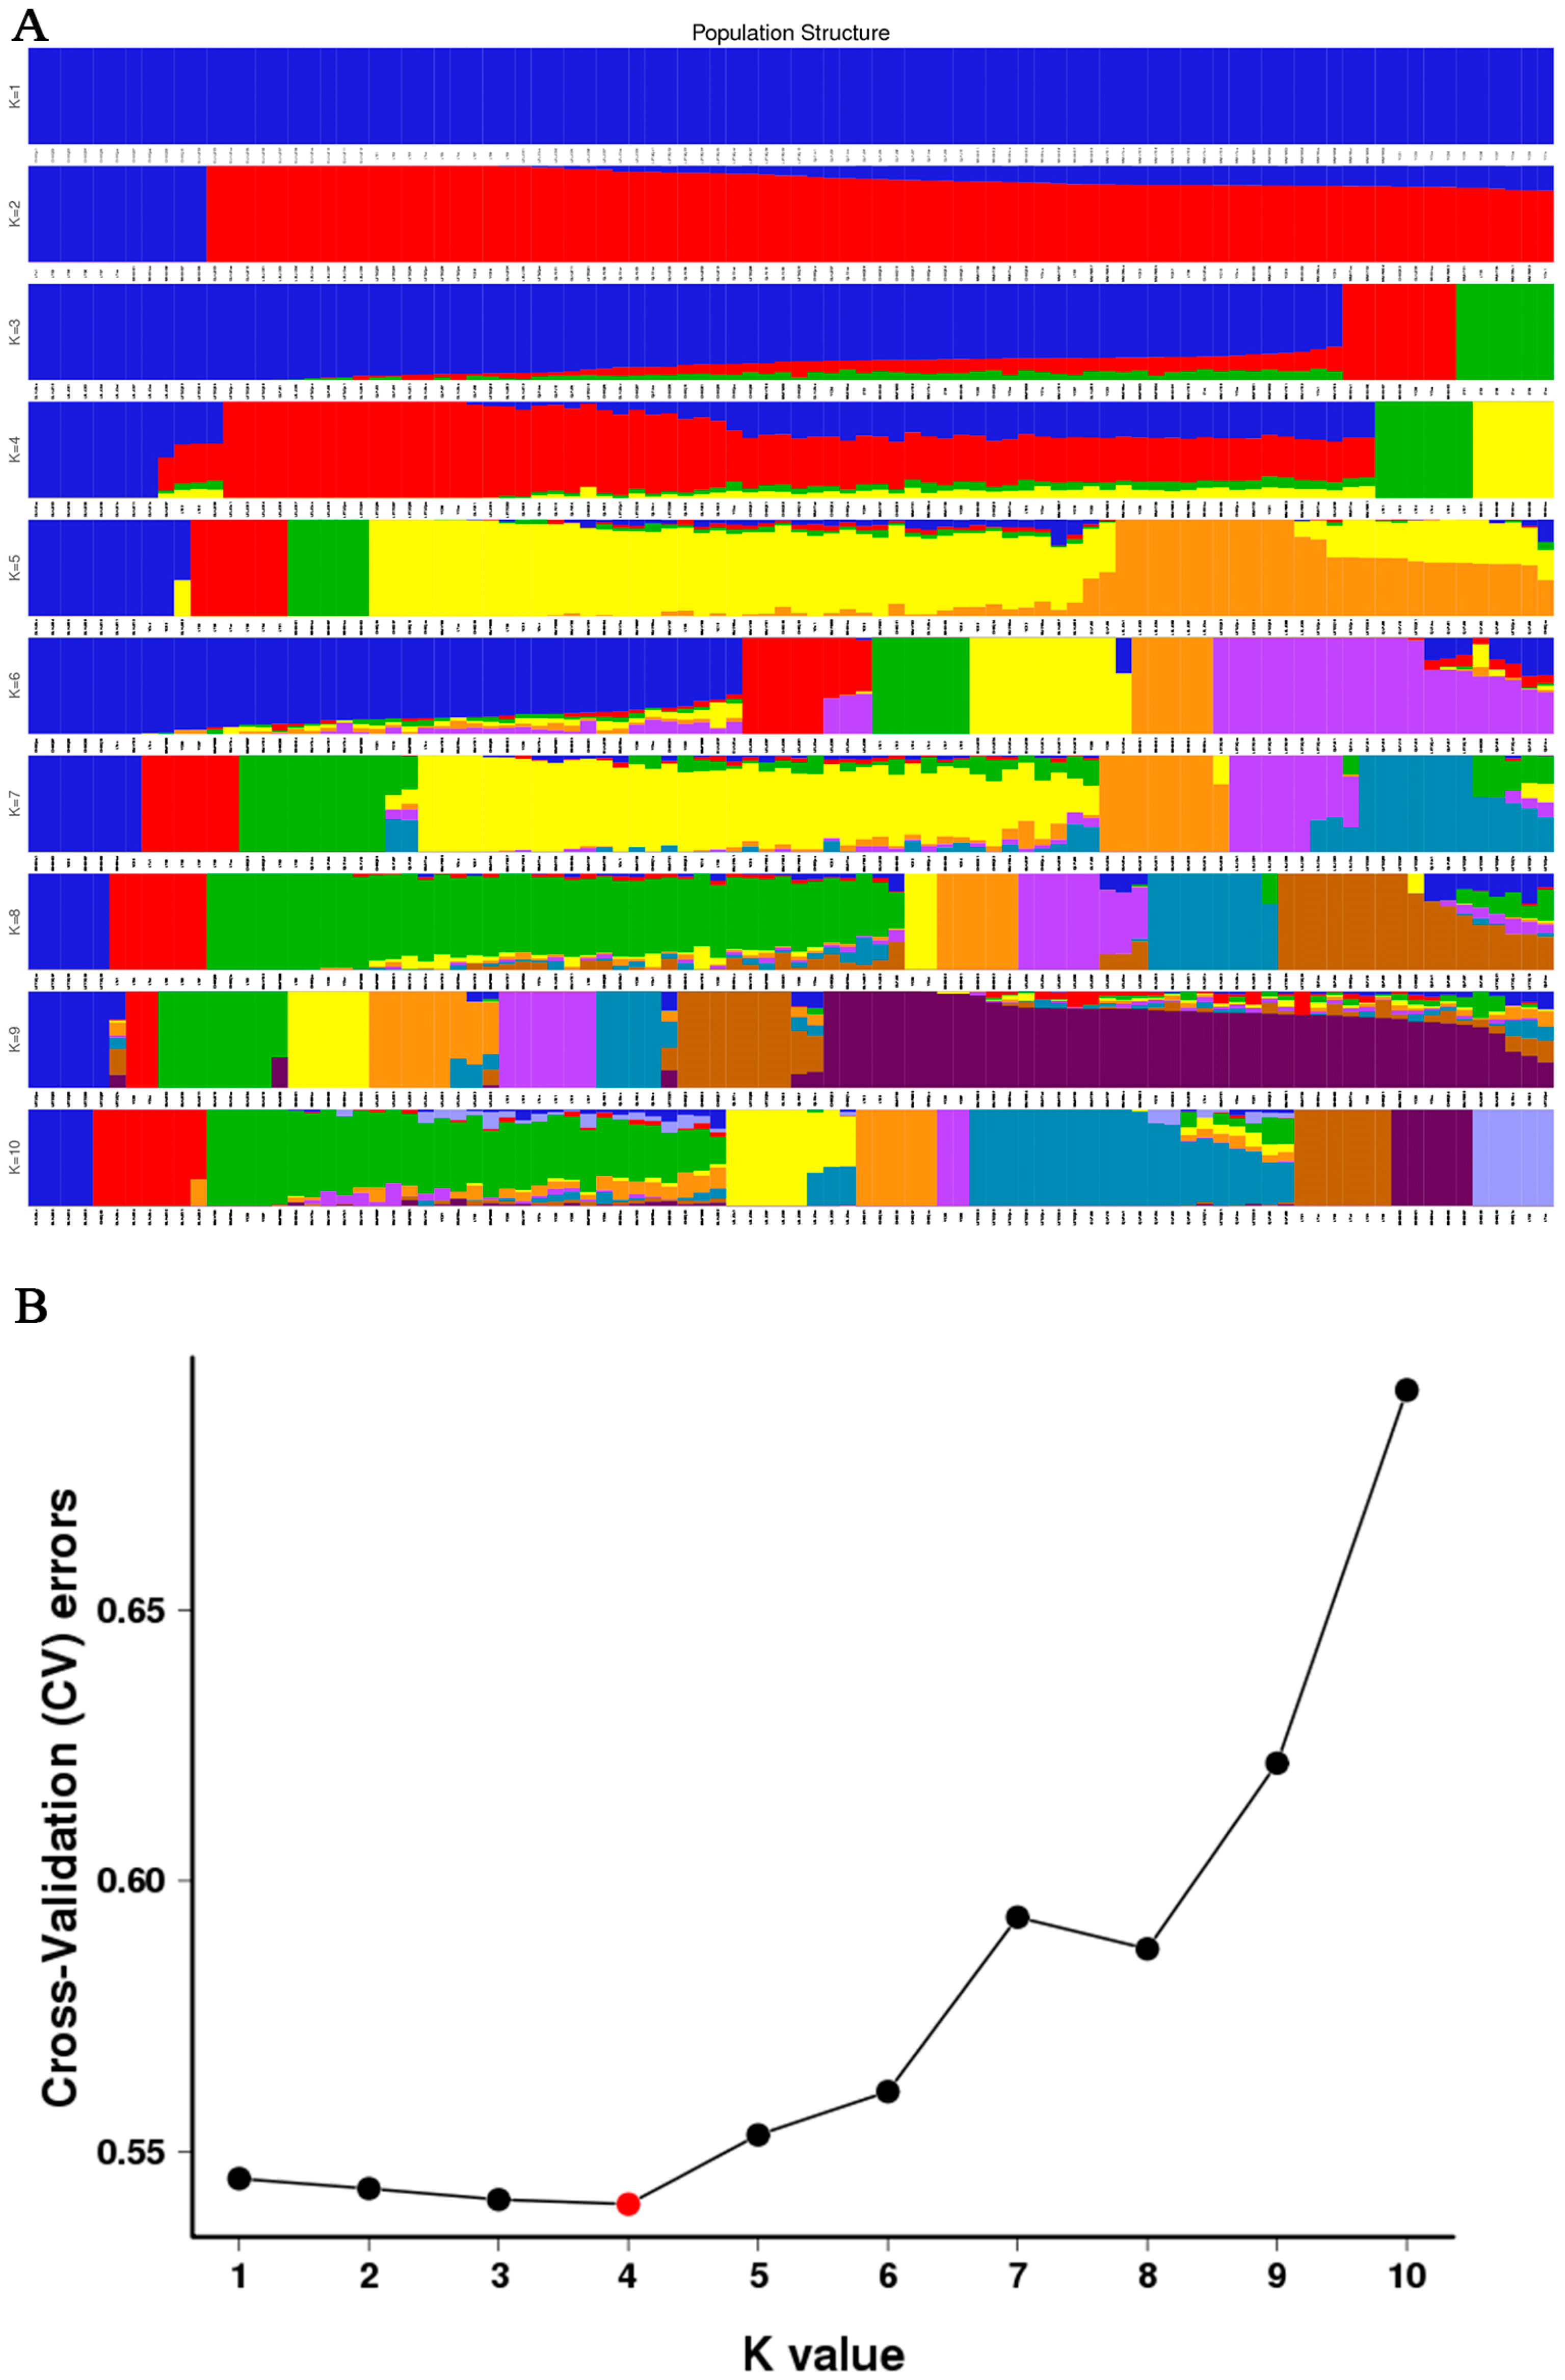
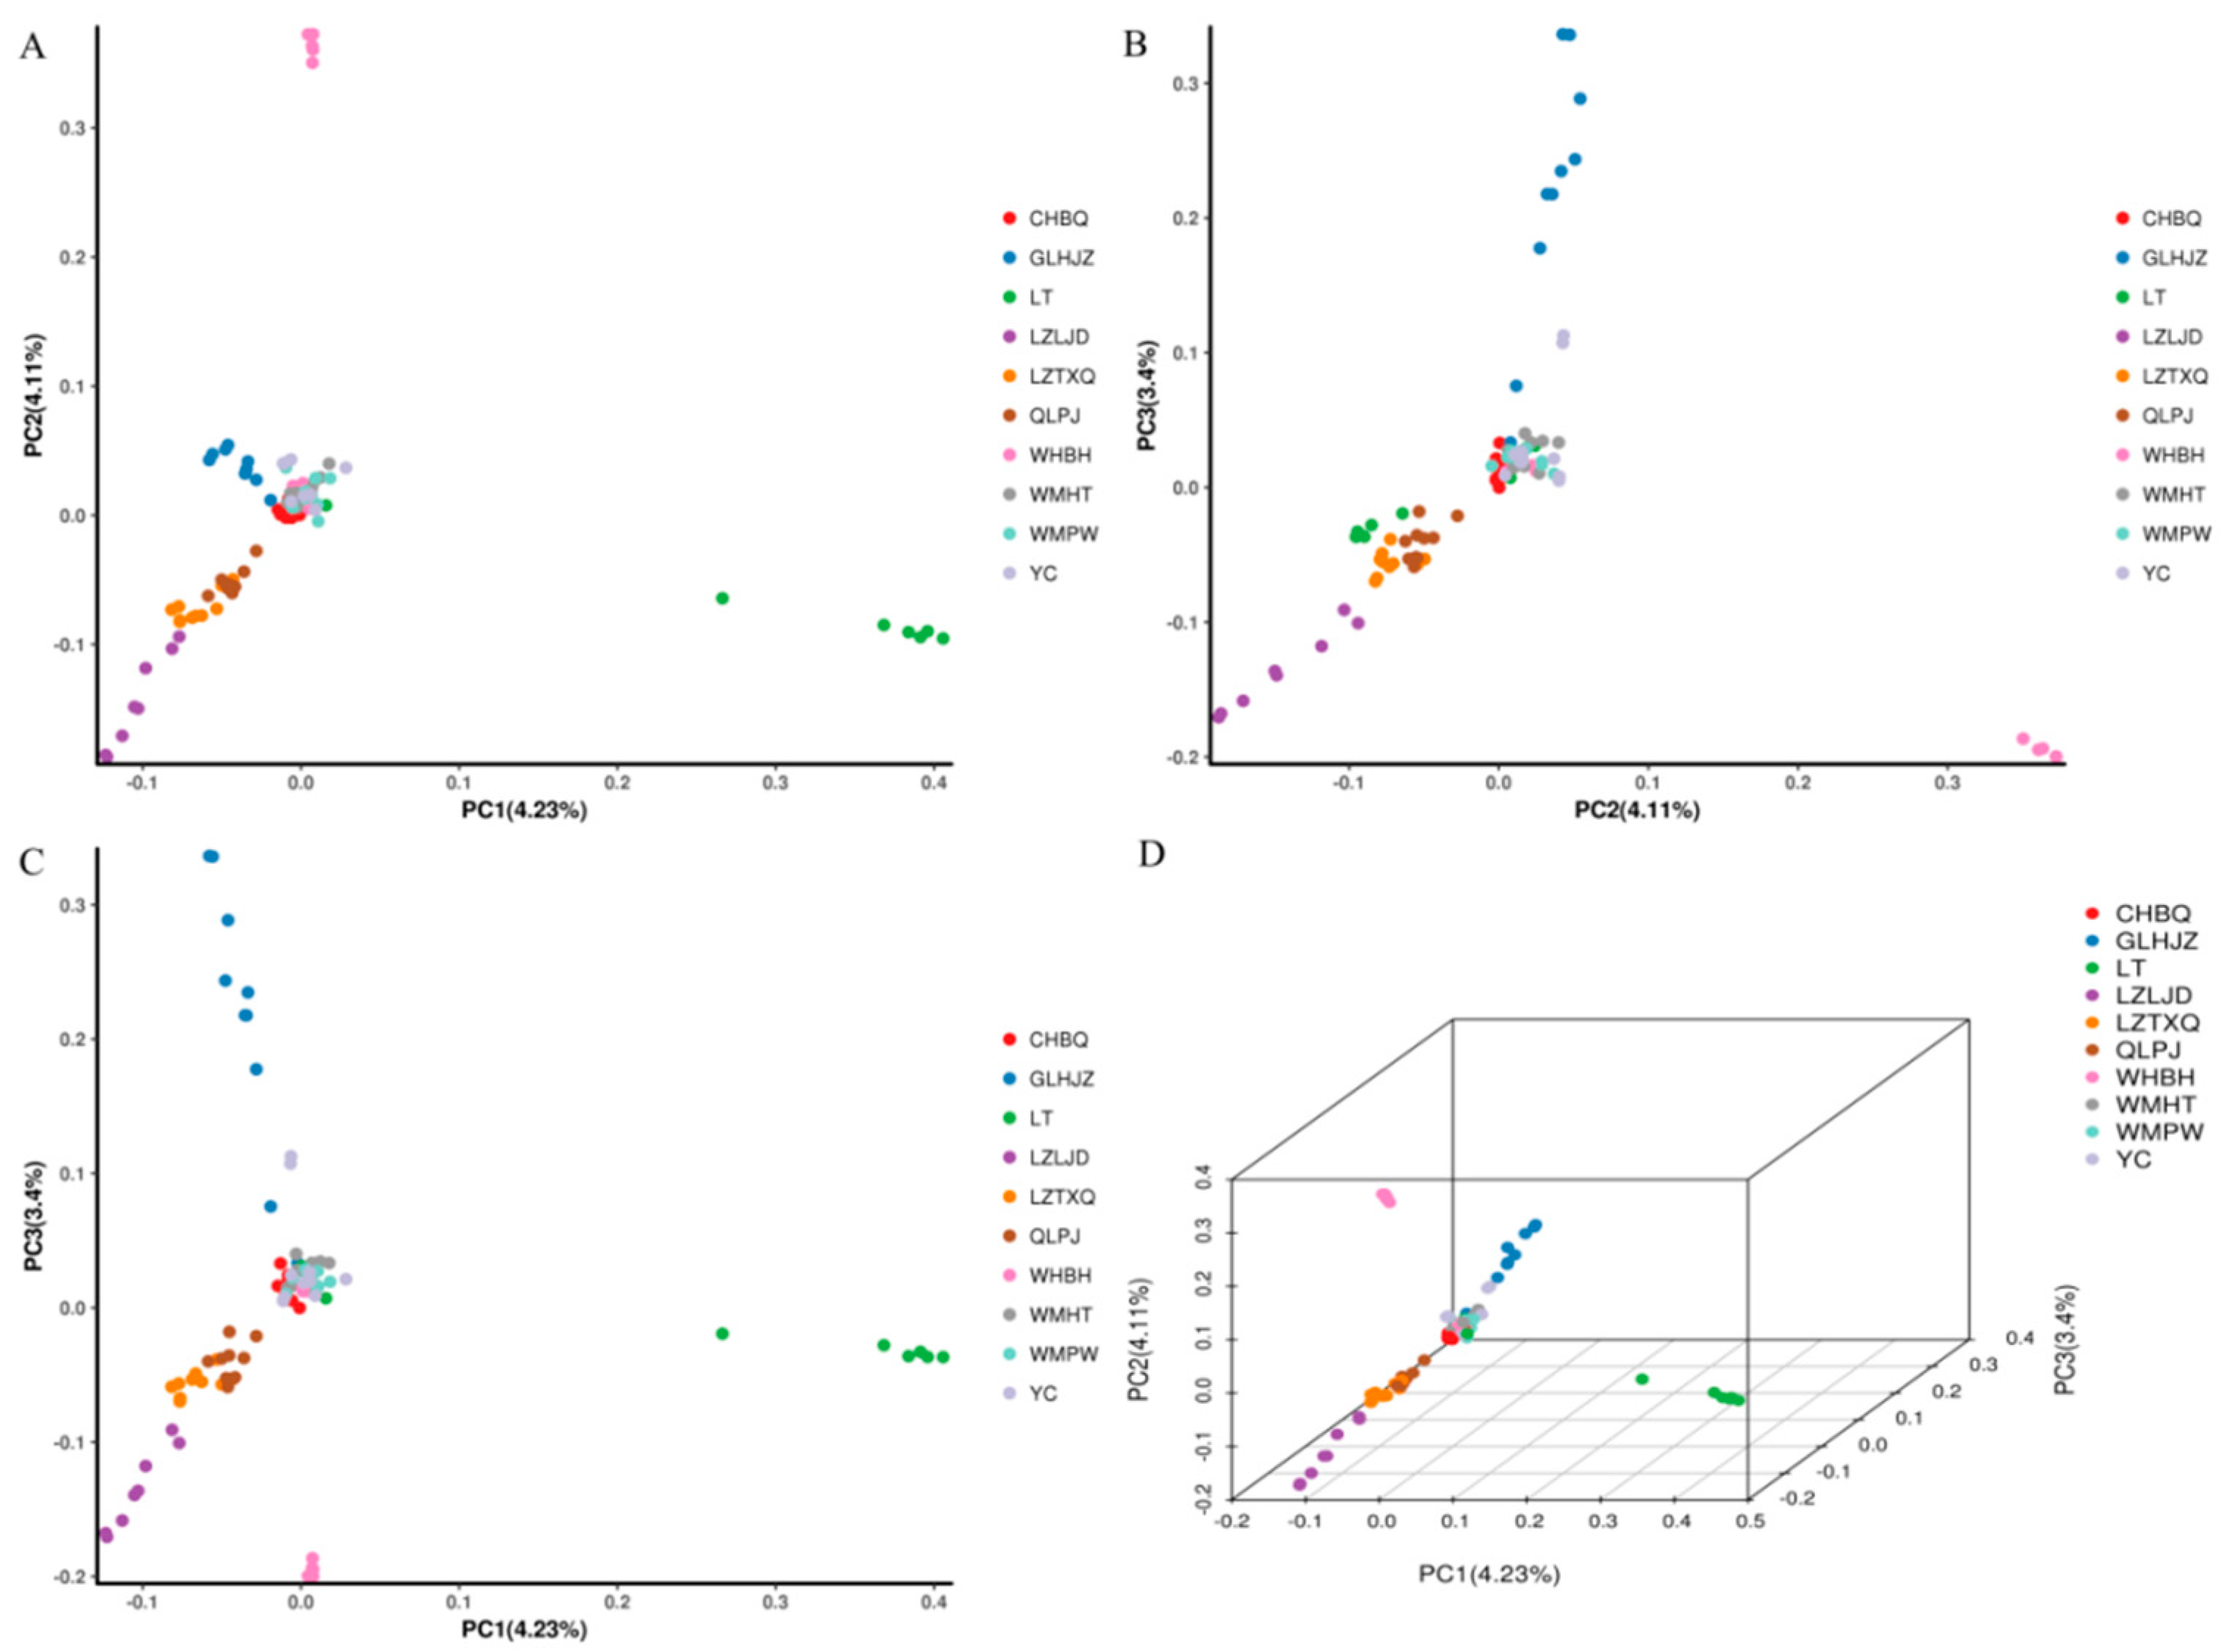
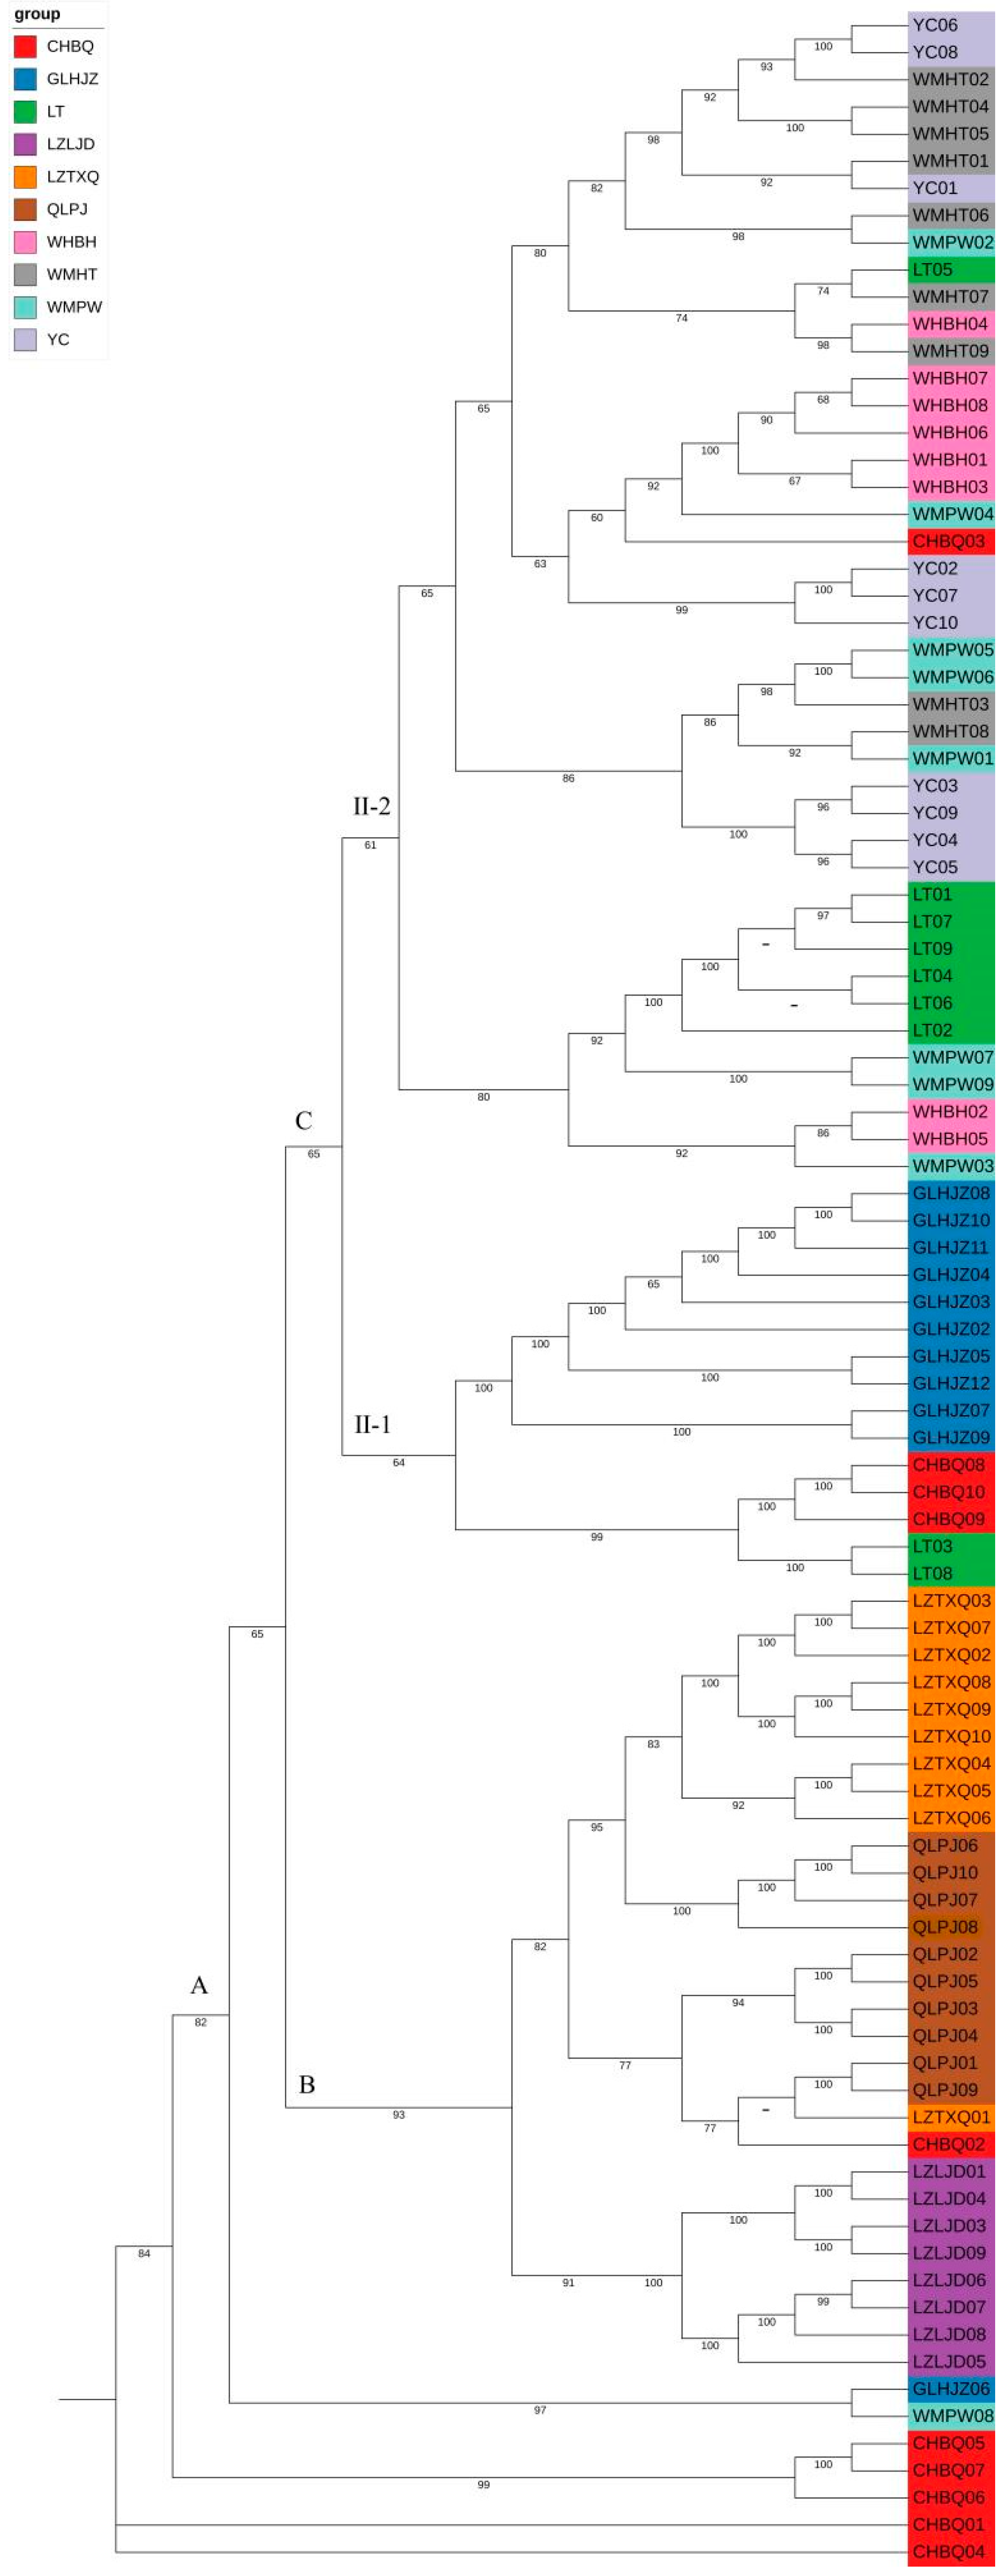
3.4. Phylogenetic Relationship and Population Structure

Population structure analysis of 94 individuals of G. eulophioides was performed using the screened population SNP loci, and the optimal number of subgroups was determined based on the valley value of the cross-validation error rate. The number of ancestors was determined by the number of subgroups (K) between 1 and 10 (Figure 2B), and the valley value of the cross-validation error rate used was 4, so the 94 individuals were divided into the optimal four taxa. Group I is the blue gene pool, which was mainly from the GLHJZ populations. Group II consisted only of red gene pool sections from the LZZJD, LZTXQ, YC, QLPJ, CHBQ, WMHT, and WMPW populations. Group III is the green gene pool, mainly including the LT population. Group IV consisted only of the yellow gene pool section from the WHBH population (Figure 2A). Individuals with a low degree of admixture were seen from all the studied populations.
The results of principal component analysis (PCA) in this study showed that, consistent with the results of ADMIXTURE analysis, the first and second principal components divided the 94 G. eulophioides samples into four groups (Figure 3A). WHBH and LT were each clustered into an independent category, LZLJD, LZTXQ, and QLPJ were brought together to form a cluster, and the remaining five groups were brought together into a cluster. The four clusters were clearly distinguished. The two-dimensional plots of the second and third principal components likewise corroborate this result (Figure 3B). The first and third principal components provide important evidence for the differentiation of LT groups (Figure 3C). The three axes of principal components explained a total of 11.74% of the genetic variation, with PC1 explaining 4.23% of the genetic variation, PC2 explaining 4.11% of the genetic variation, and PC3 explaining 3.40% of the genetic variation (Figure 3D).
In order to further explore the relatedness between different populations of G. eulophioides, genetic distances between individuals were calculated, and a phylogenetic tree of 94 G. eulophioides samples was used to analyze the genetic relationships among 94 G. eulophioides individuals using MEGA X. The results showed that the 94 individuals were classified into three major clades according to their genetic relationships. The first clade (A) mainly included five individuals from the CHBQ population, one individual from the WMPW population, and one individual from the GLHJZ population, totaling seven individuals. The second clade mainly consists of forty individuals, including eight individuals from the LZLJD population, eleven individuals from the LZTXQ population, ten individuals from the QLPJ population, ten individuals from the QLPJ population, and one individual from CHBQ. The third clade (C) contained 58 individuals, which could be further divided into two subclades, II-1 and II-2. Subclass II-1 contained ten individuals from GLHJZ, three individuals from CHBQ, and two individuals from LZ, totaling fifteen individuals. Subclass II-2 contained six individuals from WMPW, eight individuals from WMBH, seven individuals from LT, seven individuals from WMHT, ten individuals from YC, and one individual from CHBQ. In terms of classification, the populations of the Beipanjiang Karst landform were grouped into one category (C), the populations of the normal landform were also grouped into one category (A and B), and category II had no obvious characteristics (Figure 4).

3.5. Association between SNP Markers and Environmental Variables

Association analysis of SNPs with environmental variables using Bayenv2 and LFMM programs showed that Bayenv2 identified a total of thirty SNP markers significantly associated with environmental variables, among which fifteen, seven, and eight were associated with altitude, annual rainfall, and annual average temperature, respectively (Table 7). The LFMM procedure was used to obtain eighteen SNP markers associated with climate variables, including ten markers for annual average temperature, five markers for altitude, and three markers for annual rainfall (Table 8). BLAST search results showed that there were five relevant SNP markers that could be annotated. Two markers associated with altitude (marker20104 and marker21684) could be annotated to serine/threonine-protein kinase and RNA-directed DNA polymerase genes. The annotated putative genes came from Brassica rapa and Malus domestica. Marker39371, associated with annual rainfall, can be annotated to the ribonuclease H protein gene, and the putative gene is from Phoenix dactylifera. Markers60868 and 15670, associated with annual average temperature, can be annotated to the pentatricopeptide repeat-containing protein and F-box/LRR-repeat protein genes, as well as the putative genes from Nelumbo nucifera and Triticum urartu (Table 9).

4. Discussion

Specific length amplification fragment sequencing (SLAF-seq) is a simplified genome deep sequencing technique developed based on second-generation high-throughput sequencing technology [28,29], which has the advantages of high throughput, high accuracy, and a short cycle time, and has been extensively used in genetic variation, genetic structure, phylogeny, and germplasm selection. In this study, the SLAF-seq technique was used to assess the genetic diversity of G. eulophioides and explore its adaptive mechanisms. By constructing a SLAF-seq database using SLAF-seq technology, 1,625,234 SLAF tags were obtained from it, of which 76,340 polymorphic SLAF tags were polymorphic, and a total of 1,631,363 population SNP markers were developed. The polymorphic information content between populations (PIC = 0.2030) indicated that the SNP loci were of low polymorphic sites. There were differences in SNP markers among populations, with the LZTXQ population having the highest number of SLAF tags and SNPs, and the CHBQ population having the lowest number of SLAF tags and SNPs.
The level of population genetic diversity is usually measured using heterozygosity; the higher the value, the lower the population uniformity and the richer the genetic diversity [28]. The expected heterozygosity of the 10 populations of G. eulophioides was 0.2511, with the highest genetic diversity in the LZTXQ population (He = 0.2670) and the lowest genetic diversity in the LT population of the type origin (He = 0.2339). This result was much lower than the expected heterozygosity (He = 0.6519) of the four populations of G. eulophioides in the Yachang Orchid Plant Reserve (YOC) using the simple repeated sequence (SSR) molecular marker technology [30]. The YC population in this study (He = 0.2655) was from the same sampling site as the population studied in the previous research, but the expected heterozygosity of the two was quite different, that is, the marker types were different. In other words, different marker types had a greater impact on the results of genetic diversity parameters calculated for the same population. This is similar to the results of the Pinus bungeana Shaanxi Wuzi mount population study [31,32], so markers with higher polymorphisms should be selected in order to reveal the true level of genetic diversity in the population [33]. The genetic diversity index of this study (He = 0.2511, H = 0.2673, Na = 1.7697, Ho = 0.2600, PIC = 0.2030, I = 0.3817), compared with that of other rare and endangered plants, such as Paeonia ludlowii (He = 0.421, Ho = 0.760) [34], Nyssa yunnanensis (He = 0.2431, Ho = 0.2202) [35], Taxus cuspidata (He = 0.2746, Ho = 0.2747) [36], and Tetrastigma hemsleyanum (He = 0.2298, Ho = 0.834) [37], indicated that the genetic level of G. eulophioides, as a rare and endangered plant, was moderate. Therefore, genetic diversity is also not a major endangerment factor for G. eulophioides.
Using the screened population SNP loci, cross-validation was performed, and the valley value of its error rate was 4. That is, 94 individuals from 10 populations were classified into the optimal four categories, among which the GLHJZ population was classified into one category alone, indicating that this population is more independent and less differentiated. The second category has more populations, mainly including seven populations (the LZZJD population, the LZTXQ population, the YJ population, the QLPJ population, the CHBQ population, the WMHT population, and the WMPW population), indicating the existence of gene flow among these seven populations. The LT population and the WHBH population were clustered into the third and fourth categories, respectively.
The evolutionary tree of G. eulophioides samples constructed based on the neighbor-joining algorithm showed that 94 samples were divided into three major classes and two subclasses, among which the samples from GLHJZ and LZZJD clustered well without obvious genetic differentiation. The phylogenetic trees of LZTXQ and QLPJ crossed each other, and the genes were more closely exchanged between the two populations. The phylogenetic trees of two populations, LZTXQ and QLPJ, crossed each other and exchanged genes more closely. Four populations, CHBQ, WMHT, YJ, and WMPW, had penetration in all branches and showed greater genetic differentiation. From the perspective of geomorphology, the populations in the karst landscape were more closely related to each other, and the populations in the normal landscape were also more closely related to each other. However, the populations in the two landscapes were more distantly related, and the genetic differentiation of the populations in the normal landscape was higher than that of the populations in the karst landscape. Therefore, it was hypothesized that the geographic isolation of the populations between the two landscapes occurred due to the difference in geomorphology, which led to less gene exchange. The PCA explained a total of 11.74% of the genetic variation in G. eulophioides, and its clustering results were generally consistent with the classification results of phylogenetic numbers.
In the present study, the invisible genetic basis of local adaptation was revealed by association studies. We found that serine/threonine-protein kinase and RNA-directed DNA polymerase genes are putative genes for adaptation to altitude. RNA-directed DNA polymerase is involved in the transcription and translation of nucleic acids and other functions, and utilizes ATP as a phosphate donor. In addition, serine/threonine-protein kinase is a protein kinase that catalyzes the phosphorylation of serine or threonine residues on the target protein. It plays an important role in the growth and development of plants [38]. Therefore, based on the functions of the serine/threonine protein kinase and RNA-directed DNA polymerase genes, we inferred that changes in altitude would result in different plant growth. The ribonuclease H protein gene is a putative gene of annual rainfall that catalyzes and regulates enzyme activity. Pentatricopeptide repeat-containing protein and F-box/LRR-repeat protein are putative genes of annual average temperature. The pentatricopeptide repeat-containing protein is an important family of proteins discovered in recent years [39] and is mainly involved in regulating organelle RNA processing, including biological processes such as RNA editing, splicing, and stability. There are few reports of F-box/LRR-repeat proteins in plants, and further studies are needed. Therefore, we hypothesize that changes in temperature may cause pentatricopeptide repeat-containing proteins to regulate organelle responses.

5. Conclusions

In this study, we analyzed the genetic diversity of ten populations of G. eulophioides. The SLAF-seq technique was used to construct the SLAF-seq database of G. eulophioides. The genetic diversity of the 10 natural populations of G. eulophioides was low (PIC = 0.1874~0.2156). However, significant genetic differentiation was also found among the different germplasms, mainly caused by geographical isolation. The level of genetic differentiation was low, and the population structure was complex (K = 4). An association analysis of genetic markers with environmental variables was performed to identify relevant SNP markers. Potential putative genes for the associated markers were detected via BLAST searching. A total of five annotatable genes were identified, and they were associated with functions such as phosphorylation and signal transduction. In summary, this study provides further insight into the genetic structure of G. eulophioides and provides a reference for future genetic breeding efforts.

Author Contributions

Conceptualization, Z.L. and M.A.; methodology, Z.L. and Z.R.; software, Z.R. and X.X.; validation, Z.L., Z.R. and M.A.; investigation, Y.Z. and X.X., resources, M.A.; data curation, Z.R.; writing—original draft preparation, Z.L. and Z.R.; writing—review and editing, Z.L., Z.R. and M.A.; visualization, Z.L.; supervision, Z.L. and M.A.; project administration, M.A.; funding acquisition, M.A. and Z.L. All authors have read and agreed to the published version of the manuscript.

Funding

This work has been supported by the National Natural Science Foundation of China (31960042), Survey and Evaluation of New National Key Protected Wild Plants Resources in Guizhou Province (Phase I) (MCHC-ZC20222009) and Guizhou Provincial Basic Research Program (Natural Science) 2022 (072).

Institutional Review Board Statement

Not applicable.

Data Availability Statement

Raw data are available in SRA under BioProject PRJNA1003097.

Conflicts of Interest

The authors declare that they have no known competing financial interest or personal relationships that could have appeared to influence the work reported in this paper.

References

  1. Wang, S.; Xie, Y. China Species Red List; Higher Education Press: Beijing, China, 2004; pp. 1–444. [Google Scholar]
  2. Chen, X.Q.; Liu, Z.J.; Zhu, G.H.; Lang, K.Y.; Ji, Z.H.; Luo, Y.B.; Jin, X.H.; Cribb, P.J.; Wood, J.J.; Gale, S.; et al. Flora of China; Wu, C.Y., Raven, P.H., Hong, D.Y., Eds.; Science Press: Beijing, China, 2009; pp. 1–506. [Google Scholar]
  3. Feng, C.L.; Cai, S.H.; Den, Z.H. Endangered causes and conservation strategies of Geodorum eulophioides in Yachang Forest region. For. Guangxi 2012, 9, 43–44. [Google Scholar]
  4. Zhang, Y.; Li, Z.; An, M.T.; Li, X.F.; Wang, W. Niche characteristics and interspecific relationship of the community of wild plant Geodorum eulophioides with extremely small population. J. Plant Resour. Environ. 2022, 31, 1–10. [Google Scholar]
  5. Wei, H.Y.; Li, X.F.; An, M.T.; Yang, Y.B.; Zhang, D.K. Analysis of Resource Status and Endangered Causes of the Extremely Endangered Plant Geodorum eulophioides in Guizhou Province. J. Mt. Agric. Biol. 2018, 37, 44–48. [Google Scholar]
  6. Luo, Y.T.; Luo, X.Y.; Lan, Y.T.; Liu, S.Y.; Xin, R.S.; Huang, L.; Wei, X.L. Study on tissue culture technology of Geodorum eulophioides Schltr. Chin. Hortic. Abstr. 2012, 28, 40–41+72. [Google Scholar]
  7. Lan, Y.T.; Wei, X.L.; Huang, L.; Luo, Y.T.; Xin, R.S.; Zhang, Z.B. Study on Technology of Aseptic Sowing and Proliferation of Protocorms in Wild Geodorum eulophioides. J. Anhui Agric. Sci. 2014, 42, 395–397, 418. [Google Scholar]
  8. Leffler, E.M.; Bullaughey, K.; Matute, D.R.; Meyer, W.K.; Ségurel, L.; Venkat, A.; Andolfatto, P.; Przeworski, M. Revisiting an old riddle: What determines genetic diversity levels within species? PLoS Biol. 2012, 10, e1001388. [Google Scholar] [CrossRef] [PubMed]
  9. Paetzold, C.; Wood, K.R.; Eaton, D.A.; Wagner, W.L.; Appelhans, M.S. Phylogeny of Hawaiian Melicope (Rutaceae): RAD-seq resolves species relationships and reveals ancient introgression. Front. Plant Sci. 2019, 10, 1074. [Google Scholar] [CrossRef] [PubMed]
  10. Gong, D.P.; Huang, L.; Xu, X.H.; Wang, C.Y.; Ren, M.; Wang, C.K.; Chen, M.L. Construction of a high-density SNP genetic map in flue-cured tobacco based on SLAF-seq. Mol. Breed. 2016, 36, 1–12. [Google Scholar] [CrossRef]
  11. Dang, Z.H.; Li, J.B.; Liu, Y.N.; Song, M.M.; Lockhart, P.J.; Tian, Y.Y.; Niu, M.M.; Wang, Q.L. RADseq-based population genomic analysis and environmental adaptation of rare and endangered recretohalophyte Reaumuria trigyna. Plant Genome, 2023; Early View. [Google Scholar] [CrossRef] [PubMed]
  12. Ana, O.; Pablo, V.; Mario, F.M.; Pedro, J.M.; Virginia, V.; Irene, V.M.; Andrew, L.H. A snapshot of progenitor–derivative speciation in Iberodes (Boraginaceae). Mol. Ecol. 2022, 31, 3192–3209. [Google Scholar]
  13. Sun, X.W.; Liu, D.Y.; Zhang, X.F.; Li, W.B.; Liu, H.; Hong, W.G.; Liu, H.; Hong, W.G.; Jiang, C.B.; Guan, N.; et al. SLAF-seq: An efficient method of large-scale de novo SNP discovery and genotyping using high-throughput sequencing. PLoS ONE 2013, 8, e58700. [Google Scholar] [CrossRef]
  14. Doyle, J.J.; Doyle, J.L. A rapid DNA isolation procedure for small quantities of fresh leaf tissue. Phytochem. Bull. 1987, 19, 11–15. [Google Scholar]
  15. Kozich, J.J.; Westcott, S.L.; Baxter, N.T.; Highlander, S.K.; Schloss, P.D. Development of a dual-index sequencing strategy and curation pipeline for analyzing amplicon sequence data on the MiSeqIllumina sequencing platform. Appl. Environ. Microbiol. 2013, 79, 5112–5120. [Google Scholar] [CrossRef]
  16. Xia, A.N.; Yang, A.A.; Meng, X.S.; Dong, G.Z.; Tang, X.J.; Lei, S.M.; Liu, Y.G. Development and application of rose (Rosa chinensis Jacq.) SNP markers based on SLAF-seq technology. Genet. Resour. Crop Evol. 2022, 69, 173–182. [Google Scholar] [CrossRef]
  17. Kent, W.J. BLAT—The BLAST-like alignment tool. Genome Res. 2002, 12, 656–664. [Google Scholar] [PubMed]
  18. Li, H.; Handsaker, B.; Wysoker, A.; Fennell, T.; Ruan, J.; Homer, N.; Marth, G.; Abecasis, G.; Durbin, R. The sequence alignment/map format and SAMtools. Bioinformatics 2009, 25, 2078–2079. [Google Scholar] [CrossRef]
  19. McKenna, A.; Hanna, M.; Banks, E.; Sivachenko, A.; Cibulskis, K.; Kernytsky, A.; Garimella, K.; Altshuler, D.; Gabriel, S.; Daly, M.; et al. The Genome Analysis Toolkit: A MapReduce framework for analyzing next-generation DNA sequencing data. Genome Res. 2010, 20, 1297–1303. [Google Scholar] [CrossRef]
  20. Lee, T.H.; Guo, H.; Wang, X.Y.; Kim, C.; Paterson, A.H. SNPhylo: A pipeline to construct a phylogenetic tree from huge SNP data. BMC Genom. 2014, 15, 162. [Google Scholar] [CrossRef]
  21. Yeh, F.C.; Yang, R.C.; Boyle, T. POPGENE version 1.31. In Microsoft Window-Based Freeware for Population Genetic Analysis; University of Alberta: Edmonton, AB, Canada, 1999. [Google Scholar]
  22. Excoffier, L.; Laval, G.; Schneider, S. Arlequin (version 3.0): An integrated software package for population genetics data analysis. Evol. Bioinform. 2005, 1, 47–50. [Google Scholar] [CrossRef]
  23. Alexander, D.H.; Novembre, J.; Lange, K. Fast model-based estimation of ancestry in unrelated individuals. Genome Res. 2009, 19, 1655–1664. [Google Scholar] [CrossRef]
  24. Price, A.L.; Patterson, N.J.; Plenge, R.M.; Weinblatt, M.E.; Shadick, N.A.; Reich, D. Principal components analysis corrects for stratification in genome-wide association studies. Nat. Genet. 2006, 38, 904–909. [Google Scholar] [CrossRef] [PubMed]
  25. Coop, G.; Witonsky, D.; Di, R.A.; Pritchard, J.K. Using environmental correlations to identify lociunderlying local adaptation. Genetics 2010, 185, 1411–1423. [Google Scholar] [CrossRef]
  26. Günther, T.; Coop, G. Robust identification of local adaptation from allele frequencies. Genetics 2013, 195, 205–220. [Google Scholar] [CrossRef]
  27. Frichot, E.; Schoville, S.D.; Bouchard, G.; François, O. Testing for associations between loci and environmental gradients using latent factor mixed models. Mol. Biol. Evol. 2013, 30, 1687–1699. [Google Scholar] [CrossRef] [PubMed]
  28. Li, B.; Tian, L.; Zhang, J.; Huang, L.; Han, F.X.; Yan, S.R.; Wang, L.Z.; Zheng, H.K.; Sun, J.M. Construction of a high-density genetic map based on large-scale markers developed by specific length amplified fragment sequencing (SLAF-seq) and its application to QTL analysis for isoflavone content in Glycine max. BMC Genom. 2014, 15, 1086. [Google Scholar] [CrossRef]
  29. Luo, C.; Shu, B.; Yao, Q.; Wu, H.; Xu, W.; Wang, S. Construction of a High-Density Genetic Map Based on Large-Scale Marker Development in Mango Using Specific-Locus Amplified Fragment Sequencing (SLAF-seq). Front. Plant Sci. 2016, 7, 1310. [Google Scholar] [CrossRef]
  30. Ying, T. Studies on Conservation Genetic of Geodorum eulophiodes; Nanjing University: Nanjing, China, 2016; pp. 41–52. [Google Scholar]
  31. Zhou, H.J. Genetic Diversity and Population Structure of Natural Endangered Forest Tree Pinus bungeana in China; Northwest University: Xi’an, China, 2013; pp. 35–63. [Google Scholar]
  32. Tian, Q.; Liu, S.W.; Niu, S.H.; Li, W. Development of SNP molecular markers of Pinus bungeana based on SLAF-seq technology. J. Beijing For. Univ. 2021, 43, 1–8. [Google Scholar]
  33. He, X.D.; Zheng, J.W.; Jiao, Z.Y.; Dou, Q.Q.; Huang, L.B. Genetic diversity and structure analyses of Quercus shumardii populations based on SLAF-seq technology. J. Nanjing For. Univ. 2022, 46, 81–87. [Google Scholar]
  34. Lu, Y.Z. Ecological Adaptability and Endangered Mechanism of Paeonia ludlowii; Tibet University: Lhasa, China, 2021. [Google Scholar]
  35. Zhang, S.S.; Kang, H.M.; Yang, W.Z. Population Genetic Analysis of Nyssa yunnanensis by Reduced-representation Sequencing Technique. Bull. Bot. Res. 2019, 39, 899–907. [Google Scholar]
  36. Ma, Y.T. Variation and Genetic Diversity in Cultivation of Taxus cuspidate; Changchun University: Changchun, China, 2021. [Google Scholar]
  37. Li, M.Y. Population Genetics and Landscape Genomics of the Rare and Endangered Plant Tetrastigma hemsleyanum Based on SLAF-seq Technique; Henan Agricultural University: Zhengzhou, China, 2021. [Google Scholar]
  38. Boekema, E.J.; Ubbink-Kok, T.; Lolkema, J.S.; Brisson, A.; Konings, W.N. Visualization of a peripheral stalk in V-type ATPase: Evidence for the stator structure essential to rotational catalysis. Proc. Natl. Acad. Sci. USA 1997, 94, 14291–14293. [Google Scholar] [CrossRef]
  39. Xiao, H.J.; Zhang, Q.N.; Qin, X.J.; Xu, Y.H.; Ni, C.; Huang, J.; Zhu, L.; Zhong, F.; Liu, W.; Yao, G.; et al. Rice PPS1 encodes a DYW motif-containing pentatricopeptide repeat protein required for five consecutive RNA-editing sites of nad3 in mitochondria. New Phytol. 2018, 220, 878–892. [Google Scholar] [CrossRef] [PubMed]
Figure 1. Distribution of ten populations of G. eulophioides analyzed in the present study (A); flowers with rose color (B); a plant in the wild (C).
Diversity 15 00990 g001
Figure 2. Population structure analysis of the 94 studied G. eulophioides accessions using ADMIXTURE. (A) Admixture graph showing the individual cluster values corresponding to each K value. The bars on the x-axis indicate different samples. The y-axis quantifies the membership probability of samples belonging to different groups. Colors in each row represent structural components. (B) Admixture estimation of the number of groups for K values ranging from 1 to 10.
Diversity 15 00990 g002
Figure 3. PCA plots of 94 accessions based on the analysis of 76,340 SNPs. PC1 represents the first principal component, PC2 represents the second principal component; PC3 represents the third principal component. A dot represents a sample and a color represents a subgroup. (A) Two-dimensional coordinates of PC1 and PC2; (B) two-dimensional coordinates of PC2 and PC3; (C) two-dimensional coordinate diagram of PC1 and PC3; (D) 3D coordinate diagram of PC1, PC2 and PC3.
Diversity 15 00990 g003
Figure 4. Phylogenetic tree generated from 94 G. eulophioides samples and based on the analysis of 76,340 SNPs. Based on genetic relationships, the 94 individuals were divided into three clades, A, B, and C, with C divided into two smaller clades, II-1 and II-2.
Diversity 15 00990 g004
Table 1. Sampling of G. eulophioides populations and climatic information.
PopulationLocationGeographical
Coordinates
Sample SizeAnnual Average
Temperature (°C)
Altitude (m)Annual Rainfall (cm)
WHBHBiaoxing Village, Wangmo County25°08′ N, 106°25′ E818.214671198
CHBQBanqi Village, Ceheng County24°81′ N, 105°65′ E1017.815081224
GLHJZHanjiazhai Village, Guangling County25°65′ N, 105°69′ E1119.568011296
WMHTHeting Village, Wangmo County25°11′ N, 106°44′ E917.335171264
LTLoutuo Village, Loudian County25°23′ N, 106°67′ E917.844111189
QLPJPangjiangVillage, Qinglong County25°88′ N,105°38′ E1019.965581186
WMPWPingwangVillage, Wangmo County25°03′ N, 106°23′ E918.425641206
LZTXQTianxingjiao Village, Liuzhi County26°04′ N, 105°25′ E1017.397041194
YCYachang Village, Leye County25°08′ N, 109°95′ E1018.234341275
LZZJDZhongjiaodi Village, Liuzhi County25°99′ N, 105°23′ E817.869281253
Table 2. Summary of specific locus amplified fragment sequencing (SLAF-seq).
No. of ReadsGC Content (%)Q30 (%)No. of SLAFNo. of Depth
Sum222,537,168 1,625,234
Avg.2,367,41735.5591.94146,03513.29
Table 3. SLAF tag and SNP tag table among G. eulophioides non-cohabitation groups.
PopulationQ30 (%)GC Content (%)No. of
SLAFs
Sequencing DepthNo. of SNPsIntegrity of
SNPs (%)
Heterozygosity of SNPs (%)
CHBQ91.8435.39113,817.2211.69515,665.5231.607.06
GLHJZ92.8335.47140,689.6112.50663,474.2640.668.11
LT91.6935.09146,362.4512.56668,646.0840.989.52
LZLJD92.4435.33157,542.1412.90792,674.1148.5910.54
LZTXQ92.0336.26180,194.0418.97850,901.1952.1612.17
QLPJ92.5136.08159,014.4213.14779,839.4447.8010.86
WHBH91.0935.18143,828.2510.72705,106.0543.229.83
WMHT91.5735.53141,522.2211.97660,860.3240.509.44
WMPW91.1835.03133,174.3414.08659,608.6140.439.10
YC91.8835.95144,901.6713.72694,010.2542.548.29
Table 4. Analysis of genetic diversity among G. eulophioides non-cohabiting populations.
PopulationNaNeHeHHoPICIFIS
LZTXQ1.80921.44690.26700.28170.31690.21560.40500.0365
YC1.83421.43890.26550.28170.24640.21560.40590.2154
QLPJ1.81791.43760.26350.27850.29100.21350.40180.2658
WMHT1.83191.43280.26320.28100.24850.21410.40330.0525
WMPW1.81721.42460.25840.27570.24110.21030.3960−0.1532
CHBQ1.75691.40230.24360.26120.20740.19780.37200.1745
GLHJZ1.74931.39760.23880.25170.22860.19340.36420.2463
WHBH1.71351.40540.23850.25640.26780.19160.36010.1746
LZLJD1.67961.40690.23830.25520.29360.19090.35710.1952
LT1.68721.39970.23390.24990.25820.18740.3517−0.2376
Average1.76971.41930.25110.26730.26000.20300.38170.0970
Na, observed allele number; Ne, expected allele number; He, expected heterozygous number; H, Nei’s diversity index; Ho, observed heterozygous number; PIC, polymorphism information content; I, Shannon-Wiener index; FIS, interindividual fixation index.
Table 5. Pairwise fixation index (Fst) values among ten populations of G. eulophioides.
LZTXQYCQLPJWMHTWMPWCHBQGLHJZWHBHLZLJD
YC0.2651
QLPJ0.15260.2152
WMHT0.24920.11230.0953
WMPW0.31440.14820.23640.1462
CHBQ0.26520.17220.11140.17290.1867
GLHJZ0.19530.16540.14610.16830.15620.0526
WHBH0.21550.11490.19270.08650.07780.17610.1712
LZLJD0.22380.14260.23610.29750.15540.06650.09580.0861
LT0.14460.06520.09210.13420.05310.14620.04820.07550.0864
Table 6. Analysis of molecular variance (AMOVA) of the ten G. eulophioides provenances.
Source of VariationdfSum of SquaresVariance ComponentsPercentage of Variation (%)
Among Populations842,856.51185.224121.35
Between Individuals263324,657.2682.154678.65
total271367,513.71867.3787100
Table 7. A summary of putative adaptive markers displaying associations with different climate variables identified by Bayenv2 analysis.
SNP IDPositionlog10 (BF)qvalAltitudeAnnual RainfallAnnual Average Temperature
Marker14689891.98690.0043*
Marker159911110.90440.0399*
Marker216842000.85870.0436*
Marker11786292.33520.0020*
Marker459702581.01760.0340*
Marker254492341.93800.0047*
Marker274291071.57690.0095*
Marker114181151.45870.0107*
Marker201542281.81690.0156*
Marker420841611.15500.0236*
Marker224742102.13940.0029*
Marker228862551.88030.0055*
Marker35950831.16500.0233*
Marker261821761.98690.0043*
Marker859041731.36670.0145*
Marker30072281.18880.0225 *
Marker17375232.74390.0009 *
Marker393711093.69880.0001 *
Marker366942721.67930.0096 *
Marker429491881.64090.0075 *
Marker181061111.10370.0282 *
Marker484941141.20890.0216 *
Marker266612371.66140.0154 *
Marker15596531.10880.0274 *
Marker20664931.35590.0152 *
Marker402851891.63860.0083 *
Marker25639681.18720.0227 *
Marker291162501.10750.0277 *
Marker60774750.96880.0356 *
Marker134042122.92020.0005 *
* suggests that the SNP showed an association with that specific climate variable.
Table 8. A summary of putative adaptive markers displaying associations with different climate variables identified by LFMM analysis.
SNP IDPositionZ Scoreslog10 (BF)p-ValueAltitudeAnnual RainfallAnnual Average Temperature
Marker28741794.05274.01030.0004*
Marker201041063.85843.67990.0002*
Marker306801804.38374.53110.0001*
Marker21319813.46183.09020.0008*
Marker17092843.39382.99510.0011*
Marker2725076−3.76373.53320.0003 *
Marker210052193.40043.00310.0012 *
Marker150711263.36272.95040.0011 *
Marker134761073.44143.06240.0009 *
Marker22058794.11524.09120.0001 *
Marker39147174−3.52123.18310.0008 *
Marker172222393.84793.66130.0002 *
Marker9179534−3.59823.28940.0005 *
Marker60868484.48264.69280.0001 *
Marker179011183.57193.24930.0005 *
Marker324681203.79263.57710.0002 *
Marker12583903.32242.89380.0013 *
Marker156702253.49423.13820.0007 *
* suggests that the SNP showed an association with that specific climate variable.
Table 9. Identification of putative candidate genes of the associated SNP markers.
VariablesMarker IDPositionPutative GenesOrigin
AltitudeMarker20104
Marker21684
106
200
serine/threonine-protein kinase
RNA-directed DNA polymerase
Brassica rapa
Malus domestica
Annual rainfallMarker39371109ribonuclease H proteinPhoenix dactylifera
Annual average temperatureMarker60868
Marker15670
48
225
pentatricopeptide repeat-containing proteinNelumbo nucifera
F-box/LRR-repeat proteinTriticum urartu
Disclaimer/Publisher’s Note: The statements, opinions and data contained in all publications are solely those of the individual author(s) and contributor(s) and not of MDPI and/or the editor(s). MDPI and/or the editor(s) disclaim responsibility for any injury to people or property resulting from any ideas, methods, instructions or products referred to in the content.

