Article

Divergence of Seed Mass in Riparian Plant Communities Dominated by Filtering and Random Processes

1
Chongqing Institute of Green Intelligent Technology, Chinese Academy of Sciences, Chongqing 400714, China
2
Chongqing College, University of Chinese Academy of Sciences, Chongqing 400714, China
3
The College of River and Ocean Engineering, Chongqing Jiaotong University, Chongqing 400074, China
*
Author to whom correspondence should be addressed.
Diversity 2023, 15(12), 1164; https://doi.org/10.3390/d15121164
Submission received: 9 October 2023 / Revised: 20 November 2023 / Accepted: 20 November 2023 / Published: 22 November 2023

Abstract

:
Restoration of degraded riparian zones is the primary challenge for ensuring the sustainability of watershed ecosystems. An essential aspect of this endeavor is gaining a deep understanding of how riparian plant communities are assembled. The main focus of this study was to investigate how riparian plant communities respond to varying levels of flooding stress along the Three Gorges Reservoir (TGR) in China’s Yangtze River. To accomplish this, we calculated the diversity of plant taxonomy, traits and phylogeny, and used a null model to reflect the plant community assembly rules within the riparian zones along the TGR. The riparian zones were divided into four regions based on water regime: the fluctuating backwater area, the permanent backwater area, mainstream and tributaries of the TGR, covering the reservoir area of 1084 km2 with 180 sampling sites surveyed. Our results showed that within the permanent backwater area of the tributaries, the gradient variation in taxonomic and trait diversity of the riparian community was strongly aligned with the varying levels of flooding stress, which suggests that strong environmental selection plays a significant role in this section. Furthermore, through analysis of phylogenetic and trait structures based on the null model, we found that environmental filtering and random processes were the primary mechanisms shaping plant communities in the riparian zones across the entire study area. However, by further examining single traits, we found that seed mass was the sole trait displaying noteworthy divergence in the riparian communities throughout the study area. This finding highlights that seed mass appears as a pivotal divergent trait in the herb succession stage of the riparian communities that is strongly governed by filtering and random processes. In conclusion, we recommend prioritizing seed mass differences in ecological restoration efforts for herb succession in flooding-stressed riparian communities. This approach is crucial for enhancing source utilization, facilitating community assembly, and improving overall recovery outcomes.

1. Introduction

Understanding how plant communities are assembled is a central focus within the field of community ecology. Given the ongoing deterioration of riparian ecosystems globally [1], it becomes crucial to grasp the assembly of riparian plant communities and their responses to environmental changes. The critical components characterizing community patterns and serving as crucial parameters for investigating community assembly mechanisms include the structure and composition of species in terms of taxonomy, traits, and phylogeny within the communities [2,3,4].Traditionally, the examination of taxonomic community structure and composition has been the focal point in the study of biodiversity patterns. Consequently, it has been predominantly investigated within the framework of the species-pool concept, delving into the influence of filtering processes on local communities. The primary distinguishing feature in the structure and composition of various communities lies in the differences in taxonomic categories and species numbers. Nevertheless, a more in-depth exploration has uncovered that these filtering processes are primarily influenced by the functional properties of species, directly related to their suitability for a particular habitat [5]. Therefore, research solely concentrating on taxonomic composition has certain limitations when it comes to elucidating the mechanisms behind community assembly. More studies suggest that utilizing species traits and phylogeny can yield more comprehensive insights for analyzing the intricacies of community assembly [6].
Morphological, physiological and ecological traits of plants can serve as indicators of how plants adapt and strategize in response to environmental changes. Variations in traits between species reflect the dynamics of competition, symbiosis and mutual influence among species, as well as the extent of niche differentiation within the community. Thus, these differences have a direct impact on the spatial distribution pattern of species [7]. Species with different traits occupy unique ecological niches within plant communities, a factor that contributes to the maintenance of community stability [8]. Therefore, a strong connection exists between plant traits and the assembly of communities. Assessing the degree of trait aggregation in a community can provide insights into the roles played by environmental filtering and neutral random processes in the assembly of the community.
Additionally, phylogeny serve as a valuable tool for unveiling the mechanisms ruling community assembly and substantiating the significance of phylogenetic evolution in this process [2]. Phylogeny pertains to the genetic relationships among species. The theory of niche conservation [9] posits that, in plant communities, species with close phylogenetic ties often share similar ecological requirements and adaptability, a proposition supported by some research findings [10,11]. Hence, phylogenetic diversity can convey the evolutionary distance and functional distinctions among species in the community [12,13].
The mechanism of community assembly can either be deterministic, where it governs the aggregation and dispersion of traits and phylogeny in a predictable manner, or it can exhibit random characteristics, adding uncertainty to the distribution of these attributes. Thus, the community assembly rules can be better understood by examining the structure and composition of species in terms of traits and phylogeny.
According to Gause’s competitive exclusion principle, coexisting species tend to share similar resource utilization patterns to maximize competition [14]. The principle of limiting similarity further underscores that resource utilization affects the species composition within a community. The differentiation of species traits can reduce the intensity of competition between them, facilitating coexistence [15].
When closely related species aggregate more than expected by the null model, it reflects phylogenetic aggregation, possibly resulting from environmental selection favoring closely related species with conserved traits. Conversely, if the genetic relationship among species is smaller than expected, indicating phylogenetic divergence, it may result from excessive differentiation in conservative traits driven by competition [16,17]. When the species relationship aligns with the expected values, indicating a random phylogenetic structure, neutral random effects are driving the community assembly.
Similarly, traits can be examined to construct a structure similar to phylogeny, and the degree of aggregation and dispersion of traits within the community can be quantified. If the dispersion of traits exceeds the null model aggregation, it signifies coexistence of species with similar functional traits, indicating that environmental filtering drives community assembly. Conversely, if the dispersion of traits is more divergent than the null model, it suggests convergent trait evolution, with similarity constraints influencing community assembly. When the degree of trait dispersion aligns with the null model, it indicates that neutral random effects are the driving force behind community assembly [18].
While numerous studies have investigated the mechanism ruling the assembly of the local community, assembly rules of the local community remain a central focus in the field of community ecology, particularly in the context of changing environmental conditions. Advances in statistics and ecological theory have enabled us to employ traits and community phylogenetic structure as tools to investigate how community assembly responds to environmental change. This is achieved by examining the distribution pattern of traits and the phylogenetic distance of coexisting species in comparison to environmental gradients [19]. However, it is important to acknowledge that within a community, various assembly rules such as the random assembly process, filtering-based trait convergent process and trait dispersion process may simultaneously influence community assembly [20,21]. Regrettably, taxonomy-based studies alone are insufficient for unraveling these different assembly processes. This necessitates a deeper exploration of single traits within the community. Yet, it remains unclear which specific traits correspond to particular assembly processes.
Therefore, the impetus for this study was to elucidate how species taxonomic, phylogenetic, and trait diversity in riparian plant communities, along with community assembly processes, respond to variations in flooding gradients within the riparian communities of the Three Gorges Reservoir. The Three Gorges Reservoir represents one of China’s largest engineering endeavors, and its riparian zone, which experiences periodic water level fluctuations, stands out as an exceptionally unique and delicate habitat within the reservoir ecosystem.
Previously, studies in the plant community research area of the riparian zone within the Three Gorges Reservoir have predominantly focused on specific river sections in certain regions. This research primarily entailed analyzing plant species composition, diversity, and distribution patterns along altitude gradients [22]. However, there has been limited exploration of the riparian communities in both the mainstream and tributaries of the reservoir basin. Moreover, there is a dearth of research examining assembly of plant communities in the riparian zones with a focus on a particular trait or species at the current succession stage. A comprehensive understanding of the plant community assembly rules during the herbaceous stage is essential and provides a valuable foundation for subsequent research on succession in the water level fluctuation zone of the reservoir area.
Building upon the aforementioned context, we formulated the following three research questions: (1) How does species taxonomic, phylogenetic and trait diversity within riparian plant communities change along the flooding gradient in the water level fluctuation zone of the Three Gorges Reservoir Area? (2) Is there a distinction in how plant community assembly in riparian zones responds to flooding gradients between the upstream and downstream regions, as well as the primary tributaries of the Three Gorges Reservoir area? (3) How does a single trait exhibit the aggregation and dispersion along with plant community assembly in riparian zones?
In this study, we scrutinized the response of plant community assembly to flooding gradients within the riparian zone of the Three Gorges Reservoir area through the lens of three dimensions of plant diversity: taxonomy, traits, and phylogeny. These investigations can provide crucial parameters for forecasting and studying subsequent succession in the water level fluctuation zone of the Three Gorges Reservoir area. Additionally, they will contribute to a more comprehensive analysis of the spatial distribution of plant diversity and the mechanisms underlying diversity formation within the water level fluctuation zone. Ultimately, this research offers a scientific foundation for the preservation and management of plant diversity within the water level fluctuation zone of the Three Gorges Reservoir.

2. Materials and Methods

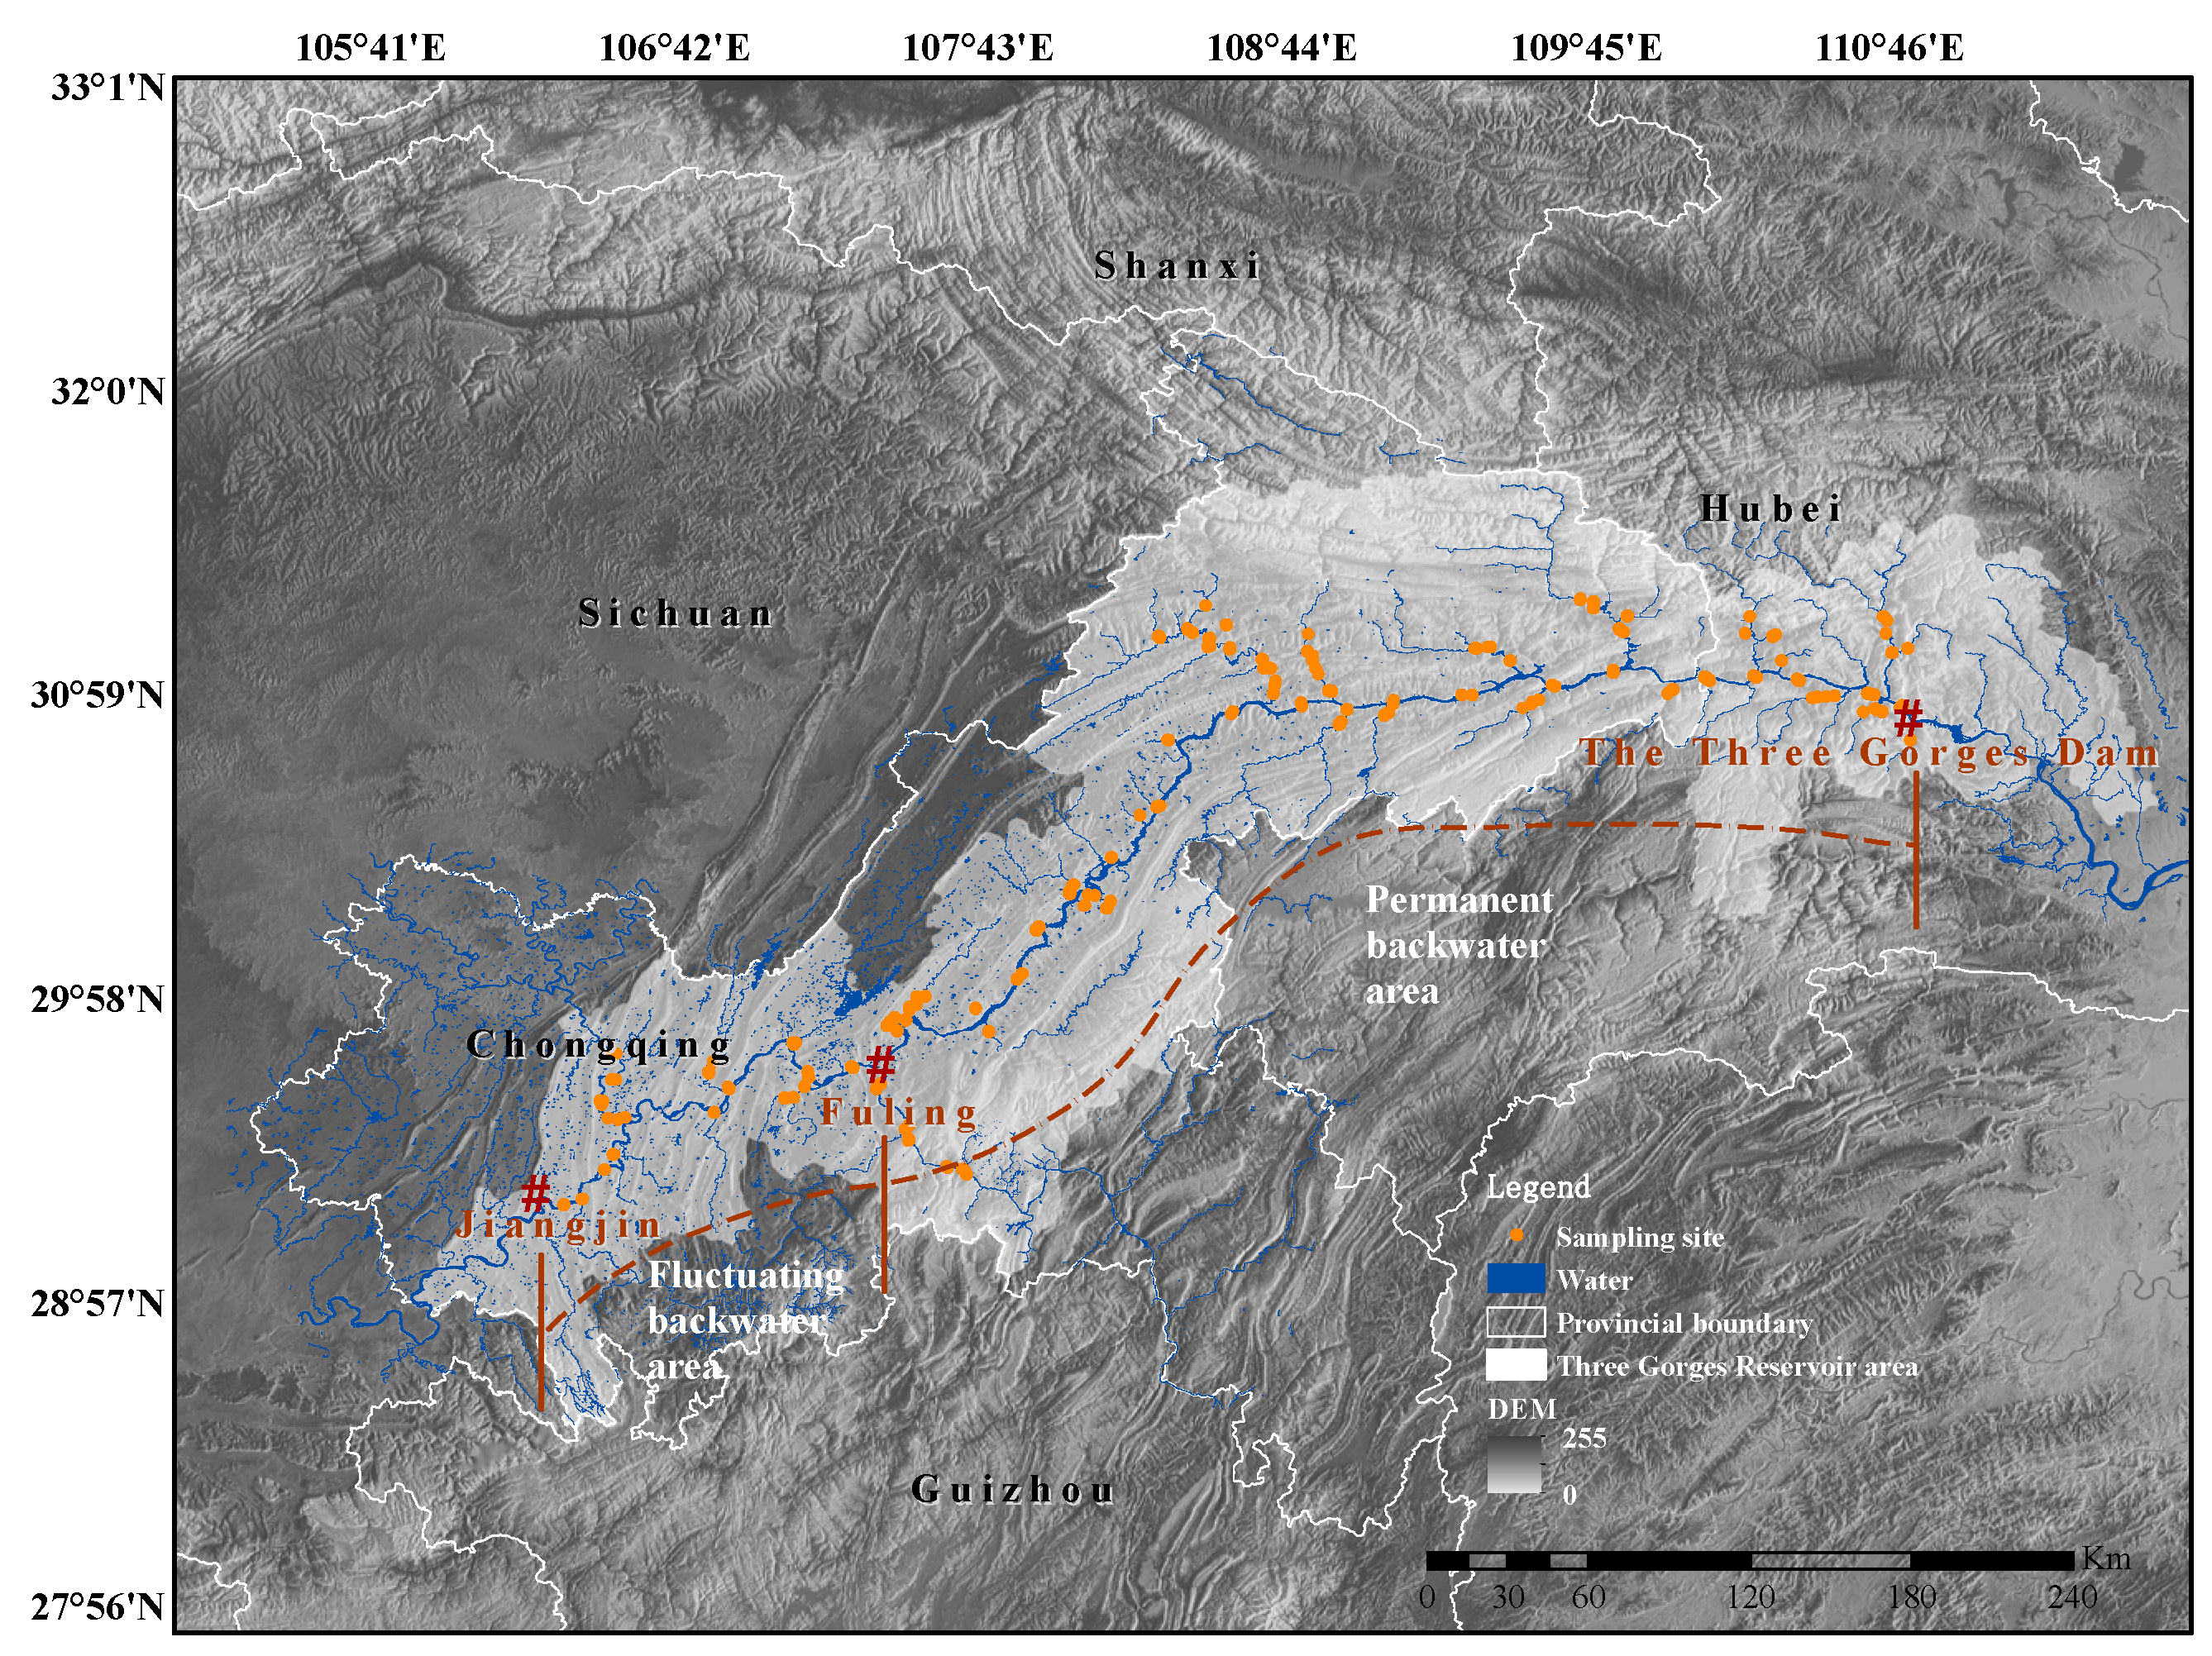
2.1. Area Description

The Three Gorges Reservoir Area of the Yangtze River, situated between 28°54’ N to 30°37’ N latitude and 105°53’ E to 111°39’ E longitude, spans across both the Chongqing and Hubei provinces. This region falls within the subtropical semi-humid monsoon climate zone and is characterized by a river valley climate. Summers are typically hot, with average annual temperature ranging between 17 to 19 °C, and annual precipitation averaging between 1000 and 1200 mm. However, the distribution of precipitation is not uniform, with approximately 80% of the annual rainfall occurring between April and October [23].
Since the start of formal operation of the Three Gorges Reservoir, the annual water level regulation has led to fluctuations in water levels in the area in front of the dam, ranging from 145 m to 175 m [24]. The riparian zone with water level fluctuation in the Three Gorges Reservoir area of the Yangtze River is a periodically flooded area that forms on both sides of the river channel due to controlled variations in water levels. The natural conditions along the riparian zone are intricate, characterized by varying lithology and geomorphological features. Following the construction of the Three Gorges Reservoir, the vegetation in the original riparian zones experienced rapid degradation. Perennial shrubs and trees were eliminated, leading to a simplification of the community composition, with a noticeable prevalence of single genera and species. During periods of low water levels, extensive bare land areas emerged, initiating the process of secondary succession. From the initial water storage phase to the present, this succession has progressed to the herb stage. The predominant vegetation now consists of one-year-old herb-based grass types, with a limited presence of shrub vegetation [25]. Furthermore, the operation of the dam has resulted in the creation of two backwater areas along the reservoir area due to varying hydrological patterns, which may influence the composition of the plant community in the riparian zone [26].

2.2. Survey

The filed survey took place during 2021 and 2022. At the cross section of the riparian zone, there are three distinct elevation ranges: the section between 145 and 155 m is frequently submerged, the section between 155 and 165 m experiences approximately i6 months of inundation and 6 months of exposure, and the section between 165 and 175 m is often exposed. Consequently, based on these fluctuations in water level, the riparian zone was categorized into three sample zones: 145 to 155 m denoted as the regular water-flooded zone (Zone A); 155 to 165 m as the semi-flooded and semi-exposed zone (Zone B); and 165 to 175 m as the regularly exposed zone (Zone C) [24].
A pair of sampling sites were designated on the left and right banks, each pair separated by 20 km. The sampling sites were evenly distributed along the river. Utilizing high-resolution remote sensing images, and considering factors such as vegetation growth and accessibility, a total of 90 pairs with 180 sampling points were established along both sides of the Yangtze River within the Three Gorges Reservoir. At each sampling site, two 1 m × 1 m quadrats were established, strategically placed to minimize human interference (Figure 1). In total, 1080 quadrats were set up. All plant species within these quadrats were recorded, with measurements taken for the average height and coverage of each species. Plant species identification was based on Flora of China, and GPS was employed to pinpoint and record the sample locations, along with their respective altitudes.
Based on whether it is influenced by summer floods, the riparian zone can be categorized into two distinct types: fluctuating backwater area and permanent backwater area (Figure 2). The fluctuating backwater area extends from Jiangjin to Fuling, experiencing the impacts of both winter water storage and summer floods, resulting in elevated water levels during both summer and winter seasons. On the other hand, the permanent backwater area extends from Fuling to the dam and is primarily affected by water storage, resulting in water levels that are high in winter and low in summer [26]. When considering the watershed on a larger scale, the primary channel of the mainstream is broader compared to the tributaries, leading to varying hydrological conditions. As a result, based on different geographical locations, the sampling range can be further divided into four regions, MF (the fluctuating backwater area of the mainstream), MP (permanent backwater area of the mainstream), TF (fluctuating backwater areas of the tributaries), and TP (permanent backwater areas of the tributaries).

2.3. Source of Plant Traits Data

In line with the research criteria, we identified seven functional traits pertaining to plant growth, reproduction, and dispersal (Table 1). The categorization of plant life form adheres to Raunkiaer’s life form classification system, while the classification of fruit types is derived from Flora of China. For the classification of seed dispersal methods, we referred to “Principles of Dispersal in Higher Plants” authored by van der Pijl [28], and for the classification of pollination methods and breeding strategies, we relied on Fukami’s criteria [29].
The plant height data were collected during on-site sample surveys, while information on life forms and fruit types were sourced from the Flora of China and the TRY database “https://www.try-db.org/TryWeb/Home.php (accessed on 21 May 2023)”. Seed mass data were acquired from The Seed Information Database “https://ser-sid.org/ (accessed on 21 May 2023)”. The categorization of seed dispersal method, pollination method and reproduction strategy was based on data from The Seed Information Database and relevant literature sources [29], with a significant portion of ant plant data stemming from the statistics provided by Lengyel et al. [30].

2.4. Methods

2.4.1. Taxonomic, Phylogenetic, and Trait Diversity

The Shannon–Wiener diversity index H was used to represent the taxon-based taxonomic diversity of the community. The calculation formula is:
H = i = 1 s N i · ln N i ,
In the formula, S is the number of taxonomic species, and Ni is the contribution rate of species i in the community (relative coverage).
The phylogenetic tree was generated according to the plant species list obtained from the survey (Figure 3), and the Faith phylogenetic diversity index (PD) was used to represent the phylogenetic diversity of the community. PD is the sum of the branch lengths of the phylogenetic trees constructed by all species in the community [12]. The calculation formula is:
P D = j J I i j × D ( J )
J is the phylogenetic tree of the community i, Iij indicates if community i has any species that descend from node j, and Dj(J) indicates the distance of the branch to node j in the tree J.
The diversity of species trait values in the community, that is, trait diversity, is expressed by trait richness (TRic), The calculation formula is:
TRic = S c i R c ,
Sci is the niche space occupied by species in community i; Rc is the absolute value range of characteristic c [31].
The calculation of the above indicators was based on the vegan, pez and FD packages in R 4.1.0 [32,33,34], and the construction of the phylogenetic tree was based on the V.PhyloMaker2 package in R 4.1.0 [35].

2.4.2. Null Model

The standardized effect sizes (SES) of species phylogenetic diversity and trait-based diversity were calculated by standardizing the observed values and the random values calculated based on the null model. The formula is:
S E S = O b s .   ×   M e a n . n u l l S D . n u l l ,
Obs. is the observed value, Mean.null is the average of the random values simulated by the randomly generated 999 null model, and SD is the standard deviation of the 999 random values. When SES > 0, the observed value is higher than the random value, indicating that the phylogenetic diversity or trait diversity of the species in the community is divergent; when SES < 0, the observed value is lower than the random value, indicating that the phylogenetic diversity or trait diversity of the species in the community is aggregated; when SES = 0, the observed value is equal to the random value, indicating that the phylogenetic diversity or trait diversity structure of species in the community is affected by neutral random effects.
The null model and SES were calculated by the picante and fundiv [36,37] package in R 4.1.0.

2.4.3. Data Analysis

We used the Wilcoxon rank sum test to compare the taxonomic, phylogenetic, and trait diversity in three zones and different regions and draw the box plots. The analysis and drawing were performed using the ggpubr package in R 4.1.0. And using paired T test for comparing standardized effect sizes and zero for trait and phylogenetic diversity and the diversity of each trait. Spearman correlation coefficient analysis was employed for the correlation assessment between seed mass diversity and both taxonomic and phylogenetic diversity. The paired T test and correlation analyses were conducted using IBM SPSS Statistics 26. Visualization of these results was achieved using ggplot2 in R 4.1.0.

3. Results

3.1. Taxonomic, Phylogenetic and Trait Diversity within the Riparian Plant Communities

In the riparian zones of the Three Gorges Reservoir, the plant community showed a high level of taxon-based taxonomic diversity. Our survey documented a total of 299 plant species, distributed across 64 families and 201 genera. Notably, the Poaceae family stood out as the most abundant, encompassing 35 genera and 47 species, followed by the Asteraceae family, which included 29 genera and 44 species. Remarkably, 50% of the families consisted of a single genus, and approximately 77% of the genera were represented by only one species. The dominant plant category primarily comprised annual herbs. Among these, Cynodon dactylon boasted the highest coverage, accounting for 34.46% of the total coverage, followed by Xanthium strumarium, contributing to 11.03% of the total coverage.
There were no significant differences in species taxonomic, phylogenetic and trait diversity among the riparian plant communities in the fluctuating backwater area of the mainstream and among the three elevation zones denoted as A, B, and C in the permanent backwater area (Figure 4a,c,e). However, in the tributaries, the diversity of plant community traits in Zone C of the permanent backwater area exhibited a significant decrease compared to that in Zone A (Figure 4f). Furthermore, significant variations were observed in the taxonomic diversity of plant communities across Zone A, B and C within the permanent backwater areas of the tributaries. As elevation increased, there was a significant rise in the taxonomic diversity (Figure 4a). Moreover, the phylogenetic diversity of plant communities in Zone C proved to be significantly higher than that in Zone A and B within the permanent backwater areas of the tributaries (Figure 4d).

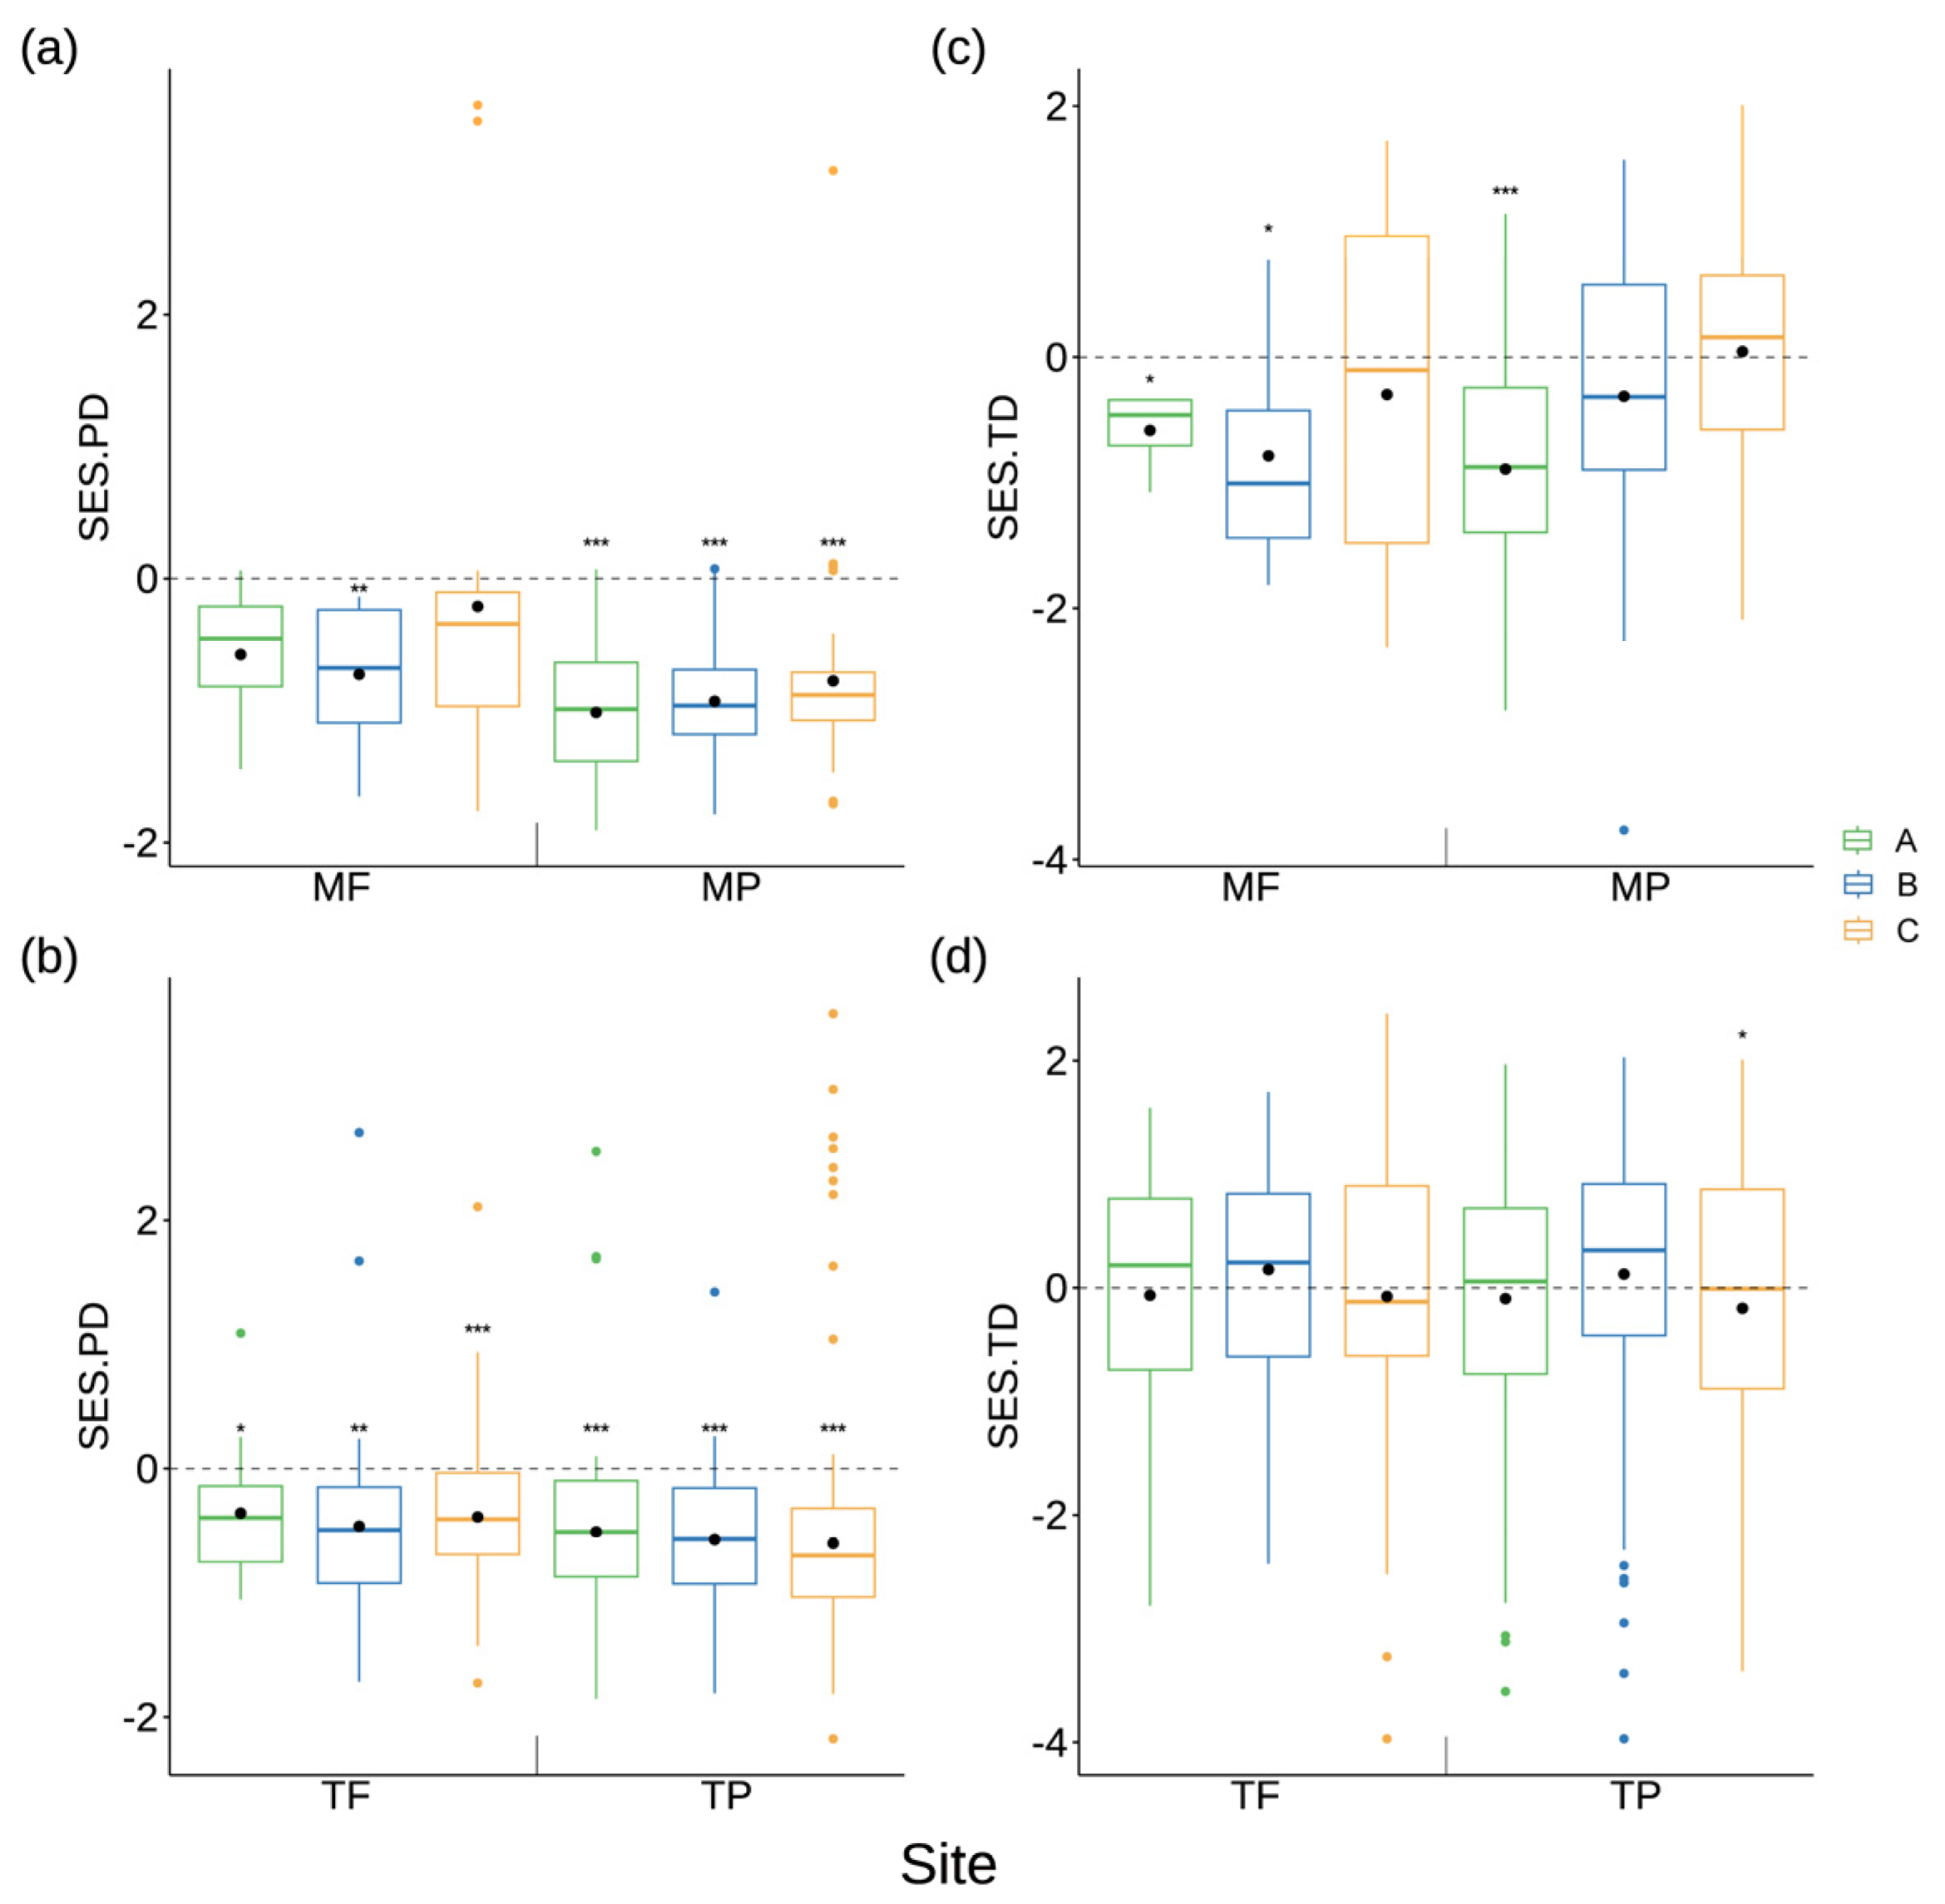
3.2. Response of Plant Community Assembly to Flooding Gradient in Various Geographic Locations Using Phylogeny and Trait Analyses

In general, the observed values of phylogenetic diversity within the riparian plant communities were significantly lower than the random values, whereas there was no consistent significant pattern observed in trait diversity. The riparian zones located in the mainstream and tributaries were subdivided into fluctuating backwater areas and permanent backwater areas based on the differences in water level rhythm. Except for Zone A and Zone C in the fluctuating backwater area of the mainstream, phylogenetic diversity of the riparian plant community exhibited a significant reduction compared to random values. In contrast, trait diversity exhibited a significant reduction compared to the random value in Zone A within the fluctuating backwater area of the mainstream and Zone A within the permanent backwater area of the mainstream (Figure 5).

3.3. Aggregation and Dispersion of Single Plant Trait in Conjunction with the Process of Community Assembly

Plant life form diversity exhibited a significant reduction compared to random values in the plant community in Zone B within the fluctuating backwater area, Zone B within the permanent backwater area, and Zone C within the permanent backwater area of the mainstream (Figure 6a). Moreover, diversity in terms of fruit types was notably lower than random values within the permanent backwater area of the mainstream and the permanent backwater area of the tributaries in Zone B and C (Figure 6b). In contrast, the diversity of pollination methods surpassed random values in Zone B within the permanent backwater area of the mainstream, Zone C within the fluctuating backwater area of the tributaries, and elevation A within the permanent backwater area of the tributaries (Figure 6c).
Seed mass size diversity exhibited a significant increase compared to random values within plant communities in Zones A and B within the fluctuating backwater area of the mainstream (Figure 6d). Conversely, plant height diversity registered a significant decrease compared to random values at elevation B within the fluctuating backwater area of the mainstream and Zones A and B within the permanent backwater area of the mainstream (Figure 6e). The diversity of breeding strategies was only notably lower than random values in Zone A within the permanent backwater area of the mainstream (Figure 6f). Furthermore, the diversity of seed dispersal patterns significantly exceeded random values solely within the permanent backwater area of the mainstream (Figure 6g).

3.4. Associations between Variation in Seed Mass and Diversity of Taxonomy and Phylogeny

As indicated in Table 2, it is evident that a significant positive correlation exists between the seed mass diversity and taxonomic diversity as well as phylogenetic diversity within the riparian plant communities. This positive correlation holds true for most regions, with the exceptions being Zone A and Zone B within the permanent backwater area of the mainstream, where such a correlation was not significant. The ranking of the correlation between taxonomic diversity and seed mass diversity was as follows: Zone A of permanent backwater area of the tributaries > Zone C of fluctuating backwater area of the tributaries > Zone C of fluctuating backwater area of the main stream > Zone B of fluctuating backwater area of the tributaries > Zone B of permanent backwater area of the main stream > Zone A of permanent backwater area of the main stream > Zone C of permanent backwater area of the tributaries > Zone B of permanent backwater area of the tributaries > Zone A of fluctuating backwater area of the tributaries > Zone C of permanent backwater area of the mainstream.
The order of correlation between phylogenetic diversity and seed mass diversity was as follows: Zone A of permanent backwater area of the tributaries > Zone B of permanent backwater area of the tributaries > Zone B of fluctuating backwater area of the tributaries > Zone A of permanent backwater area of the mainstream > C elevation of fluctuating backwater area of the tributaries > Zone B of permanent backwater area of the mainstream > A elevation of fluctuating backwater area of the tributaries > Zone C of permanent backwater area of the tributaries > Zone C of permanent backwater area of the main stream > Zone C of fluctuating backwater area of the mainstream > Zone B of fluctuating backwater area of the mainstream.

4. Discussion

The riparian zone in the reservoir area is currently undergoing a secondary succession process from the initial secondary bare land stage to its current state characterized by herbaceous succession. The dominant plant species in this community primarily belong to annual herbaceous plant families. They swiftly complete their life cycle before flooding disturbances occur, and their populations can rapidly recover through the abundant production of seeds after the flooding subsides. The spatial distribution of species taxonomic, trait variation, and phylogenetic diversity within the community, along with its response to flooding stress, exhibit distinct characteristics associated with the early stages of succession, providing valuable guidance for the restoration of riparian areas along rivers that are regulated by dams.

4.1. Strong Environmental Selection on Taxonomic and Trait Diversity within Riparian Communities in the Permanent Backwater Area of the Tributaries

In the permanent backwater area of the tributaries, there was an increase in taxonomic and phylogenetic diversity with higher flooding intensity. This suggests that the gradient of flooding stress at different elevations along the mainstream and the hydrological contrast between the fluctuating backwater area and the permanent backwater area do not exert substantial influences on species, phylogenetic, and functional diversity within plant communities. In contrast, the gradient of flooding stress in the permanent backwater area of the tributaries does result in variations in taxonomic diversity and trait diversity, which suggests that in front of the dam, strong environmental selection influences taxonomic and trait diversity within riparian communities of the tributaries. The mainstream and the tributaries exhibit distinct patterns. This divergence may be attributed to the mainstream being more susceptible to the water levels regulated by the dam, experiencing strong influences from inverse rhythm flooding alternation. Conversely, the zones with low flooding intensity within the tributaries may remain unaffected by the dam water level regulation.
The absence of significant difference in the phylogenetic diversity of the permanent backwater area of the tributaries may be explained by the increase in the species without substantial changes in the composition of the family and genera. This suggests that, under the environmental selection of the flooding stress, specific plant families with strong adaptability to flooding stress dominate the colonization in the riparian zones.
Nevertheless, it is important to note that previous research on this topic has yielded mixed results. Some studies have shown an initial increase and subsequent decrease in taxonomic diversity with flooding intensity in the riparian plant communities, while others studies have reported a continuous increase in taxonomic diversity with flooding intensity [38,39,40]. These disparities could be due to variations in survey locations, time periods, and the specific sections of the river examined. Our research encompassed a broad area within the water level fluctuation zone of the Three Gorges Reservoir, spanning Chongqing and Hubei, which could yield diverse results depending on the survey time and location. Nevertheless, the conclusion of this study may also be the result of contingency during the study period. The flooding disturbance event takes away most or all of the individuals in the riparian zones. When the water level recedes, exposing the land, a new phase of community assembly commences. The sequence and timing of species immigration during this assembly can impact species abundance across multiple spatial scales. These effects, known as priority effects, can lead to historical contingencies in community structure and function [41]. While our analysis could not rule out these contingencies, our results, in essence, shed light on the intricate dynamics of plant communities within riparian environments. This emphasizes the role of environmental selection and underscores the need to consider various factors influencing plant diversity and community assembly.

4.2. Environmental Filtering and Random Processes Are the Main Assembly Rules Structuring the Riparian Plant Communities

After conducting a comprehensive analysis of the plant community within the riparian zone, it became evident that phylogenetic diversity exhibited significant clustering in the community. In other words, the genetic relationships among the species within the riparian plant community were closer than those in a randomly assembled community. Trait diversity, on the other hand, only displayed significant clustering in the fluctuating backwater area in Zone A of the mainstream and the permanent backwater area in Zone A. This suggests that high-intensity flooding stress tends to homogenize the functional features of the plant community at the high flooding intensity in the riparian zone along the mainstream, making it more similar to a randomly assembled community. In most cases, the trait diversity tends to exhibit a more random pattern.
Flooding stress, being a dominant environmental factor shaping the plant community in the riparian zone, causes species with similar functional traits to coexist in the same habitat space. This phenomenon leads to convergence of traits at the community level [14]. Previous studies in the riparian zone along the mainstream of the Three Gorges Reservoir also emphasized the crucial role of environmental filtering in community assembly, alongside random processes such as dispersal limitation during the early stages of secondary succession of plant communities [42]. For instance, a recent study conducted by Ran et al. [43] in the riparian zone along the mainstream of the Three Gorges Reservoir also underscores that the pivotal and dominant process ruling community assembly in the water level fluctuation zone is environmental filtering. Simultaneously, random processes like dispersal limitations also exert a significant influence during the initial phases of secondary succession in plant communities. For example, in the initial phases of secondary succession on abandoned farmland, species richness is primarily determined by seed dispersal. A study conducted in the glacier retreat area demonstrates that community assembly during the herb stage of primary succession is primarily influenced by random processes. Although this succession occurs in a different context (primary succession), it still provides valuable insights [44]. In both secondary and primary succession scenarios, it is evident that community assembly during the early stages is predominantly shaped by a combination of environmental filtering and random processes. In the riparian zone, the environmental filtering, driven by flooding stress, restricts the long-term survival and colonization of most plant species. The majority of the plants thriving in this zone can tolerate high soil moisture or thrive in humid environments. Meanwhile, the random process of dispersal determines which species reach the riparian zone. Typically, species with strong dispersal ability can quickly colonize the bare ground when the water level recedes, often through means such as wind- or water-dispersed seeds. In summary, whether in secondary or primary succession scenarios, the assembly of communities during the early stages is primarily influenced by a dynamic interplay between environmental filtering and random processes.

4.3. Significant Divergence of Seed Mass in Riparian Plant Communities Dominated by Filtering and Random Assembly Processes

Upon single trait analysis, it became evident that seed mass showed notable divergence in the riparian plant community. This pattern held true both in the upper and lower reaches of the Three Gorges Reservoir area and in the riparian zones of the mainstream and tributaries. Specifically, the proportion of seed mass divergence in the riparian plant community surpassed that of the random community, highlighting the central role of seed mass in the competition within the riparian zone’s plant community.
Among various plant traits, seed mass stands out as a core trait, occupying a pivotal position in plant life history and playing a crucial role in the adaptive differentiation of plant species [45]. Variations in seed mass reflect the maternal resource investment in offspring, thus representing a fundamental aspect of plant reproduction. It impacts seed dispersal, germination, and seedling establishment, thereby influencing species distribution, competition dynamics, and survival within the community. Consequently, it holds significant sway over the composition of a plant community.
In the early stage of succession, seed mass may function as a biological factor in ecological filtering, influencing the selection process for species. Seeds of different sizes may adapt to varying environmental conditions, determining which species can successfully establish themselves in the early phases of succession. During the herbaceous succession stage of an early-stage plant community, habitat conditions are typically challenging, requiring species with robust adaptability to thrive. Large-seed plants tend to excel in resource-limited environments [46]. For example, after 8 months of flooding, more than 90% of the seeds from Xanthium strumarium can germinate and grow [47,48], demonstrating the advantage of larger seeds in such conditions. Conversely, the dispersal process is also pivotal during the early stages of community succession. Small-seed plants usually produce a greater quantity of seeds in a single reproductive event, and their seeds are more wind-dispersed, enabling them to reach the bare land areas first [49]. Examples include species such as Rumex acetosa and Polygonum hydropiper. Typically, small seeds exhibit higher growth rates [50].
Furthermore, seed mass holds significant sway over the formation of plant community structure and function during early succession. Large-seed plants possess greater resistance and can withstand environmental pressure [51], contributing to the stability of community structure. Conversely, small-seed plants may excel in resource competition, aiding in the maintenance of trait diversity within the community.
Seed mass emerges as a pivotal trait influencing community differentiation during the early stages of community succession. The mechanism of community assembly and differentiation, characterized by seed mass, carries profound implications for the phylogenetic process within communities. These findings provide a crucial foundation for a deeper understanding of the evolution of species within the riparian zone, as well as community assembly and ecological restoration in the dam-regulated reservoir.

5. Conclusions

The findings of this study revealed that the most pronounced changes in species and trait diversity in the riparian zone were observed in the permanent backwater area of the tributaries. The assembly of these communities was predominantly influenced by the environmental filtering and random processes induced by flooding stress. This pattern was consistent whether in the upper and lower reaches of the Three Gorges Reservoir area or in the mainstream and tributaries.
Furthermore, a significant divergence in seed mass was evident across plant communities, underscoring the substantial impact of seed mass on the succession, structure and function of subsequent plant communities. These results shed light on the stage characteristics of herbaceous succession in the riparian zone of the Three Gorges Reservoir area and provide valuable insights for the ecological restoration of this dynamic zone. In conclusion, in the ecological restoration for herb succession in flooding-stressed riparian communities, we advocate the prioritization of seed mass differences, which will be conducive to the development of a stable riparian plant community structure.
Nonetheless, it is worth noting some limitations in this study that could be addressed for further improvement: (1) The field-derived plant trait data were limited, with most information sourced from databases and publications, which may not provide comprehensive coverage. (2) The research duration spanned only 2 years, lacking a comprehensive view of the dynamic changes in plant communities over the entire historical period of the riparian zone. This limitation prevents us from fully accounting for historical contingency in community assembly. Therefore, in the future, collecting more detailed plant trait data and conducting long-term, continuous observational studies are essential. The plant communities in the riparian zone are subject to ongoing interference and reconstruction, and only long-term data can elucidate mechanism of their dynamic changes and provide robust scientific support for ecosystem restoration.

Author Contributions

Investigation, analysis, visualization, writing—original draft preparation, W.W.; investigation, J.H.; investigation, H.Z.; investigation, writing—review and editing, M.M. All authors have read and agreed to the published version of the manuscript.

Funding

This research was funded by Chongqing Municipality Key Special Project for Technological Innovation and Application Development (Grant No. CSTB2023TIAD-KPX0077), The National Natural Science Foundation of China (Grant No. 42371071), and Tibet Shigatse City Science and Technology Plan Project (Grant No. RKZ2021KJ03).

Institutional Review Board Statement

Not applicable.

Data Availability Statement

The data presented in this study are available on request from the corresponding author. The data are not publicly available due to privacy.

Conflicts of Interest

The authors declare no conflict of interest.

References

  1. McDonald, R.I.; Weber, K.F.; Padowski, J.; Boucher, T.; Shemie, D. Estimating Watershed Degradation over the Last Century and Its Impact on Water-Treatment Costs for the World’s Large Cities. Proc. Natl. Acad. Sci. USA 2016, 113, 9117–9122. [Google Scholar] [CrossRef] [PubMed]
  2. Cavender-Bares, J.; Kozak, K.H.; Fine, P.V.A.; Kembel, S.W. The Merging of Community Ecology and Phylogenetic Biology. Ecol. Lett. 2009, 12, 693–715. [Google Scholar] [CrossRef] [PubMed]
  3. Hurtado, P.; Prieto, M.; Aragón, G.; Escudero, A.; Martínez, I. Critical Predictors of Functional, Phylogenetic and Taxonomic Diversity Are Geographically Structured in Lichen Epiphytic Communities. J. Ecol. 2019, 107, 2303–2316. [Google Scholar] [CrossRef]
  4. Loranger, J.; Munoz, F.; Shipley, B.; Violle, C. What Makes Trait–Abundance Relationships When Both Environmental Filtering and Stochastic Neutral Dynamics Are at Play? Oikos 2018, 127, 1735–1745. [Google Scholar] [CrossRef]
  5. Bernard-Verdier, M.; Navas, M.-L.; Vellend, M.; Violle, C.; Fayolle, A.; Garnier, E. Community Assembly along a Soil Depth Gradient: Contrasting Patterns of Plant Trait Convergence and Divergence in a Mediterranean Rangeland. J. Ecol. 2012, 100, 1422–1433. [Google Scholar] [CrossRef]
  6. Shipley, B.; Vile, D.; Garnier, É. From Plant Traits to Plant Communities: A Statistical Mechanistic Approach to Biodiversity. Science 2006, 314, 812–814. [Google Scholar] [CrossRef]
  7. Cadotte, M.W.; Carboni, M.; Si, X.; Tatsumi, S. Do Traits and Phylogeny Support Congruent Community Diversity Patterns and Assembly Inferences? J. Ecol. 2019, 107, 2065–2077. [Google Scholar] [CrossRef]
  8. de Bello, F.; Lavorel, S.; Hallett, L.M.; Valencia, E.; Garnier, E.; Roscher, C.; Conti, L.; Galland, T.; Goberna, M.; Májeková, M.; et al. Functional Trait Effects on Ecosystem Stability: Assembling the Jigsaw Puzzle. Trends Ecol. Evol. 2021, 36, 822–836. [Google Scholar] [CrossRef]
  9. Cadotte, M.W.; Cavender-Bares, J.; Tilman, D.; Oakley, T.H. Using Phylogenetic, Functional and Trait Diversity to Understand Patterns of Plant Community Productivity. PLoS ONE 2009, 4, e5695. [Google Scholar] [CrossRef]
  10. Liu, C.; Wolter, C.; Xian, W.; Jeschke, J.M. Most Invasive Species Largely Conserve Their Climatic Niche. Proc. Natl. Acad. Sci. USA 2020, 117, 23643–23651. [Google Scholar] [CrossRef]
  11. Vetaas, O.R.; Grytnes, J.-A.; Bhatta, K.P.; Hawkins, B.A. An Intercontinental Comparison of Niche Conservatism along a Temperature Gradient. J. Biogeogr. 2018, 45, 1104–1113. [Google Scholar] [CrossRef]
  12. Faith, D.P. Conservation Evaluation and Phylogenetic Diversity. Biol. Conserv. 1992, 61, 1–10. [Google Scholar] [CrossRef]
  13. Flynn, D.; Mirotchnick, N.; Jain, M.; Palmer, M.; Naeem, S. Functional and Phylogenetic Diversity as Predictors of Biodiversity- Ecosystem-Function Relationships. Ecology 2011, 92, 1573–1581. [Google Scholar] [CrossRef]
  14. Macarthur, R.; Levins, R. The Limiting Similarity, Convergence, and Divergence of Coexisting Species. Am. Nat. 1967, 101, 377–385. [Google Scholar] [CrossRef]
  15. Watkins, A.J.; Wilson, J.B. Local Texture Convergence: A New Approach to Seeking Assembly Rules. Oikos 2003, 102, 525–532. [Google Scholar] [CrossRef]
  16. Webb, C.O.; Ackerly, D.D.; McPeek, M.A.; Donoghue, M.J. Phylogenies and Community Ecology. Annu. Rev. Ecol. Syst. 2002, 33, 475–505. [Google Scholar] [CrossRef]
  17. Pearse, W.D. The Phylogenetic Structure of Ecological Communities under Change. 2012. Available online: https://core.ac.uk/download/pdf/76994895.pdf (accessed on 10 October 2023).
  18. Kraft, N.J.B.; Adler, P.B.; Godoy, O.; James, E.C.; Fuller, S.; Levine, J.M. Community Assembly, Coexistence and the Environmental Filtering Metaphor. Funct. Ecol. 2015, 29, 592–599. [Google Scholar] [CrossRef]
  19. Emerson, B.C.; Gillespie, R.G. Phylogenetic Analysis of Community Assembly and Structure over Space and Time. Trends Ecol. Evol. 2008, 23, 619–630. [Google Scholar] [CrossRef]
  20. Culmsee, H.; Leuschner, C. Consistent Patterns of Elevational Change in Tree Taxonomic and Phylogenetic Diversity across Malesian Mountain Forests. J. Biogeogr. 2013, 40, 1997–2010. [Google Scholar] [CrossRef]
  21. Leibold, M.A.; Chase, J.M.; Ernest, S.K.M. Community Assembly and the Functioning of Ecosystems: How Metacommunity Processes Alter Ecosystems Attributes. Ecology 2017, 98, 909–919. [Google Scholar] [CrossRef]
  22. Wang, Y.; Liu, Y.; Ma, M.; Ding, Z.; Wu, S.; Jia, W.; Chen, Q.; Yi, X.; Zhang, J.; Li, X.; et al. Dam-Induced Difference of Invasive Plant Species Distribution along the Riparian Habitats. Sci. Total Environ. 2022, 808, 152103. [Google Scholar] [CrossRef] [PubMed]
  23. Wu, X.; Wang, L.; Cao, Q.; Niu, Z.; Dai, X. Regional Climate Change and Possible Causes over the Three Gorges Reservoir Area. Sci. Total Environ. 2023, 903, 166263. [Google Scholar] [CrossRef] [PubMed]
  24. Wang, K.; Yuan, X.; Wu, S.; Zhang, G.; Liu, H.; Zhou, L.; Zhang, M. Effects of River Damming on Ground-Dwelling Arthropods along Riparian–Upland Habitats. Ecohydrology 2019, 12, e2073. [Google Scholar] [CrossRef]
  25. Zheng, J.; Arif, M.; Zhang, S.; Yuan, Z.; Zhang, L.; Li, J.; Ding, D.; Li, C. Dam Inundation Simplifies the Plant Community Composition. Sci. Total Environ. 2021, 801, 149827. [Google Scholar] [CrossRef] [PubMed]
  26. Su, X.; Zeng, B.; Huang, W.; Xu, S.; Lei, S. Effects of the Three Gorges Dam on Preupland and Preriparian Drawdown Zones Vegetation in the Upper Watershed of the Yangtze River, P.R. China. Ecol. Eng. 2012, 44, 123–127. [Google Scholar] [CrossRef]
  27. Liu, Y.; Ma, M.; Ran, Y.; Yi, X.; Wu, S.; Huang, P. Disentangling the Effects of Edaphic and Vegetational Properties on Soil Aggregate Stability in Riparian Zones along a Gradient of Flooding Stress. Geoderma 2021, 385, 114883. [Google Scholar] [CrossRef]
  28. Van Der Pijl, L. Principles of Dispersal in Higher Plants; Springer: Berlin/Heidelberg, Germany, 1982; ISBN 978-3-642-87927-2. [Google Scholar]
  29. Fukami, T.; Martijn Bezemer, T.; Mortimer, S.R.; Putten, W.H. Species Divergence and Trait Convergence in Experimental Plant Community Assembly. Ecol. Lett. 2005, 8, 1283–1290. [Google Scholar] [CrossRef]
  30. Lengyel, S.; Gove, A.D.; Latimer, A.M.; Majer, J.D.; Dunn, R.R. Convergent Evolution of Seed Dispersal by Ants, and Phylogeny and Biogeography in Flowering Plants: A Global Survey. Perspect. Plant Ecol. Evol. Syst. 2010, 12, 43–55. [Google Scholar] [CrossRef]
  31. Mason, N.W.H.; Mouillot, D.; Lee, W.G.; Wilson, J.B. Functional Richness, Functional Evenness and Functional Divergence: The Primary Components of Functional Diversity. Oikos 2005, 111, 112–118. [Google Scholar] [CrossRef]
  32. Oksanen, J.; Blanchet, F.G.; Kindt, R.; Legendre, P.; Minchin, P.; O’Hara, R.; Simpson, G.; Solymos, P.; Stevens, M.; Wagner, H. Vegan: Community Ecology Package; R Package Version. 2.0–10; University of Helsinki; CRAN: Helsinki, Finland, 2013. [Google Scholar]
  33. Pearse, W.D.; Cadotte, M.W.; Cavender-Bares, J.; Ives, A.R.; Tucker, C.M.; Walker, S.C.; Helmus, M.R. Pez: Phylogenetics for the Environmental Sciences. Bioinformatics 2015, 31, 2888–2890. [Google Scholar] [CrossRef]
  34. Laliberté, E.; Legendre, P.; Shipley, B. FD: Measuring Functional Diversity from Multiple Traits, and Other Tools for Functional Ecology. R Package Version 2014, 1, 1–12. Available online: https://www.researchgate.net/publication/312463190_FD_Measuring_functional_diversity_from_multiple_traits_and_other_tools_for_functional_ecology (accessed on 15 July 2023).
  35. Jin, Y.; Qian, H.V. PhyloMaker2: An Updated and Enlarged R Package That Can Generate Very Large Phylogenies for Vascular Plants. Plant Divers. 2022, 44, 335–339. [Google Scholar] [CrossRef] [PubMed]
  36. Kembel, S.W.; Cowan, P.D.; Helmus, M.R.; Cornwell, W.K.; Morlon, H.; Ackerly, D.D.; Blomberg, S.P.; Webb, C.O. Picante: R Tools for Integrating Phylogenies and Ecology. Bioinformatics 2010, 26, 1463–1464. [Google Scholar] [CrossRef] [PubMed]
  37. Bartomeus, I. Fundiv: Analyzing Functional Trait Diversity 2020. Available online: https://github.com/ibartomeus/fundiv (accessed on 15 July 2023).
  38. Chen, Z.; Yuan, X.; Roß-Nickoll, M.; Hollert, H.; Schäffer, A. Moderate Inundation Stimulates Plant Community Assembly in the Drawdown Zone of China’s Three Gorges Reservoir. Environ. Sci. Eur. 2020, 32, 79. [Google Scholar] [CrossRef]
  39. Zhu, K.; Chen, Y.; Zhang, S.; Lei, B.; Yang, Z.; Huang, L. Vegetation of the Water-Level Fluctuation Zone in the Three Gorges Reservoir at the Initial Impoundment Stage. Glob. Ecol. Conserv. 2020, 21, e00866. [Google Scholar] [CrossRef]
  40. Rong, S.; Weiqiong, D.; Xiuming, L. Distribution Pattern of Riparian Vegetation along Donghe River, a Tributary of the Three Gorges Reservoir Area. Chin. J. Ecol. 2015, 34, 2733. [Google Scholar]
  41. Fukami, T. Historical Contingency in Community Assembly: Integrating Niches, Species Pools, and Priority Effects. Annu. Rev. Ecol. Evol. Syst. 2015, 46, 1–23. [Google Scholar] [CrossRef]
  42. Götzenberger, L.; De Bello, F.; Bråthen, K.A.; Davison, J.; Dubuis, A.; Guisan, A.; Lepš, J.; Lindborg, R.; Moora, M.; Pärtel, M.; et al. Ecological Assembly Rules in Plant Communities-Approaches, Patterns and Prospects. Biol. Rev. 2012, 87, 111–127. [Google Scholar] [CrossRef]
  43. Ran, Y.; Wu, S.; Chen, C.; Sun, X.; Huang, P.; Ma, M.; Yi, X. Shift from Soil Chemical to Physical Filters in Assembling Riparian Floristic Communities along a Flooding Stress Gradient. Sci. Total Environ. 2022, 844, 157116. [Google Scholar] [CrossRef]
  44. Marteinsdóttir, B.; Svavarsdóttir, K.; Thórhallsdóttir, T.E. Multiple Mechanisms of Early Plant Community Assembly with Stochasticity Driving the Process. Ecology 2018, 99, 91–102. [Google Scholar] [CrossRef]
  45. Simpson, K.J.; Atkinson, R.R.L.; Mockford, E.J.; Bennett, C.; Osborne, C.P.; Rees, M. Large Seeds Provide an Intrinsic Growth Advantage That Depends on Leaf Traits and Root Allocation. Funct. Ecol. 2021, 35, 2168–2178. [Google Scholar] [CrossRef]
  46. Rees, M.; Venable, D.L. Why Do Big Plants Make Big Seeds? J. Ecol. 2007, 95, 926–936. [Google Scholar] [CrossRef]
  47. Liu, J.; Lin, F.; Shi, S.; Ayi, Q.; Liu, S.; Zeng, B. Effects of Water Level Regulation on the Seed Germination and Production of Annual Plant Xanthium Sibiricum in the Water-Level-Fluctuating-Zone of Three Gorges Reservoir. Sci. Rep. 2017, 7, 5056. [Google Scholar] [CrossRef] [PubMed]
  48. Machado, M.; Queiroz, C.R.R.; Wilson, T.M.; Sousa, D.E.R.; Castro, M.B.; Saravia, A.; Lee, S.T.; Armién, A.G.; Barros, S.S.; Riet-Correa, F. Endemic Xanthium Strumarium Poisoning in Cattle in Flooded Areas of the Araguari River, Minas Gerais, Brazil. Toxicon 2021, 200, 23–29. [Google Scholar] [CrossRef]
  49. Comparative Ecology of Seed Size and Dispersal. Phil. Trans. R. Soc. Lond. B 1996, 351, 1309–1318. [CrossRef]
  50. Turnbull, L.A.; Philipson, C.D.; Purves, D.W.; Atkinson, R.L.; Cunniff, J.; Goodenough, A.; Hautier, Y.; Houghton, J.; Marthews, T.R.; Osborne, C.P.; et al. Plant Growth Rates and Seed Size: A Re-Evaluation. Ecology 2012, 93, 1283–1289. [Google Scholar] [CrossRef]
  51. Metz, J.; Liancourt, P.; Kigel, J.; Harel, D.; Sternberg, M.; Tielbörger, K. Plant Survival in Relation to Seed Size along Environmental Gradients: A Long-Term Study from Semi-Arid and Mediterranean Annual Plant Communities. J. Ecol. 2010, 98, 697–704. [Google Scholar] [CrossRef]
Figure 1. (a) The riparian zone was categorized into three sample zones and two 1 m × 1 m sampling quadrats were set up in each zone of the sampling site. (b) Schematic diagram showing periodic water level fluctuations from 2015 to 2023. (c) Three different levels of flooding intensity were chosen based on the flooding intensity formula [27].
Diversity 15 01164 g001
Figure 2. Distribution of sampling sites in the study area. The fluctuating backwater region, stretching from Jiangjin to Fuling, is subject to the effects of both winter water retention and summer inundation, leading to elevated water levels in both seasons. In contrast, the permanent backwater area, extending from Fuling to the dam, is predominantly influenced by reservoir water storage, resulting in high water levels in the winter and low levels in the summer.
Diversity 15 01164 g002
Figure 3. The phylogenetic tree of 299 plant species in our survey. The branch is the distance of the species.
Diversity 15 01164 g003
Figure 4. Spatial distribution of biodiversity within the riparian zone of the Three Gorges Reservoir. (a,b): Taxonomic diversity of four regions. (c,d): Phylogenetic diversity of four regions. (e,f): Trait diversity of four regions. MF: the fluctuating backwater area of the mainstream; MP: permanent backwater area of the main stream; TF: fluctuating backwater area of the tributary; TP: permanent backwater area of the tributaries; A: 145 to 155 m of the riparian zone, B: 155 to 165 m of the riparian zone, C: 165 to 175 m of the riparian zone. The numbers on the line represent the significance of the Wilcoxon rank sum test.
Diversity 15 01164 g004
Figure 5. The aggregation and dispersion of phylogenetic diversity and trait diversity of riparian plant communities in the Three Gorges Reservoir. (a,b) SES.PD: standardized effect sizes of phylogenetic diversity; (c,d): SES.TD: standardized effect sizes of trait diversity; MF: the fluctuating backwater area of the mainstream; MP: permanent backwater area of the mainstream; TF: fluctuating backwater area of the tributaries; TP: permanent backwater area of the tributaries; A: 145 to 155 m of the water level fluctuation zone, B: 155 to 165 m of the riparian zone, C: 165 to 175 m of the riparian zone. * p < 0.05, ** p < 0.01, *** p < 0.001.
Diversity 15 01164 g005
Figure 6. The aggregation and dispersion of plant single traits in the riparian communities of the Three Gorges Reservoir. In the plot (ag), the vertical axis is the standardized effect size of each single trait. MF: the fluctuating backwater area of the mainstream; MP: permanent backwater area of the mainstream; TF: fluctuating backwater area of the tributaries; TP: permanent backwater area of the tributaries; A: 145 to 155 m of the riparian zone, B: 155 to 165 m of the riparian zone, C: 165 to 175 m of the riparian zone. * p < 0.05, ** p < 0.01, *** p < 0.001.
Diversity 15 01164 g006
Table 1. Categorization of plant traits data.
TraitData TypeData Classification Criteria/Units
Life formCategorical variablePhanerophyte, Chamaephyte, Hemicryptophyte, Cryptophyte, Therophyte
Plant heightContinuous variablecm
Fruit typeCategorical variableBerry, Pepo, Hesperidium, Drupe, Pome, Follicles, Legumes, Capsule, Silique, Achene, Grain, Samara, Schizocarp, Nut, Aggregate fruit, Collective fruit
Seed dispersal modeCategorical variableEndozoochory, Ballochory, Exozoochory, Myrmecochory, Anemochory, Hydrochory, Autochory
PollinationCategorical variableWind pollination, Biological pollination, Self-pollination, Water pollination
Seed massContinuous variablethousand seed weight, mg
Regenerative strategyCategorical variableW: numerous widely dispersed seeds or spores; V: lateral vegetative spread (offshoots remaining attached to parent for a considerable period); SV: seasonal regeneration by vegetative means; S: seasonal regeneration from seed; B: persistent seed bank of buried seeds or spores
Table 2. Correlation coefficients between divergence of seed mass and diversity of taxonomy and phylogeny.
SiteZONECorrelation between Seed Mass and Taxonomic DiversityCorrelation between Seed Mass and Phylogenetic Diversity
MFA0.40.8
MFB0.5580.914 **
MFC0.814 **0.929 **
MPA0.681 **0.968 **
MPB0.713 **0.961 **
MPC0.605 **0.944 **
TFA0.634 **0.961 **
TFB0.812 **0.974 **
TFC0.819 **0.966 **
TPA0.841 **0.987 **
TPB0.660 **0.983 **
TPC0.670 **0.956 **
MF: the fluctuating backwater area of the main stream; MP: permanent backwater area of the main stream; TF: fluctuating backwater area of the tributaries; TP: permanent backwater area of the tributaries; A: 145 to 155 m of the water level fluctuation zone, B: 155 to 165 m of the water level fluctuation zone, C: 165 to 175 m of the water level fluctuation zone. ** p < 0.01.
Disclaimer/Publisher’s Note: The statements, opinions and data contained in all publications are solely those of the individual author(s) and contributor(s) and not of MDPI and/or the editor(s). MDPI and/or the editor(s) disclaim responsibility for any injury to people or property resulting from any ideas, methods, instructions or products referred to in the content.

