Article

Soil Biological Properties along a Topographic Gradient in Brazil’s Atlantic Forest Biome

by
Diego Lang Burak
1,
Thamyres Cardoso da Silveira
1,*,
Luciana Ventura Machado
2 and
Eduardo de Sá Mendonça
1,*
1
Department of Agronomy, Center of Agriculture and Engineering Science, Federal University of Espirito Santo, Alegre 29500-000, Brazil
2
Pos-Graduation Program of Agronomy, Center of Agriculture and Engineering Science, Federal University of Espirito Santo, Alegre 29500-000, Brazil
*
Authors to whom correspondence should be addressed.
Diversity 2023, 15(10), 1097; https://doi.org/10.3390/d15101097
Submission received: 8 September 2023 / Revised: 10 October 2023 / Accepted: 17 October 2023 / Published: 21 October 2023

Abstract

:
The Atlantic Forest exhibits remarkable floristic diversity over short distances, and when combined with altitude, it results in variations in soil biological properties and hydrological dynamics. This study aimed to quantify the distribution pattern of soil biological properties along a small topographic gradient and identify how these properties are related to soil chemical, physical, and topographical attributes in an Atlantic Forest fragment in Brazil. Plots were established along hillslope positions varying from 100 to 180 m of altitude. Soil biological characterization was performed at a depth of 0.0–0.10 m in both summer and winter seasons. The lowland showed higher microbial biomass nitrogen in summer (57.28 ± 5.57 μg g−1 soil) and higher anaerobically mineralizable nitrogen in summer and winter (42.70 ± 2.14 mg kg−1 and 41.06 ± 3.37 mg kg−1, respectively). The midland showed lower microbial biomass carbon, enzymatic activity, and soil moisture in both seasons, and higher metabolic coefficients in summer. Soil chemical properties exerted a greater influence on the variability of biological properties in both seasons. The land slope conditioned lower microbial activity and organic cycling in the midland. Soil biological properties were affected by seasonality. Even a small altitudinal gradient (up to 100 m) in the Sea of Hills regions of the Atlantic Forest can lead to significant changes in soil biological and chemical attributes.

1. Introduction

Within the realm of tropical forests lies the Atlantic Forest, distinguished by its exceptional attributes, including elevated levels of biodiversity and endemism, as well as the profound fragmentation of its remaining tracts. The Atlantic Forest ranks among the 25 global biodiversity conservation hotspots [1,2,3]. Currently, it is estimated that around 8.5% of this forest remains in the form of forest remnants that surpass 100 hectares in size. Nonetheless, the original extent of the Atlantic Forest covered an area equivalent to 1,315,460 km2, spanning a significant part of the Brazilian coast [4].
The profound fragmentation of the Atlantic Forest, primarily attributed to anthropic activities such as deforestation and poor agricultural management, can cause biodiversity depletion, as well as physical and chemical soil degradation, leading to significant alterations in soil conditions [5,6]. Soils represent integral constituents of terrestrial ecosystems, and gaining a comprehensive understanding of the interactions occurring among soil organisms and their surroundings is essential for predicting how terrestrial ecosystems will respond to anthropogenic global change processes [7]. The biological attributes of soil, including the living organisms and the most dynamic segment of soil organic matter, exhibit rapid responsiveness to alterations within ecosystems due to their influence on pivotal biogeochemical processes [8,9]. Furthermore, the distribution of organic matter in the soil can vary both in depth (along the soil profile) and horizontally, with fluctuations also dependent on factors such as soil type, topography, climatic conditions, and the predominant vegetation in the area [10].
In Southeastern Brazil, the Morphoclimatic Domain known as the Sea of Hills encompasses most of Espírito Santo state and extends along the Brazilian coast from the northeast to the south [11]. This domain is characterized by hills set with different dissection degrees and present as main parent materials the acidic rocks, such as granites and gneisses [12]. The Sea of Hills region is notorious for its susceptibility to intense erosion and collective soil movement processes, which affect biological properties and organic matter dynamics [13]. In the toposequence of this region, one can identify Oxisols, Inceptisols, and Ultisols, as defined by the Brazilian Soil Classification System [14]. The term “toposequence” refers to the gradual variation of soil properties along a topographic gradient and is a spatial element that preserves flow connectivity from the highest point of the slope (summit) to its base [15].
Topography exerts a substantial influence on the functioning of tropical forest ecosystems [16,17] Topographic variables such as elevation, slope, and convexity play a crucial role in modeling soil properties [18,19]. For example, it is common to observe that soils located in valleys tend to be richer in moisture and nutrients compared to those on the ridges of elevations [20,21]. Furthermore, areas with steeper topographies often exhibit higher nutrient production, resulting in overall lower levels of available nutrients in the soil compared to flatter locations [22]. Topography also plays a significant role in shaping the diversity and composition of soil microbiota [23,24]. This is because topography controls the distribution of soil moisture, the accumulation of organic matter, and erosion, resulting in the formation of distinct microenvironments that have a significant impact on the availability of nutrients for microorganisms [24,25].
In light of the information presented above, we hypothesize that topography promotes soil biological heterogeneity along a toposequence within the Atlantic Forest. The aim of this study was to quantify the distribution pattern of soil biological properties along a small (up to 100 m) topographic gradient and to identify how these biological properties are related to the chemical, physical, and topographic properties of soil in a fragment of the Atlantic Forest in Brazil. This study seeks to provide essential insights into soil dynamics in one of the world’s most diverse and threatened ecosystems.

2. Materials and Methods

2.1. Study Area

The study was carried out in the Mata das Flores State Park, a conservation unit located in the municipality of Castelo, Espírito Santo state, Brazil, with coordinates 20°35′54″ S and 41°10′53″ W, covering an area of approximately 800 ha (Figure 1). The park is in the Atlantic Forest (Seasonal Semideciduous Montane Dense Ombrophilous Forest) and comprises one of the last remnants of the Atlantic Forest in Southern State [26,27]. Several plant families have been recorded in the park, including Rubiaceae, Euphorbiaceae, Piperaceae, Myrtaceae, Moraceae, and Fabaceae [28,29]. The region has a subtropical climate, with a mild summer and no dry season (Cfb), according to the Köppen climate classification [30].
The cumulative rainfall recorded at Alegre station (20°45′ S, 41°29′ W; 138 m) from January to December 2019 was 911.2 mm, with a mean minimum temperature of 16.8 °C and a mean maximum temperature of 37.4 °C (Figure 2). Annual rainfall and temperature data recorded at the weather station were obtained from the National Institute of Meteorology (INMET) [31] and the historical weather records were from 1950 to 1990 [30].

2.2. Soil Sampling and Data Collection

A sample unit consisted of a 10 m × 10 m plot. The plots were allocated along a 750 m transect along a topographic gradient varying from 100 to 180 m in altitude. The plots were arranged in pairs; each pair was 10 m away from the other, with the distance between pairs ranging from 20 m to 25 m [28]. Twenty-five plots were selected out of a total of 42 plots in the area for soil collection, resulting in 7 plots in the lowland, 12 plots in the midland, and 6 plots in the upland (Table 1).
The geographical coordinates indicating the center of each plot were obtained using a Global Positioning System (GPS; Garmin International, Inc., Kansas City, MO, USA). The topographic properties (aspect, elevation, curvature, exposure face, solar incidence, and topographical position index) were extracted from a raster SRTM (Shuttle Radar Topography Mission) of a single band with 30 m spatial resolution (1 arc second) using tools available in the ArcGIS program 10.3 version [32]. The terrain slope was measured in the field using a clinometer. Each plot was classified according to its position in the landscape: lowland, midland, and upland (Table 1). The soils were classified as Haplic Gleysol (lowland), Red Yellow Argisol (midland), and Red Yellow Latosol (upland) according to the Brazilian Soil Classification System [33]. Soil collection for biological characterization was performed in February and August, corresponding to the summer and winter seasons, respectively. The soils were collected in small trenches of 0.10 m depth in each plot, and three soil samples were obtained from three simple sub-samples at a 0.0–0.10 m depth (Table S1). Before performing the analysis, the samples were ground, followed by sieving through a 2.0 mm mesh to obtain the fine air-dried soil (FADS).

2.3. Soil Analysis

In the laboratory, a portion of each soil sample was stored in plastic bags and maintained under refrigerated conditions at 4–6 °C until analysis for microbial biomass carbon (MBC), microbial biomass nitrogen (MBN), acid phosphatase (AP), β-glucosidase (BG) and dehydrogenase activity (DEH). The FADS of each sample submitted to anaerobically mineralizable nitrogen analysis (AMN), total organic carbon (TOC), and cumulative soil basal respiration (CSBR) were stored at room temperature. The AMN content was determined according to the anaerobic incubation method [34]. In this method, the soil sample is saturated with deionized water and then incubated for seven days to determine the total nitrogen, ammonium, and nitrate content within the sample.
The TOC was determined using wet oxidation with K2Cr2O7 at a concentration of 0.167 mol L−1 in the presence of sulfuric acid with external heating [35]. The MBC and MBN contents were determined using the irradiation–extraction method [36]. The ratio between the MBC and TOC was calculated using the equation qMIC (the microbial quotient) = (MBC/TOC) × 100 [37]. Soil moisture (M) was measured by the gravimetric method according to EMBRAPA [38].
Cumulative soil basal respiration was determined by quantifying the CO2 released during 21 days of incubation in a closed system [39,40]. The assessment was performed on the 2nd, 5th, 8th, 12th, 16th, and 21st days after incubation. The metabolic quotient (qCO2) was calculated as the ratio between basal respiration and MBC [41]. Acid phosphatase (AP), β-glucosidase (BG), and dehydrogenase activity (DEH) were determined according to Tabatabai [42]. The data on chemical and physical properties and the corresponding methodologies are presented in Table S1.

2.4. Statistical Analysis

Initially, the Pearson correlation coefficient (r) was used to detect collinearity among quantitative variables, acting as an auxiliary tool in the variable selection (biological properties) in the principal component analysis. To evaluate if there was a significant difference among the results in the collection periods, the Wilcoxon paired t-test was used [43]. The Kruskal–Wallis non-parametric test was used (p ≤ 0.05) with multiple comparisons by the Dunn post hoc test at the 5% significance level (p ≤ 0.05) to detect differences in biological properties among lowland, midland, and upland. To identify the distribution pattern of biological properties along the topographic gradient, two ordination methods were used: Principal Component Analysis (PCA) and Redundancy Analysis (RDA) [44]. The AMN and qCO2 were not included in PCA due to their correlation with other variables (AMN with MBN in the summer and winter, r = 0.54 and r = 0.50, respectively), and (qCO2 with MBC in the summer and winter, r = −0.79 and r = −0.86, respectively). The multivariate analyses (PCA and RDA) were performed after variable standardization. The VIF (variance inflation factor) was used to verify the multicollinearity among the predictive variables (topographic) [44]. The statistical test was carried out using variance analysis, and the variable selection followed the Blanchet method [45]. Redundancy analysis followed by variation partitioning [46] was used to identify how biological (B) properties are related to chemical (C), physical (P), and topographic (T) properties. The explanatory variables were selected using partial regression models to identify significant variables (p < 0.05 after 999 random permutations) that contribute to explaining the variation in B properties. The selection was performed separately for each of the three sets of explanatory variables (C, P, T) for the response variable (B). The partial regression models were defined as follows: (i) RDA general model—total variance explained (TVE); (ii) partial RDA of the chemical properties; (iii) partial RDA of the physical properties; (iv) partial RDA of topographic properties; (v) partial RDA limited by chemical variables using topographic and physical variables as covariables; (vi) partial RDA limited by physical variables using chemical and topographic variables as covariables; (vii) partial RDA limited by topographic variables using chemical and physical variables as covariates. The data statistical analysis was performed using software R [47].

3. Results

3.1. Moisture Distribution, Biological Properties, and Soil Collection Seasons Effect

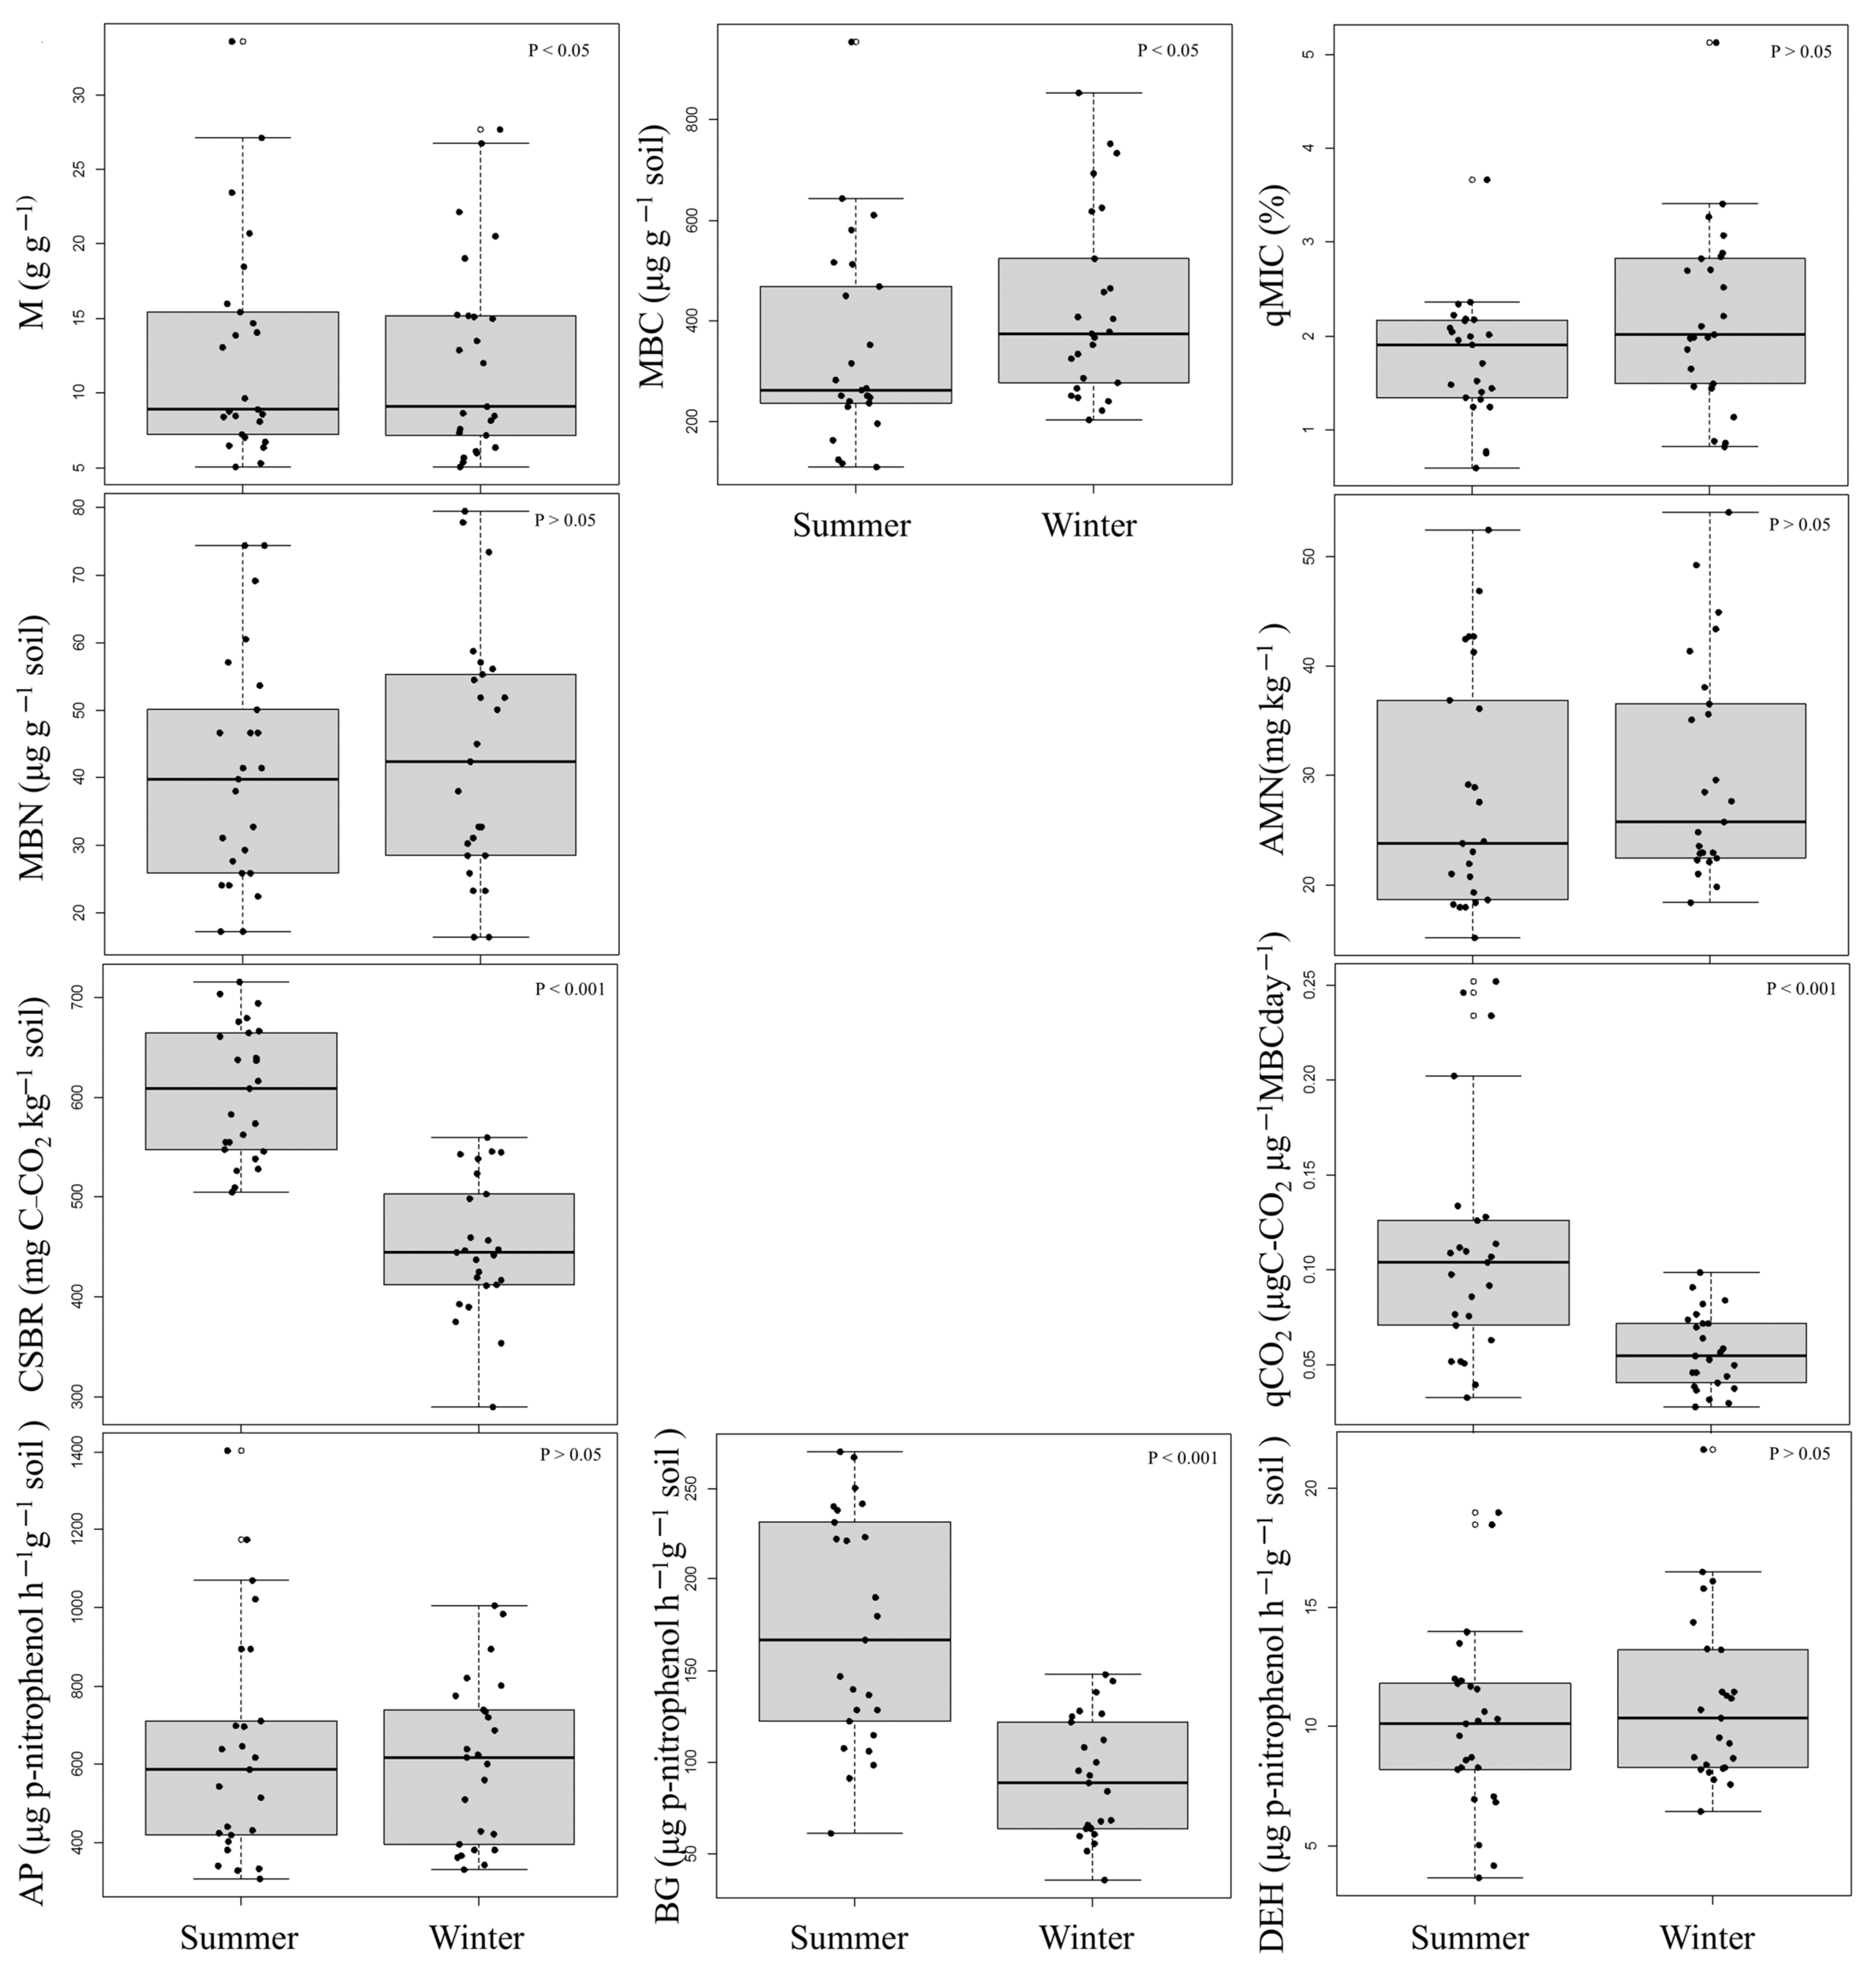
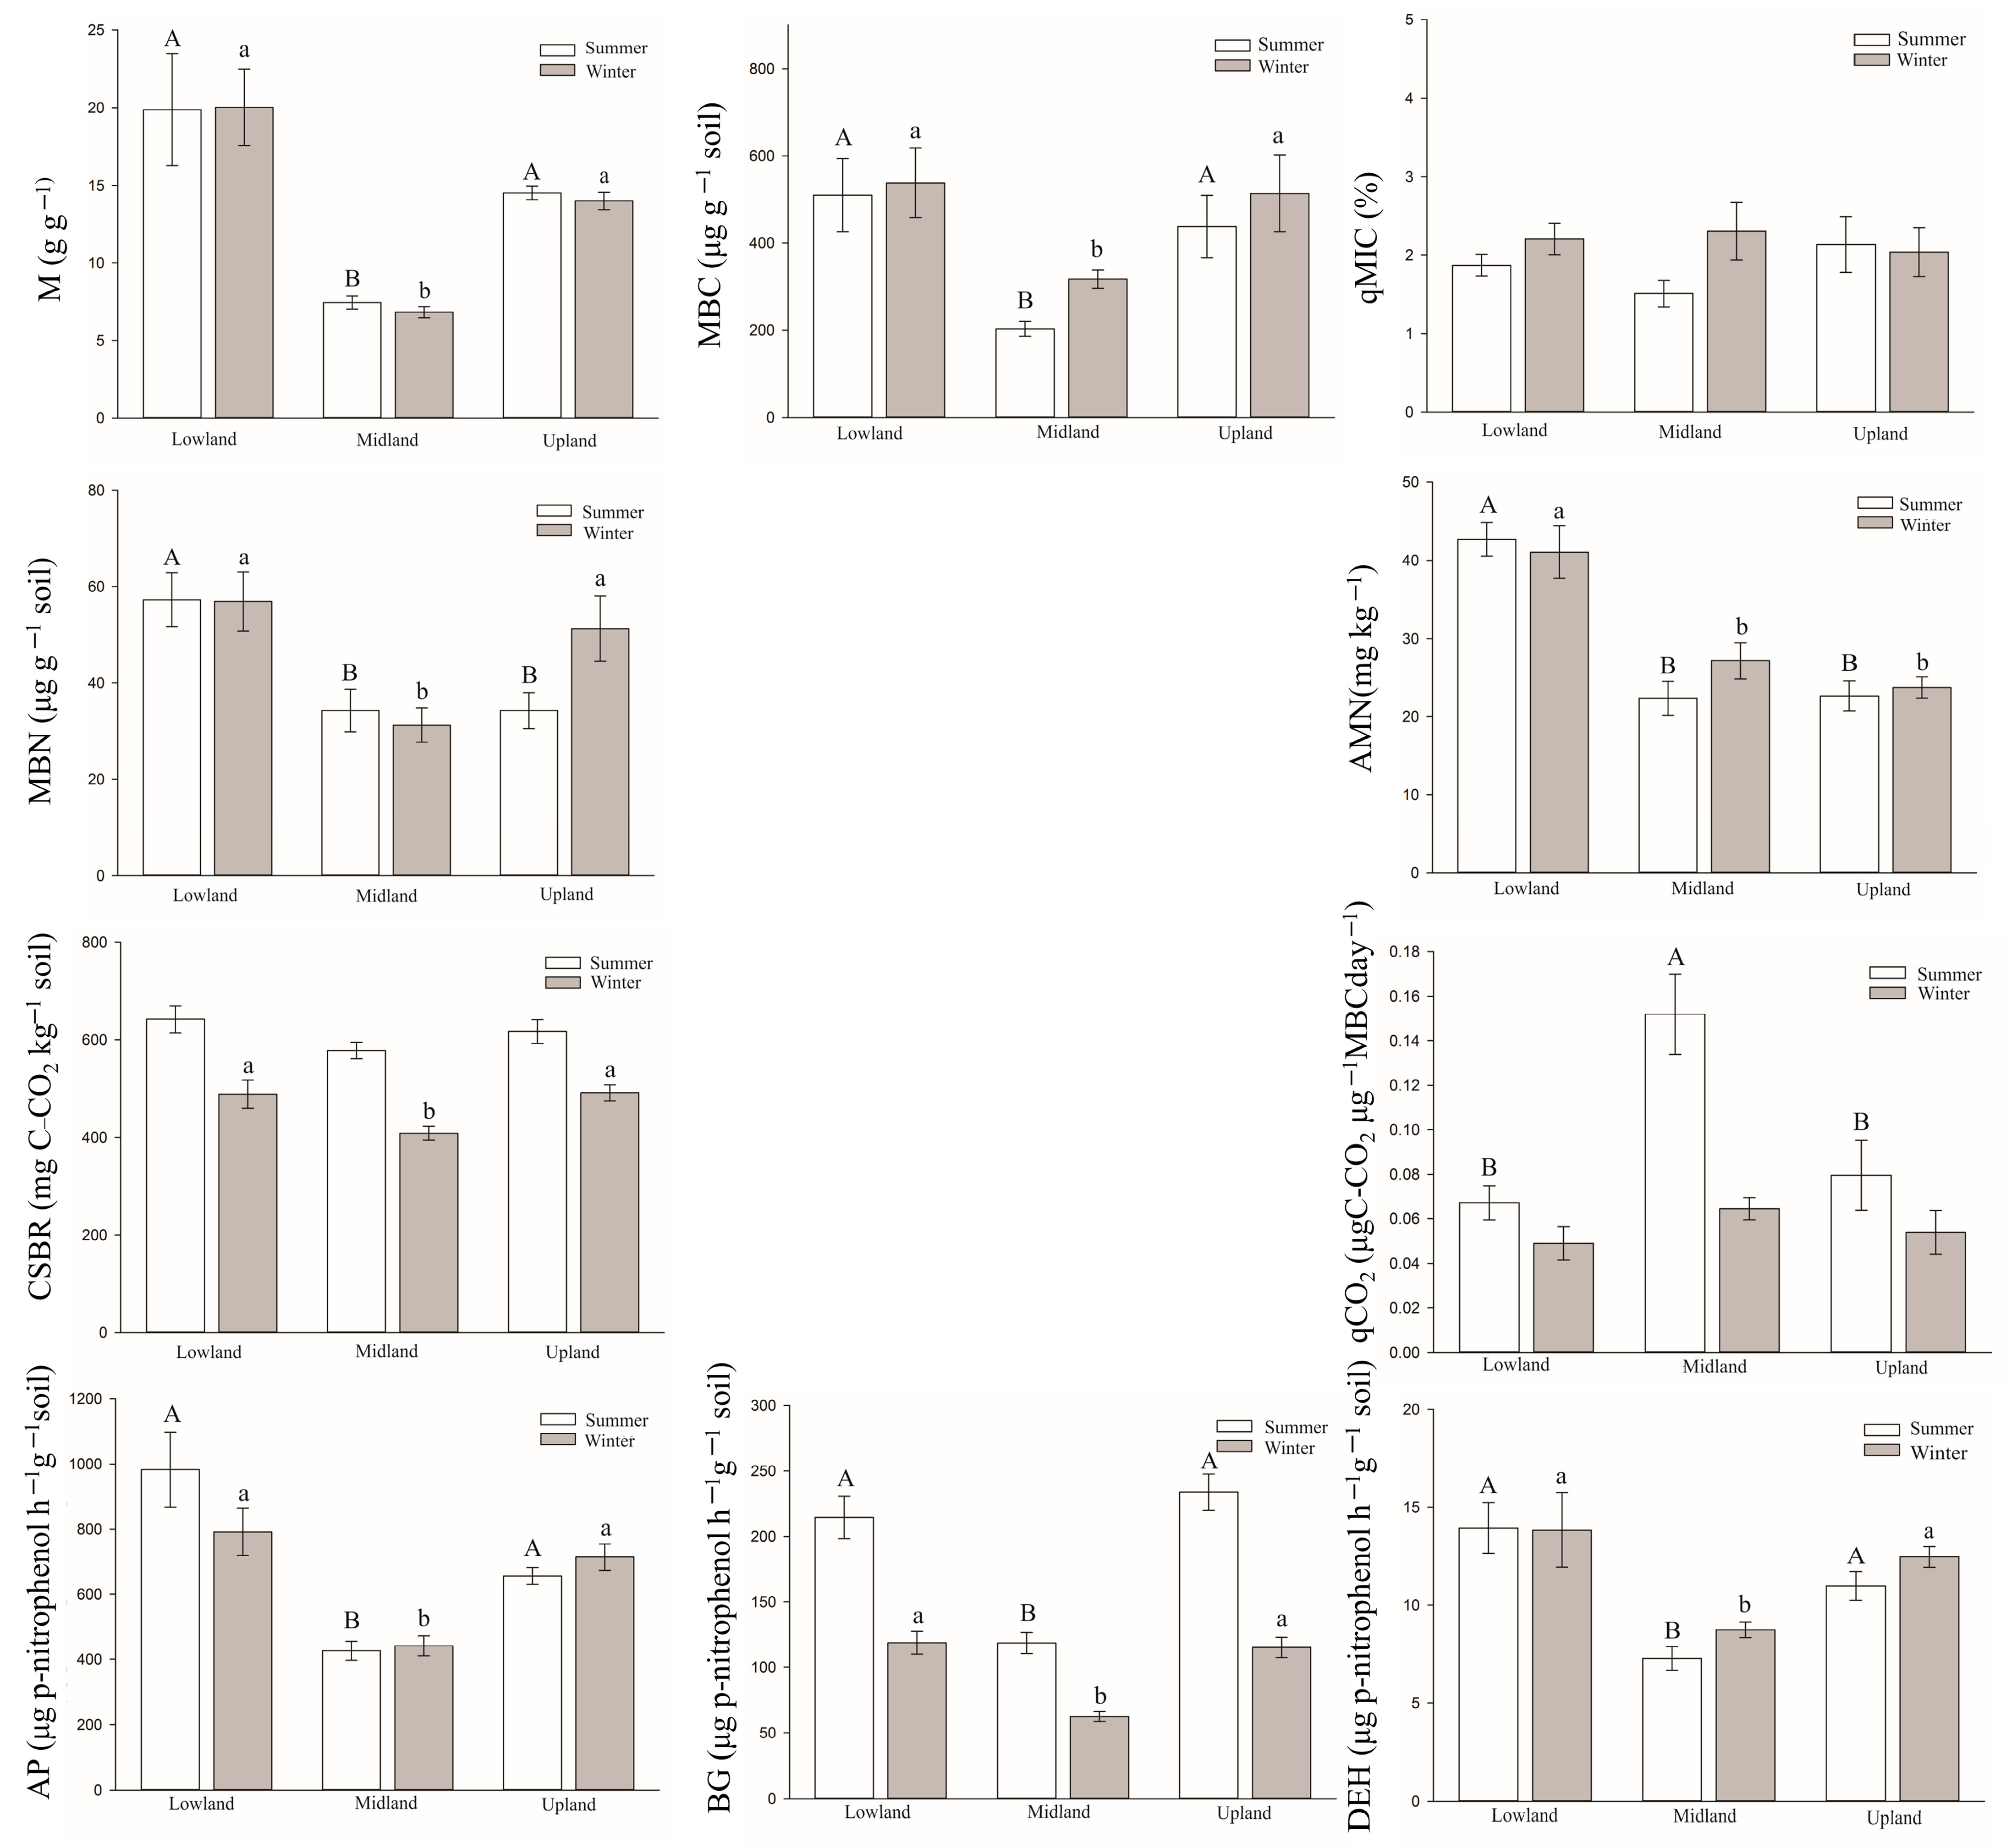
The soil moisture showed a significant season effect (p < 0.05), with higher values observed during the summer (e.g., February, with a mean rainfall of 57.2 mm) (Figure 3). Conversely, during the winter, the decrease in soil moisture coincided with reduced rainfall levels (e.g., August, with a mean rainfall of 2.8 mm). Specifically, the midland region exhibited lower soil moisture content in both summer (7.43 ± 0.42 g g−1) and winter (6.81 ± 0.35 g g−1) seasons (Figure 4). The MBC contents were inversely proportional to the soil moisture, being higher during the winter (drier) (p = 0.01) along the topographic gradient (Figure 3). The midland had lower MBC in both summer (203.03 ± 17.03 μg g−1 soil) and winter seasons (317.57 ± 21.00 μg g−1 soil) (Figure 4).
The acid phosphatase activity (AP) and dehydrogenase activity (DEH) were not affected by the seasons throughout the year (Figure 3), with the lowest AP and DEH values associated with midland soils in the summer (425.84 ± 29.39 μg p-nitrophenol h−1g−1 soil and 7.26 ± 0.60 μg g−1 soil TTF, respectively) (Figure 4). The β-glucosidase activity was higher in the summer (p < 0.001) along the topographic gradient (Figure 3), with the lowest values associated with midland in both summer and winter seasons (Figure 4).
The MBN and AMN were not affected by the season (p > 0.05) (Figure 3). In the summer, MBN presented the highest values (57.28 ± 5.57 μg g−1 soil) associated with the lowland (Figure 4). AMN presented the highest values associated with the lowland in both summer and winter (42.70 ± 2.14 mg kg−1 and 41.06 ± 3.37 mg kg−1, respectively) (Figure 4). CSBR was higher in the summer (a period of higher water availability) (p < 0.001) (Figure 3), and there was no difference among the lowland, midland, and upland (Figure 4). In the winter, the midland had lower CSBR (Figure 4). The season affected the qMIC (p = 0.05); a trend of increased soil organic C accumulation/input was observed during the winter (Figure 3), and there was no difference among the topographic gradient and the seasons of the year (Figure 4). The qCO2 was higher during the summer, especially in the midland (0.15 ± 0.01 μg C-CO2 μg−1 MBC day−1).
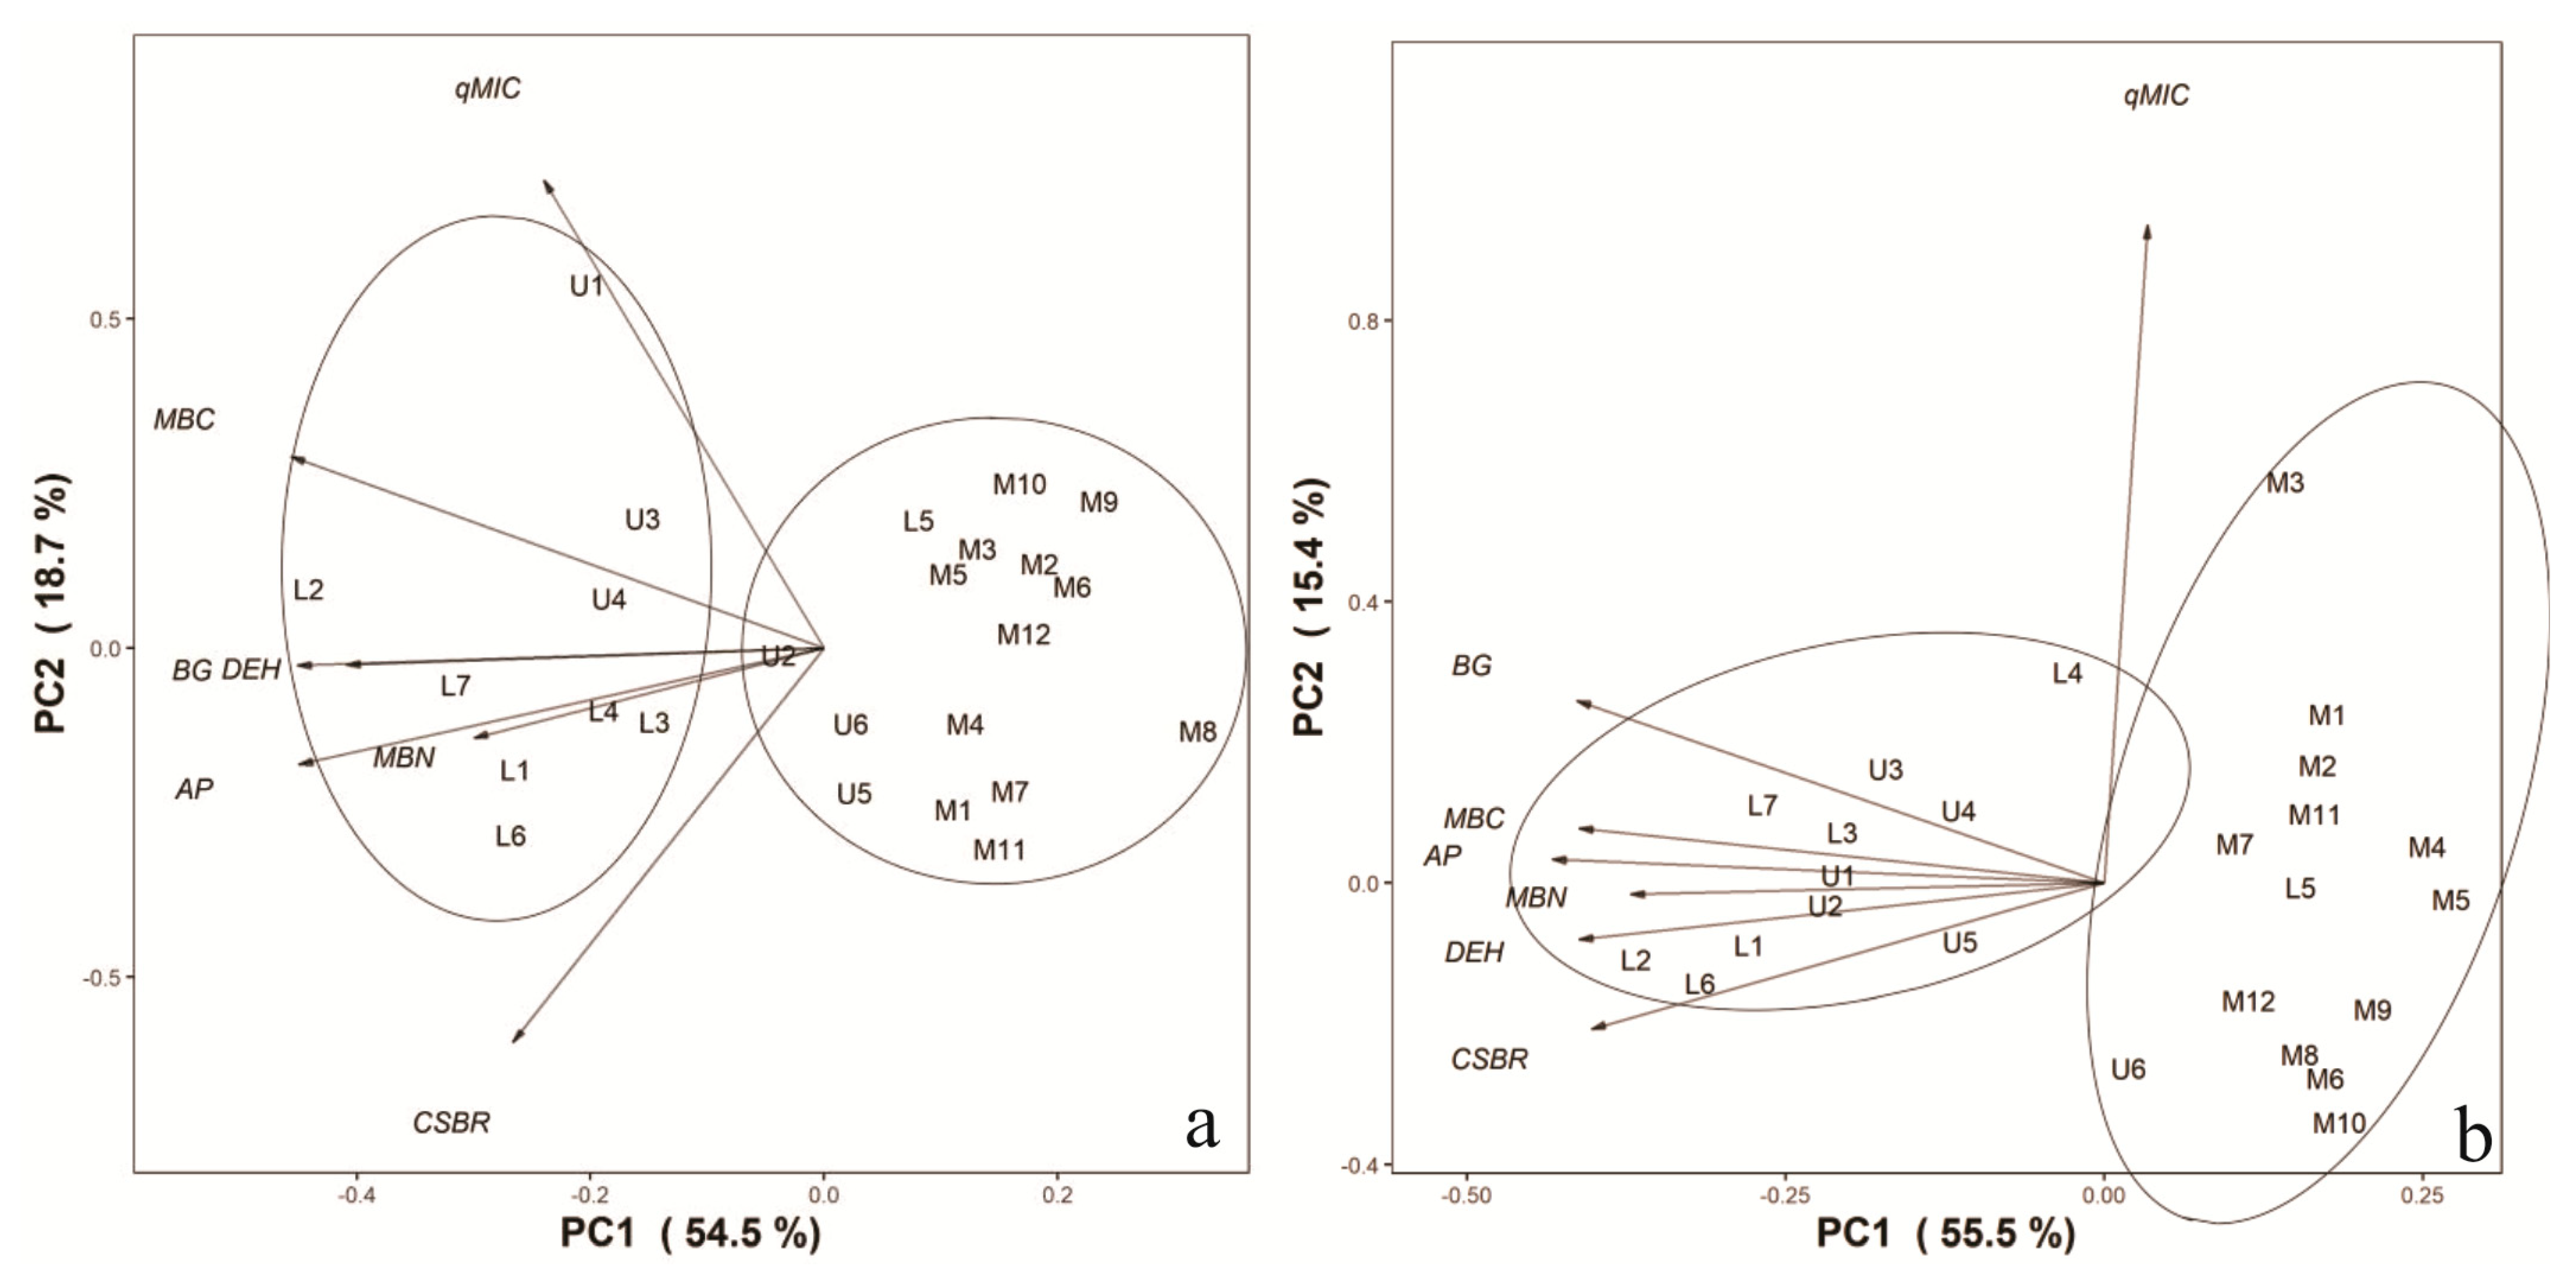
In the principal component analysis, during the summer period, 73.20% of the total variability of the soil biological properties was observed, with 54.48% attributed to the first (PC1) axis and 18.72% to the second (PC2) axis (Figure 5a). PC1 exhibited a negative correlation with the variables MBC, AP, BG, and DEH in the summer, whereas PC2 showed a positive correlation with the qMIC, explaining the data variability in this season. Concerning the winter season, the first two axes accounted for 70.97% of the total data variability, with 55.55% attributed to PC1 and 15.42% to PC2 (Figure 5b). PC1 was negatively correlated with the variables MBC, MBN, CSBR, AP, BG, and DEH, whereas PC2 exhibited a positive correlation with qMIC. The lowland and upland plots showed similarity and were grouped in both the summer and winter seasons (Figure 5a,b).
The redundancy analysis of biological properties (Figure 6a,b) was performed to identify the topographic predictor variables influencing the distribution pattern of soil biological properties. For the summer season, the selected variable was slope, which was found to be significant (p = 0.001) and maximized the adjusted R2 value = 0.39. In the winter season, once again, the selected variable was slope (R2 adjusted = 0.29 and p = 0.001). Overall, during the summer season, the RDA1 axis explained 41.64% of the total data variability (Figure 6a), whereas in the winter period, the RDA1 axis accounted for 32.75% of the total data variability (Figure 6b).

3.2. Relationship between Chemical, Physical, Biological, and Topographical Soil Properties

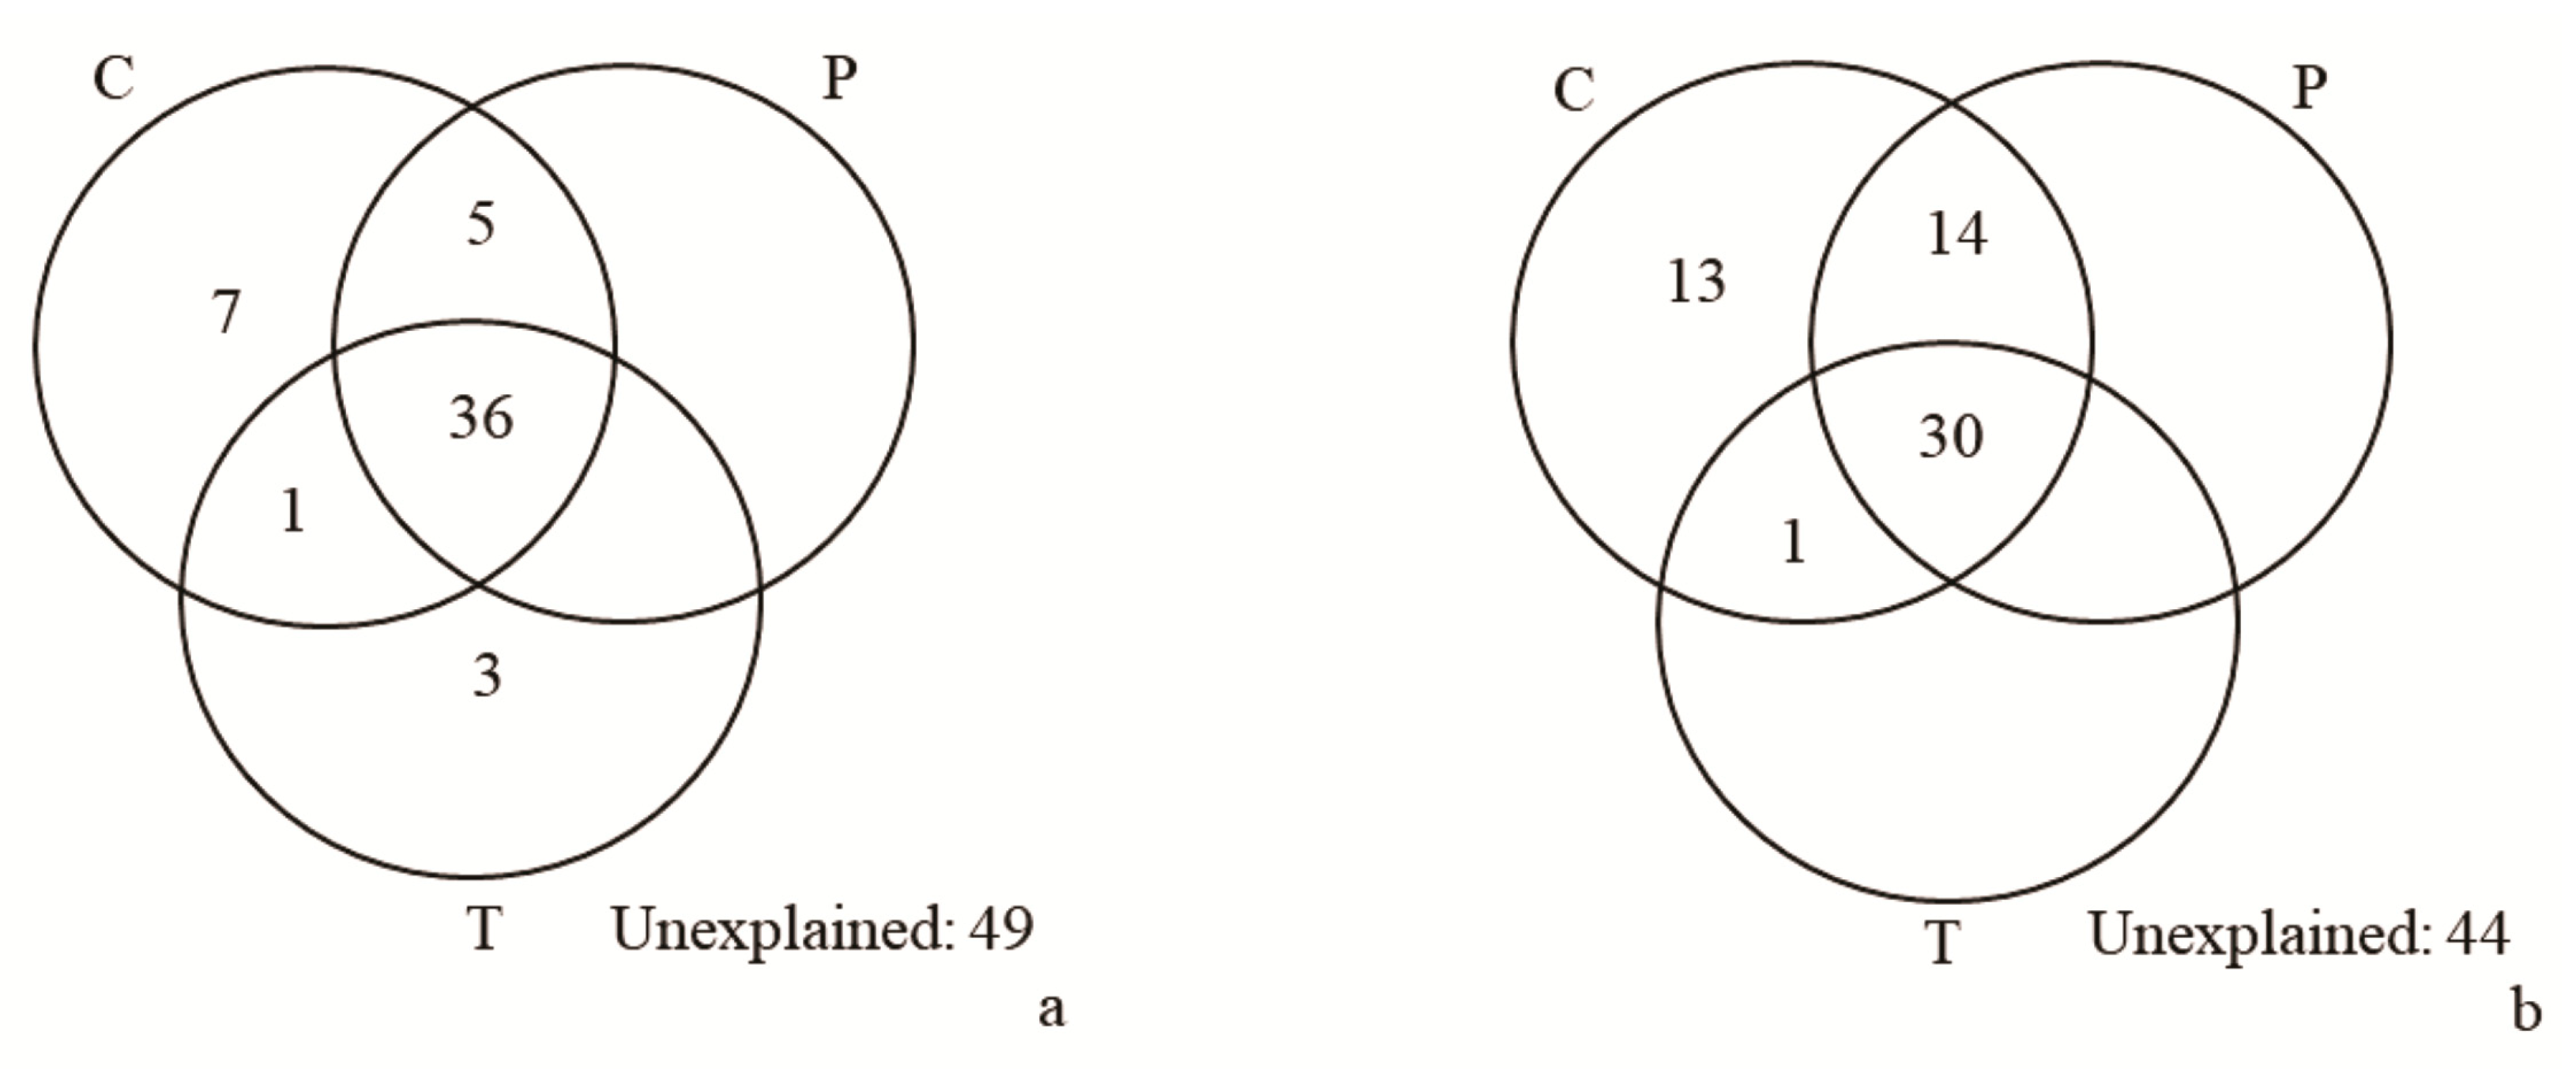
In the partial redundancy analysis (pRDA), chemical and physical soil properties were used at a depth of 0.0–0.10 m (Table S1), the soil biological properties were quantified in both summer and winter (Figure 5), and topographic variables were considered (Table 1). The pRDA results indicated that 36% of the total variance explained (TVE), which was 50.5%, could be attributed to the interaction among chemical, physical, and topographic properties in the summer (Table 2). The overall model was significant (adjusted R2 = 50.5%, p = 0.0001). However, when considering only the chemical properties individually (while controlling for the effects of physical and topographic properties), they played a more substantial role in explaining the variation in biological properties (adjusted R2 = 7%, p = 0.02) (Table 2, Figure 7a). In the winter, 30% of the TVE, which was 55.9%, was explained by the interaction among chemical, physical, and topographic properties (Table 2). The overall model was significant (R2 = 55.9%, p = 0.0001). However, when considering only the chemical properties (while controlling for the effects of physical and topographic properties), they still had a greater influence on explaining the variation in biological properties in the winter (R2 = 13%, p = 0.0001) (Table 2, Figure 7b). Individually, physical, and topographical properties (while controlling for other effects) had no impact on the variation in biological properties.
In the present study, TOC showed a positive correlation with MBC in both summer and winter seasons (r = 0.81; p < 0.001 and r = 0.64; p < 0.001, respectively), as well as with AP in both seasons (r = 0.81; p < 0.001 and r = 0.45; p < 0.05, respectively). Additionally, TOC exhibited a positive correlation with BG in the summer (r = 0.73; p < 0.001) and with DEH in both summer and winter seasons (r = 0.74; p < 0.001 and r = 0.40; p < 0.05, respectively). The exchangeable calcium content showed a positive correlation with DEH (r = 0.67, p < 0.001 and r = 0.68, p < 0.001 in the summer and winter, respectively). Similarly, the Mg content showed a positive correlation with DEH (r = 0.56, p < 0.01 and r = 0.53, p < 0.01 in the summer and winter, respectively). The pH, on the other hand, displayed a negative correlation with elevation in both summer and winter seasons (r = −0.75; p < 0.001 in both seasons).

4. Discussion

In tropical forests, high litterfall rates combined with decomposition rates reduced during the dry season, resulting in soil organic matter accumulation [48,49]. In addition, the dry season followed by rainfall causes osmotic stress, thereby promoting cell lysis and resulting in pulses of nutrient release [50,51]. The inverse relationship between MBC and soil moisture in the winter (Figure 4) may be related to the occurrence of nutrients readily available in the soils (from the labile fraction of organic matter and dead microorganisms during the dry period). Precipitation events in the days prior to sampling may have also stimulated microbial activity [52], especially during a period with a mean temperature of 25 °C and a mean maximum temperature of 35.7 °C (Figure 2). Other studies have also indicated the effect of soil moisture on soil microbial biomass [8,51].
Enzymatic activity may increase as soil organic matter increases, depending on microbial activity’s dependence on the carbon provided in the substrate [53]. Several enzymes, including β-glucosidase, may be stabilized and retained on the clay mineral surface, humic acids, and soil organic matter particles [53,54,55]. The increased soil basal respiration in the summer was enhanced by optimal soil moisture levels and hydric availability, in addition to the optimal temperature conditions; consequently, C mineralization was favored. This is possibly associated with the high lability of the residues added to the soils [56]. Additionally, the enzymes mediating soil organic matter decomposition are linked to the microbial community composition, which may exhibit a strong seasonal pattern [57]. Carney [58] showed that high C input derived from roots changed the microbial community, increasing the fungi community and promoting greater soil organic matter decomposition. According to Brechet [59], basal respiration is driven not only by water availability but also by variations in light and nutrient availability in the soil. Therefore, the decreased microbial respiration and increased microbial biomass C during the winter (dry season) indicate that in the winter, soil microbial biomass was immobilizing nutrients in its tissue rather than mineralizing them.
In the midland, there is a greater energy expenditure for maintaining the microbial population, mainly due to the stress conditions; microorganisms consume more substrate to survive. According to Jakelaitis [60], the highest qCO2 value in the midland indicates that the soil presents a higher degree of disturbance or a microbial population under unfavorable conditions. The decreased qCO2 values in the driest season (winter) correspond to increased microbial biomass efficiency in immobilizing C and nutrients in the soils. Increased qCO2 values in the summer (higher rainfall) indicate that more C is mineralized than immobilized in the environment. This pattern could be linked to changes in the soil microbial community, particularly the fungi-to-bacteria ratio [52,56]. These results confirm the findings of Rangel-Vasconcellos [52] regarding the evaluation of soil microbial biomass and its activity in a chronosequence (2, 6, and 14 years) of secondary vegetation in dry and rainy seasons in the Eastern Amazon.
The highest MBN and AMN values in the lowland may be justified by microbial activity (DEH values), organic material content, and quality added to the soil, allowing larger increases in N content in the microbial biomass [61,62]. These results may also be attributed to the greater availability of nutrients in the low-lying areas, as well as the deposition of transported sediments from elevated regions that have undergone erosion [21,63]. Nitrogen absorbed by the plants is highly associated with the mineralized N content, and the main factors affecting N mineralization are soil organic matter recalcitrance degree, microbial activity, and soil management [64]. Lowland soils have varying degrees of hydromorphism; however, ammonification may occur under low aeration conditions via facultative aerobic and/or anaerobic microorganisms [65], enabling organic N conversion into N-NH4+ in humid environments. Gonçalves [61] reported AMN values of 106 and 214 mg kg−1 in the 0–0.15 m layer in the submontane Atlantic Forest in São Paulo state, Brazil. These results were higher than those recorded by Vasconcellos [62], the authors verified a content equal to 92.41 ± 6.2 µg g−1, at the 0–0.20 m depth, in an Atlantic Forest area (seasonal semi-deciduous forest). They demonstrate the importance of the organic matter quality, especially N for microbial biomass.
The similarity between the lowland and upland for biological activity may be explained primarily by differences in hydromorphism degree in the lowland plots because micro-elevations in some plots provided a microclimate favorable to microorganisms like the upland. This behavior indicates that the distribution of soil biological properties associated with soil nutrient cycling showed a strong dependence on topography, producing soil moisture gradients favorable to microbial activity. According to Fisk [66], nutrient cycling processes are related to moisture variations, among the terrain’s high parts, which tend to have better drainage, and low areas where moisture is usually higher. In well-drained soils, the rate of leaf tissue degradation may be higher than that in environments with higher moisture, implying anaerobic conditions [67]. Slow litterfall decomposition, particularly in midland soils, leads to increased basic cation immobilization and other nutrients, such as N and P [68], reducing these nutrients’ availability to the plants. This immobilization increases soil nutrient and acidification limitations [69].
The redundancy analysis indicates that the soil biological properties distribution model was primarily associated with terrain slope. Other topographic variables may also cause this heterogeneity, for example, solar incidence and surface exposure, among others. Areas with high slopes (midland) commonly have higher terrain instability resulting from high vulnerability in response to the water action [18,63], affecting the microclimate, surface runoff, and evapotranspiration [53], as well as the soil’s chemical and biological properties [18]. In addition, midland soils may decrease plant regeneration rate; consequently, there will be lower organic matter content and hydrolytic enzyme activity [63]. The soils in the lowest positions in the toposequence (haplic gleysol), provide high C levels and energy to soil microbial populations, thereby increasing microbial biomass and microbial activity [18].
Physical and topographic properties, individually, had no direct effect on the variation of the biological properties, evidencing that the biological properties are modified by the soil chemical properties along the topographic gradient in the Atlantic Forest biome. However, the results showed that chemical properties, individually, explained the biological properties variation (B~C|P∪T), and the total variance explained was significant in both seasons (summer and winter). This behavior suggests that the physical and topographic variables increase the chemical variables’ explanatory power to some extent. The associated topography and textural variations may affect the decomposition rates and soil nutrient transformations [70].
The highest positions of topographic gradients of tropical forests have strong nutrient limitations resulting from the constant loss of nutrients towards lowland areas, which changes nutrient cycling and the ecosystem structure in the landscape [14]. These factors may also induce fluctuations in the microbial population via changes in soil chemistry, and may affect their capacity to use organic C, thereby restricting the potential net gains in the soil C storage [57,58]. Other authors found a positive correlation between soil chemical properties and biological properties, thereby suggesting an increased effect of these properties on the soil biological properties variation [71,72]. Soil C levels and enzymatic activity are positively correlated [71]. Increased soil levels of Ca2+, Mg2+, K+, and C are associated with high values of soil DEH activity [73].
These findings indicate the importance of knowing the soil–landscape relationship, especially regarding soil biology activity, to establish strategic conservation and environmental restoration measures in already weakened ecosystems and to promote the sustainable use, and management of natural resources under tropical climate. The seasonal plant cycles may affect soil C and N availability in the soil as well as the microbial population that feeds on soil organic matter and consequently, plant-available N is also affected [57]. Accordingly, measures pertaining to the planting of species that decrease the C/N ratio, for example, may help increase soil microbial activity and maximize nutrient cycling in the environment [62].

5. Conclusions

Our data provide a database of potentially useful information to increase the knowledge about the soil’s biological activity, especially regarding the understanding of the processes that regulate nutrient availability to the vegetation and their spatial variation. Overall, the distribution of soil biological properties associated with soil nutrient cycling showed a strong dependence on topography by producing soil moisture gradients favorable to microbial activity. The terrain slope conditioned lower soil microbial activity and lower organic cycling in the midland (larger slope position). In the regions of low altitude at the Atlantic Forest (up to 500 m), occasional rainfall and mild temperatures in the dry season (winter) lead to significant increases in microbial biomass carbon. High total organic carbon, exchangeable calcium, and magnesium in the lowland soils were positively correlated with soil enzymatic activity in the Sea of Hills region of Southeastern Brazil. Soil biological properties were affected by the seasonality and soil chemical properties in the toposequence. There were considerable differences in the soil biological properties in short distances (750 m), associated with small elevation ranges (100 to 180 m) in the Sea of Hills region, in the Atlantic Forest biome.

Supplementary Materials

The following supporting information can be downloaded at: https://www.mdpi.com/article/10.3390/d15101097/s1, Table S1: Average and Standard Error of Soil Chemical and Physical Properties at a Depth of 0.0–0.10 m Along a Topographic Gradient in the Atlantic Forest, Brazil.

Author Contributions

Conceptualization, E.d.S.M. and D.L.B.; methodology, L.V.M. and D.L.B.; software, L.V.M.; validation, E.d.S.M., D.L.B. and T.C.d.S.; formal analysis, L.V.M. and D.L.B.; investigation, E.d.S.M., D.L.B. and T.C.d.S.; resources, E.d.S.M. and D.L.B.; data curation, L.V.M. and E.d.S.M.; writing—original draft preparation, E.d.S.M.; writing—review and editing, E.d.S.M., D.L.B. and T.C.d.S.; visualization, E.d.S.M., D.L.B. and T.C.d.S.; supervision, E.d.S.M.; project administration E.d.S.M.; funding acquisition, E.d.S.M. All authors have read and agreed to the published version of the manuscript.

Funding

This research was funded by FAPES/VALE/FAPERJ (Grant No. 01/2015—Pelotização, Meio Ambiente e Logística, Process number 527/2016).

Institutional Review Board Statement

Not applicable.

Data Availability Statement

Not applicable.

Acknowledgments

The authors thank the Centre for Agricultural Sciences and Engineering of the Federal University of Espírito Santo (CCAE-UFES) for the infrastructure and transportation support, the Espírito Santo Research Foundation (FAPES) for funding, the Brazilian Federal Agency for the Support and Evaluation of Graduate Education (CAPES) for granting the DSc. scholarship to the third author, the management team of Mata das Flores State Park for the logistic support provided for this study, and the National Institute of Meteorology (INMET) for providing the meteorological parameters.

Conflicts of Interest

The authors declare no conflict of interest.

References

  1. Myers, N.; Mittermeier, R.A.; Mittermeier, C.G.; da Fonseca, G.A.B.; Kent, J. Biodiversity hotspots for conservation priorities. Nature 2000, 403, 853–858. [Google Scholar] [CrossRef]
  2. Martini, A.M.Z.; Fiaschi, P.; Amorim, A.M.; Paixão, J.L. A hot-point within a hot-spot: A high diversity site in Brazil’s Atlantic Forest. Biodivers. Conserv. 2007, 16, 3111–3128. [Google Scholar] [CrossRef]
  3. Mittermeier, R.A.; Turner, W.R.; Larsen, F.W.; Brooks, T.M.; Gascon, C. Global Biodiversity Conservation: The Critical Role of Hotspots. In Biodiversity Hotspots; Zachos, F.E., Habel, J.C., Eds.; Springer: Berlin/Heidelberg, Germany, 2011. [Google Scholar] [CrossRef]
  4. SOS Mata Atlântica/Inpe, Fundação SOS Mata Atlântica/Instituto Nacional de Pesquisas Espaciais, Nossas causas—Mata Atlântica. Available online: https://www.sosma.org.br/nossas-causas/mata-atlantica/ (accessed on 15 July 2018).
  5. Cunha, G.M.; Gama-Rodrigues, A.C.; Gama-Rodrigues, E.F.; Velloso, A.C.X. Biomass, carbon and nutrient pools in montane atlantic forests in the north of Rio de Janeiro state, Brazil. Rev. Bras. Ciência Solo 2009, 33, 1175–1185. [Google Scholar] [CrossRef]
  6. Portugal, A.F.; Costa, O.D.V.; Costa, L.M. Physical and chemical properties of a soil under different production systems and forest in the Zona da Mata region of Minas Gerais state (Brazil). Rev. Bras. Ciência Solo 2010, 34, 575–585. [Google Scholar] [CrossRef]
  7. Powell, J.R.; Craven, D.; Eisenhauer, N. Recent trends and future strategies in soil ecological research: Integrative approaches at Pedobiologia. Pedobiologia 2014, 57, 1–3. [Google Scholar] [CrossRef]
  8. Alves, T.S.; Campos, L.L.; Neto, N.E.; Matsuoka, M.; Loureiro, M.F. Biomass and soil microbial activity under native vegetation and different soil managements. Acta Sci. Agron. 2011, 33, 341–347. [Google Scholar] [CrossRef]
  9. Silva, C.F.; Pereira, M.G.; Miguel, D.L.; Feitora, J.C.F.; Loss, A.; Menezes, C.E.G.; Silva, E.M.R. Total organic carbon, microbial biomass and soil enzyme activity areas of agriculture, forestry and grassland in the middle Valley of Paraíba do Sul River (RJ). Rev. Bras. Ciência Solo 2012, 36, 1680–1689. [Google Scholar] [CrossRef]
  10. Silva, I.R.; Mendonça, E.S. Matéria Orgânica do Solo. In Fertilidade do Solo; Novais, R.F., Alvarez, V.V.H., Barros, N.F., Fontes, R.L.F., Cantarutti, R.B., Neves, J.C.L., Eds.; Sociedade Brasileira de Ciência do Solo (SBCS): Viçosa, Brazil, 2007. [Google Scholar]
  11. Ab’Sáber, A.N. Domínios morfoclimáticos e solos do Brasil. In O Solo nos Grandes Domínios Morfoclimáticos do Brasil e o Desenvolvimento Sustentado; Alvarez, V.V.H., Fontes, L.E.F., Fontes, M.P.F., Eds.; Sociedade Brasileira de Ciência do Solo, UFV: Viçosa, Brazil, 1996; pp. 1–18. [Google Scholar]
  12. Almeida Pacheco, A.; Carlos Ker, J.; Ernesto Gonçalves Reynaud Schaefer, C.; Paulo Ferreira Fontes, M.; Vaz Andrade, F.; de Souza Martins, E.; Soares de Oliveira, F. Mineralogy, micromorphology, and genesis of soils with varying drainage along a hillslope on granitic rocks of the Atlantic Forest Biome, Brazil. Article Rev Bras Cienc Solo 2018, 42, 170291. [Google Scholar] [CrossRef]
  13. Ab’Sáber, A.N. Os Domínios de Natureza no Brasil: Potencialidades Paisagísticas; Ateliê Editorial: São Paulo, Brazil, 2003. [Google Scholar]
  14. Santos, A.C.; Pereira, M.G.; Anjos, L.H.C.; Bernini, T.A.; Cooper, M.; Nummer, A.R.; Francelino, M.R. Soil genesis and classification in the environment “Mar de Morros” in the mid-valley of the river Paraiba do Sul, RJ. Rev. Bras. Ciência Solo 2010, 34, 1297–1314. [Google Scholar] [CrossRef]
  15. Gessler, P.E.; McKenzie, N.J.; Hutchinson, M.F. Progress in soil-landscape modeling and spatial prediction of soil attributes for environmental models. In Proceedings of the Third International Conference/Workshop on Integrating GIS and Environmental Modeling, Santa Barbara, CA, USA, 21–25 January 1996; National Center for Geographic Information and Analysis: Sante Fe, NM, USA, 1996; pp. 21–26. [Google Scholar]
  16. Jucker, T.; Bongalov, B.; Burslem, D.F.R.P.; Nilus, R.; Dalponte, M.; Lewis, S.L.; Phillips, O.L.; Qie, L.; Coomes, D.A. Topography shapes the structure, composition and function of tropical forest landscapes. Ecol. Lett. 2018, 21, 989–1000. [Google Scholar] [CrossRef]
  17. Muscarella, R.; Kolyaie, S.; Morton, D.C.; Zimmerman, J.K.; Uriarte, M. Effects of topography on tropical forest structure depend on climate context. J. Ecol. 2019, 108, 145–159. [Google Scholar] [CrossRef]
  18. Khalili-Rad, M.; Nourbakhsh, F.; Jalalian, A.; Eghbal, M.K. The effects of slope position on soil biological properties in an eroded 510 toposequence. Arid. Land Res. Manag. 2011, 25, 308–312. [Google Scholar] [CrossRef]
  19. Li, X.; McCarty, G.W.; Karlen, D.L.; Cambardella, C.A. Topographic metric predictions of soil redistribution and organic carbon in Iowa cropland fields. Catena 2018, 160, 222–232. [Google Scholar] [CrossRef]
  20. Gibbons, J.M.; Newbery, D.M. Drought avoidance and the effect of local topography on trees in the understorey of Bornean lowland rain forest. Plant Ecol. 2003, 164, 1–18. [Google Scholar] [CrossRef]
  21. Rodrigues, A.C.; Villa, P.M.; Ferreira-Júnior, W.G.; Schaefer, C.E.R.; Neri, A.V. Effects of topographic variability and forest attributes on fine-scale soil fertility in late-secondary succession of Atlantic Forest. Ecol. Process 2021, 10, 62. [Google Scholar] [CrossRef]
  22. Balvanera, P.; Quijas, S.; Pérez-Jiménez, A. Distribution patterns of tropical dry forest trees along a mesoscale water availability gradient. Biotropica 2011, 43, 414–422. [Google Scholar] [CrossRef]
  23. O’Brien, M.J.; Escudero, A. Topography in tropical forests enhances growth and survival differences within and among species via water availability and biotic interactions. Funct. Ecol. 2021, 36, 686–698. [Google Scholar] [CrossRef]
  24. Liu, Y.; Zhang, L.P.; Lu, J.K.; Chen, W.M.; Wei, G.H.; Lin, Y.B. Topography affects the soil conditions and bacterial communities along a restoration gradient on Loess-Plateau. Appl. Soil Ecol. 2020, 150, 103471. [Google Scholar] [CrossRef]
  25. Zhang, N.; Xu, W.; Yu, X.; Lin, D.; Wan, S.; Ma, K. Impact of topography, annual burning, and nitrogen addition on soil microbial communities in a semiarid grassland. Soil Sci. Soc. Am. J. 2013, 77, 1214–1224. [Google Scholar] [CrossRef]
  26. Oliveira-Filho, A.T.; Fontes, M.A.L. Patterns of Floristic Differentiation among Atlantic Forests in Southeastern Brazil and the 523 Influence of Climate. Biotropica 2000, 32, 793–810. [Google Scholar] [CrossRef]
  27. Instituto Brasileiro de Geografia e Estatística (IBGE). Mapas de Biomas e de Vegetação. 2004. Available online: http://www.ibge.gov.br/home/presidencia/noticias/21052004biomashtml.shtm (accessed on 14 February 2020).
  28. Hollunder, R.K.; Martins, K.G.G.; Luber, J.; Ferreira, R.S.; Carrijo, T.T.; Mendonça, E.D.S.; Garbin, M.L. Associação entre espécies de sub-bosque e variação topográfica em um fragmento de Floresta Atlântica no Estado do Espírito Santo. Acta Sci. Tech. 2014, 2, 35–40. [Google Scholar] [CrossRef]
  29. Luber, J.; Tuler, A.C.; Torres, F.; Christ, J.A.; Guidoni-Martins, K.G.; Zanetti, M.; Hollunder, R.K.; Manhães, V.C.; Zorzanelli, J.P.F.; Mendonça, E.S.; et al. List of angiosperm species in an Atlantic Forest fragment reveals collection gaps in Espírito Santo state, Brazil. Check List 2016, 12, 1835. [Google Scholar] [CrossRef]
  30. Alvares, C.A.; Stape, J.L.; Sentelhas, P.C.; Gonçalves, J.L.M.; Sparovek, G. Koppen’s climate classification map for Brazil. Meteorol. Z. 2013, 22, 711–728. [Google Scholar] [CrossRef]
  31. Instituto Nacional de Meteorologia (INMET). Seção de Armazenamento de Dados Meteorológicos (SADMET). 2015. Available online: http://www.inmet.gov.br/portal/ (accessed on 8 March 2020).
  32. Enviromental Systems Rechearch Institute (ESRI). ArcGIS for Windows Version 10.3; Licence type ArcInfo; [S.I]: ESRI—Enviromental Systems Rechearch Institute: Redlands, CA, USA, 2015. [Google Scholar]
  33. Santos, H.G.; Jacomine, P.K.; Anjos, L.H.C.; Oliveira, V.A.; Lumbreras, J.F.; Coelho, M.R.; Almeida, J.A.; Cunha, T.J.F.; Oliveira, J.B. Sistema Brasileiro de Classificação de Solos, 3rd ed.; Revista e Ampliada; Embrapa: Brasília, Brazil, 2013. [Google Scholar]
  34. Keeney, D.R.; Nelson, D.W. Nitrogen inorganic forms. In Methods of Soil Analysis, Part 2, Chemical and Microbiological Properties; Page, A.L., Ed.; American Society of Agronomy: Madison, WI, USA, 1982; pp. 643–698. [Google Scholar]
  35. Yeomans, J.C.; Bremner, J.M. A rapid and precise method for routine determination of organic carbon in soil. Commun. Soil Sci. Plant Anal. 1988, 19, 1467–1476. [Google Scholar] [CrossRef]
  36. Islam, K.R.; Weil, R.R. Microwave irradiation of soil for routine measurement of microbial biomass carbon. Biol. Fertil. Soils 1998, 27, 408–416. [Google Scholar] [CrossRef]
  37. Sparling, G.P. Ratio of microbial biomass carbon to soil organic carbon as a sensitive indicator of changes in soil organic matter. Aust. J. Soil Res. 1992, 30, 195–207. [Google Scholar] [CrossRef]
  38. Empresa Brasileira de Pesquisa Agropecuária (EMBRAPA). Manual de Métodos de Análise de Solos; Donagema, G.K., Campos, D.V.B., Calderano, S.B., Teixeira, W.G., Viana, J.H.M., Eds.; Dados Eletrônicos; Embrapa Solos: Rio de Janeiro, Brazil, 2011. [Google Scholar]
  39. Curl, E.A.; Rodriguez-Kabana, R. Microbial interactions. In Research Methods in Weed Science; Wilkinson, R.E., Ed.; Southern Weed Science Society: Atlanta, GA, USA, 1972; pp. 162–194. [Google Scholar]
  40. Stotzky, G. Microbial respiration. In Methods of Soil Analysis; Black, C.A., Evans, D.D., White, J.L., Ensminger, L.E., Clark, F.E., Eds.; American Society of Agronomy: Madison, WI, USA, 1965; pp. 1550–1570. [Google Scholar]
  41. Anderson, T.H.; Domsch, K.H. The metabolic quotient for CO2 (qCO2) as a specific activity parameter to assess the effects of environmental conditions, such as pH, on the microbial biomass of forest soils. Soil Biol. Biochem. 1993, 25, 393–395. [Google Scholar] [CrossRef]
  42. Tabatabai, M.A. Soil enzymes. In Methods of Soil Analysis: Microbiological and Biochemical Properties; Weaver, R.W., Scott, A., Bottomeley, P.J., Eds.; Soil Science Society of America: Madison, WI, USA, 1994; pp. 778–835. [Google Scholar]
  43. Wilcoxon, F. Individual comparisons by ranking methods. Biom. Bull. 1945, 1, 80–83. [Google Scholar] [CrossRef]
  44. Borcard, D.; Gillet, F.; Legendre, P. Numerical Ecology with R; Springer: New York, NY, USA, 2011. [Google Scholar]
  45. Blanchet, F.G.; Legendre, P.; Borcard, D. Forward selection of explanatory variables. Ecology 2008, 89, 2623–2632. [Google Scholar] [CrossRef] [PubMed]
  46. Legendre, P.; Legendre, L. Numerical Ecology; Developments in Environmental Modeling, 3rd ed.; Elsevier: Amsterdam, The Netherlands, 2012; Volume 24. [Google Scholar]
  47. R Development Core Team. R: A Language and Environment for Statistical Computing; R Foundation for Statistical Computing: Vienna, Austria, 2015; Available online: http://www.R-project.org/ (accessed on 12 September 2022).
  48. Vasconcelos, S.S.; Zarin, D.J.; Rosa, M.B.S.; Oliveira, F.A.; Carvalho, C.J.R. Leaf decomposition in a dry season irrigation experiment in Eastern Amazonian Forest regrowth. Biotropica 2007, 39, 593–600. [Google Scholar] [CrossRef]
  49. Vasconcelos, S.S.; Zarin, D.J.; Araújo, M.M.; Rangel-Vasconcelos, L.G.T.; Carvalho, C.J.R.; Staudhammer, C.L.; Oliveira, F.A. Effects of seasonality, litter removal and dry-season irrigation on litterfall quantity and quality in eastern Amazonian Forest regrowth, Brazil. J. Trop. Ecol. 2008, 24, 27–38. [Google Scholar] [CrossRef]
  50. Yang, L.H.; Bastow, J.L.; Spence, K.O.; Wright, A.N. What can we learn from resource pulses? Ecology 2008, 89, 621–634. [Google Scholar] [CrossRef]
  51. Rangel-Vasconcelos, L.G.T.; Zarin, D.J.; Oliveira, F.A.; Vasconcelos, S.S.; Carvalho, C.J.R.; Santos, M.M.L.S. Effect of water availability on soil microbial biomass in secondary forest in eastern Amazonia. Rev. Bras. Ciência Solo 2015, 39, 377–384. [Google Scholar] [CrossRef]
  52. Rangel-Vasconcelos, L.G.T.; Zarin, D.J.; Carvalho, C.J.R.; Santos, M.M.L.S.; Vasconcelos, S.S.; Oliveira, F.A. Carbon and nitrogen of soil microbial biomass and microbial respiration of secondary vegetation in Eastern Amazônia. Rev. Ciência Agrár. 2005, 44, 49–63. [Google Scholar]
  53. Nahidan, S.; Nourbakhsh, F.; Mosaddeghi, M.R. Variation of soil microbial biomass C and hydrolytic enzyme activities in a rangeland ecosystem: Are slope aspect and position effective? Arch. Agron. Soil Sci. 2015, 61, 797–811. [Google Scholar] [CrossRef]
  54. Burns, R.G.; DeForest, J.L.; Marxsen, J.; Sinsabaugh, R.L.; Stromberger, M.E.; Wallenstein, M.D.; Weintraub, M.N.; Zoppini, A. Soil enzymes in a changing environment: Current knowledge and future directions. Soil Biol. Biochem. 2013, 58, 216–234. [Google Scholar] [CrossRef]
  55. Nannipieri, P.; Kandeler, E.; Ruggiero, P. Enzyme activities and microbiological and biochemical processes in soil. In Enzymes in the Environment: Activity, Ecology, and Application; Burns, R.G., Dick, R.P., Eds.; Marcel Dekker: New York, NY, USA, 2002; pp. 1–33. [Google Scholar]
  56. Pegoraro, R.F.; Silva, I.R.; Novais, R.F.; Barros, N.F.; Fonseca, S. Phenols from lignin, carbohydrates, and amino sugars in litter and cultivated soils with eucalyptus and pasture. Rev. Árvore 2011, 35, 359–370. [Google Scholar] [CrossRef]
  57. Kaiser, C.; Koranda, M.; Kitzler, B.; Fuchslueger, L.; Schnecker, J.; Schweiger, P.; Rasche, F.; Zechmeister-Boltenstern, S.; Sessitsch, A.; Richter, A. Belowground carbon allocation by trees drives seasonal patterns of extracellular enzyme activities by altering microbial community composition in a beech forest soil. New Phytol. 2010, 187, 843–858. [Google Scholar] [CrossRef]
  58. Carney, K.M.; Hungate, B.A.; Drake, B.G.; Megonigal, J.P. Altered soil microbial community at elevated CO2 leads to loss of soil carbon. PENAS 2007, 104, 4990–4995. [Google Scholar] [CrossRef] [PubMed]
  59. Bréchet, L.; Ponton, S.; Roy, J.; Freycon, V.; Couteaux, M.M.; Bonal, D.; Epron, D. Do tree species characteristics influence soil respiration in tropical forests? A test based on 16 tree species planted in monospecific plots. Plant Soil 2009, 319, 235–246. [Google Scholar] [CrossRef]
  60. Jakelaitis, A.; Silva, A.A.; Santos, J.B.; Vivian, R. Quality of soil surface layer under forest, pasture and cropped areas. Pesq. Agropec. Trop. 2008, 38, 118–127. [Google Scholar]
  61. Gonçalves, J.L.M.; Mendes, K.C.F.S.; Sasaki, C.M. Nitrogen mineralization in natural and forest plantation ecosystems of São Paulo state. Rev. Bras. Ciência Solo 2001, 25, 601–616. [Google Scholar] [CrossRef]
  62. Vasconcellos, R.L.F.; Bini, D.; Paula, A.M.; Andrade, J.B.; Bran, E.J.; Cardoso, N. Soil nitrogen, carbon and compaction as limiting factors for the recovery of degraded riparian forests. Rev. Bras. Ciência Solo 2013, 37, 1164–1173. [Google Scholar] [CrossRef]
  63. Sidari, M.; Ronzello, G.; Vecchio, G.; Muscolo, A. Influence of slope aspects on soil chemical and biochemical properties in a Pinus laricio forest ecosystem of Aspromonte (Southern Italy). Eur. J. Soil Biol. 2008, 44, 364–372. [Google Scholar] [CrossRef]
  64. Rhoden, A.C.; Silva, L.S.; Camargo, F.A.O.; Britzke, D.; Benedetti, E.L. Nitrogen mineralization anaerobic in paddy soil from Rio Grande do Sul state, Brazil. Cienc. Rural 2006, 36, 1780–1787. [Google Scholar] [CrossRef]
  65. Cantarella, H. Nitrogênio. In Fertilidade do Solo; Novais, R.F., Alvarez, V.V.H., Barros, N.F., Fontes, R.L.F., Cantarutti, R.B., Neves, J.C.L., Eds.; Sociedade Brasileira de Ciência do Solo: Viçosa, Brazil, 2007; pp. 375–470. [Google Scholar]
  66. Fisk, M.C.; Schmidt, S.K.; Seastedt, T.R. Topographic patterns of above and belowground production and nitrogen cycling in alpine tundra. Ecology 1998, 79, 2253–2266. [Google Scholar] [CrossRef]
  67. Dick, G.; Schumacher, M.V. Relations between soil and phytophysiognomies in natural forests. Enflo 2015, 3, 31–39. [Google Scholar]
  68. Osono, T.; Takeda, H. Accumulation and release of nitrogen and phosphorus in relation to lignin decomposition in leaf litter of 14 tree species. Ecol. Res. 2004, 19, 593–602. [Google Scholar] [CrossRef]
  69. de Schriver, A.; de Frenne, P.; Staelens, J.; Verstraeten, G.; Muys, B.; Vesterdal, L.; Wuyts, K.; van Nevel, L.; Schelfhout, S.; Neve, S.; et al. Tree species traits cause divergence in soil acidification during four decades of post agricultural forest development, Glob. Change Biol. 2012, 18, 1127–1140. [Google Scholar] [CrossRef]
  70. Luizão, R.C.C.; Luizão, F.J.; Paiva, R.Q.; Monteiro, T.F.; Sousa, L.S.; Kruijts, B. Variation of carbon and nitrogen cycling processes along a topographic gradient in a central Amazonian Forest, Glob. Change Biol. 2004, 10, 592–600. [Google Scholar] [CrossRef]
  71. Carneiro, M.A.C.; Siqueira, J.O.; Moreira, F.M.S.; Soares, A.L.L. Soil organic carbon, total nitrogen, microbial biomass and activity in two rehabilitation chronosequences after bauxite mining. Rev. Bras. Ciência Solo 2008, 32, 621–632. [Google Scholar] [CrossRef]
  72. Conte, E.; Anghinoni, I.; Rheinheimer, D.S. Phosphorus in the microbial biomass and acid phosphatase activity by phosphate application in soil under no-tillage system. Rev. Bras. Ciência Solo 2002, 26, 925–930. [Google Scholar] [CrossRef]
  73. Dkhar, M.S.; Mishra, R.R. Dehydrogenase and urease activities of maize (Zea mays L.) field soils. Plant Soil 1983, 70, 327–333. [Google Scholar] [CrossRef]
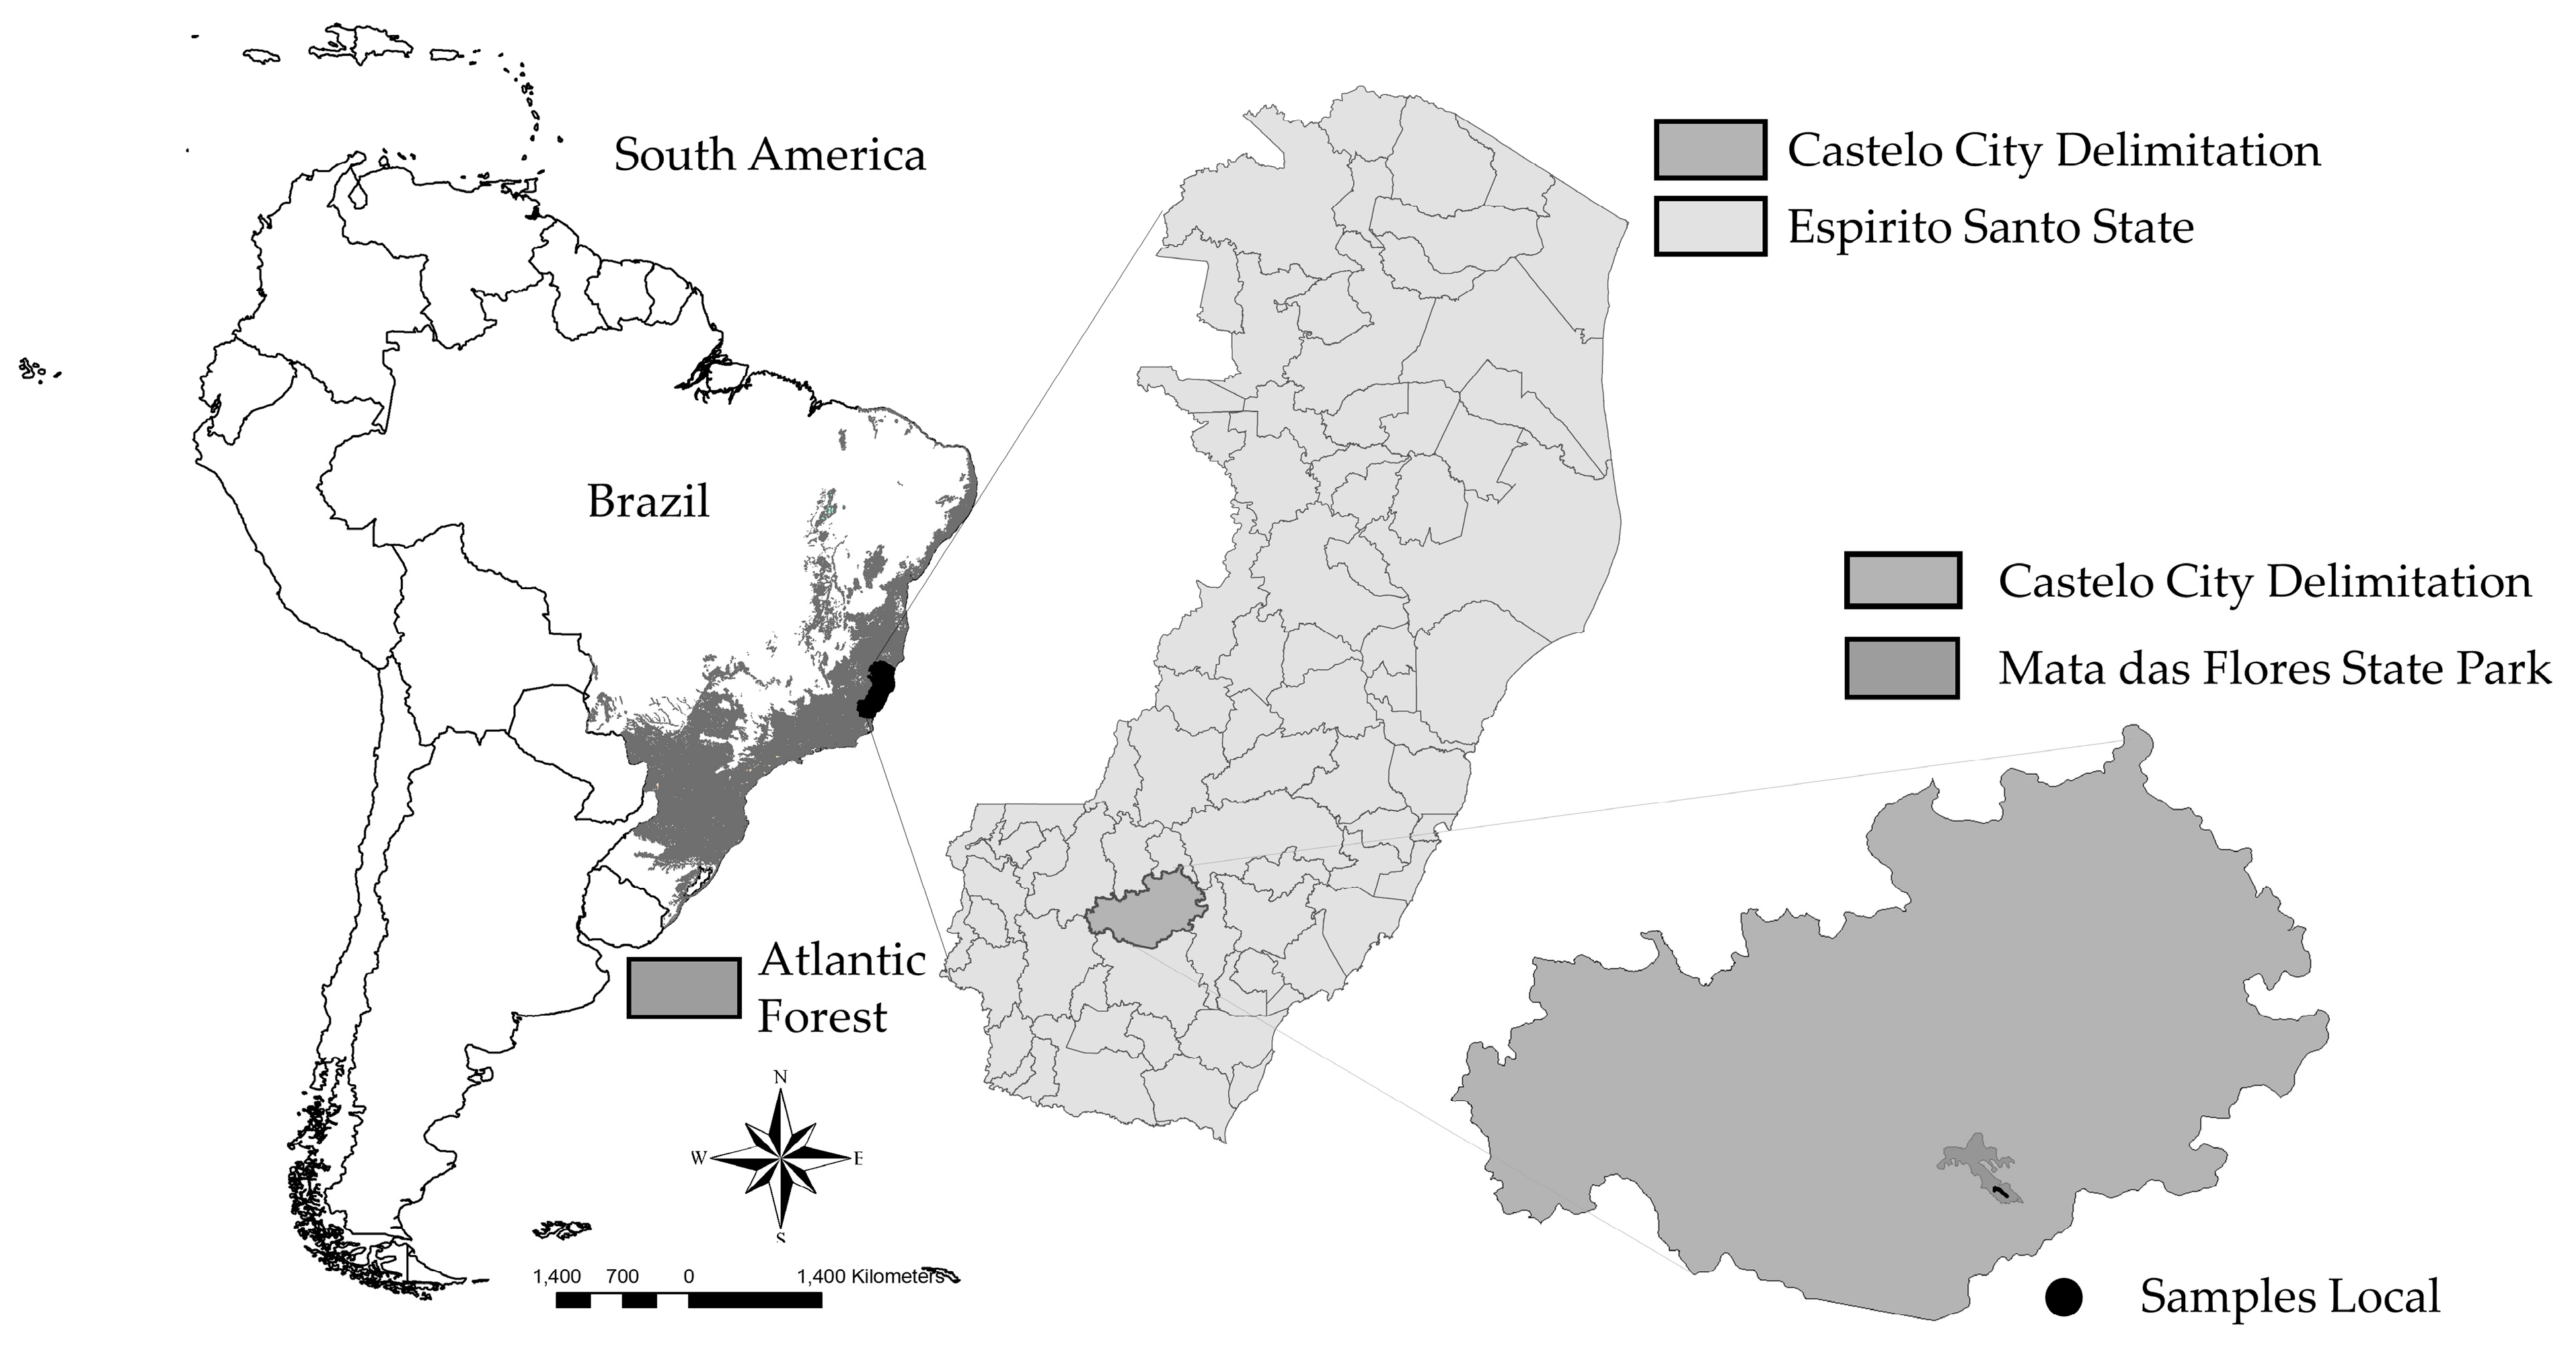
Figure 1. Location of the study region. The location of the state of Espírito Santo in Brazil is shown in the upper left corner. The location of the municipality of Castelo in Espírito Santo is shown in the upper right corner. The location of the Mata das Flores State Park fragment in Castelo is shown below.
Diversity 15 01097 g001
Figure 2. Climograph of the municipality of Alegre, Espírito Santo. R—Rainfall; Tmax—Maximum temperature; Tmin—Minimum temperature; Tmed—Mean temperature. R40—mean rainfall for the period (1950–1990); Tmed40—Mean temperature during the period (1950–1990). Black box mean the period of soil sampling.
Diversity 15 01097 g002
Figure 3. Effect of summer and winter on soil biological properties and moisture, assessed using a Wilcoxon paired t test. MBC = microbial biomass carbon; MBN = microbial biomass nitrogen; AMN = anaerobically mineralizable nitrogen; CSBR = cumulative soil basal respiration; qMIC= microbial quotient; qCO2 = metabolic quotient; AP = acid phosphatase; BG = β-glucosidase; DEH = dehydrogenase; M = soil moisture; P = p value.
Diversity 15 01097 g003
Figure 4. Soil moisture and biological characterization of soil samples collected at a 0.0–0.10 m depth in an Atlantic Forest topographic gradient, in the summer and winter, Brazil. M = soil moisture; MBC = microbial biomass carbon; qMIC = microbial quotient; MBN = microbial biomass nitrogen; AMN = anaerobically mineralizable nitrogen; CSBR = cumulative soil basal respiration; qCO2 = metabolic quotient, AP = acid phosphatase; BG = β-glucosidase; DEH = dehydrogenase. Vertical bars represent the mean standard error. Equal letters, in the same climatic period (uppercase) and in the different topographic positions (lowercase), do not differ among themselves at the 5% significance level using the Dunn test. Letter absence = not significant.
Diversity 15 01097 g004
Figure 5. Principal component analysis (PC1 and PC2) of the mean values of soil biological properties at a depth of 0.0–0.10 m in the summer (a) and winter (b), along a topographic gradient in the Atlantic Forest, Brazil. MBC = microbial biomass carbon; qMIC = microbial quotient; MBN = microbial biomass nitrogen; CSBR = cumulative soil basal respiration; AP = acid phosphatase; BG = β-glucosidase; DEH = dehydrogenase.
Diversity 15 01097 g005
Figure 6. Redundancy analysis of the mean values of soil biological properties at a depth of 0.0–0.10 m in the summer (a) and winter (b), along a topographic gradient of the Atlantic Forest, Brazil. MBC = microbial biomass carbon; qMIC = microbial quotient; MBN = microbial biomass nitrogen; CSBR = cumulative soil basal respiration; AP = acid phosphatase; BG = β-glucosidase; DEH = dehydrogenase.
Diversity 15 01097 g006
Figure 7. Venn diagrams showing the three sources that contributed to the variation in the soil biological properties in (a) summer and (b) winter: soil chemical (C), physical (P), and topographic (T) properties along a topographic gradient of the Atlantic Forest, Brazil. Adjusted R2 values expressed as %. Negative values are not shown (blank).
Diversity 15 01097 g007
Table 1. Topographic attributes of the soil collected at the plots in a toposequence in Mata das Flores State Park (Atlantic Forest), Brazil.
PlotsTopographic PositionAspect 1Curvature 2Slope
(°) 3
Elevation
(m)
Exposure Surface 4Cosine Aspect 5 *Sine Aspect 5 **TPIDirect Sunlight
(Wh m−2)
L1Lowland191.31−0.760117South−0.98−0.2021,243,044
L2Lowland288.430.000117West0.32−0.9521,243,044
L3Lowland225.00−0.330119Southwest−0.71−0.7121,249,496
L4Lowland235.120.330122Southwest−0.57−0.8231,207,846
M1Midland244.03−0.1127126Southwest−0.44−0.9031,192,378
L5Lowland261.870.0016123West−0.14−0.9931,211,236
M2Midland238.82−0.7621134Southwest−0.52−0.8631,171,922
M3Midland218.42−0.7631128Southwest−0.78−0.6231,171,922
M4Midland243.12−1.4121128Southwest−0.45−0.8911,197,542
M5Midland248.590.8722143West−0.37−0.9331,098,693
M6Midland228.371.2027149Southwest−0.66−0.7531,083,516
M7Midland199.61−0.7627142South−0.94−0.3431,053,527
M8Midland192.050.2229136South−0.98−0.2131,051,813
M9Midland182.94−0.5432125South−1.00−0.0531,084,181
M10Midland182.94−0.5436125South−1.00−0.0531,080,628
L6Lowland212.01−0.980118South−0.85−0.5311,230,766
L7Lowland296.57−0.760118Northwest0.45−0.8911,230,766
M11Midland318.271.5229137Northwest0.75−0.6731,277,867
M12Midland287.050.9828137West0.29−0.9631,277,073
U1Upland296.570.3325149Northwest0.45−0.8931,267,062
U2Upland296.271.5223171Northwest0.44−0.9041,234,189
U3Upland266.423.2615171West−0.06−1.0041,250,918
U4Upland172.150.547173South−0.990.1441,177,046
U5Upland145.120.5416161Southeast−0.820.5741,103,901
U6Upland141.520.2224154Southeast−0.780.6241,058,222
1 Aspect = Circular variable (minimum value of 0° and maximum value of 360°). 2 Curvature of the terrain = convexity (value of approximately +1) and concavity (value of approximately −1) of the terrain; 3 terrain slope angle; 4 categoric transformation of aspect = orientation of the plot facing south, north, northwest, etc. 5 Linear transformation of aspect = values in degrees transformed into radians ([interest value * pi]/180), thus generating two new variables: (*) cosine (new value) represents the exposure from north (+1) to south (−1); (**) sine (new value) represents the exposure from east (+1) to west (−1); TPI = qualitative index that represents the plot position in the terrain. Direct sunlight = mean values from the year 2015, calculated at 14-day intervals. Slope < 3° = 0.
Table 2. Partial redundancy analysis results. Biological (B) properties were used as a matrix of response to three sources of variation: soil chemical (C), physical (P), and topographic (T) properties measured along a topographic gradient of the Atlantic Forest in Mata das Flores, Brazil.
Component of VariationSummerWinter
Adjusted R2p ValueAdjusted R2p Value
TVE0.5050.00010.5590.0001
C0.4890.00010.5810.0001
P0.3960.00010.4270.0001
T0.3910.00010.2980.0002
B~C|P∪T0.0720.0240.1330.0001
B~P|C∪T−0.0070.597−0.0110.803
B~T|C∪P0.0260.082−0.0130.868
UV0.494 0.440
TVE = total variance explained; (~) as a function of; (∪) combined variation; (|) controlling the effect of; UV = unexplained variance.
Disclaimer/Publisher’s Note: The statements, opinions and data contained in all publications are solely those of the individual author(s) and contributor(s) and not of MDPI and/or the editor(s). MDPI and/or the editor(s) disclaim responsibility for any injury to people or property resulting from any ideas, methods, instructions or products referred to in the content.