Abstract
The decapod fauna in the intertidal zone of the rocky shores of Chile is highly diverse, especially along the northern and central mainland coasts, where the influence of the cold Humboldt Current results in high productivity. One of the most abundant species in these ecosystems is the decapod Cyclograpsus cinereus Dana, 1851. The aim of the present study, carried out in the spring and summer seasons between 2018 and 2020, was to determine the spatial distribution patterns of the decapod C. cinereus in different sites along the rocky shores of Antofagasta bay, northern Chile, in order to establish probabilistic models that explain its distribution at each site. Individuals were counted in random quadrants in the intertidal zone. The data thus obtained were processed by application of the variance/mean ratio to determine whether the distribution of individuals was random, aggregated or uniform, associated with Poisson, negative binomial or positive binomial distributions, respectively. The data revealed aggregated (negative binomial) distribution in 15 sampling events, and uniform (positive binomial) distribution in 4 events. The sampling sites were located on rocky shores in four sectors of an urban zone, and two in a protected zone; no significant differences were found between the densities of the sites in the two zones. The results of the interpretative probabilistic models indicated aggregated distribution patterns, agreeing with previously reported interpretative probabilistic models for the distribution of decapods on the rocky shores of central and southern Chile.
1. Introduction
The intertidal decapods of the mainland coast of Chile are characterised by their high species diversity. This is especially the case in central and northern Chile (18–33° S), due to the strong influence of the cold Humboldt Current, associated with continuous upwelling processes, which supports high productivity and in consequence high species diversity [1,2]. In this scenario, there are many widespread decapod species in southern Peru and northern and central Chile [2,3,4].
The high environmental heterogeneity of rocky shores is due to the irregular character of the substrate. The typical creeks [2,3,4] and areas of rounded rocks give rise to microenvironments that can sustain high invertebrate species richness, as was observed in early studies of the rocky shores of central Chile [5,6], and in recent studies of the country’s mainland coast [7]. The ecological importance of these species is their function as detritivores; they are also prey species for littoral rocky fishes, sea birds and larger crabs [5,6,8]. The decapod species reported include creek-dwelling Grapsid crabs, as well as smaller crab species that inhabit the spaces underneath rounded rocks, such as Cyclograpsus cinereus Dana, 1851, Petrolisthes granulosus (Guerin, 1835) and P. violaceus (Guerin, 1830) [2,5,6,7].
C. cinereus is widespread along the mainland Chilean and Peruvian coasts [2,5,7,9], and on Chilean oceanic islands [2,10,11]. This species lives mainly under rounded rocks, and forms an important component of the rocky shores of mainland Chile. According to evidence from central Chile, it alternates with Porcellanid crabs as the dominant species [2,5,6]. The literature indicates that this species is gregarious at low tide, but that the individuals spread out at high tide; they are detritivores, and are preyed on by littoral fishes [5,6,8]. Their gregarious behaviour at low tide would be a strategy to avoid desiccation, protect themselves against potential predators, and obtain more efficient use of food resources; however, there are no studies of the density or spatial patterns of these populations [5,6] to indicate whether their distribution pattern, explained by probabilistic models, is random, uniform or aggregated.
The aim of the present study was to determine the spatial distribution patterns of the decapod C. cinereus in different sites along the rocky shores of Antofagasta bay, northern Chile, in order to establish probabilistic models that explain their distribution at each site. Our hypothesis was that the spatial distribution of C. cinereus on the rocky shores of Antofagasta bay would follow a defined probabilistic pattern.
2. Materials and Methods
2.1. Study Sites
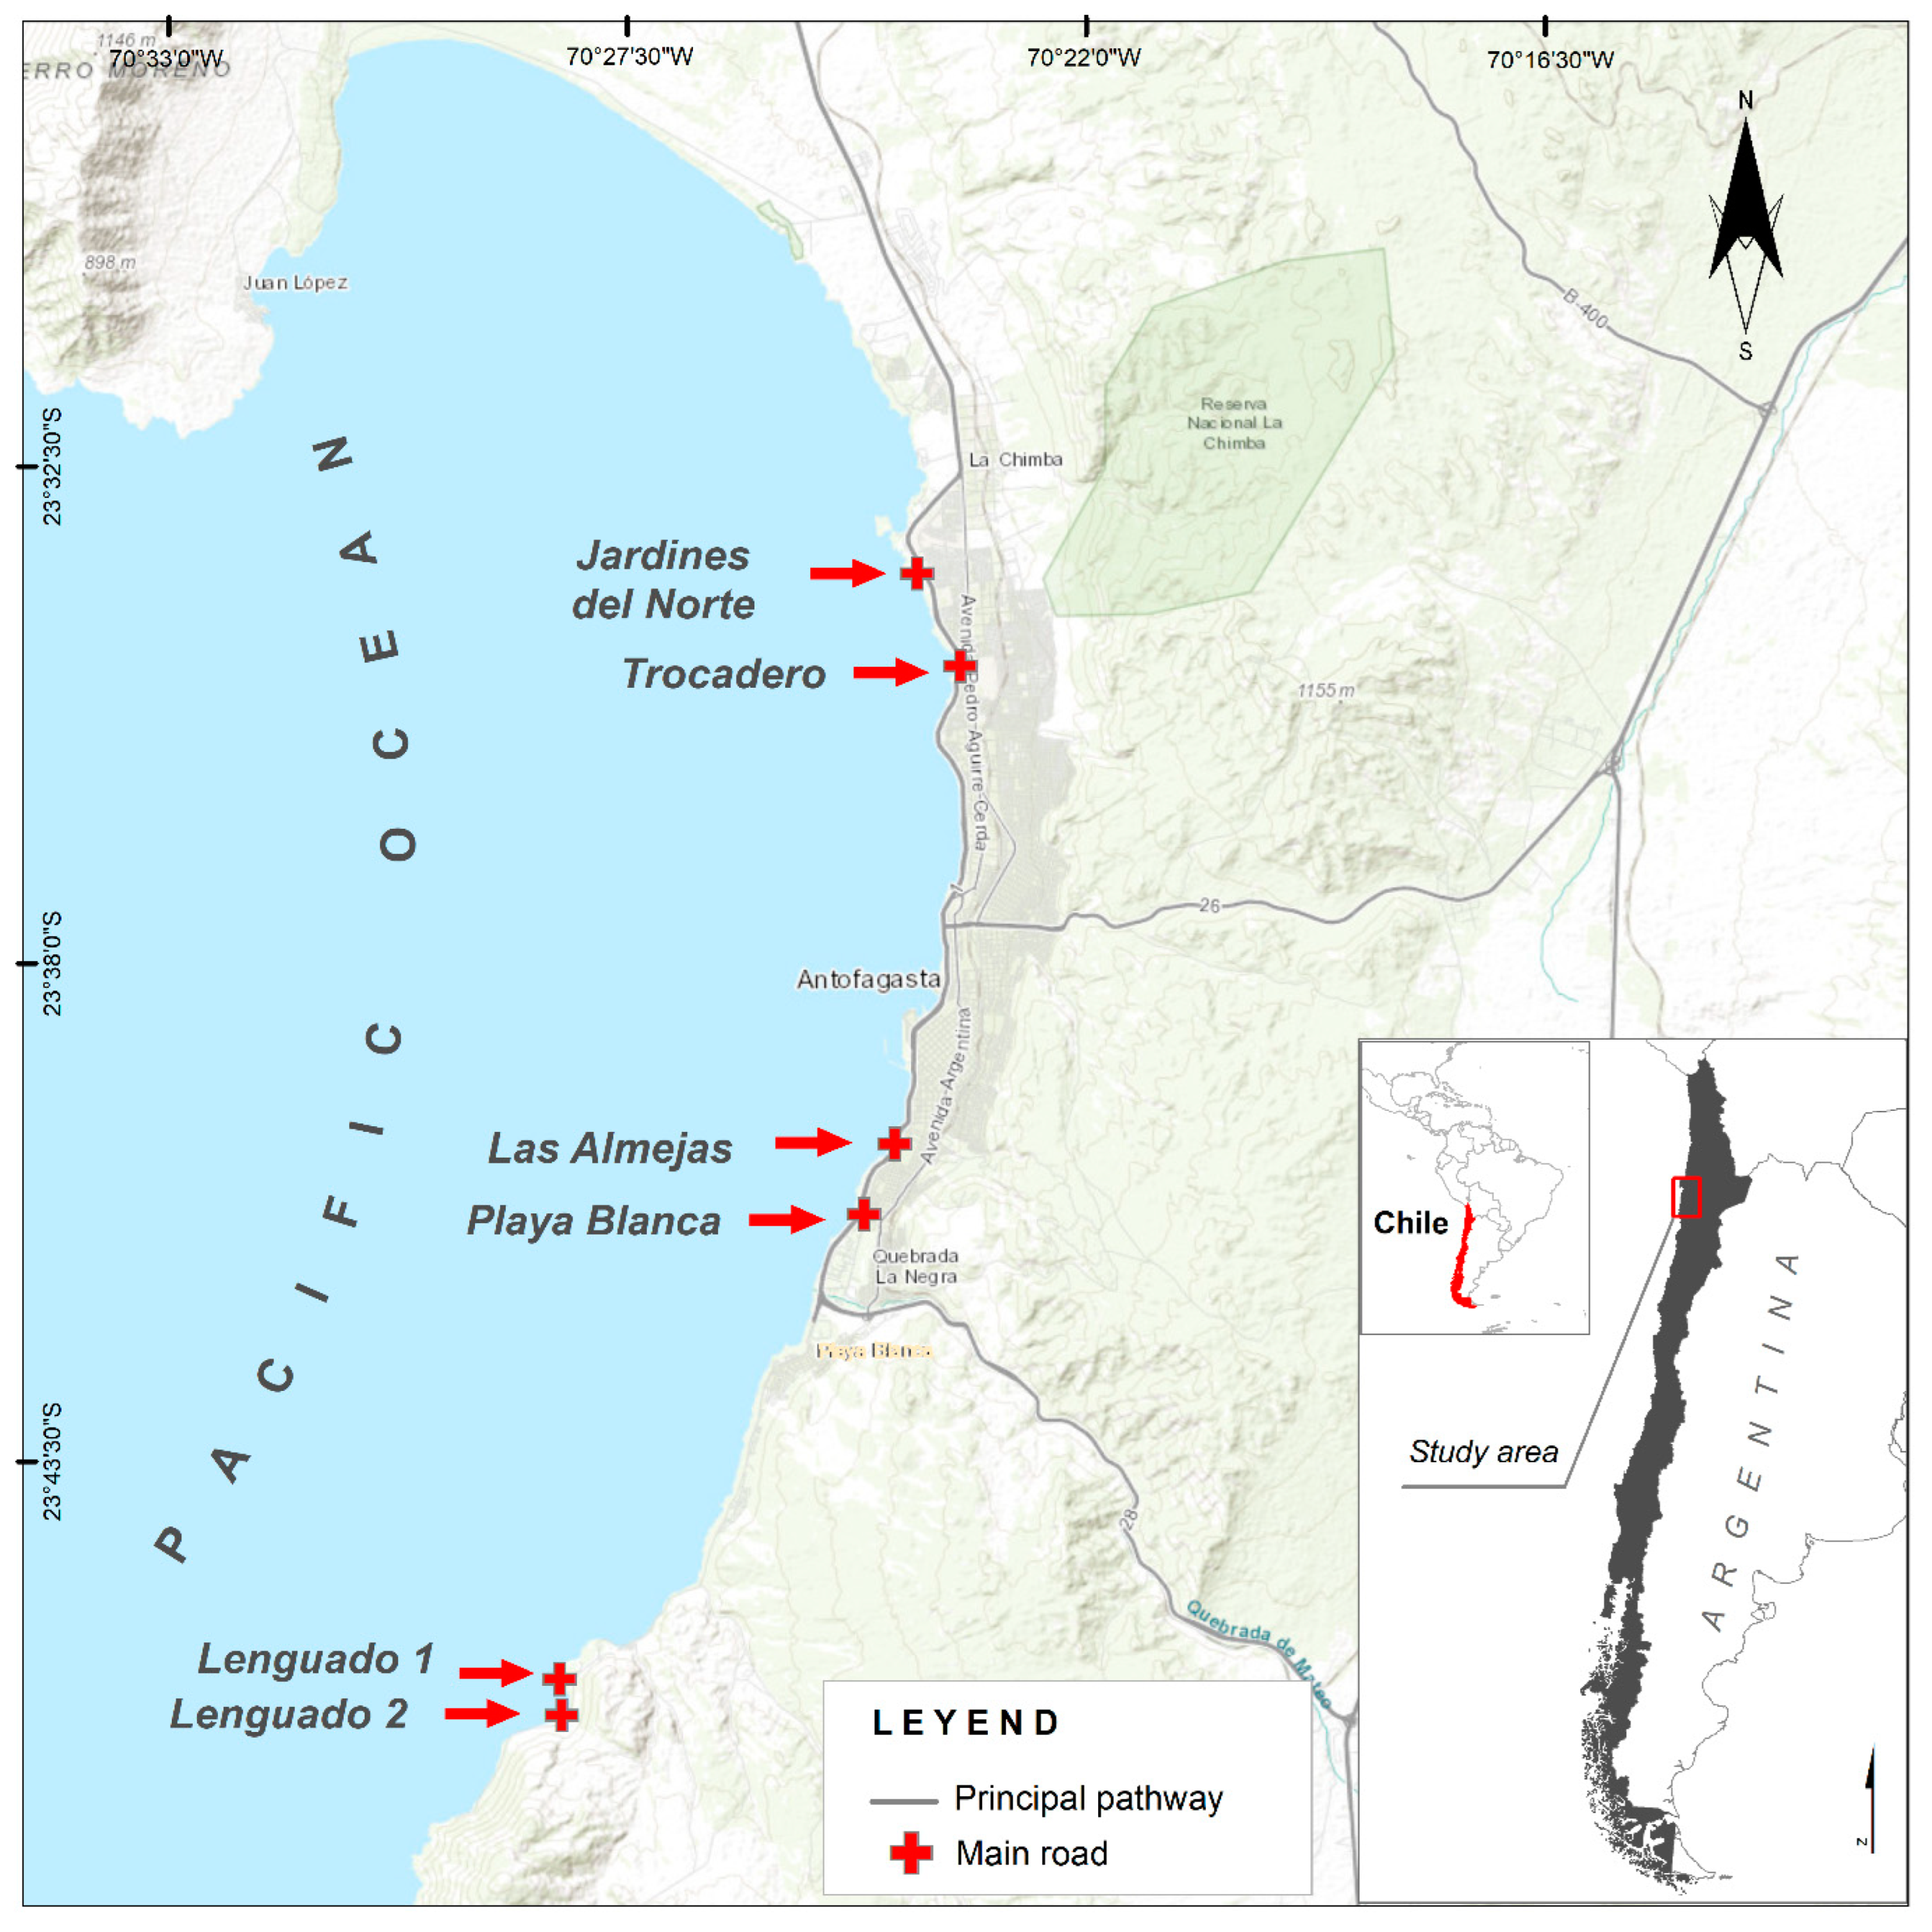
The sites were selected on rocky beaches with rounded rocks along the seafront of Antofagasta bay [12]. Two of the sites were in a protected zone designated for littoral fishery resource management, in accordance with Chilean law (El Lenguado 1 and El Lenguado 2), where no aquatic resource extraction or culture is permitted; these sites are located at the south end of Antofagasta bay, where there is a very narrow coastal plain with granitic and basaltic rocky shores [12] (Table 1, Figure 1). The other four sites were located within the urban zone of Antofagasta city (Playa Blanca, Las Almejas, Trocadero and Jardines del Norte), where there is a wide coastal plain with basaltic rocky shores. The sites were visited in September, December and February 2018–2020 at low tide (Table 1, Figure 1).

Table 1.
Geographical locations of sites included in the present study.
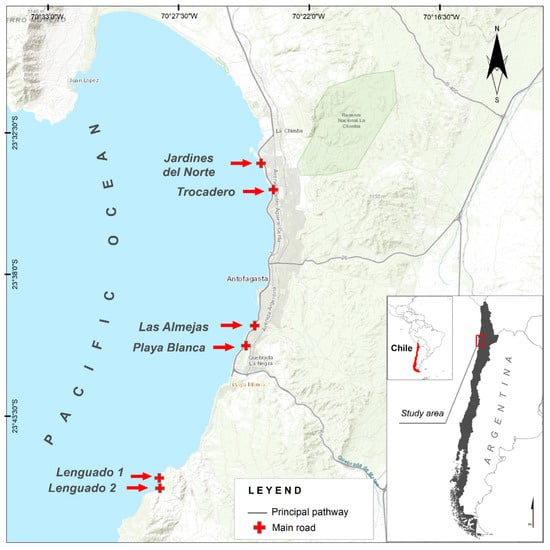
Figure 1.
Map of sites (red arrows and red rectangle) included in the present study; LEGEND: Main road.
2.2. Data Collection
Initial species identification was done in situ, based on literature descriptions [3,6,9]. Random quadrants (10 × 10 cm) were defined at each study site (n = 90 for each site) during low tide. This size of quadrant was chosen as being most suitable for observing this fast-moving species [5,6], and in view of the irregular topography of the site with creeks and rounded rocks [13,14]. Data were recorded manually in a field notebook.
2.3. Data Analysis
In the first stage, the abundance of C. cinereus was compared between each sampling site/date (“event”) and between the two groups of sites (protected and with human intervention). The data were tested for homoscedasticity and normality; if the results were negative, further non-parametric tests were performed, including the Kruskal–Wallis test and Dunnett’s multiple comparison [15], using Python software [16]. Normal distribution and homogeneity of variance were verified; in the absence of both conditions, we carried out a Kruskal–Wallis test using the Pandas, NumPy, Matplotlib and Seaborn libraries [17,18,19,20], and Dunnett’s multiple comparison test using the bioinfokit library [21].
A variance/mean ratio was obtained for each sampling event, first to determine whether the distribution was random (value equal to 1); uniform (value less than 1); or aggregated (value greater than 1) [22,23,24]. Once the spatial pattern had been established, we determined whether the distribution of the species was Poisson, binomial or negative binomial; this was done manually using Excel software and literature descriptions [22,23,24].
3. Results
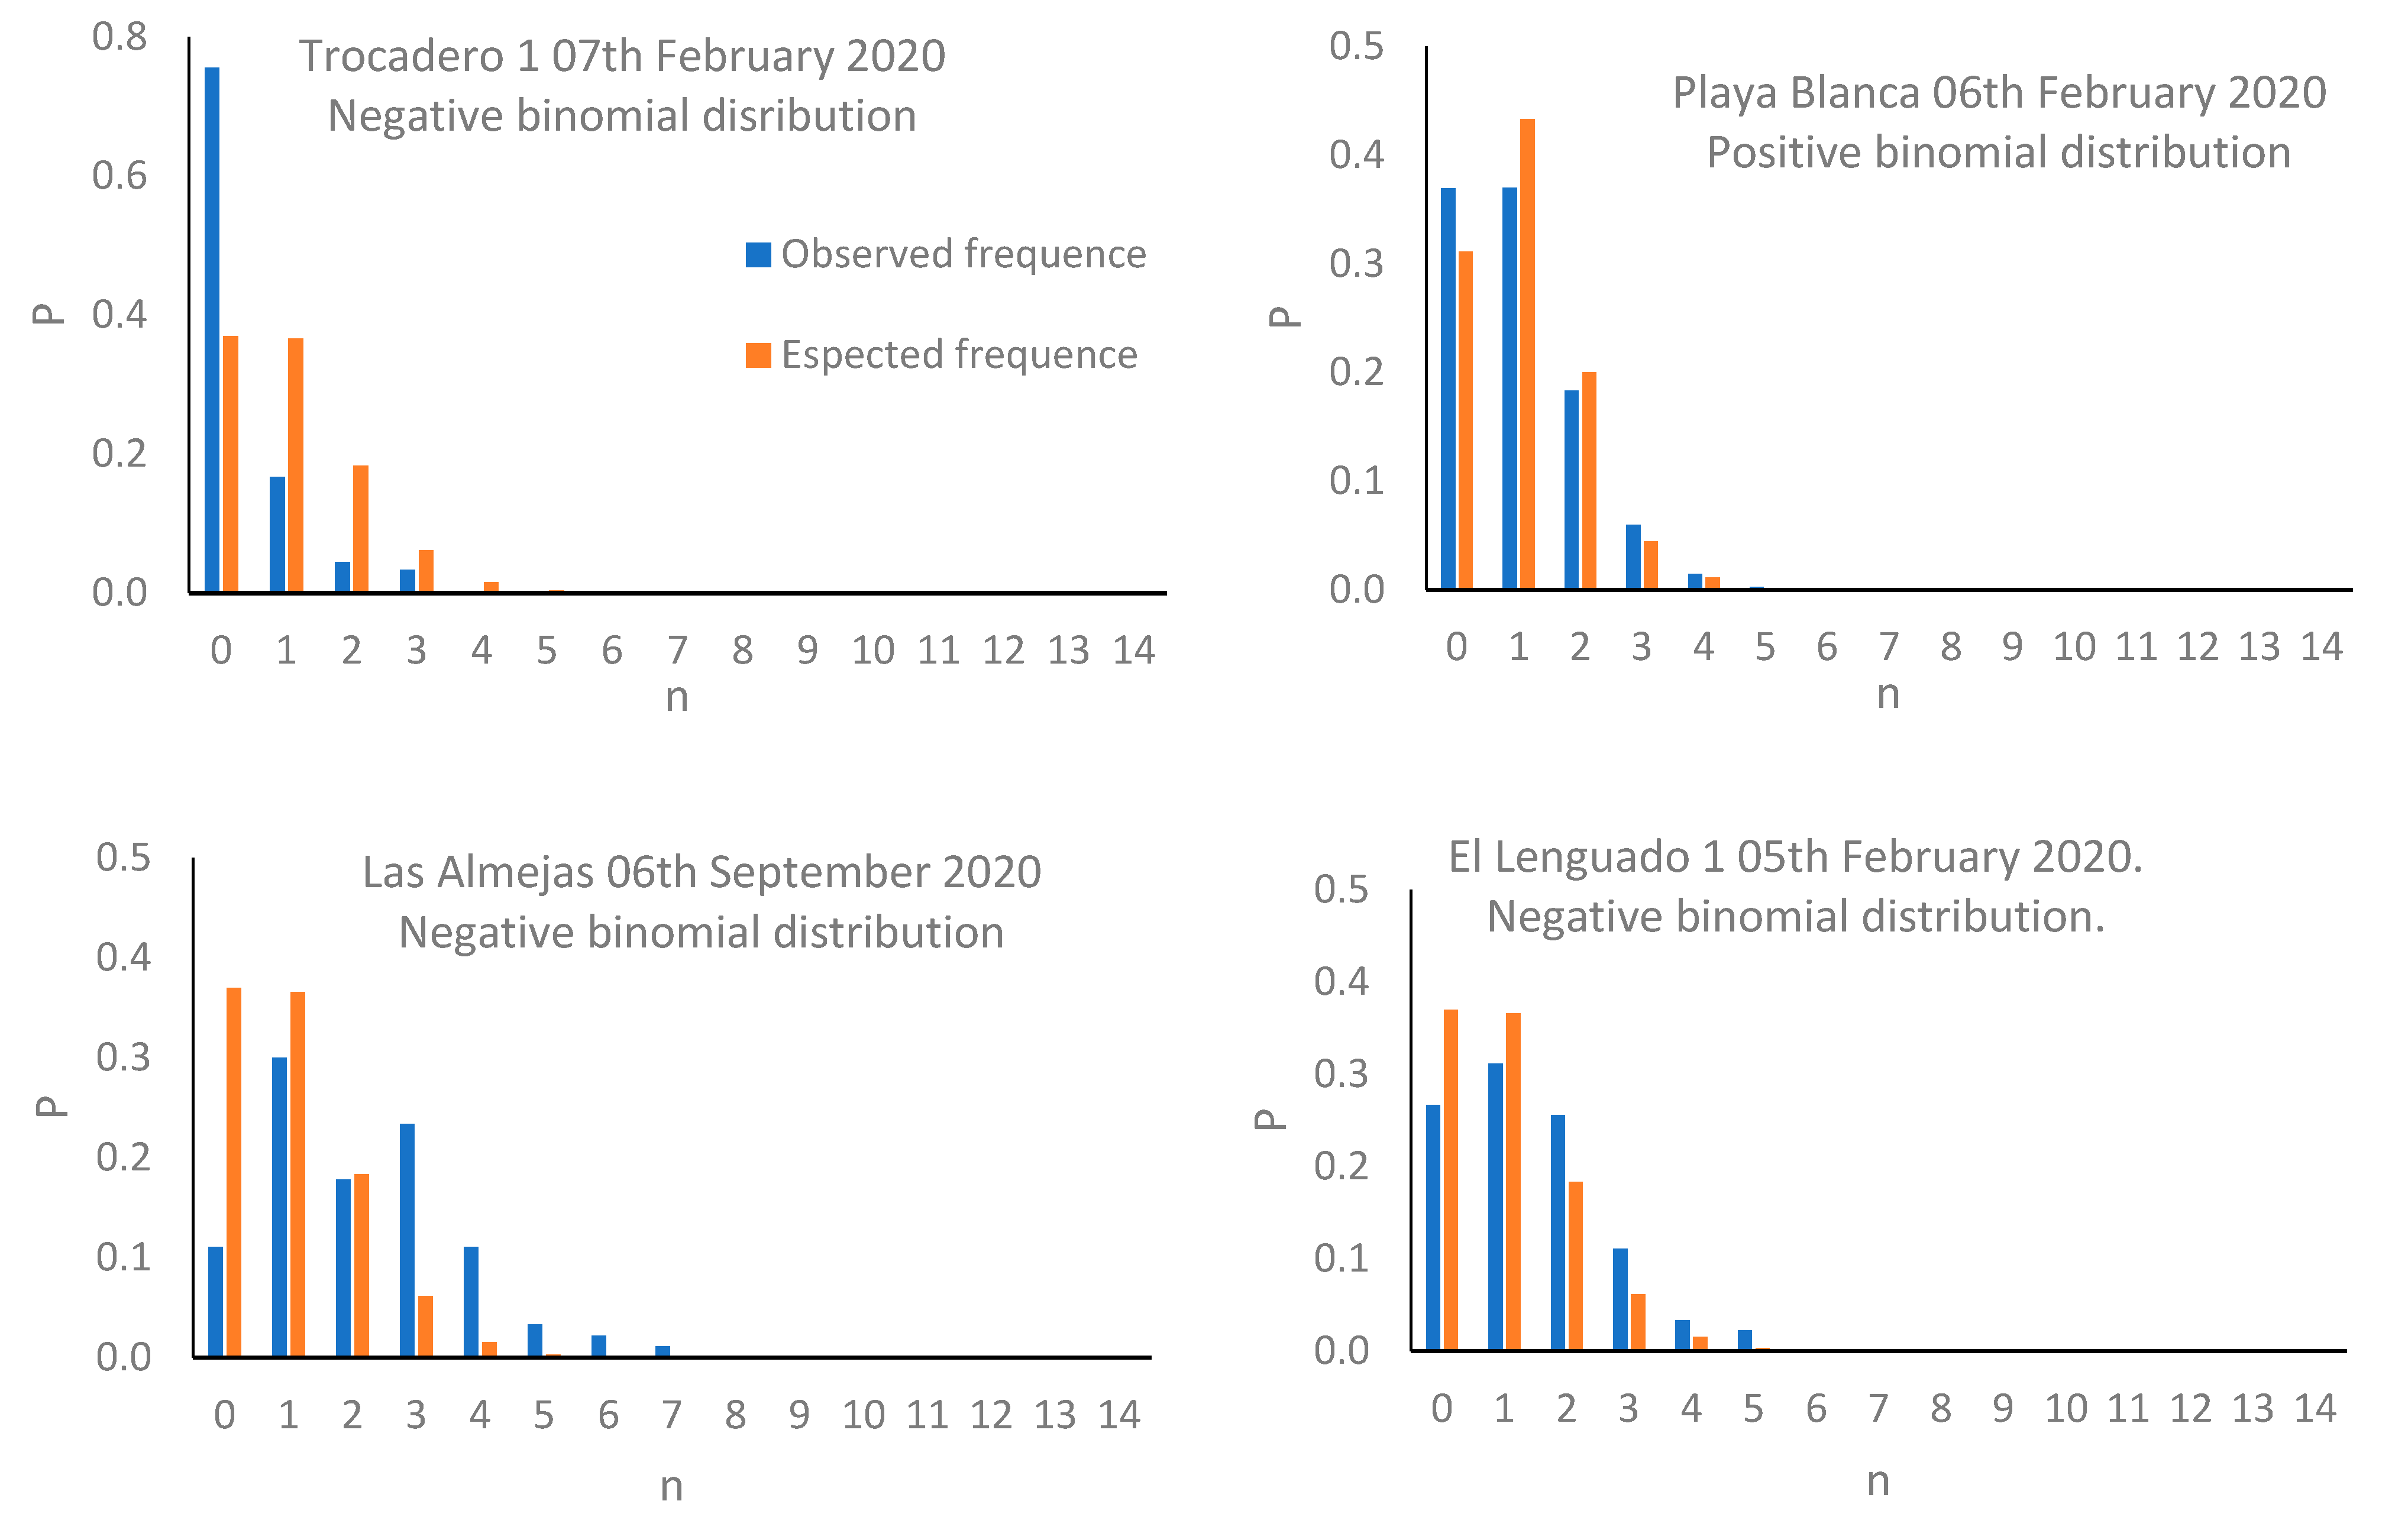
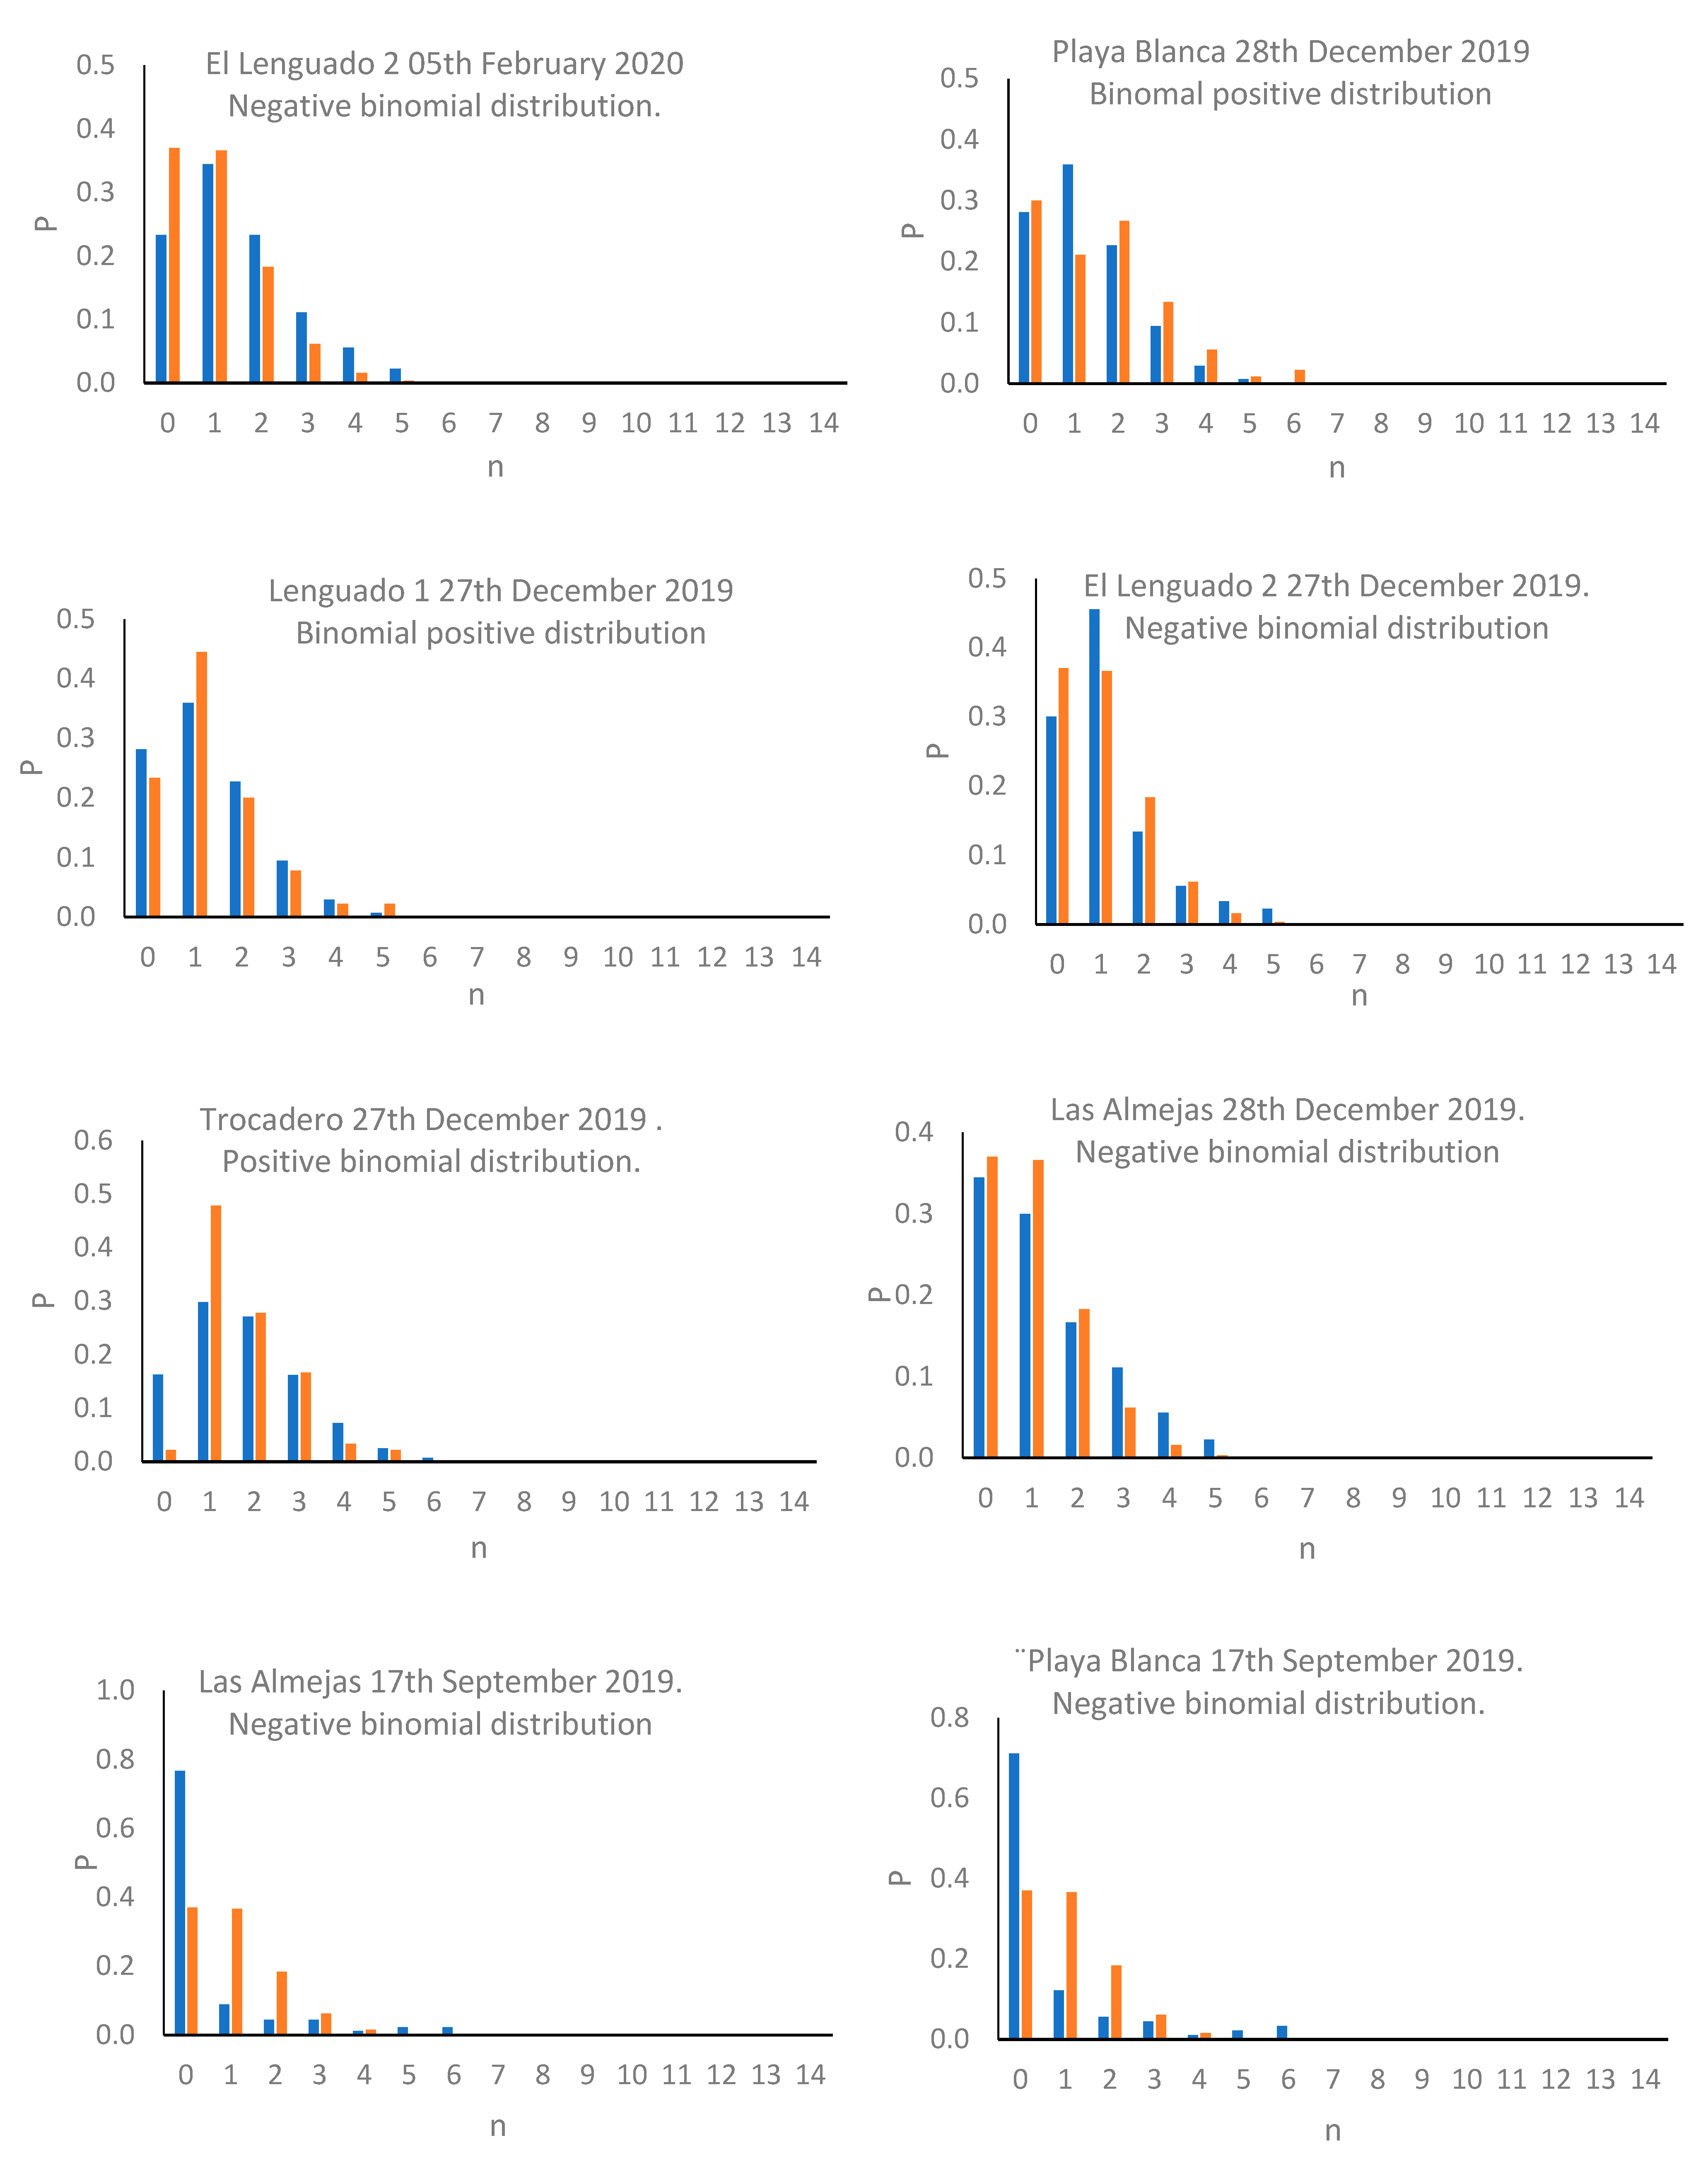
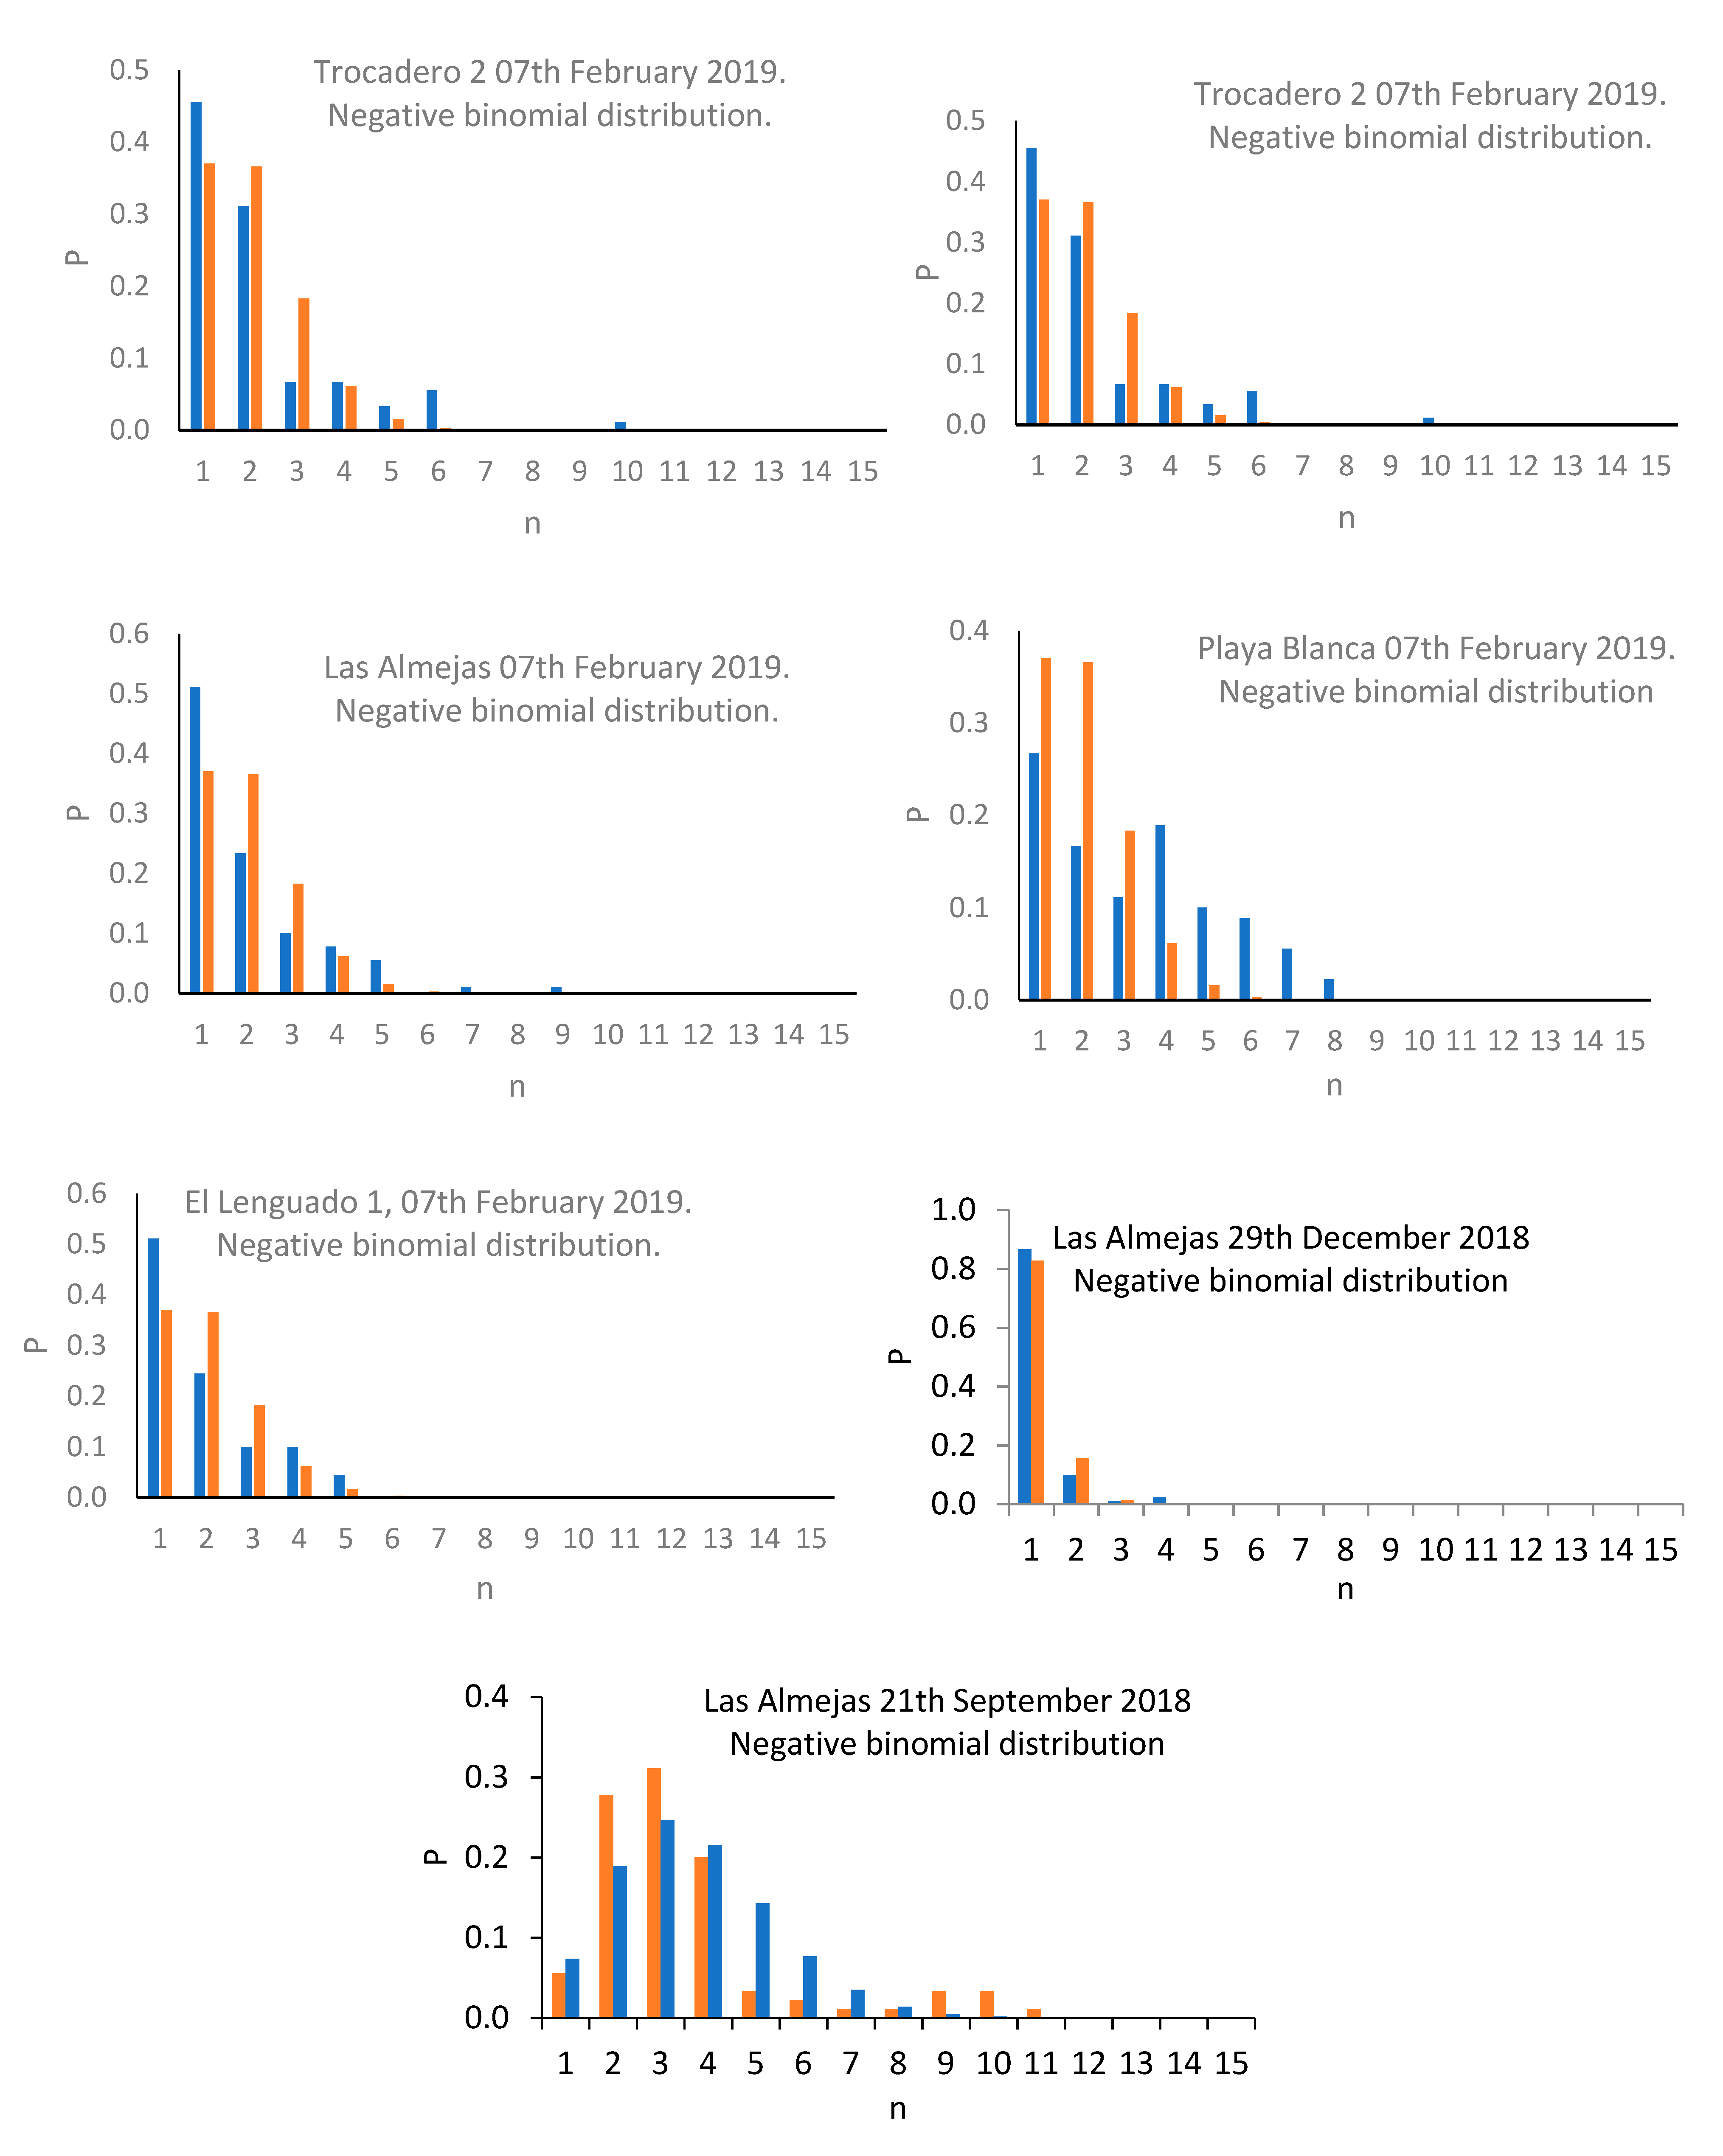
The results denoted a density varying between 0.96 ind/0.01m2 (Trocadero, February 2020), and 2.64 ind/0.01 m2 (Las Almejas, September 2018; Table 2). The results of the Kruskal–Wallis test revealed the existence of significant differences between sampling events (T = 426.51; p < 0.01), while the Dunnett’s multiple comparison test revealed that the events with maximum and minimum abundance showed marked differences against the remaining events (Table 3). The results of the variance/mean ratio revealed that most events presented a value greater than 1.0, implying potential association with a negative binomial distribution; the exceptions were Playa Blanca (6 February 2020, 28 December 2019), Trocadero (28 December 2019), and Playa Blanca (17 September 2019) where a variance/mean ratio value lower than 1.0 was reported, associated with positive binomial distribution (Table 1). The presence of negative binomial and positive binomial distribution patterns, associated, respectively, with variance/mean ratio greater than 1.0 and lower than 1.0, are significant for each case (p < 0.01; Figure 2).
Table 2.
C. cinereus mean density (ind/grid 10 × 10 cm), variance (var) and variance/mean ratio for sampling events.
Table 3.
P values for Dunnett’s multiple comparison tests for C. cinereus densities in sampling events (p values lower than 0.05 denote significant differences, in bold).
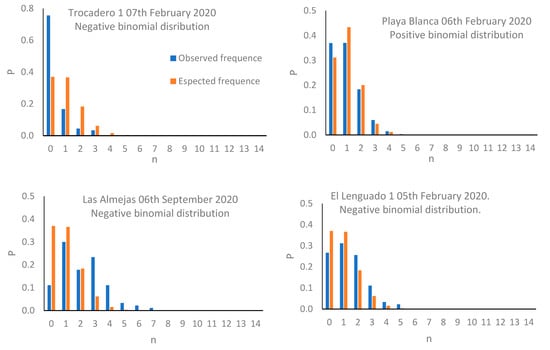
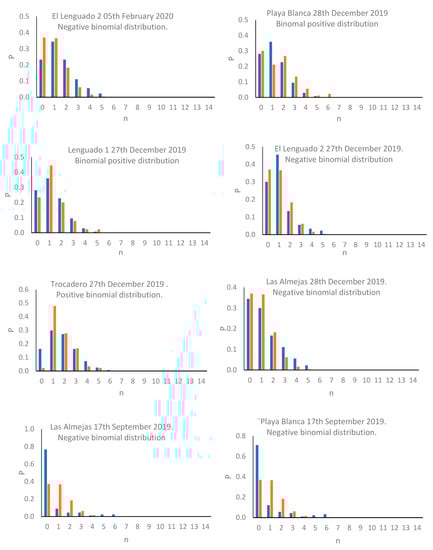
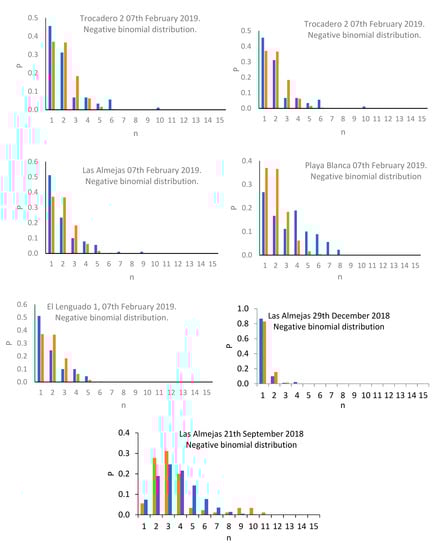
Figure 2.
Distribution patterns observed for C. cinereus populations in sampling events.
4. Discussion
The results showed that the presence of C. cinereus in sites included in the present study agrees with classic literature on the biogeography of this species on the coast of mainland Chile [2,3,7]. The presence of negative binomial distribution in many of the sampling events would agree with the early literature on rocky shores in central Chile, in which this species was described as forming groups that live under rounded rocks in the intertidal zone [6]. A similar pattern was reported for Petrolisthes granulosus in central Chile [5], and these two species coexist along the rocky shores of this area [2,5,6,7]. However, these references did not report any quantitative data on population density.
The use of probabilistic models for the spatial distribution of marine crustaceans in mainland Chile was reported for the intertidal rocky shore in central Patagonia. The results show a preference for aggregated patterns, associated with negative binomial distribution [23]. This association of an aggregated pattern with negative binomial distribution has been reported by classic literature on benthic fauna [25], as well as by applied entomological studies [22]. The same pattern was reported for inland water crustaceans in Chilean Patagonia [24,26], for intertidal invertebrates on the north Patagonian coast [27], and for the gastropod Echinolittorina peruviana on the rocky shore of Antofagasta [12]. The existence of uniform distribution in four of the 19 sampling events is probably due to interspecific interactions, most likely competition with other species that share the same ecological niche [5,6,7].
The presence of negative binomial distribution associated with aggregated distribution is a survival strategy for the efficient use of trophic resources [5,6], as well as a protection against desiccation in intertidal environments [28,29,30]. The literature describes the existence of migration patterns influenced by the tides and day–-night cycle [5,6]. At low tide, intertidal crustaceans, including C. cinereus, form groups under rounded rocks that create a favourable microenvironment [31], whereas at high tide the individuals are dispersed, probably to avoid predation [5,6]. In this scenario, more detailed study is needed to investigate potential migration patterns based on the tides and the day–night cycle [5,6,12,13]. In our study, the samples were collected in the middle of the day at low tide, but future studies could be extended to variations in spatial distribution at different times of day and state of the tide [5,6]. The influence of the topographical characteristics of each habitat could also be explored. In the long term, the oceanographic conditions that can affect the population structure might also be investigated.
Author Contributions
P.D.l.R.-E. carried out field work and drafted the manuscript; C.E. collaborated in data analysis and images; M.A.R., M.F., F.G. and O.Z. collaborated in drafting the manuscript and literature compilation. All authors have read and agreed to the published version of the manuscript.
Funding
This research was funded by MECESUP UCT, grant number 0804, funded by PDE, FONDECYT INCIACIÓN N°11160650 (ANID ex—CONICYTChile) funded by PDE, and the APC was funded by Universidad Católica de Temuco.
Institutional Review Board Statement
Not applicable.
Data Availability Statement
Not applicable.
Acknowledgments
The authors express their gratitude to M.I. and S.M.A. for their valuable suggestions for improving the manuscript, and Willie Barne for support in English edition.
Conflicts of Interest
The authors declare no conflict of interest. The funders had no role in the design of the study; in the collection, analysis, or interpretation of the data; in the writing of the manuscript, or in the decision to publish the results.
References
- Santelices, B. Algas Marinas de Chile: Distribución, Ecología, Utilización y Diversidad; Ediciones Pontificia Universidad Católica de Chile: Santiago, Chile, 1992. [Google Scholar]
- Retamal, M.A.; Moyano, H.I. Zoogeografia de los crustáceos decápodos chilenos marinos y dulceacuícolas. Lat. Am. J. Aquat. Res. 2010, 38, 302–328. [Google Scholar] [CrossRef]
- Retamal, M. Los Decápodos Chilenos. CD-Rom. ETI (Amsterdam). Universidad de Concepción; Springer: Berlin/Heidelberg, Germany, 2000. [Google Scholar]
- Velásquez, C.; Jaramillo, E.; Camus, P.A.; Manzano, M.; Sánchez, R. Biota del intermareal rocoso expuesto de la Isla Grande de Chiloé, Archipiélago de Chiloé, Chile: Patrones de diversidad e implicancias ecológicas y biogeográficas. Rev. De Biol. Mar. Y Oceanogr. 2016, 51, 33–50. [Google Scholar] [CrossRef] [Green Version]
- Sanhueza, E.; Bahamonde, N.; Lopez, M.T. Petrolisthes granulosus (Guérin) en biocenosis supramareales de El Tabo (Crustacea, Decapoda, Anomura). Bol. Del Mus. Nac. De Hist. Nat. 1975, 34, 121–136. [Google Scholar]
- Bahamonde, N.; Lopez, M.T. Cyclograpsuscinereus Dana, en biocenosis supramareales de Chile. Bol. Del Mus. Nac. De Hist. Nat. 1971, 29, 165–203. [Google Scholar]
- De los Ríos-Escalante, P.; Figueroa-Muñoz, G.; Retamal, M.A.; Vega-Aguayo, R.; Esse, C. Size overlap in intertidal decapod communities along the Chilean coast. Sci. Mar. 2020, 84, 151–154. [Google Scholar] [CrossRef]
- Medina, M.; Araya, M.; Vega, C. Alimentación y relaciones tróficas de peces costeros de la zona norte de Chile. Investig. Mar. 2004, 32, 33–47. [Google Scholar] [CrossRef]
- Moscoso, V. Catálogo de crustáceos decápodos y estomatópodos del Perú. Boletín Del Inst. Del Mar Del Perú 2012, 27, 1–207. [Google Scholar]
- Retamal, M.; Gorny, M. Crustáceos decápodos recolectados en las islas Robinson Crusoe, Alejandro Selkirk, San Felix y San Ambrosio, Crucero CIMAR 6–Islas Oceánicas. Cienc. Tecnol. Del Mar. 2004, 27, 71–75. [Google Scholar]
- De los Ríos-Escalante, P.; Ibañez-Arancibia, E. A checklist of marine crustaceans known from Easter island. Crustaceana 2006, 89, 63–84. [Google Scholar] [CrossRef]
- De los Ríos-Escalante, P.; Esse, C.; Stella, C.; Adikesavan, P.; Zúñiga, O. Spatial distribution of Echinolittorina peruviana (Lamarck, 1882) for intertidal rocky shore in Antofagasta, Chile. Braz. J. Biol. 2022, 83, e246889. [Google Scholar] [CrossRef] [PubMed]
- Underwood, A.J.; Chapman, M.G. Design and analysis in benthic surveys in environmental sampling. In Methods for the Study of Marine Benthos. Eleftheriou, A., Mcintyre, A., Eds.; Blackwell Science: Oxford, UK, 2005; pp. 1–42. [Google Scholar]
- Manriquez, P.H. Muestreo y análisis de comunidades intermareales de fondos duros. In Programas de Monitoreo del Medio Marítimo Costero. Diseños Experimentales, Muestreos, Métodos de Análisis y Estadística Asociada; Castilla, J.C., Fariña, J.M., Caamaño, A., Eds.; Ediciones Pontificia Universidad Católica de Chile: Santiago, Chile, 2021; pp. 233–256. [Google Scholar]
- Zar, J.H. Biostatistical Analysis; Prentice Hall Inc.: Upper Saddle River, NJ, USA, 1999; p. 631. [Google Scholar]
- Van Rossum, G.; Drake, F.L., Jr. Python Reference Manual. Centrum voor Wiskunde en Informatica Amsterdam, The Netherlands. Available online: https://www.python.org/ (accessed on 5 January 2022).
- McKinney, W. Data structures for statisticala computing in Python. In Proceedings of the 9th Python in Science Conference, Austin, TX, USA, 28 June–3 July 2010; Volume 445, pp. 51–56. Available online: https://pandas.pydata.org/ (accessed on 5 January 2022).
- Harris, C.R.; Millman, K.J.; van der Walt, S.; Gommers, R.; Virtalen, P.; Cournapeau, D.; Wieser, E.; Taylor, J.; Berg, S.; Smith, N.J.; et al. Array programming with NumPy. Nature 2020, 585, 357–362. [Google Scholar] [CrossRef] [PubMed]
- Hunter, J.D. Matplotlib:A2D Graphics Environment. Comput. Sci. Eng. 2007, 9, 90–95. Available online: https://matplotlib.org/stable/users/project/citing.html (accessed on 5 January 2022).
- Waskiim, M.L. Seaborn: Statistical data visualization. J. Open Source Softw. 2021, 6, 3021. Available online: https://seaborn.pydata.org/citing.html (accessed on 5 January 2022).
- Huang, Y.; Wang, J.Y.; Wei, X.M.; Hu, B. Bioinfo-Kit: A sharing software tool for Bioinformatics. Appl. Mech. Mater. 2014, 472, 466–469. Available online: https://github.com/reneshbedre/bioinfokit (accessed on 5 January 2022).
- Fernandes, M.G.; Busoli, A.C.; Barbosa, J.C. Distribucao espacial de Alabama argillacea (Hubner)(Lepidoptera: Noctuidae) em algodoeiro. Neotrop. Entomol. 2003, 32, 107–115. [Google Scholar] [CrossRef]
- Vega, R.; Figueroa-Muñoz, G.; Retamal, M.A.; De Los Ríos, P. Spatial distribution and abundance of Hemigrapsus crenulatus (H. Milne-Edwards, 1837) (Decapoda, Varunidae) in the Puerto Cisnes Estuary (44° S, Aysen region Chile). Crustaceana 2018, 91, 1465–1482. [Google Scholar] [CrossRef]
- De los Ríos-Escalante, P. Non randomness in spatial distribution in two inland water species malacostracans. J. King Saud Univ.-Sci. 2017, 29, 260–262. [Google Scholar] [CrossRef]
- Elliot, J.M. Some Methods for the Statistical Analysis of Benthic Invertebrates, 25; Freshwater Biological Association of Sciences Publications: Cumbria, UK, 1983; pp. 1–157. [Google Scholar]
- De los Ríos-Escalante, P.; Mansilla, A. Spatial patterns of Pisidium chilense (Mollusca Bivalvia) and Hyalella patagonica (Crustacea, Amphipoda) in an unpolluted stream in Navarino Island (54° S.; Cape Horn Biosphere Reserve). J. King Saud Univ.-Sci. 2017, 29, 28–31. [Google Scholar] [CrossRef] [Green Version]
- De los Ríos-Escalante, P.; Carreño, E. Spatial distribution in marine invertebrates in rocky shore of Araucania region (38° S, Chile). Braz. J. Biol. 2020, 80, 362–367. [Google Scholar] [CrossRef] [PubMed] [Green Version]
- Lagos, M.E.; Castillo, N.; Albarrán-Mélzer, N.; Pinochet, J.; Gebauer, P.; Urbina, M.A. 2021. Age dependent physiological tolerances explain population dynamics and distribution in the intertidal zone: A study with porcelain crabs. Mar. Environ. Res. 2021, 169, 105343. [Google Scholar] [CrossRef] [PubMed]
- Viña, N.; Bascur, M.; Guzmán, F.; Riera, R.; Paschke, K.; Urzua, A. Interspecific variation in the physiological and reproductive parameters of porcelain crabs from the Southeastern Pacific coast: Potential adaptation in contrasting marine environments. Comp. Biochem. Physiol. Part A 2018, 226, 22–31. [Google Scholar] [CrossRef] [PubMed]
- Yeoh, L.H. Behavioural Competition in the Intertidal Shore Crab Petrolisthes elongatus. Master’s Thesis, University of Wellington, Wellington, New Zealand, 2020. [Google Scholar]
- Hollowald, P.; Field, R. Can rock-rubble groynes support similar intertidal ecological communities to natural rocky shores? Land 2020, 9, 131. [Google Scholar] [CrossRef]
Publisher’s Note: MDPI stays neutral with regard to jurisdictional claims in published maps and institutional affiliations. |
© 2022 by the authors. Licensee MDPI, Basel, Switzerland. This article is an open access article distributed under the terms and conditions of the Creative Commons Attribution (CC BY) license (https://creativecommons.org/licenses/by/4.0/).