Article

Molecular Relationships and Genetic Diversity Analysis of Venetian Radicchio (Leaf Chicory, Cichorium intybus subsp. intybus var. sylvestre, 2n = 2x = 18) Biotypes

by
Andrea Basso
1,†,
Francesco Scariolo
2,†,
Enrico Negrisolo
3,
Margherita Lucchin
2 and
Gianni Barcaccia
2,*
1
Istituto Zooprofilattico Sperimentale delle Venezie, Viale dell’Università 10, 35020 Legnaro, PD, Italy
2
Department of Agronomy, Food, Natural Resources, Animals and Environment (DAFNAE), Campus of Agripolis, University of Padova, Viale dell’Università 16, 35020 Legnaro, PD, Italy
3
Department of Comparative Biomedicine and Food Science (BCA), Campus of Agripolis, University of Padova, 35020 Legnaro, PD, Italy
*
Author to whom correspondence should be addressed.
These authors contributed equally to this work.
Diversity 2022, 14(3), 175; https://doi.org/10.3390/d14030175
Submission received: 15 November 2021 / Revised: 7 February 2022 / Accepted: 23 February 2022 / Published: 27 February 2022

Abstract

:
Chicory (Cichorium intybus L., 2n = 2x = 18) is naturalized and grows wild in many parts of Europe, South and Central Asia and N. Africa; moreover, this plant is an important leafy vegetable cultivated worldwide. In Italy, this horticultural crop is known as radicchio, and different biotypes of this crop are cultivated, especially in the north-eastern part of the Italian Peninsula. Known to be introduced in and cultivated since the 17th century in the Venice area, the original biotype, still cultivated and named “Late Red of Treviso”, differentiated over the centuries, and it was also hybridized with endive (C. endivia), giving origin to many other biotypes. Several studies, based on morphological characterizations and historical reports, describe the relationships between the most popular cultivated local varieties of this species, but this work, focused on the use of molecular marker information obtained through DNA fingerprinting, presents validations and new insights into the genetic relatedness and diversity of these biotypes. By means of random amplified polymorphic DNA (RAPD) and amplified fragment length polymorphism (AFLP) molecular markers, this study provides insights into the genetic relationship that intercourses among the five most important local biotypes historically cultivated in the Veneto region, which is also the geographic centre of differentiation of this cultivated leafy vegetable. Through the construction of a maximum-likelihood dendrogram and the reconstruction of the genetic structure of a core collection, consisting of 652 samples belonging to five biotypes of radicchio divided into 22 old farmer populations, original data on their genetic origin, distinctiveness, relatedness and differentiation are reported and discussed.

1. Introduction

Chicory (Cichorium intybus L., 2n = 2x = 18) is among the most popular leafy vegetables in the world [1]. This species, according to Funk et al. [2] and others following taxonomic reclassifications [3], belongs to the tribe Cichorieae of the subfamily Chicorioideae of the family Compositae (Asteraceae [4]), instead of Lactuceae, together with other related species and genera [5].
Integrating data collected from the investigation of morphological descriptors and molecular markers with geographical dispersal area and commercial indicators, C. intybus appeared to be the most well-known cultivated species along with C. endivia L. [5,6,7]. Considering its taxonomy, distinct subspecies were established for C. intybus, including subsp. intybus and subsp. glabratum (C. Presl) Arcang. [5,7]. Moreover, several botanical varieties and cultivar groups of C. intybus subsp. intybus were recognized and could be classified as follows: var. foliosum Hegi (witloof chicory), var. porphyreum Alafeld, Landw. Fl. (pain de sucre), var. latifolium (escarole), var. sylvestre Lam. (radicchio), and var. sativum (Bisch.) Janch. (root chicory) [5]. Within the C. intybus subsp. intybus, cultivated chicory types are biennial, whereas wild chicory types are perennial plants.
Most likely known by Egyptians as a medicinal plant and used as a vegetable crop by ancient Greeks and Romans, chicory gradually underwent a process of naturalization in Europe [7]. Currently, wild C. intybus covers all regions of the Italian Peninsula, and it is also widespread in the entire European continent. While there are large differences in cultivation techniques and cultural uses, leafy products from chicory landraces have traditionally become a part of the diet of local populations as an important ingredient of typical local dishes [5,7]. In horticulture markets, leaf chicory traditionally includes all cultivar groups whose commercial products are the leaves, which are used in a short food supply chain (for preparation of both cooked and fresh salads), whereas the other types of commercial products derived from the roots are destined for either industrial transformation (inulin extracts) or human consumption (coffee substitutes) and are classified as root chicory [5].
Chicory is commonly an allogamous species due to an efficient sporophytic self-incompatibility system and a consistent entomophilous pollination that favours outcrossing [7,8,9]. Furthermore, hybridization among plants is promoted by floral morphological barriers that hamper selfing and physiological mechanisms that boost germination and growth of pollen grains and tubes in case of outcrossing [5,7]. Within leaf chicory, in Italy commonly called “radicchio”, and in particular “radicchio Veneto” (Venetian radicchio, in English) in the north-eastern regions with specific reference to some typical red-leaved biotypes, cultivated populations of radicchio adopted for large-scale farming systems are currently represented by commercial seeds of open-pollinated (OP) varieties, synthetic varieties and F1 hybrids that are available on the global chicory market [1]. However, a great proportion of radicchio is planted in many small farming units, using seeds of local varieties selected and maintained through mass selection by individual farmers [8,10].
In Italy, where radicchio has been widely cultivated, especially in the north-eastern regions, for a long time, plant materials grown by farmers are mainly represented by local varieties known to possess variation and adaptation to the natural and anthropological environment where they originated and are still widely cultivated [5,7]. Such cultivated populations were conserved and multiplied by farmers as local varieties (i.e., farmer populations) via phenotypic selection, and thus they were highly heterozygous and heterogeneous. While a considerable range of phenotypic variation within each population is present across all cultivated types, clear genetic differentiation is also noticeable among populations for various traits and molecular markers [5,7].
That said, radicchio is one of the most important horticultural crop plants of the Triveneto territory in north-eastern Italy [5,7,10]. It represents a cultural and agricultural heritage for local people, similar to corn [11] and barley [12] among the cereal grains, common bean [13] for legumes, and grapevine [14] and olive [15] among crop trees, which has long cultural traditions and for which regional productions they are dependent not only on modern varieties but also, if not mainly, on local cultivars and landraces.
Historically, most cultivated varieties of radicchio have been developed using mass selection to obtain uniform populations characterized by high yield and suitable commercial standards [5]. Currently, two genetically distinct types of chicory cultivars are on the market: OP or synthetics and F1 hybrids [9,10]. Newly released cultivars are mostly synthetics, developed through intercrossing or polycrossing among many selected parental individuals or clonal lines, followed by progeny testing to assess general combining ability [5,8]. By their nature, synthetics have a wide genetic base represented by a mixture of highly heterogeneous and heterozygous individuals but show rather similar phenotypes. In recent years, however, developing F1 hybrid cultivars has become more common, mainly in the private sector [5,10]. Experimental data on how these hybrids are developed are currently scarce, and presumably each company employs its own protocol depending on the genetic materials used and the system(s) of pollination control during inbred line development and F1 hybrid seed production [5]. In general, the strong self-incompatibility (SI) system in chicory has been a great barrier to the development of parental inbred lines or clones used to produce single-cross hybrids [5,7,10]. However, there has been an increased interest in the production of F1 hybrids due to the discovery of male-sterility genes [16,17]. For instance, an increasing number of cultivars of the witloof and radicchio types are commercialized as true F1 hybrids. Furthermore, owing to the economic benefits, most newly released varieties of leaf chicory are F1 hybrids, mainly developed by European seed companies. Moreover, most commercial breeding programs have improved their efficiency during the past several years due to the use of genomic tools. Various types of molecular tools, including SSR, EST and SNP markers, have been implemented for genotyping elite breeding stocks of leaf chicory [10,17,18]. The available data show that markers have been reliable for assessing multilocus genotypes of individual plants, breeding stocks and lineages, including assessing the degree of homozygosity of inbred lines and their genetic stability. Moreover, markers have also been used to accurately estimate the specific combining ability between parental lines, as judged based on their genetic diversity and predicted degree of heterozygosity in their F1 hybrid progeny. Such information could be utilized for planning two-way crosses and predicting heterosis of the experimental F1 hybrids based on genetic distance and allelic divergence between parental inbred lines. Information on the parental genotypes would also allow protection of newly registered cultivars and assessment of the genetic purity and identity of the seed stocks of commercial F1 hybrids.
Regarding the traditional and local varieties cultivated in the Triveneto territory, and developed by mass-selection and morphological, or aesthetic, characterization, currently, there are five main varietal groups of radicchio cultivated in the Italian territory: “Late Red of Treviso”, “Early Red of Treviso”, “Red of Verona”, “Variegated of Castelfranco” and “Red of Chioggia” [7]. The last of these biotypes is the most widespread and well known, while all of the others represent locally valuable high-quality crops. While clear-cut morphological differentiation among the five biotypes does exist, their molecular distinctiveness and relationships along with genetic similarity and diversity degrees are becoming increasingly important for breeders, producers and consumers.
There is no written history regarding the origin of radicchio in Italy, but only paintings and old artistic representations of it. All red types of radicchio currently cultivated appear to derive from red-leaved individuals for which cultivation is reported since the 15th century [19]. According to Bianchedi [19], the cultivation of red chicory dates back to the first half of the 16th century. It is largely accepted that the original type corresponds to the “Late Red of Treviso” since it was for a long time the only cultivated radicchio in the Venetian territories surrounding the ancient town of Treviso [7]. After spreading to nearby lands, the original type underwent strong morphological and agronomic selection according to very different criteria adopted by individual farmers but at least partially due to or dependent on the various environmental conditions of cultivation. Thus, after many years of repeated hybridization and selection carried out by farmers within their own populations, a heavy head with imbricated leaves was bred, and this new type called “Early Red of Treviso” became locally popular in 1965–70 [7]. Meanwhile, crosses between red-leaved plants of C. intybus and plants of C. endivia—occurring spontaneously or intentionally performed by farmers back in the 18th century [20,21]—enabled a new type with red-spotted or variegated leaves to be obtained, currently known as “Variegated of Castelfranco”, referring to a small medieval town in the province of Treviso. Later, in the area of Chioggia, a traditional horticultural area established on sandy soils extending southward from this small seaside town just south of Venice, new types with variegated- and red-leaved traits able to form rather conical or spherical and tightly closed heads were originally generated in approximately 1930 and 1950, respectively [7]. Similarly, in the agricultural area of the town of Verona, a small hardy winter type forming a rosette of deep-red coloured and egg-shaped leaves was initially selected from the “Late Red of Treviso”, and then, in 1950–60, populations of “Red of Verona” were obtained and started to be cultivated locally [7].
In fact, the biotype “Red of Chioggia” is by far the most widely grown among the various cultivar groups of radicchio, and it presents the highest within-type differentiation among cultivars in terms of earliness able to guarantee production almost year-round. Indeed, this biotype of radicchio has exhibited great adaptability to very different environmental situations worldwide, becoming the most grown biotype outside the Italian territory and thus the most known at the international level [5,7]. In Italy, the radicchio of Chioggia is cultivated on a total area of approximately 18,000 ha, half of which is in the Veneto region, with a total production of approximately 270,000 tons (more than 60% obtained using professional seeds), reaching an overall turnover of approximately 10,000,000 euros per year [5].
During the past two decades, the agricultural scenery in Mediterranean countries has profoundly changed for chicory cultivations, including radicchio biotypes, where subsistence mixed farming units have been transformed into extensive farming systems growing mainly modern improved varieties instead of local varieties. In recent years, professional breeders have developed protocols based on controlled hybridizations among chosen individual plants to obtain genetically improved synthetic varieties showing higher distinctiveness, uniformity and stability for both agronomic and esthetic traits [9,10]. Modern breeding programs aim to isolate individuals within the best local populations for the selection of inbred lines suitable for the production of commercial F1 hybrids [9,10]. These programs are increasingly assisted by the use of molecular markers to breed genetically distinguishable, uniform and stable varieties [10,18,22]. Radicchio materials grown in the second half of the last century not only provide a valuable source for potentially useful traits but are also an irreplaceable bank of coadapted genotypes. In fact, the radicchio germplasm is represented by local populations, is maintained annually by farmers through mass selection and is known to possess a high variation and adaptation to the natural and anthropological environment where the germplasm originated and has been cultivated for a long time.
This research addresses the use of molecular markers for fingerprinting genomic DNA of Venetian radicchio biotypes that belong to the five main varietal groups and that correspond to old farmer populations cultivated locally in the 1980s–1990s. Overall, the results highlighting the genetic structure and distinctiveness of single populations and biotypes, along with the genetic diversity extents and genetic relationships among these varietal groups of radicchio, are presented and critically discussed.

2. Materials and Methods

2.1. Plants Materials

An overall number of 652 samples of radicchio, provided by “Veneto Agricoltura”, belonging to the five biotypes named hereafter TvT, TvP, Vr, Cf and Ch (“Late Red of Treviso”, “Early Red of Treviso”, “Red of Verona”, “Variegated of Castelfranco” and “Red of Chioggia”), which represent 23 populations in total, were selected for DNA fingerprinting analyses through RAPD and AFLP markers. Samples used belong to old local populations selected annually by farmers according to their phenotypes.

2.2. Genomic DNA Isolation

DNA extraction of each sample was performed by means of the procedure described by Barcaccia and Rossellini [23]. The DNA quality and quantity of the obtained extracts were evaluated using spectrophotometry, and genomic DNA (gDNA) integrity was verified through agarose gel electrophoresis in a 1% agarose/1 × TAE gel containing 1 × Sybr® Safe DNA gel stain (Life Technology, Carlsbad, CA, USA). After these evaluations, good-quality gDNA samples were used for PCR amplification.

2.3. Molecular Markers

RAPD marker analyses were performed using the same methodologies described in Barcaccia et al. [24,25] with few modifications. Sequences of primers (Operon Technologies, Inc., Huntsville, AL, USA) used are reported in Table 1 and were selected after initial testing for the number of amplicons they generated. PCR parameters and gel electrophoresis for DNA fingerprinting by RAPD markers followed the procedure described by Barcaccia [9,24]. An average of 28 plants were analyzed as individual genomic DNA samples for each of the 23 populations under study. PCR products were evaluated by electrophoresis in 2% agarose 1 × TBE buffer gel stained with ethidium bromide following Barcaccia et al. [9].
AFLP marker analyses were performed according to Barcaccia et al. [25] with some modifications and improvements as reported by Barcaccia et al. [26,27]. The analysis of AFLP loci was based on the detection of PsbI/MseI genomic restriction fragments by PCR amplification of three different primer combinations having two and three selective nucleotides for PstI and MseI, respectively (Table 1). In general, DNA fingerprinting by AFLP markers, including PCR amplifications, polyacrylamide gel electrophoresis and amplicons screening was performed following the procedures adopted by Barcaccia et al. [25], which derived from protocols described in great details in Vos et al. [28] and Cnops et al. [29]. AFLP markers investigation was conducted on samples of the 23 populations that were analyzed in genomic DNA bulks of 5–7 individuals each belonging to the same population.

2.4. Genetic Diversity and Relationships Analyses

Once DNA fingerprint screening was completed, two initial datasets were recovered, comprising 35 molecular traits from RAPD and 92 from AFLP, for each sample. In a few cases, missing data were present that could have invalidated the forthcoming bioinformatics analyses. For this reason and following the preliminary analyses on the complete datasets of single markers, a threshold of 2% missing data for filtering the datasets was considered to reduce the possibility of misleading results. An initial genetic distance (GD) analysis was performed using NTSYS v2.21 software [30] based on the default NEI72 algorithm. The same protocol was adopted for both the RAPD and AFLP datasets. The two GD matrices were then used for the construction of two neighbor-joining (NJ) trees. After this, the two datasets were also combined into a larger dataset that comprehended 652 samples that had, for both kinds of molecular markers used (127 traits), a combined percentage of missing data <2%. Using the combined dataset, the same genetic distance analysis was performed, and the resulting NJ tree was then used as the initial tree in the subsequent genetic relatedness and distinctiveness analysis with the maximum-likelihood approach.
The genetic relationship analysis was performed according to the maximum-likelihood method (ML) implemented in IQ-Tree v1.6.12 software [31]. RAPD, AFLP and the combined markers dataset resulting matrices were analyzed as morphological data using the best fitting model identified by the ModelFinder algorithm available in IQ-Tree [32]. The BIC values were used to identify the best fitting model (MK+FQ+I+G4) for each dataset [31]. Initially, the RAPD and AFPL datasets were analyzed independently. As previously mentioned, single marker datasets were merged into a combined set and studied simultaneously. Ten independent runs were performed in each analysis to minimize the possibility of being entrapped in suboptimal dendrograms. The independent runs were compared by Robinson–Foulds distance [33]. The ML method, used to infer the relationship between the biotypes of radicchio, was selected according to Felsenstein’s works [34,35], which reports the use of parsimony or likelihood for AFLP and RAPD markers analysis. Likewise, several authors have successfully used anonymous markers to infer relationships between samples [35,36,37,38,39]. Furthermore, to take into account the phenotypic selections that occurred during the constitution of the varieties, the authors want to apply the morphological models, considering the variability of the observed genetic data as the effect of the morphological differentiation fixed by years of selections. The selected MK model is an optimization of the Jukes–Cantor type model for morphological data, as reported by the IQ-Tree available manual [40].
The discrepancies among the obtained topologies were identified with the Phylo.io application [41] and further assessed by visual inspection. Statistical support for the ML dendrogram was computed by running 10,000 replicates until convergence for the standard bootstrap (BT) [42], ultrafast bootstrap (UFB) [43,44] and SH-like approximate likelihood ratio tests (SH-aLRT) [45]. Significant values: Bootstrap ≥ 75, UFB ≥ 90 and SH-aLRT ≥ 75 are indicated in Supplementary Figure S1. According to the literature [19,20,21], the TvT clade was set as root.

2.5. Genetic Structure Analyses of the Core Collection

In parallel, a Bayesian clustering algorithm implemented in STRUCTURE v2.2 [46] was used to model the genetic structure of the radicchio core collection. The number of founding groups ranged from 1 to 20, and 10 replicate simulations were conducted for each value of K based on a burn-in of 20,000 and a final run of 100,000 Markov chain Monte Carlo (MCMC) steps. STRUCTURE HARVESTER [47] was used to estimate the most likely value of K, and the estimates of membership were plotted as a histogram using an Excel spreadsheet.

2.6. Genetic Diversity Statistics

The average number of alleles (no), the effective number of alleles (ne) according to Kimura and Crow [48] and the polymorphic loci expressed in number (npl) and percentage (%pl) were calculated for each population considered in the combined markers dataset and for the clusters identified through the ML supported dendrogram obtained from IQ-Tree software. Additionally, Nei’s [49] genetic diversity statistics were computed and averaged for the 22 populations and the five biotypes over all RAPD and AFLP loci of the combined dataset to evaluate the total diversity of the entire core collection (H’T), the within population diversity (H’S), the among genetic differentiation (DST) and the proportion expressed between populations (GST) parameters. From GST, gene flow (Nm) was estimated as follows: Nm = 0.5(1 − GST)/GST [50]. Moreover, the polymorphism degree was calculated over all 22 populations and five clusters using Shannon’s information index (I) of phenotypic diversity [51]. All statistics were computed using POPGENE version 1.32 [52].

2.7. Genetic Similarity Estimates

Genetic similarity (GS) based on Dice’s coefficient [53] was computed in all pairwise comparisons using the combined marker dataset. Moreover, the mean GS within and among single populations was calculated. Additionally, from the entire genetic similarity matrix, GS and standard error were calculated for each of the five clusters previously identified. Genetic similarity was calculated using NTSYS software v2.21 [30]. Using the same software and the Dice’s GS matrix, a Principal Coordinate Analysis (PCoA) was constructed labelling samples depending on their biotypes.

3. Results

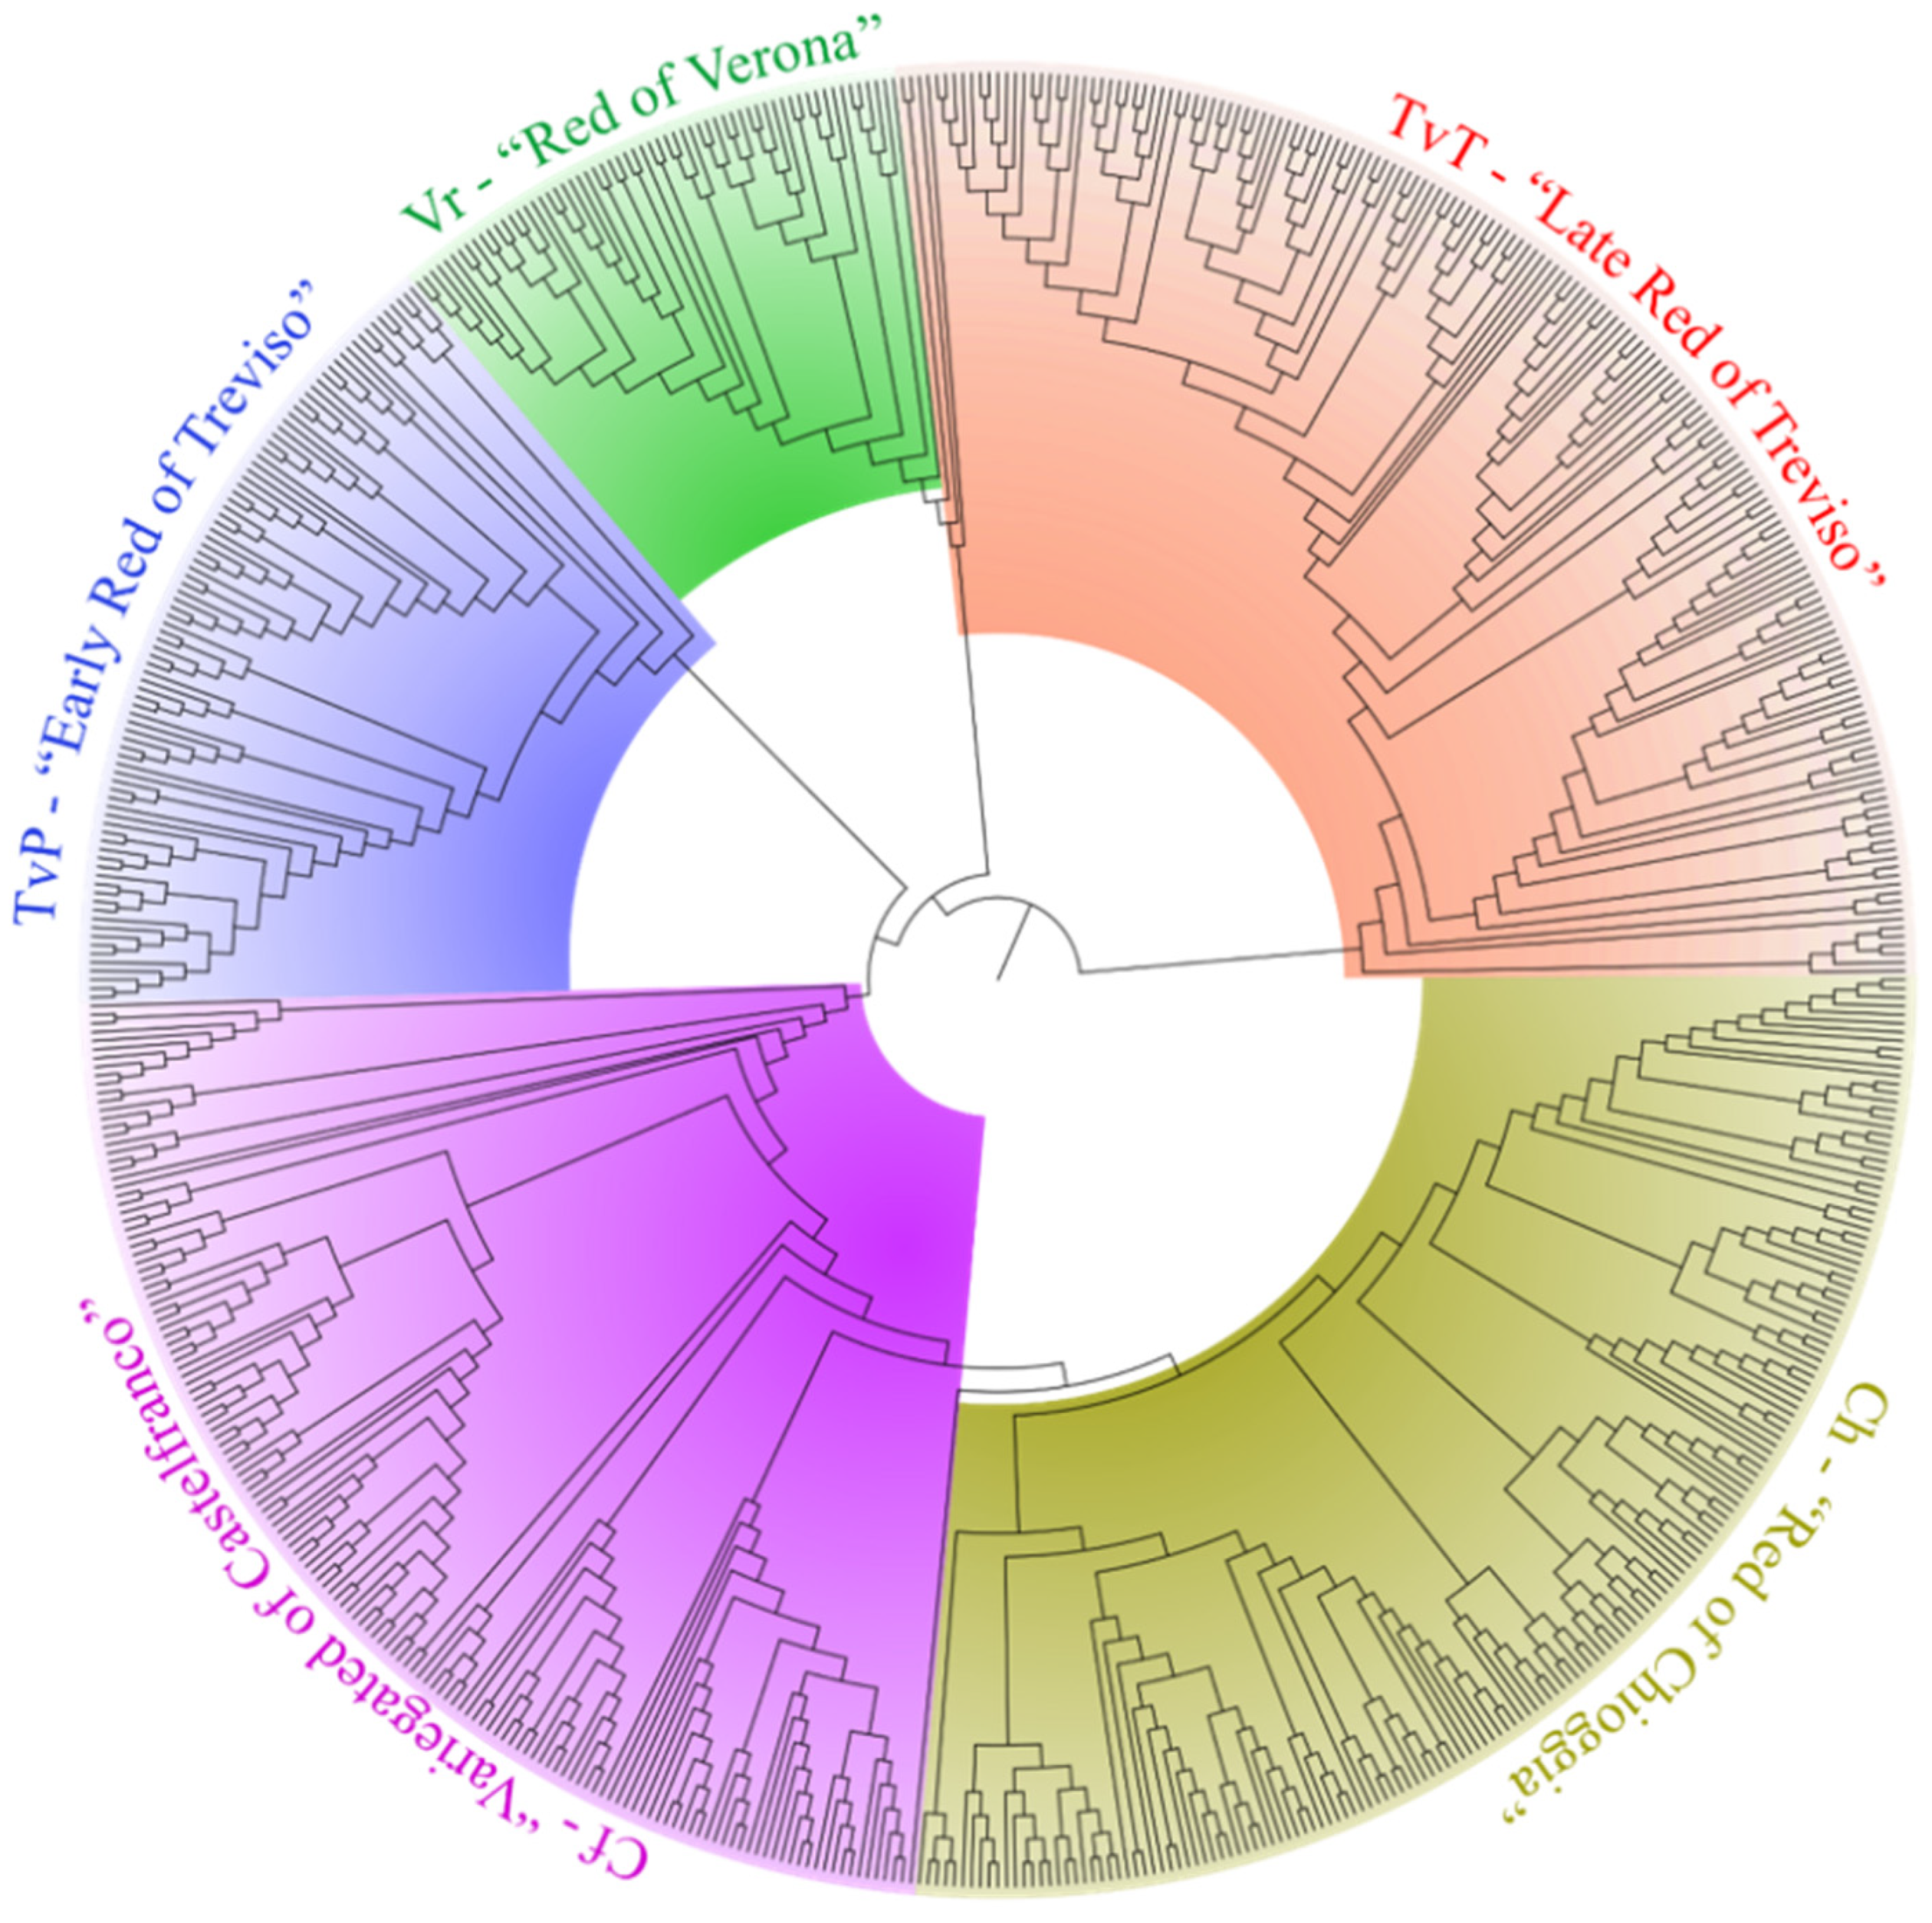
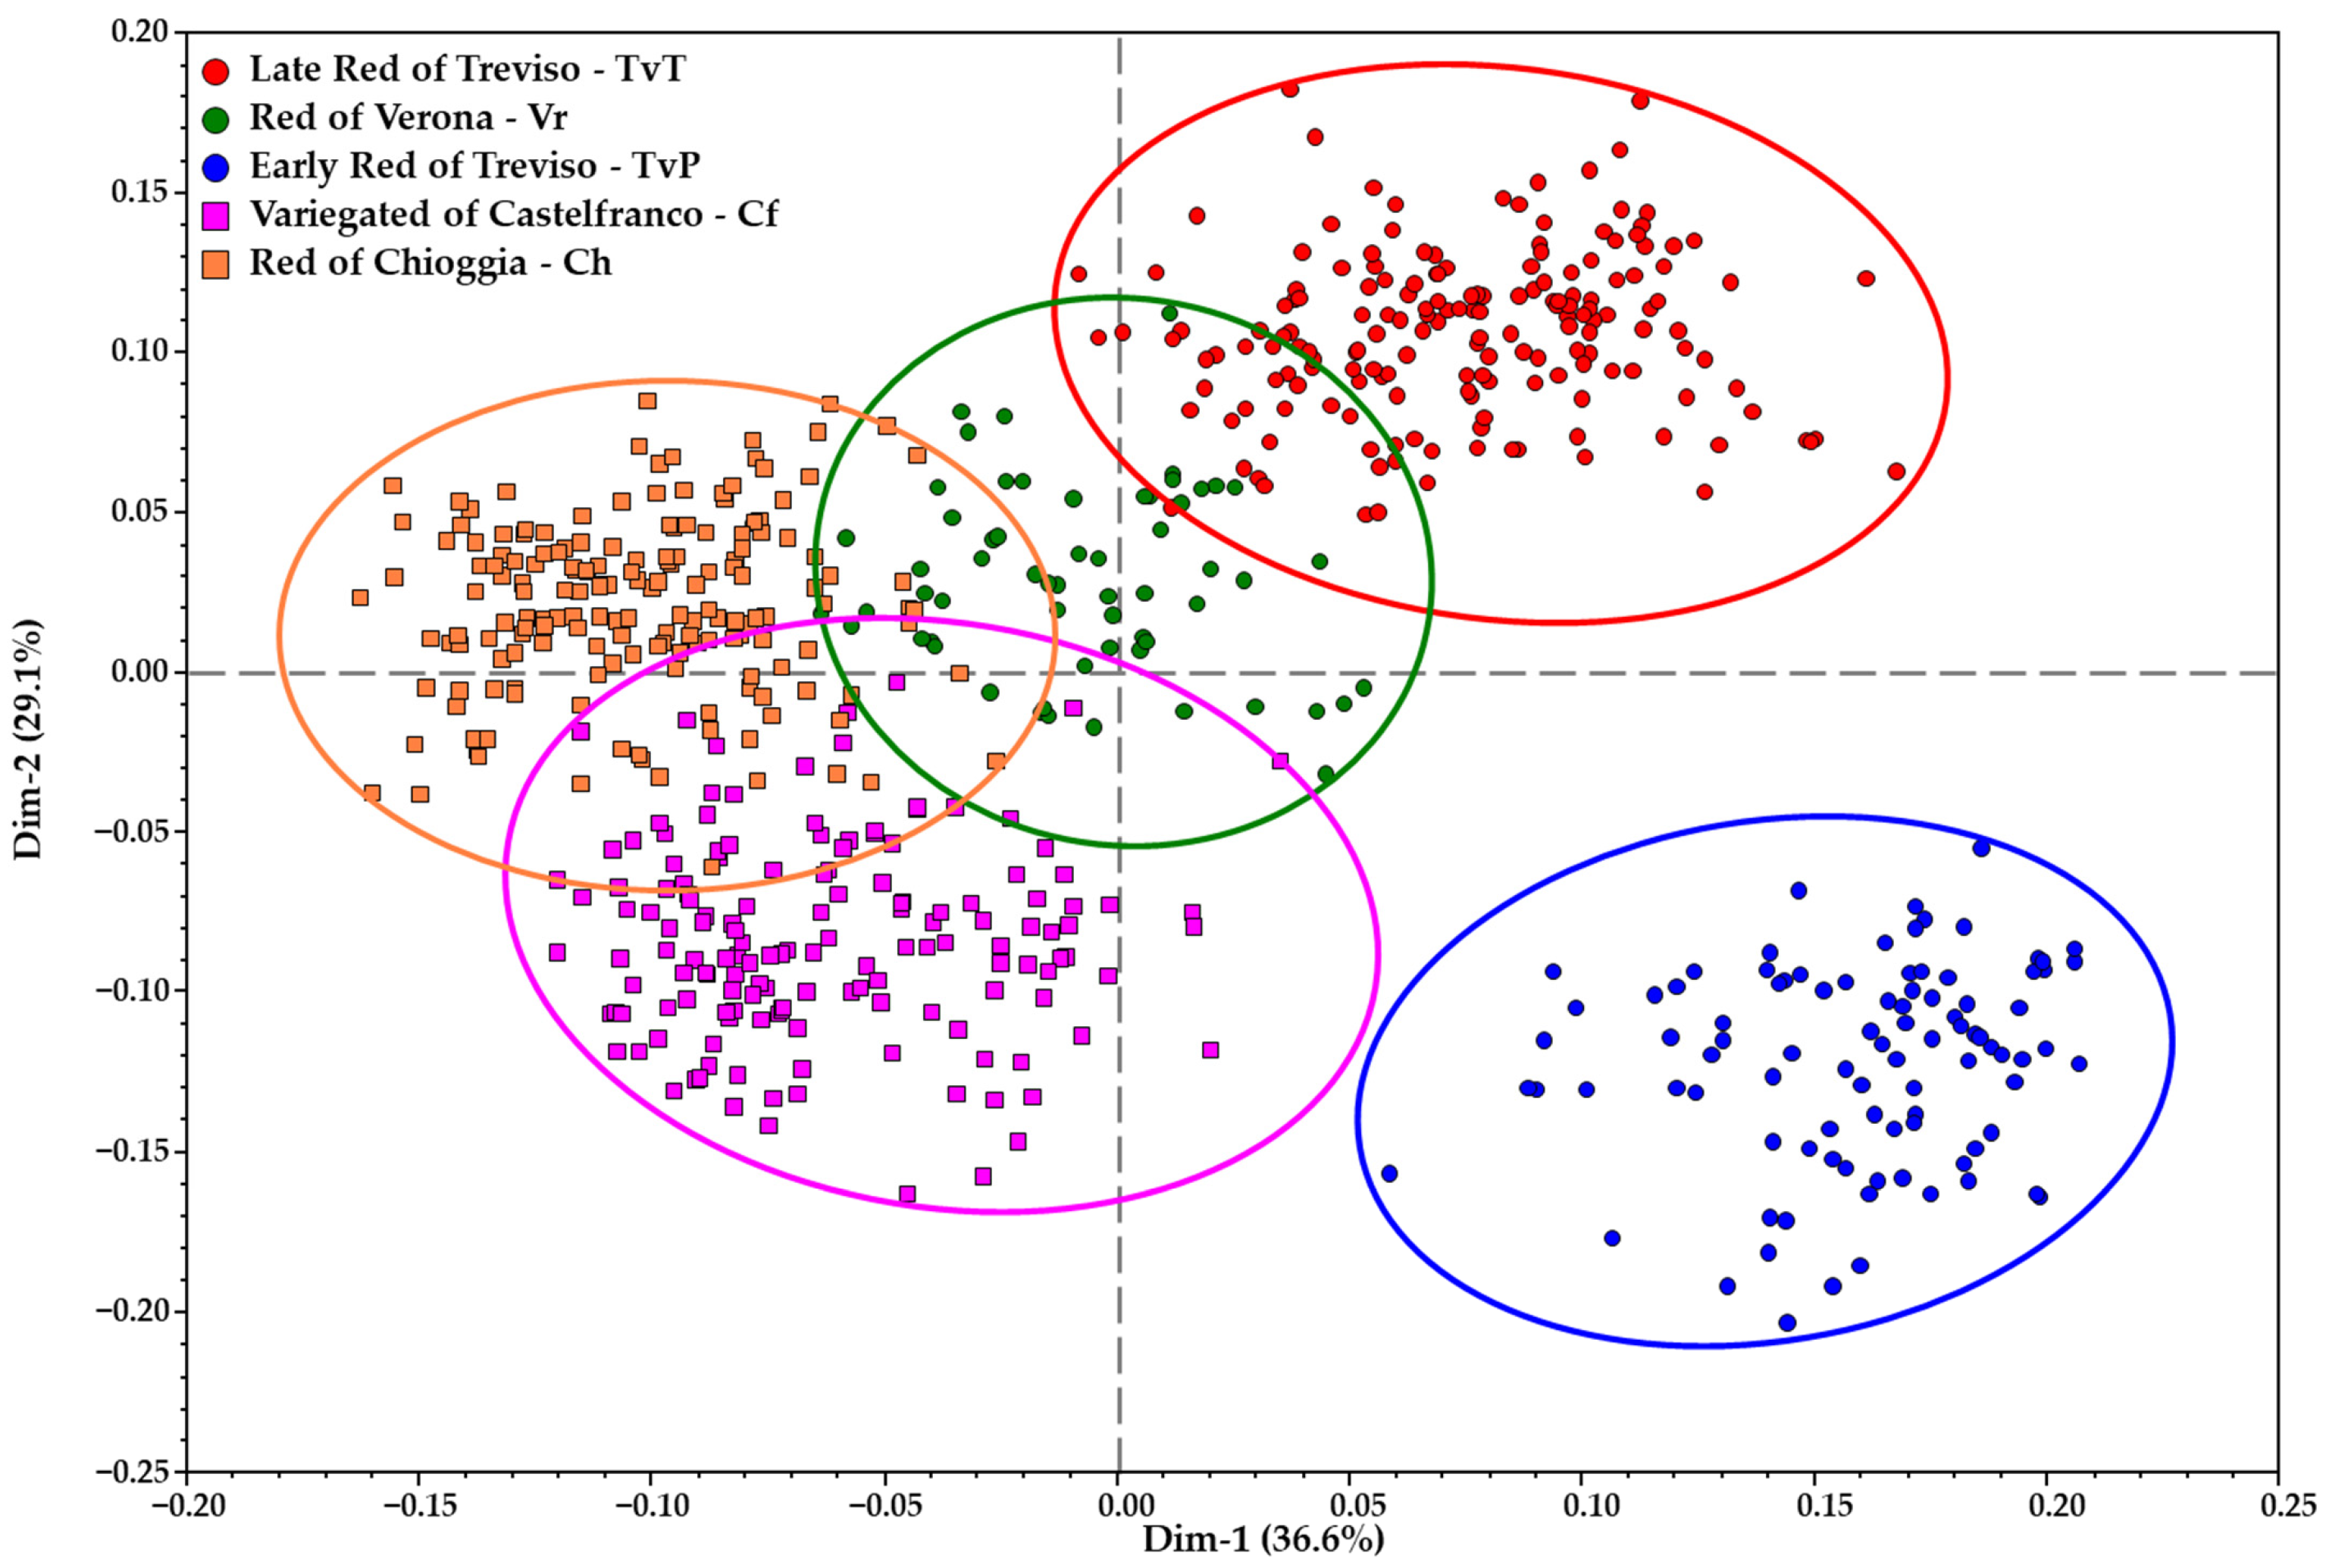
3.1. Genetic Relationships among Radicchio Populations and Biotypes

Genetic relationship investigations performed on single datasets produced a series of incongruent and unstable dendrograms, i.e., each independent run produced a different topology, probably as a consequence of the molecular markers used, their heritability, numerosity and variability (Supplementary Figures S2 and S3). Conversely, the obtained results from the combined matrix showed a relatively more stable topology both in the backbone and in the clusters within varieties (Figure 1). The more likelihood dendrogram had a topology where higher statistical corroboration was associated with terminal or subterminal nodes, but some notable exceptions occurred in basal and sub-basal nodes (see Supplementary Figure S1 for supporting statistics of nodes and branches).
The Vr, TvP and Ch biotype samples formed monophyletic groups. The Vr and TvP received statistical support from all tests, while the Ch clade was corroborated by the BT and SH-aLRT values (Supplementary Figure S1). The TvT samples were almost all grouped together (Figure 1). However, four of them (TvT2_15, TvT2_16, TvT2_34, TvT2_32) clustered with the Vr clade. Finally, the Cf samples formed a global cluster that was paraphyletic to the Ch clade (Supplementary Figure S1).
The node splitting the TvP clade and the Cf+Ch group was supported only by UFB. Within each of the main para/monophyletic biotypes, several subclades were present. Most of them were supported by one or more statistical tests at different ranks, probably mirroring AFLP clustering.

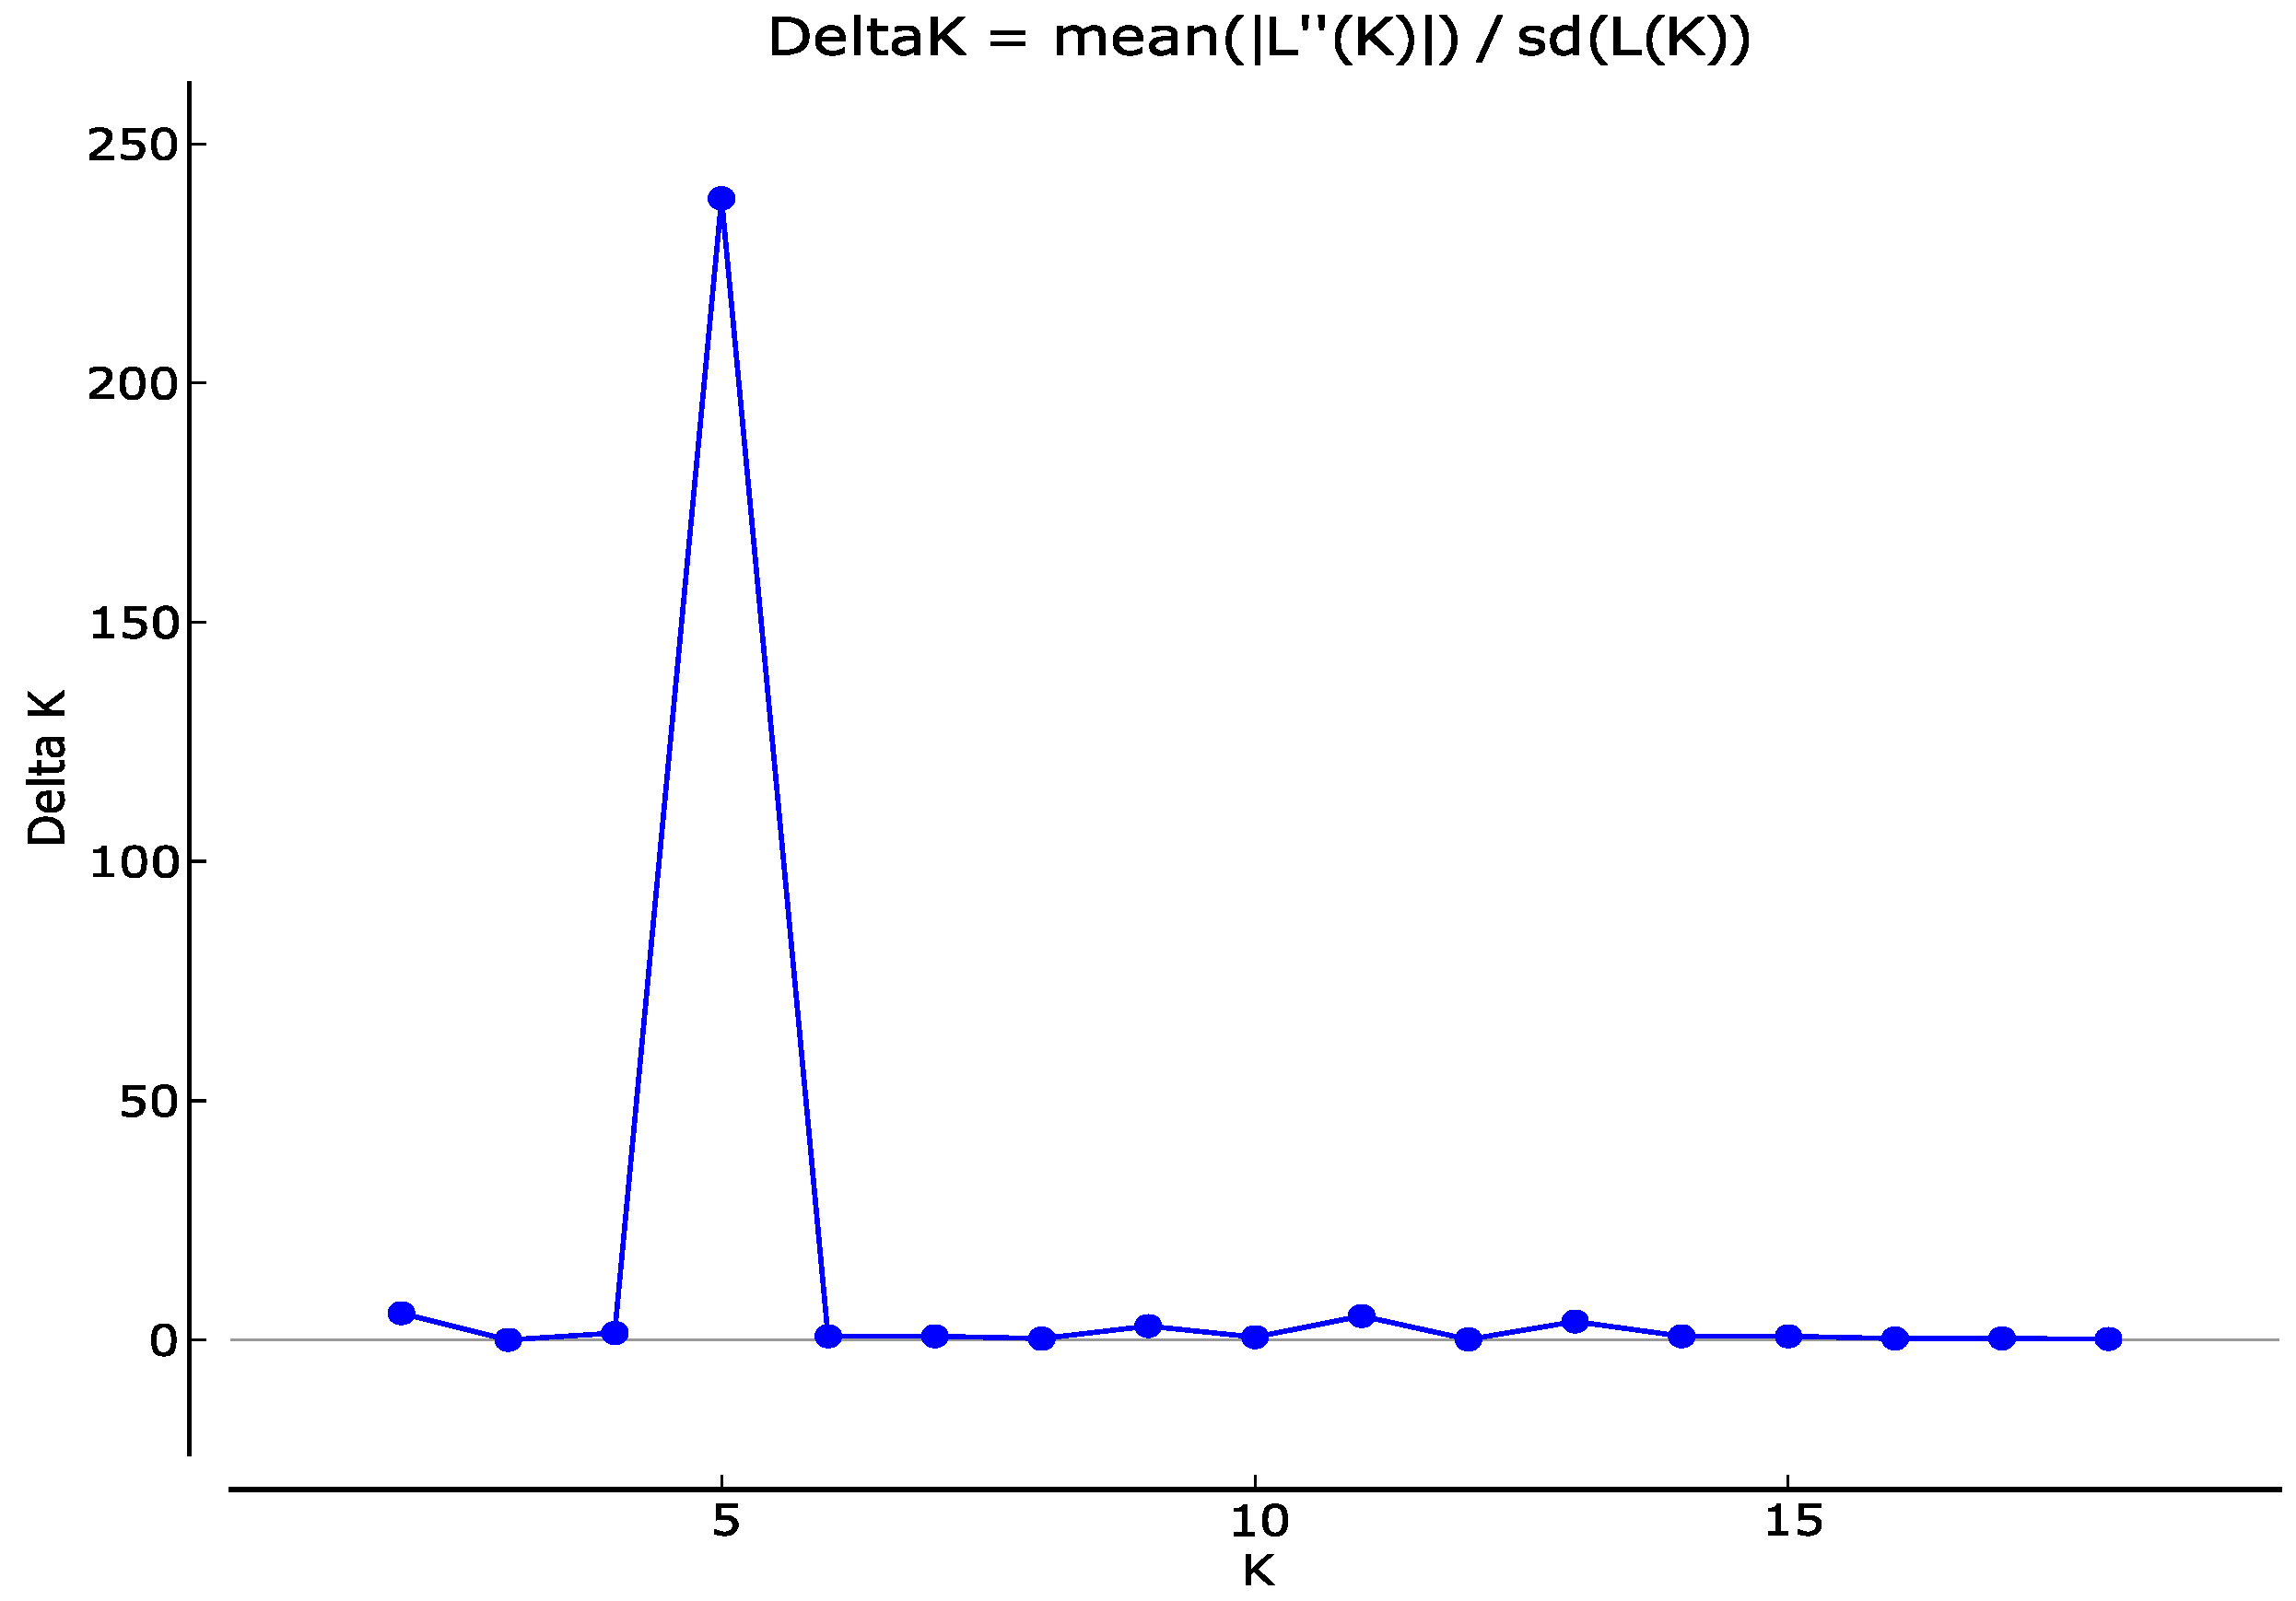
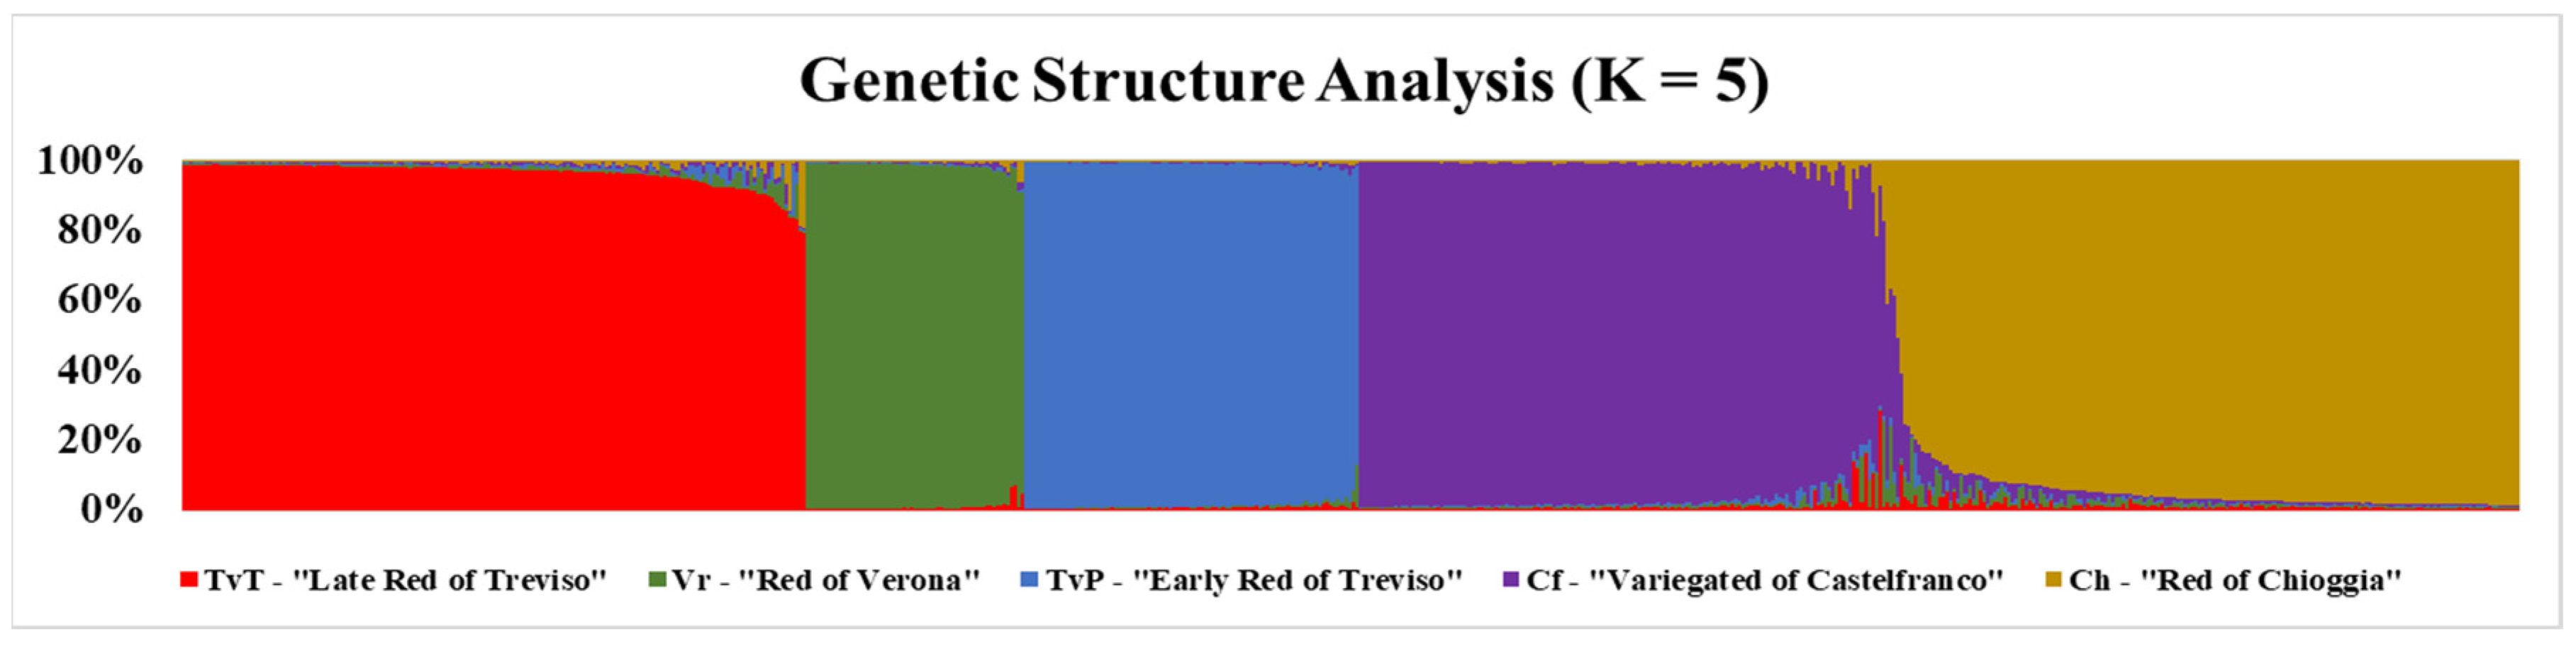
3.2. Genetic Structure of the Radicchio Core Collection and Biotype Clustering

Regarding the investigation of the genetic structure of the radicchio core collection, the STRUCTURE harvester software estimated the best value of K equal to 5 (ΔK= 238.6 in Figure 2), and the memberships of 652 samples grouped them in accordance with the biotypes to which they belonged. Each group was labelled using the same colours of the ML dendrogram as previously described, with 634 samples showing strong memberships with the corresponding cluster (>90%) and 18 samples presenting admixtures between the five groups were identified. The vast majority of admixed samples belonged to the Red of Chioggia and the Variegated of Castelfranco biotypes (five and 13 samples with main membership below 90%, respectively), but two samples belonging to the “Late Red of Treviso” were present with membership in their respective group equal to 79.8% and 79.4%, which was slightly lower than the considered threshold (Figure 3).

3.3. Genetic Statistics of Populations and Biotypes

Descriptive statistics of overall RAPD and AFLP markers for single and grouped populations, based on their biotype, and the whole radicchio core collection are reported, together with Nei’s diversity statistics and gene flow estimates, in Table 2 (standard deviations are available for each population and biotype in rows headed with s.d. in Supplementary Table S1). Nei’s unbiased genetic diversity, calculated among the entire dataset, was H’ = 0.130 (s.d. = 0.178), and it varied between 0.070 (s.d. = 0.151), overall Vr, and 0.110 (s.d. = 0.170), overall Ch. Shannon’s information index (I) of phenotypic diversity for all biotypes was I = 0.202 (s.d. = 0.257), with the minimum value calculated for Vr (0.105, with s.d. = 0.220) and the maximum value calculated for Ch (0.170, with s.d. = 0.249) (Table 2 and Supplementary Table S1). Dice’s genetic similarity (GS) was also computed and ranged between 0.946 within the Chioggia biotype and 0.962 within the Verona biotype. The average GS calculated among the 652 samples of the radicchio core collection was equal to 0.931 (Dice’s GS standard errors were always below 0.001) (Table 2). Nei’s diversity statistics were calculated for each radicchio population, biotype and overall. The total genetic diversity assessed with the molecular marker dataset was H’T = 0.132 (s.d. = 0.032), and it was higher in the Ch biotype (0.109, with s.d. = 0.029) and lower in the Vr biotype (0.070, with s.d. = 0.023). The genetic differentiation (DST) among the core collection was equal to 0.064, with the highest values calculated for Ch1 (0.107) and the lowest one for Vr1 (0.028). The biotype genetic differentiation estimates ranged from 0.006 (Red of Verona) to 0.030 (Red of Chioggia). The proportion of the overall genetic diversity among the core collection was GST = 0.488, while the gene flow estimate was Nm = 0.524. Specifically, the biotype gene flow was never below 1 and ranged from 1.068 in the variegated Castelfranco to 5.032 in the red Verona, while the GST values were between 0.090 (Vr) and 0.319 (Cf) (Table 2). Notably, the two Red of Verona populations had Nm values of 0.731 and 0.422 in Vr1 and Vr2, respectively.

3.4. Genetic Similarity Analysis within and between Populations or Biotypes

Dice’s genetic similarity was computed to create a GS matrix in all pairwise comparisons. Average GS values within and among each population and biotype were calculated to create two GS matrices (Table 3 and Table 4; standard errors were computed that were always below 0.001; for this reason, they were not reported in the tables). The average genetic similarity within populations is reported in Table 2, while that calculated among them is reported in Table 3 and ranged from 0.891 (TvP3 vs. Ch6) to 0.971 (TvT4 vs. TvT5). Similarly, the average genetic similarity calculated among and within biotypes is reported in Table 4, with the within values also reported in Table 2.
The average GS values calculated by comparing the different biotypes ranged from 0.905 (TvP vs. Ch) to 0.934 (Cf vs. Ch).
By means of the genetic similarity matrix, a PCoA was computed in order to highlight the clustering model of samples depending on their biotype of origin. Figure 4 reports overall samples of the main biotypes plotted according to the first two dimensions that explain 65.7% of the total genetic variability found in the core collection of radicchio.

4. Discussion

The results of the analyses performed on the five most common biotypes of radicchio cultivated in north-eastern Italy helped, giving new insights about their genetic relationships, including the uniqueness and relatedness extents of their gene pools, also confirming what was known from historical reports [19,20,21]. As was already reported, the oldest radicchio biotype in this area is the “Late Red of Treviso (TvT)”, followed by the “Variegated of Castelfranco (Cf)”, which originates from the interspecific crossing of TvT with the relative species of C. endivia. From these two, separate selection events occurred that gave rise to the most recent biotypes nowadays available [7,20,21]. The combination of the ML dendrogram, the genetic structure, similarity and diversity statistics analyses here provided allow a clearer interpretation of the historical and morphological information already available, confirming them from a molecular and genetic perspective.
From the analyses of the genetic variability and relationships, including genetic diversity and similarity statistics, and gene flow estimates, it was observed that the five radicchio biotypes analyzed are distinguishable from each other and are mostly uniform within each of the biotypes. Specifically, the genetic differentiation (DST) detected within biotypes was lower than 3.0%, thus meaning that the populations from which they were derived were highly similar, while the core collection’s value was above 6%. The same result was obtained through Dice’s GS analysis, from which within GS estimates were above 94.6% and among ones were below 93.4%. These findings were again supported by the low Nm values calculated for the entire core collection (overall Nm < 1) and those observed within groups (within biotypes Nm > 1), thus demonstrating that genotypes had low gene migration among them, while the Nm values within populations were higher; hence, gene flow occurs among populations of the same biotype, but it is minimal or absent among different ones [54] (Table 2).
Later, the ML dendrogram reflected those obtained by the genetic statistics analysis, from which samples were clustered depending on biotype but not on population (Figure 1 and Figure S1). In agreement with Bianchedi’s previously mentioned work [19], TvT was selected as the sister group of other analyzed radicchio biotypes.
The fully supported node, carrying the split between TvT and the other biotypes, indicated a clear separation with the historical ancestor even if some of the TvT samples were closely related to the Vr group rather than clustered with other TvTs. We suppose that this misplacement was due to an undesired effect of the dataset, most likely related to the RAPD markers used. Nevertheless, the distinctiveness of TvT and Vr was once again confirmed by the fully supported node at the base of Vr clade.
The arrangement on the dendrogram of “Early Red of Treviso” (TvP) and the two remaining biotypes (Cf and Ch) is supported only by bootstrap value but indicate a better genetic connection with them than with Vr. However, it is necessary to consider both the historical literature [7,19] and some typical morphological traits (i.e., leaf shape, white ribbing and percentage of red-leaf area) shared among the TvT and Vr biotypes. Furthermore, the strong support on the basal nodes of the TvP cluster sustains that selection was, reasonably, carried out with more professional skills and accurate methods than those utilized with the Vr biotype. So, we can infer that is more likely that its constitution occurred recently from the TvT-Vr ancestors than from the other biotypes. After the pure biotypes of C. intybus, the derived interspecific crosses were arranged in a wide monophyletic group. The less genetically divergent ancestor, compared to the common ancestor (TvT), was Cf, in agreement with the reported historical information on its selection. This group presented a clear distinctiveness from those previously mentioned, but several subclades were observed within it that suggested different selection events occurring in this biotype. Moreover, the observed ML clustering agreed with the highest GST value observed (0.319) and the fact that, in this case, Cf samples were mostly grouped depending also on their population of belonging. After Cf, in accordance with historical reports about the origin of “Red of Chioggia (Ch)”, Ch was observed to be the less genetically related biotype to TvT.
One more important finding, confirming the derived nature of Ch from Cf, by phenotypic selection of a reduced number of populations, is the close relation of the Ch group with the analyzed Cf2 and Cf5 populations (see also Cf5_27 sample placement in Supplementary Figure S1). The Ch clade, which exhibited high within genetic variability levels (H’T = 0.109), presented several subclades, but the nodes’ supporting statistics did not univocally confirm the Ch sample placement, suggesting reduced distinctiveness of this biotype’s populations (Supplementary Figure S1). Supporting both the ML dendrogram and the genetic statistics results, the genetic structure analysis of the core collection confirmed the reliability of the method used and emphasized the distinctiveness of the analyzed biotypes. The five groups identified for the most probable value of K (K = 5 in Figure 2) were able to cluster samples according to their biotype of origin with high membership values, generally above 90% (Figure 3), which also agrees with the low gene flow results observed among the whole core collection (Nm = 0.524 in Table 2). Moreover, the presence of 18 admixed samples between Ch and Cf biotypes (Figure 3) confirmed the previous findings on their genetic relationship.
Once more, demonstrating the distinctiveness of the radicchio biotypes, the previous results were confirmed by the PCoA analysis (Figure 4), which clustered samples according to their biotype of origin. Populations of TvT and Vr were placed closely, with TvP clearly distinguishable from the other C. intybus pure biotypes, yet strongly separated, depending on the first coordinate of the PCoA, from Cf with Ch, which samples were positioned opposite the pure C. intybus biotypes, although some overlapping with few Vr samples were observed. These results agreed with those observed in Figure 3 and Figure S1, demonstrating the distinctiveness of the radicchio biotypes, but not the uniqueness of the populations within them. Another important finding is that Vr is closer to TvT than all the other analyzed biotypes, probably due to a less pushed selection in it than that observed for TvP populations, whose genetic relatedness with the ancestor TvT is lower and comparable to that of the interspecific biotypes analyzed. Nevertheless, all C. intybus pure biotypes are placed on one side of the PCoA graph, thus clearly separating pure genealogies from interspecific individuals. Along with this, the number of admixed individuals identified by STRUCTURE software analysis mainly belong to Cf and Ch populations, with only a few individuals admixed with TvT and Vr (accordingly with the PCoA overlapping results), and the ML dendrogram showed a closer relatedness of the pure C. intybus individual to the ancestor TvT than that of the interspecific biotypes.

5. Conclusions

The unveiling of the molecular relationships, genetic distinctiveness and relatedness of Venetian local farmers’ radicchio biotypes gives not only important knowledge from a historical and cultural point of view but also from a genetic one, as these irreplaceable resources should be collected and preserved in germplasm banks for agronomic and molecular characterization and potential exploitation by breeding programs of C. intybus (leaf chicory) cultivated materials. Most of these germplasm resources are local farmer-derived varieties, and a few of them also include professional breeder-improved ones typically exhibiting a great deal of genetic diversity in their morphology, physiology and productivity. However, it appears that variation for resilient traits related to biotic and abiotic stresses is scarce among plants of these local populations, probably because farmers traditionally focused their recurrent selection programs on morphological and aesthetic characteristics, instead of disease resistance, environmental stress tolerance or postharvest quality traits.
In conclusion, the DNA fingerprinting approach used to molecularly characterize a core collection of old farmers’ populations of radicchio allowed us to verify not only the genetic distinctiveness of their five main biotypes, but also to reconstruct the genetic relationships among them and to obtain a confirmation of the historical information on their genealogy. Nonetheless, further investigations based on a significant number of discriminant codominant marker loci widespread in the genome, possibly using highly informative NGS-based genotyping technologies, would certainly increase our knowledge of the phylogenies of radicchio biotypes and interspecific hybridization events occurring in this crop plant. This information could also lead to the aims of maintenance of the germplasm resources and the improvement, through efficient marker-assisted breeding (MAB) and selection (MAS) protocols, of this important leafy vegetable.

Supplementary Materials

The following supporting information can be downloaded at: https://www.mdpi.com/article/10.3390/d14030175/s1, Figure S1: Maximum Likelihood (−ln = 5698.207), obtained analyzing dendrogram the combined dataset of molecular markers. (RAPD+AFLP). The acronyms indicate the biotypes: TvT, “Late Red of Treviso”; Vr, “Red of Verona”; TvP, “Early Red of Treviso”; Cf, “Variegated of Castelfranco” and Ch, “Red of Chioggia”. Numbers report the original population and the progressive number of the samples within the population; Coloured dots on the nodes indicate the support: , Bootstrap (≥75); , SH-aLRT (≥75); , UFB (≥90). Figure S2: Maximum Likelihood dendrogram (−ln = 3292.1230) obtained analyzing RAPD dataset. The acronyms indicate the biotypes: TvT, “Late Red of Treviso”; Vr, “Red of Verona”; TvP, “Early Red of Treviso”; Cf, “Variegated of Castelfranco” and Ch, “Red of Chioggia. Figure S3: Maximum Likelihood dendrogram (−ln = 961.5553) obtained analyzing AFLP dataset. To the single sample was assigned the corresponding AFLP profile of the appropriate bulk. The acronyms indicate the biotypes: TvT, “Late Red of Treviso”; Vr, “Red of Verona”; TvP, “Early Red of Treviso”; Cf, “Variegated of Castelfranco” and Ch, “Red of Chioggia. Table S1: Descriptive statistics, and standard deviations (s.d.), over all marker loci including the number of individuals (N), number (npl) and percentage (%pl) of polymorphic loci, mean number of observed (na) and effective (ne) alleles per locus, Nei’s genetic diversity (H’), Shannon’s infor-mation index (I), Dice’s genetic similarity coefficient (GS), total genetic diversity per biotype and overall (H’T), expected heterozygosity (H’S) within biotypes and overall, genetic differentiation (DST) and proportional genetic diversity (GST), and gene flow estimates (Nm).

Author Contributions

Conceptualization, G.B. and E.N.; methodology, A.B. and F.S.; validation, A.B. and F.S.; formal analysis, A.B. and F.S.; investigation, A.B. and F.S.; resources, G.B. and M.L.; data curation, A.B. and F.S.; writing—original draft preparation, F.S. and A.B.; writing—review and editing, G.B., E.N. and M.L.; visualization, A.B and F.S.; supervision, G.B., E.N. and M.L.; project administration, G.B.; funding acquisition, G.B. All authors have read and agreed to the published version of the manuscript.

Funding

This research received no external funding.

Institutional Review Board Statement

Not applicable.

Data Availability Statement

Data in this study can be provided by corresponding author upon request.

Conflicts of Interest

The authors declare no conflict of interest.

References

  1. Simko, I.; Jia, M.; Venkatesh, J.; Kang, B.-C.; Weng, Y.; Barcaccia, G.; Lanteri, S.; Bhattarai, G.; Foolad, M.R. Genomics and marker-assisted improvement of vegetable crops. Crit. Rev. Plant Sci. 2021, 40, 303–365. [Google Scholar] [CrossRef]
  2. Funk, V.A.; Susanna, A.; Steussy, T.F.; Bayer, R.J. Systematics, Evolution, and Biogeography of Compositae; International Association for Plant Taxonomy: Vienna, Austria, 2009. [Google Scholar]
  3. Susanna, A.; Baldwin, B.G.; Bayer, R.J.; Bonifacino, J.M.; Garcia-Jacas, N.; Keeley, S.C.; Mandel, J.R.; Ortiz, S.; Robinson, H.; Stuessy, T.F. The classification of the Compositae: A tribute to Vicki Ann Funk (1947–2019). Taxon 2020, 69, 807–814. [Google Scholar] [CrossRef]
  4. Bremer, K. Asteraceae: Cladistics and Classification; Timber Press: Portland, OR, USA, 1994. [Google Scholar]
  5. Barcaccia, G.; Ghedina, A.; Lucchin, M. Current Advances in Genomics and Breeding of Leaf Chicory (Cichorium intybus L.). Agriculture 2016, 6, 50. [Google Scholar] [CrossRef] [Green Version]
  6. Kiers, A.M. Endive, chicory, and their wild relatives. A systematic and phylogenetic study of Cichorium (Asteraceae). Gorteria Dutch Bot. Arch. Suppl. 2000, 5, 1–77. [Google Scholar]
  7. Lucchin, M.; Varotto, S.; Barcaccia, G.; Parrini, P. Chicory and Endive. In Vegetables I: Asteraceae, Brassicaceae Chenopodi-Caceae; Prohens, J., Nuez, F., Eds.; Handbook of Plant Breeding; Springer: New York, NY, USA, 2008; Volume 1, pp. 3–48. [Google Scholar]
  8. Barcaccia, G.; Varotto, S.; Soattin, M.; Lucchin, M.; Parrini, P. Genetic and molecular studies of sporophytic self-incompatibility in Cichorium intybus L. In Proceedings of the Eucarpia Meeting on Leafy Vegetables Genetics and Breeding, Noordwijkerhout, The Netherlands, 19–21 March 2003; p. 154. [Google Scholar]
  9. Barcaccia, G.; Pallottini, L.; Soattin, M.; Lazzarin, R.; Parrini, P.; Lucchin, M. Genomic DNA fingerprints as a tool for identifying cultivated types of radicchio (Cichorium intybus L.) from Veneto, Italy. Plant Breed. 2003, 122, 178–183. [Google Scholar] [CrossRef] [Green Version]
  10. Patella, A.; Scariolo, F.; Palumbo, F.; Barcaccia, G. Genetic Structure of Cultivated Varieties of Radicchio (Cichorium intybus L.): A Comparison between F1 Hybrids and Synthetics. Plants 2019, 8, 213. [Google Scholar] [CrossRef] [PubMed] [Green Version]
  11. Palumbo, F.; Galla, G.; Martínez-Bello, L.; Barcaccia, G. Venetian Local Corn (Zea mays L.) Germplasm: Disclosing the Genetic Anatomy of Old Landraces Suited for Typical Cornmeal Mush Production. Diversity 2017, 9, 32. [Google Scholar] [CrossRef] [Green Version]
  12. Palumbo, F.; Galla, G.; Barcaccia, G. Developing a Molecular Identification Assay of Old Landraces for the Genetic Authentication of Typical Agro-Food Products: The Case Study of the Barley ‘Agordino’. Food Technol. Biotechnol. 2017, 55, 29–39. [Google Scholar] [CrossRef]
  13. Sica, P.; Galvao, A.; Scariolo, F.; Maucieri, C.; Nicoletto, C.; Pilon, C.; Sambo, P.; Barcaccia, G.; Borin, M.; Cabrera, M.; et al. Effects of Drought on Yield and Nutraceutical Properties of Beans (Phaseolus spp.) Traditionally Cultivated in Veneto, Italy. Horticulturae 2021, 7, 17. [Google Scholar] [CrossRef]
  14. Nicolè, S.; Barcaccia, G.; Erickson, D.L.; Kress, J.W.; Lucchin, M. The coding region of the UFGT gene is a source of diagnostic SNP markers that allow single-locus DNA genotyping for the assessment of cultivar identity and ancestry in grapevine (Vitis vinifera L.). BMC Res. Notes 2013, 6, 502. [Google Scholar] [CrossRef] [Green Version]
  15. Hmmam, I.; Mariotti, R.; Ruperti, B.; Cultrera, N.; Baldoni, L.; Barcaccia, G. Venetian olive (Olea europaea) germplasm: Disclosing the genetic identity of locally grown cultivars suited for typical extra virgin oil productions. Genet. Resour. Crop Evol. 2018, 65, 1733–1750. [Google Scholar] [CrossRef]
  16. Gonthier, L.; Blassiau, C.; Morchen, M.; Cadalen, T.; Poiret, M.; Hendriks, T.; Quillet, M.C. High-density genetic maps for loci involved in nuclear male sterility (NMS1) and sporophytic self-incompatibility (S-locus) in chicory (Cichorium intybus L., Asteraceae). Theor. Appl. Genet. 2013, 126, 2103–2121. [Google Scholar] [CrossRef] [PubMed]
  17. Palumbo, F.; Qi, P.; Pinto, V.B.; Devos, K.M.; Barcaccia, G. Construction of the First SNP-Based Linkage Map Using Genotyping-by-Sequencing and Mapping of the Male-Sterility Gene in Leaf Chicory. Front. Plant Sci. 2019, 10, 276. [Google Scholar] [CrossRef]
  18. Ghedina, A.; Galla, G.; Cadalen, T.; Hilbert, J.L.; Caenazzo, S.T.; Barcaccia, G. A method for genotyping elite breeding stocks of leaf chicory (Cichorium intybus L.) by assaying mapped microsatellite marker loci. BMC Res. Notes 2015, 8, 831. [Google Scholar] [CrossRef] [PubMed] [Green Version]
  19. Bianchedi, A. I radicchi di Treviso: Storia, coltivazione, forzatura e commercio. Ital. Agric. 1961, 98, 37–51. [Google Scholar]
  20. Pimpini, F.; Chillemi, G. Evoluzione delle tecniche colturali e prospettive di sviluppo dei radicchi veneti. In Proceedings of the I Radicchi Veneti: 20 Anni di Esperienze Produttive e Commerciali, Verona, Italy, 1 December 1993; pp. 9–28. [Google Scholar]
  21. Pimpini, F.; Chillemi, G.; Lazzarin, R.; Bertolini, P.; Marchetti, C. Il Radicchio Rosso di Chioggia. Aspetti Tecnici ed Economici di Produzione e Conservazione; Veneto Agricoltura: Legnaro, Padova, 2001. [Google Scholar]
  22. Galla, G.; Ghedina, A.; Tiozzo, S.C.; Barcaccia, G. Toward a First High-quality Genome Draft for Marker-assisted Breeding in Leaf Chicory, Radicchio (Cichorium intybus L.). In Plant Genomics; Abdurakhmonov, I.Y., Ed.; IntechOpen: London, UK, 2016. [Google Scholar]
  23. Barcaccia, G.; Rosellini, D. A quick method for the isolation of plant DNA suitable for RAPD analysis. J. Genet. Breed. 1996, 50, 177–180. [Google Scholar]
  24. Barcaccia, G.; Mazzucato, A.; Belardinelli, A.; Pezzotti, M.; Lucretti, S.; Falcinelli, M. Inheritance of parental genomes in progenies of Poa pratensis L. from sexual and apomictic genotypes as assessed by RAPD markers and flow cytometry. Theor. Appl. Genet. 1997, 95, 516–524. [Google Scholar] [CrossRef]
  25. Barcaccia, G.; Mazzucato, A.; Albertini, E.; Zethof, J.; Gerats, A.; Pezzotti, M.; Falcinelli, M. Inheritance of parthenogenesis in Poa pratensis L.: Auxin test and AFLP linkage analyses support monogenic control. Theor. Appl. Genet. 1998, 97, 74–82. [Google Scholar] [CrossRef]
  26. Barcaccia, G.; Albertini, E.; Falcinelli, M. AFLP fingerprinting in Pelargonium peltatum: Its development and potential in cultivar identification. J. Hortic. Sci. Biotechnol. 1999, 74, 243–250. [Google Scholar] [CrossRef]
  27. Barcaccia, G.; Albertini, E.; Rosellini, D.; Tavoletti, S.; Veronesi, F. Inheritance and mapping of 2 n-egg production in diploid alfalfa. Genome 2000, 43, 528–537. [Google Scholar] [CrossRef]
  28. Vos, P.; Hogers, R.; Bleeker, M.; Reijans, M.; van de Lee, T.; Hornes, M.; Frijters, A.; Pot, J.; Peleman, J.; Kuiper, M.; et al. AFLP: A new technique for DNA fingerprinting. Nucleic Acids Res. 1995, 23, 4407–4414. [Google Scholar] [CrossRef] [PubMed] [Green Version]
  29. Cnops, G.; den Boer, B.; Gerats, A.; Van Montagu, M.; Van Lijsebettens, M. Chromosome landing at the Arabidopsis TORNADO1 locus using an AFLP-based strategy. Mol. Genet. Genom. 1996, 253, 32–41. [Google Scholar] [CrossRef]
  30. Rohlf, F.J. NTSYS-pc: Numerical Taxonomy and Multivariate Analysis System Version 2.1: Owner Manual; Exeter Publishing: Setauket, NY, USA, 2000. [Google Scholar]
  31. Nguyen, L.T.; Schmidt, H.A.; von Haeseler, A.; Minh, B.Q. IQ-TREE: A fast and effective stochastic algorithm for estimating maximum-likelihood phylogenies. Mol. Biol. Evol. 2015, 32, 268–274. [Google Scholar] [CrossRef] [PubMed]
  32. Kalyaanamoorthy, S.; Minh, B.Q.; Wong, T.K.F.; von Haeseler, A.; Jermiin, L.S. ModelFinder: Fast model selection for accurate phylogenetic estimates. Nat. Methods 2017, 14, 587–589. [Google Scholar] [CrossRef] [PubMed] [Green Version]
  33. Robinson, D.F.; Foulds, L.R. Comparison of phylogenetic trees. Math. Biosci. 1981, 53, 131–147. [Google Scholar] [CrossRef]
  34. Felsenstein, J. Inferring Phylogenies; Sinauer Associates, Inc.: Sunderland, MA, USA, 2004. [Google Scholar]
  35. Felsenstein, J. Phylogenies from Restriction Sites: A Maximum-Likelihood Approach. Evolution 1992, 46, 159–173. [Google Scholar] [CrossRef]
  36. Koopman, W.J.M. Phylogenetic signal in AFLP data sets. Syst. Biol. 2005, 54, 197–217. [Google Scholar] [CrossRef] [Green Version]
  37. Koopman, W.J.M.; Wissemann, V.; De Cock, K.; Van Huylenbroeck, J.; De Riek, J.; Sabatlno, G.J.H.; Visser, D.; Vosman, B.; Ritz, C.M.; Maes, B.; et al. AFLP markers as a tool to reconstruct complex relationships: A case study in Rosa (Rosaceae). Am. J. Bot. 2008, 95, 353–366. [Google Scholar] [CrossRef]
  38. Smith, T.A.; Mendelson, T.C.; Page, L.M. AFLPs support deep relationships among darters (Percidae: Etheostomatinae) consistent with morphological hypotheses. Heredity 2011, 107, 579–588. [Google Scholar] [CrossRef]
  39. Kingston, S.E.; Adams, L.D.; Rosel, P.E. Testing mitochondrial sequences and anonymous nuclear markers for phylogeny reconstruction in a rapidly radiating group: Molecular systematics of the Delphininae (Cetacea: Odontoceti: Delphinidae). BMC Evol. Biol. 2009, 9, 245. [Google Scholar] [CrossRef] [Green Version]
  40. Minh, B.Q.; Lanfear, R.; Ly, N.T.; Trifinopoulos, J.; Schrempf, D.; Schmidt, H.A. IQ-TREE Version 2.1.2: Tutorials and Manual Phylogenomic Software by Maximum Likelihood. 2021. Available online: http://www.iqtree.org/doc/iqtree-doc.pdf (accessed on 22 February 2022).
  41. Robinson, O.; Dylus, D.; Dessimoz, C. Phylo.io: Interactive Viewing and Comparison of Large Phylogenetic Trees on the Web. Mol. Biol. Evol. 2016, 33, 2163–2166. [Google Scholar] [CrossRef] [PubMed] [Green Version]
  42. Felsenstein, J. Confidence limits on phylogenies: An approach using the bootstrap. Evolution 1985, 39, 783–791. [Google Scholar] [CrossRef] [PubMed]
  43. Minh, B.Q.; Nguyen, M.A.; von Haeseler, A. Ultrafast approximation for phylogenetic bootstrap. Mol. Biol. Evol. 2013, 30, 1188–1195. [Google Scholar] [CrossRef] [PubMed]
  44. Hoang, D.T.; Chernomor, O.; von Haeseler, A.; Minh, B.Q.; Vinh, L.S. UFBoot2: Improving the Ultrafast Bootstrap Approximation. Mol. Biol. Evol. 2018, 35, 518–522. [Google Scholar] [CrossRef]
  45. Guindon, S.; Dufayard, J.F.; Lefort, V.; Anisimova, M.; Hordijk, W.; Gascuel, O. New algorithms and methods to estimate maximum-likelihood phylogenies: Assessing the performance of PhyML 3.0. Syst. Biol. 2010, 59, 307–321. [Google Scholar] [CrossRef] [Green Version]
  46. Pritchard, J.K.; Stephens, M.; Donnelly, P. Inference of population structure using multilocus genotype data. Genetics 2000, 155, 945–959. [Google Scholar] [CrossRef]
  47. Earl, D.A.; Vonholdt, B.M. STRUCTURE HARVESTER: A website and program for visualizing STRUCTURE output and implementing the Evanno method. Conserv. Genet. Resour. 2011, 4, 359–361. [Google Scholar] [CrossRef]
  48. Kimura, M.; Crow, J.F. The number of alleles that can be maintained in a finite population. Genetics 1964, 49, 725–738. [Google Scholar] [CrossRef]
  49. Nei, M. Analysis of gene diversity in subdivided populations. Proc. Natl. Acad. Sci. USA 1973, 70, 3321–3323. [Google Scholar] [CrossRef] [Green Version]
  50. Mcdermott, J.M.; Mcdonald, B.A. Gene Flow in Plant Pathosystems. Annu. Rev. Phytopathol. 1993, 31, 353–373. [Google Scholar] [CrossRef]
  51. Lewontin, R.C. The apportionment of human diversity. In Evolutionary Biology; Dobzhansky, T., Hecht, M.K., Steere, W.C., Eds.; Springer: New York, NY, USA, 1972; pp. 381–398. [Google Scholar]
  52. Yeh, F.C.; Yang, R.; Boyle, T.B.; Ye, Z.; Mao, J.X. POPGENE, the User-Friendly Shareware for Population Genetic Analysis; University of Alberta: Edmonton, AB, Canada, 1998; Volume 10, pp. 295–301. [Google Scholar]
  53. Dice, L.R. Measures of the amount of ecologic association between species. Ecology 1945, 26, 297–302. [Google Scholar] [CrossRef]
  54. Mitton, J.B. Gene Flow. In Brenner’s Encyclopedia of Genetics, 2nd ed.; Maloy, S., Hughes, K., Eds.; Academic Press: Cambridge, MA, USA, 2013; pp. 192–196. [Google Scholar]
Figure 1. Maximum likelihood dendrogram topology (−ln = 5698.207) depicting the genetic relationships among the different biotypes.
Diversity 14 00175 g001
Figure 2. Graph representing the ΔK values resulting from Structure Harvester software [47].
Diversity 14 00175 g002
Figure 3. Genetic structure analysis of the radicchio core collection. Identified most likely value of K = 5. Clusters and samples’ memberships agree with the biotype of radicchio to which they belong.
Diversity 14 00175 g003
Figure 4. Principal Coordinate Analysis (PCoA) based on the GS matrix calculated with the Dice’s coefficient in all possible pairwise comparisons using the whole DNA marker data set. Samples are labelled following the biotype of belonging and their centroids are subgrouped to better represent overlapping areas. Pure C. intybus biotypes are labelled with circles, while interspecific ones using squares.
Diversity 14 00175 g004
Table 1. List of RAPD primers and AFLP primer combinations (with restriction enzymes) used for genomic DNA fingerprinting.
Markers TypePrimer NamePrimer Sequence
RAPDOP-P01GTAGCACTCC
OP-Q17GAAGCCCTTG
OP-Q03GGTCACCTCA
OP-A08GTGACGTAGG
OP-M10TCTGGCGCAC
AFLPPstI+AA/MseI+CAAGACTGCGTACATGCAGAA
GACGATGAGTCCTGAGAGTAACAA
PstI+AT/MseI+CAAGACTGCGTACATGCAGAT
GACGATGAGTCCTGAGAGTAACAA
PstI+AG/MseI+CAGGACTGCGTACATGCAGAG
GACGATGAGTCCTGAGAGTAACAG
Table 2. Descriptive statistics over all marker loci including the number of individuals (N), number (npl) and percentage (%pl) of polymorphic loci, mean number of observed (na) and effective (ne) alleles per locus, Nei’s genetic diversity (H’) Shannon’s information index (I), Dice’s genetic similarity (GS) coefficient, total genetic diversity per biotype and overall (H’T), expected heterozygosity (H’S) within biotypes and overall, genetic differentiation (DST) and proportional genetic diversity (GST), and gene flow estimates (Nm).
Population IDNnpl%plnaneH’IGSH’TH’SDSTGSTNm
TvT1182822.1%1.2211.1440.0800.1200.951 0.0070.0800.9240.041
TvT2302318.1%1.1811.1240.0650.0960.962 0.0440.0430.4940.512
TvT3302519.7%1.1971.1200.0670.1010.961 0.0300.0570.6560.262
TvT4361915.0%1.1501.0940.0490.0740.971 0.0250.0620.7150.199
TvT5281713.4%1.1341.0960.0490.0720.970 0.0270.0590.6840.231
TvT6322519.7%1.1971.1260.0650.0980.962 0.0240.0630.7230.191
Overall TvT1744434.7%1.3471.1360.0840.1330.9580.0860.0670.0190.2251.727
s.d. 0.4780.2740.1520.2230.0140.0240.016
Vr1352318.1%1.1811.1070.0610.0920.965 0.0410.0280.4060.731
Vr2262519.7%1.1971.1110.0600.0930.964 0.0320.0380.5420.422
Overall Vr612721.3%1.2131.1190.0700.1050.9620.0700.0630.0060.0905.032
s.d. 0.4110.2770.1510.2200.0130.0230.019
TvP1302217.3%1.1731.0990.0530.0800.968 0.0300.0480.6140.314
TvP2352116.5%1.1651.0990.0590.0890.965 0.0030.0750.9590.021
TvP3282418.9%1.1891.1130.0680.1020.959 0.0500.0290.3680.859
Overall TvP933225.2%1.2521.1300.0780.1200.9530.0780.0600.0180.2291.687
s.d. 0.4360.2740.1540.2260.0150.0240.015
Cf1222418.9%1.1891.1260.0660.0990.960 0.0450.0430.4890.523
Cf2361612.6%1.1261.0750.0430.0650.975 0.0240.0640.7240.190
Cf3292116.5%1.1651.1120.0600.0890.966 0.0420.0460.5230.456
Cf4312519.7%1.1971.1110.0760.1110.956 0.0250.0630.7150.199
Cf5332015.8%1.1581.0940.0540.0800.970 0.0160.0720.8140.114
Overall Cf1513729.1%1.2911.1420.0850.1310.9520.0880.0600.0280.3191.068
s.d. 0.4560.2820.1590.2330.0140.0260.015
Ch1232116.5%1.1671.1010.0570.0870.966 0.0020.1070.9820.009
Ch3352217.3%1.1751.1090.0650.0960.963 0.0530.0570.5190.463
Ch4352721.3%1.2131.1300.0730.1090.960 0.0560.0540.4930.515
Ch5232620.5%1.2051.1240.0670.1010.963 0.0470.0620.5690.379
Ch6263225.2%1.2051.1240.0790.1210.954 0.0500.0590.5430.421
Ch7313225.2%1.2521.1960.0840.1270.952 0.0480.0610.5610.391
Overall Ch1734636.2%1.3621.1810.1100.1700.9460.1090.0790.0300.2741.323
s.d. 0.4830.3040.1700.2490.0170.0290.016
Mean Overall6526148.0%1.4801.2160.1300.2020.9310.1320.0680.0640.4880.524
s.d. 0.5020.3280.1780.2570.0200.0320.011
Table 3. Average Dice’s genetic similarity (GS) matrix calculated within and between the radicchio populations analyzed in this study. Colors range from green (highest values) through yellow (mid values) to red (lowest values).
TvT10.951
TvT20.9460.962
TvT30.9460.9580.961
TvT40.9500.9580.9620.971
TvT50.9520.9600.9610.9710.970
TvT60.9460.9500.9530.9560.9570.962
Vr10.9250.9320.9290.9310.9330.9320.965
Vr20.9220.9330.9310.9330.9350.9280.9600.964
TvP10.9110.9220.9230.9220.9230.9200.9190.9010.968
TvP20.9150.9350.9280.9320.9320.9220.9330.9190.9410.965
TvP30.9030.9190.9150.9190.9180.9090.9330.9060.9470.9550.959
Cf10.9080.9230.9270.9290.9260.9210.9190.9200.9100.9190.9130.960
Cf20.9130.9300.9290.9290.9270.9180.9310.9340.9120.9250.9200.9410.975
Cf30.9130.9300.9330.9340.9320.9250.9330.9260.9190.9260.9200.9530.9480.966
Cf40.9140.9300.9320.9330.9310.9240.9350.9290.9220.9300.9230.9420.9450.9530.956
Cf50.9130.9260.9310.9330.9310.9240.9360.9320.9140.9210.9130.9420.9540.9520.9510.970
Ch10.9230.9340.9320.9340.9360.9290.9300.9320.9110.9130.9050.9280.9460.9390.9350.9420.966
Ch30.9250.9370.9360.9350.9360.9320.9320.9430.9030.9180.9050.9330.9410.9350.9340.9380.9530.963
Ch40.9180.9280.9300.9310.9300.9300.9290.9250.9040.9120.9020.9280.9340.9350.9290.9360.9530.9600.960
Ch50.9150.9250.9280.9280.9270.9280.9310.9270.8970.9070.8970.9340.9420.9360.9330.9410.9530.9540.9520.963
Ch60.9110.9200.9220.9220.9210.9230.9240.9170.9000.9050.8910.9220.9250.9320.9280.9370.9420.9420.9390.9390.954
Ch70.9130.9250.9290.9290.9290.9260.9260.9190.9030.9080.8980.9290.9260.9370.9310.9310.9390.9400.9400.9360.9370.952
TvT1TvT2TvT3TvT4TvT5TvT6Vr1Vr2TvP1TvP2TvP3Cf1Cf2Cf3Cf4Cf5Ch1Ch3Ch4Ch5Ch6Ch7
Table 4. Average Dice’s genetic similarity (GS) matrix calculated within and between radicchio biotypes. Colors range from green (highest values) through yellow (mid values) to red (lowest values).
TvT0.958
Vr0.9310.962
TvP0.9220.9130.953
Cf0.9270.9270.9200.952
Ch0.9280.9260.9050.9340.946
TvTVrTvPCfCh
Publisher’s Note: MDPI stays neutral with regard to jurisdictional claims in published maps and institutional affiliations.

