Article

Advancing Amphibian Conservation through Citizen Science in Urban Municipalities

1
Miistakis Institute, Mount Royal University, Rm U271 Mount Royal University, 4825 Mount Royal Gate SW, Calgary, AB T3E 6K6, Canada
2
Calgary Zoo Foundation, 1300 Zoo Road NE, Calgary, AB T2E 7V6, Canada
3
A/Vian Ecological Consulting Inc., 619 29 Ave NW, Calgary, AB T2M 2M8, Canada
4
Urban Conservation Department, City of Calgary, P.O. Box 2100, Station M, #54, Calgary, AB T2P 2M5, Canada
5
Alberta Conservation Association, 101, 9 Chippewa Road, Sherwood Park, AB T8A 6J7, Canada
*
Author to whom correspondence should be addressed.
Diversity 2021, 13(5), 211; https://doi.org/10.3390/d13050211
Submission received: 12 April 2021 / Revised: 8 May 2021 / Accepted: 11 May 2021 / Published: 15 May 2021

Abstract

:
As cities adopt mandates to protect, maintain and restore urban biodiversity, the need for urban ecology studies grows. Species-specific information on the effects of urbanization is often a limiting factor in designing and implementing effective biodiversity strategies. In suburban and exurban areas, amphibians play an important social-ecological role between people and their environment and contribute to ecosystem health. Amphibians are vulnerable to threats and imbalances in the aquatic and terrestrial environment due to a biphasic lifestyle, making them excellent indicators of local environmental health. We developed a citizen science program to systematically monitor amphibians in a large city in Alberta, Canada, where 90% of pre-settlement wetlands have been removed and human activities continue to degrade, alter, and/or fragment remaining amphibian habitats. We demonstrate successes and challenges of using publicly collected data in biodiversity monitoring. Through amphibian monitoring, we show how a citizen science program improved ecological knowledge, engaged the public in urban biodiversity monitoring and improved urban design and planning for biodiversity. We outline lessons learned to inform citizen science program design, including the importance of early engagement of decision makers, quality control assessment, assessing tensions in program design for data and public engagement goals, and incorporating conservation messaging into programming.

Graphical Abstract

1. Introduction

Green spaces in urban areas provide shelter for many species of plants and animals supporting urban biodiversity. Large urban municipalities increasingly aim to conserve this urban biodiversity [1], recognizing that biodiversity conservation is essential for the maintenance of ecosystem processes that underpin resilience and sustainability [2]. Appreciating that 68% of the world’s population is estimated to be housed within urban settings by 2050 [3], cities around the globe have committed to local Plans of Action to reduce impacts to biodiversity caused by cities and city-building [4]. However, the pressures from urbanization on biodiversity represent a wicked conservation problem as there are multiple drivers of biodiversity loss, decision-making complicated by competing land use objectives, and an extremely complex policy environment [5,6]. Cities struggle to meet targets detailed in municipal biodiversity action plans as the value of urban biodiversity is difficult to quantify and communicate to decision makers [7]. To inform municipal policies that protect, maintain, and restore biodiversity, there is a need for urban ecology studies on species-specific responses to urbanization and broader public engagement in urban biodiversity conservation issues [8,9,10].
Urban areas present specific challenges to amphibian survival. Challenges include habitat loss from removal of wetlands and upland terrestrial habitat, fragmentation of habitat and dispersal routes by road networks and the built environment, habitat degradation from urban pollutants and introduced predatory fish species, and altered breeding, feeding, and movement behaviours in the presence of light and/or sound pollution [11,12,13,14,15,16]. Despite these challenges, amphibian species are reported in urban areas globally, although many are declining [12,17,18,19,20]. Relative to other organisms, amphibians often have a heightened sensitivity to certain conditions in their environment because of their biology and ecology [21]. In a local context, amphibian species sensitive to anthropogenic changes to their environment may serve well as early indicators of environmental degradation that may eventually affect other species [22,23,24]. Understanding amphibian population status and responses to urban threats can improve the conservation and management of urban biodiversity [25,26,27].
In addition to gathering accurate and defensible data to inform urban biodiversity conservation, there is a benefit to engaging the public. Cities face pressures from competing land uses and have limited resources to fulfill their biodiversity mandates [28]. In the past few decades, citizen science has proliferated as an approach to accomplishing both science and public engagement goals [29,30,31]. Specifically, citizen science has been used as a tool for amphibian research in locations worldwide, using both opportunistic and systematic participant effort [32,33,34].
Citizen science provides a platform for the public to participate in biodiversity monitoring, a form of civic participation [35]. Benefits of public participation in citizen science for the individual include improved eco-literacy, behavioural change, increased concern/commitment, and improved social cohesion and trust [36]. These benefits have been documented to lead to participation in civic actions such as improved attendance at public hearings [35,37].
Despite many documented benefits, citizen science is not without challenges. The ability to collect data of a quality that meets the intended use of the data is an important consideration in program design [38]. Regardless, research has shown that citizen science studies have collected high quality data comparable to traditional scientific studies and are a useful tool for conservation [39].
We provide a case study that demonstrates the use of citizen science to improve knowledge of urban amphibian ecology, to engage citizens in an urban biodiversity project, and to inform city planning for amphibian conservation and broader urban biodiversity. Systematic amphibian surveys with simple methodology at urban wetlands offer an interesting and approachable way to include citizens in biodiversity monitoring and increase knowledge on amphibian ecology. We highlight lessons learned for program design related to urban biodiversity citizen science programs. We demonstrate the use of quality control measures including validation from autonomous recording units (ARU) to ensure high quality defensible data were gathered. The resulting data gathered filled an amphibian species distribution and habitat associations data gap. We highlight results from a participant survey on who participated, if participants were sharing information on the program with family and friends, and the type of information that was shared. We used survey results to improve program design, where we targeted specific communities and developed conservation messaging. We demonstrate that engaging decision makers (municipal staff) early on was key to the development of program objectives and design. The case study demonstrates that buy-in from decision makers is essential to implementing conservation actions, as results can be integrated into existing planning processes and policies.

2. Methods

2.1. Study Area

This study took place in Calgary, Alberta, Canada, a heavily urbanized and sprawling city built around the confluence of two major river systems (Bow River and Elbow River). With a population of over 1.2 million people covering an area of 824.5 km2, Calgary continues to expand its development footprint. Calgary has experienced a 90% loss of wetlands since European settlement began in the 18th century [40]. Of the remaining 2729 wetlands within city limits identified in a 2015 wetland inventory, the majority have been constructed or modified as part of the stormwater management infrastructure and are not managed to support biodiversity. Six amphibian species have been historically observed within the current Calgary city boundary [41]: boreal chorus frog (Pseudacris maculata), wood frog (Lithobates sylvaticus), tiger salamander (Ambystoma mavortium), northern leopard frog (Lithobates pipiens), Canadian toad (Anaxyrus hemiophrys), and western toad (Anaxyrus boreas). We set out to determine which of these six amphibian species persisted in Calgary and to engage the public in biodiversity conservation.

2.2. Monitoring Amphibians

Fifty-two wetland sites were chosen from 200 randomly selected wetlands based on municipal and provincial ownership (Figure 1). We obtained permits and conducted field visits to ensure the sites were publicly accessible. One wetland site was lost to development during the first year of monitoring. Wetland sites included constructed stormwater ponds, modified and natural wetlands. Permanent wetlands were favoured for ease of participants locating the site and because permanent wetlands dominate the urban landscapes where wetlands play a role in stormwater management [42].
To determine amphibian presence, wetland sites were surveyed during the amphibian active season (April to August) for three years (2017 to 2019) [43]. To ensure systematic survey effort throughout each season, citizen scientists were coordinated to survey each wetland site during one of nine survey time periods that included daytime visual surveys to sample for amphibian eggs, larvae, juveniles, and adults; and after-dusk auditory surveys to sample for calling anurans (frogs and toads). Tiger salamander do not make auditory calls and were documented using visual observations of eggs, larvae, or adults. All observations (visual and auditory) were analyzed as general amphibian presence. Since some of the survey time periods over-lapped (daytime and after-dusk surveys) we aggregated data into presence for five time periods during the amphibian season.
Simple survey methods were developed in consultation with an expert advisory committee and were based on the provincial Sensitive Species Inventory Guidelines [43]. The advisory committee included amphibian experts, city representatives, technology specialists, and communication experts. Survey methodology and an amphibian identification guide, with images and recordings of relevant species, were made available to the public via a smartphone application and website. Optional field orientations were offered annually to train new citizen scientists. In addition, citizen scientists were encouraged to submit opportunistic observations from any wetland in Calgary. Citizen scientists were not assigned to survey a specific wetland each season and could sign up for surveys at multiple wetland sites. For each survey period, we enabled two independent sign-ups. A summer intern was hired to survey wetlands with low citizen sign-ups. Citizen scientists submitted amphibian observations (including species, type of observation, health of amphibian, and uploaded a photo or voice recording) and null observations on a smartphone application designed for the program [44].

2.3. Quality Control

A key component to any monitoring program is to ensure quality control [31,38]. We designed a review component of our program to: provide confidence that the data collected by the citizen scientists were accurate, and to test occupancy modeling assumption for false positives [45]. There are two forms of observation error of concern: (1) false positives where observers report species that are not there; and, (2) false negatives where observers fail to report a species that is present [38]. The quality control test compared presence–absence data collected by review of long-term audio recordings from autonomous recording units (ARUs) to field observations from citizen scientists for vocal species (i.e., wood frog and boreal chorus frog). With appropriate survey design, ARUs provide similar survey capabilities to field point-count-type surveys [46]. They are recommended as an alternative to on-site acoustic surveys for amphibians [43,47] and have been previously used to provide amphibian population data for habitat modelling in Alberta [48].
Autonomous Recording Units (ARUs) (4 models of Wildlife Acoustics Song Meter SM4 (Wildlife Acoustics, Inc.), 2 models of Wildlife Acoustics Song Meter SM2+ (Wildlife Acoustics, Inc.) and 2 models of Cornell Lab of Ornithology Sound Cache Model AF1 (Wildlife Acoustics Song Meter SM1, Wildlife Acoustics, Inc.)) were set up at eight randomly selected wetlands for both 2017 and 2018 during the breeding period (mid-April to end of June), one site was repeated between the two years. Recordings, 10 minutes on the hour, were classified by student bioacousticians. In addition, a cluster analysis was run by a professional bioacoustician to ensure accuracy of the students’ amphibian classifications for peak calling periods of 10:00 p.m. to 1:00 a.m. [49]. The resulting data from the cluster analysis were combined with the student bioacoustician’s data to create a more comprehensive acoustic data set for comparison with the data collected by the citizen scientists (calling and visual observations).
A confusion matrix was then used to compare species detected per site by ARUs (“actual”) to species data collected by citizen scientists (“predicted”) for each of the five time periods. The accuracy measurements calculator used was from Clustering and Classification Methods for Biologists: Classification Accuracy [50]. The Correct Classification Rate (CCR) was used to understand the performance of the citizen science data, assuming ARU data as truth. Correct Classification Rate measures rate of accuracy where citizen scientists reported the same as the acoustic data set; it represents a ratio of correctly predicted observation to the total observations.

2.4. Occupancy Modeling

To compare the probability of detection between citizen science observers and ARUs for wood frog and boreal chorus frog we used single-season occupancy models (PRESENCE 2.13.10) on 15 of the wetland sites; only the first year of data was used for the one site that had surveys completed in both years [45]. From the nine periods surveyed, we combined data monthly (April, May, June, July, and August), resulting in five time periods. We merged amphibian survey results for sites within 500 m, unless a major road or dense residential development intersected the buffer because 500 m is within the dispersal distance for these species [51,52], resulting in 42 sites used in occupancy modeling. There were too few observations of tiger salamanders to examine occupancy patterns, so we excluded them from further analyses. To reduce bias of occupancy estimates, we included two habitat associations: distance to forest, as a covariate on occupancy (ψ) for wood frogs, and proportion of manicured land in a 20-m buffer for boreal chorus frogs, because previous analyses had indicated that these were important for predicting detection and occupancy within the city of Calgary. We transformed proportion of manicured land using a logit transformation and standardized distance to forest [53]. Amphibian habitat associations and further analysis will be published in a separate publication [54].
We used method of observation as a covariate on probability of detection (ARU or citizen science) to explore difference in detection probability. We calculated the cumulative probability of detection [45] of the two survey methods using the following equation, which allowed us to compare the relative survey effort required to obtain a given probability of detection:
P* = 1 − (1 − p)K,
  • P* is the cumulative probability of detection on a site over all K surveys,
  • p is the single survey probability of detection from occupancy models,
  • K is the number of surveys.

2.5. Participant Engagement

We aimed to engage the public in amphibian conservation through participation in a citizen science program. Engagement success was measured using standard quantitative measures such as the number of participants downloading the smartphone application, collecting data, and participating in program events [55]. Ultimately, we aimed to enhance participant knowledge of amphibians and conservation issues in the urban environment. Additionally, a desired outcome was to build support for civic participation in biodiversity conservation. We were not able to measure this additional engagement goal, as we did not survey participants before and after the program. In addition, conservation outcomes occur on temporal scales longer than citizen science programs making them difficult to measure.
Participants were primarily recruited through partner networks (conservation-focused organizations) and universities; however, new immigrant organizations and community associations were also contacted. We hosted a number of events to enable dialogue between participants and program advisors and regularly shared resource materials and updates throughout the project.
In 2018, a participant survey was sent to 245 registered participants to determine what motivated people to participate, if participants shared information about the program with friends and family, and what types of information participants shared. The results were used to improve program delivery, specifically, to inform communication of key messages [56]. The survey contained multiple choice as well as open-ended questions. Open-ended questions were coded through discussion and agreement by two individuals to identify common themes.

3. Results

3.1. Amphibian Ecology

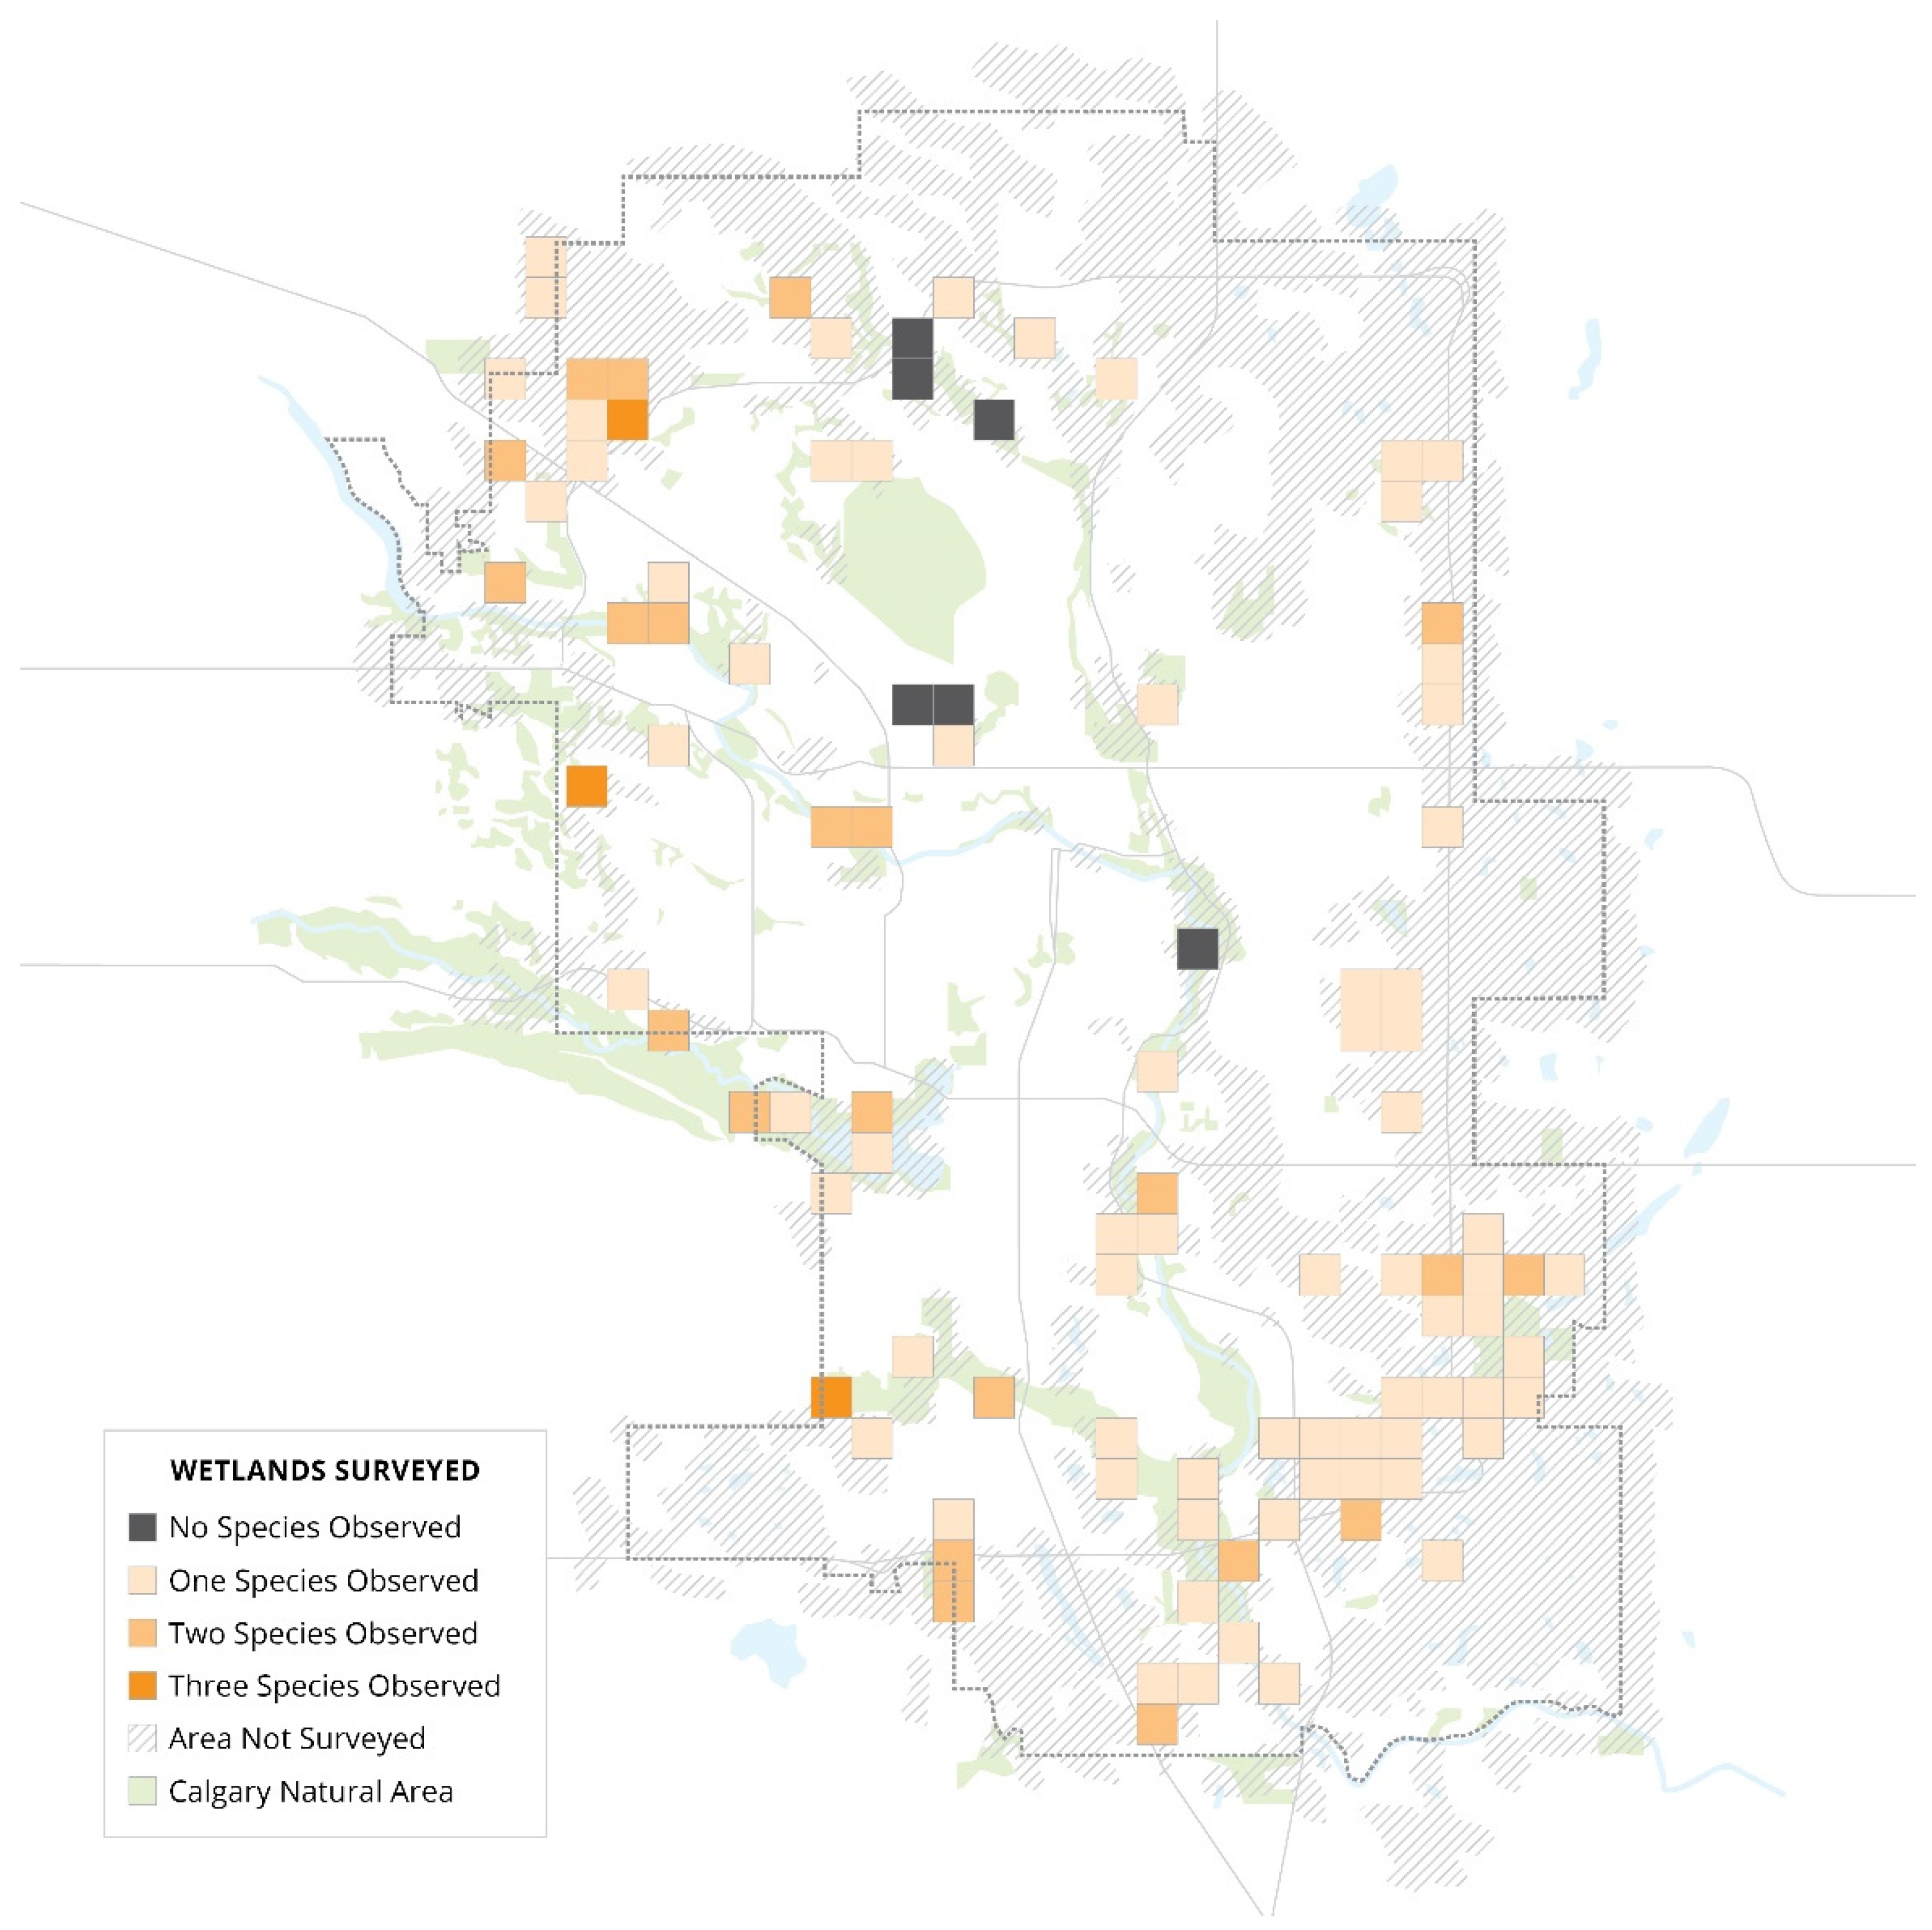
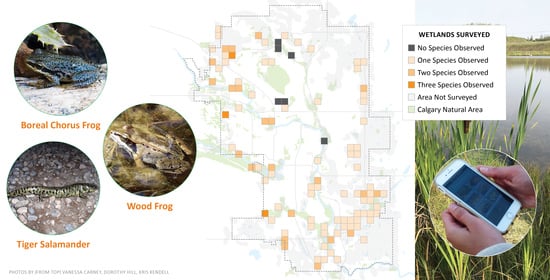
We documented three species of amphibians in Calgary: boreal chorus frog, wood frog, and tiger salamander. Of the six species historically recorded in Calgary, northern leopard frog, Canadian toad, and western toad were not observed. Boreal chorus frog was observed at 85% of the survey sites, wood frog observed at 36% of the survey sites, and tiger salamander observed at 21% of the survey sites. Many survey sites recorded observations of one to two species (Figure 2), but just three sites exhibited co-occurrence of all three species during the study. Six surveyed wetlands were not occupied by any amphibian species. Although we generalized data to amphibian presence, 12 sites reported observations of eggs and tadpoles or larvae, providing evidence of breeding occurring in the urban environment, representing 29% of the urban wetland sites surveyed.
The resulting amphibian data set enabled occupancy modeling to identify important habitat associations for boreal chorus frog and wood frog and to build habitat and connectivity models for the city of Calgary [54]. Results from occupancy models revealed that wood frog occupancy was greater when forests were near (−2 × log likelihood = 100.47, K = 4) and boreal chorus frog occupancy increased with proportion of manicured land within the 20 m buffer (−2 × log likelihood = 116.14, K = 4) ([54]).

3.2. Quality Control and Assurance

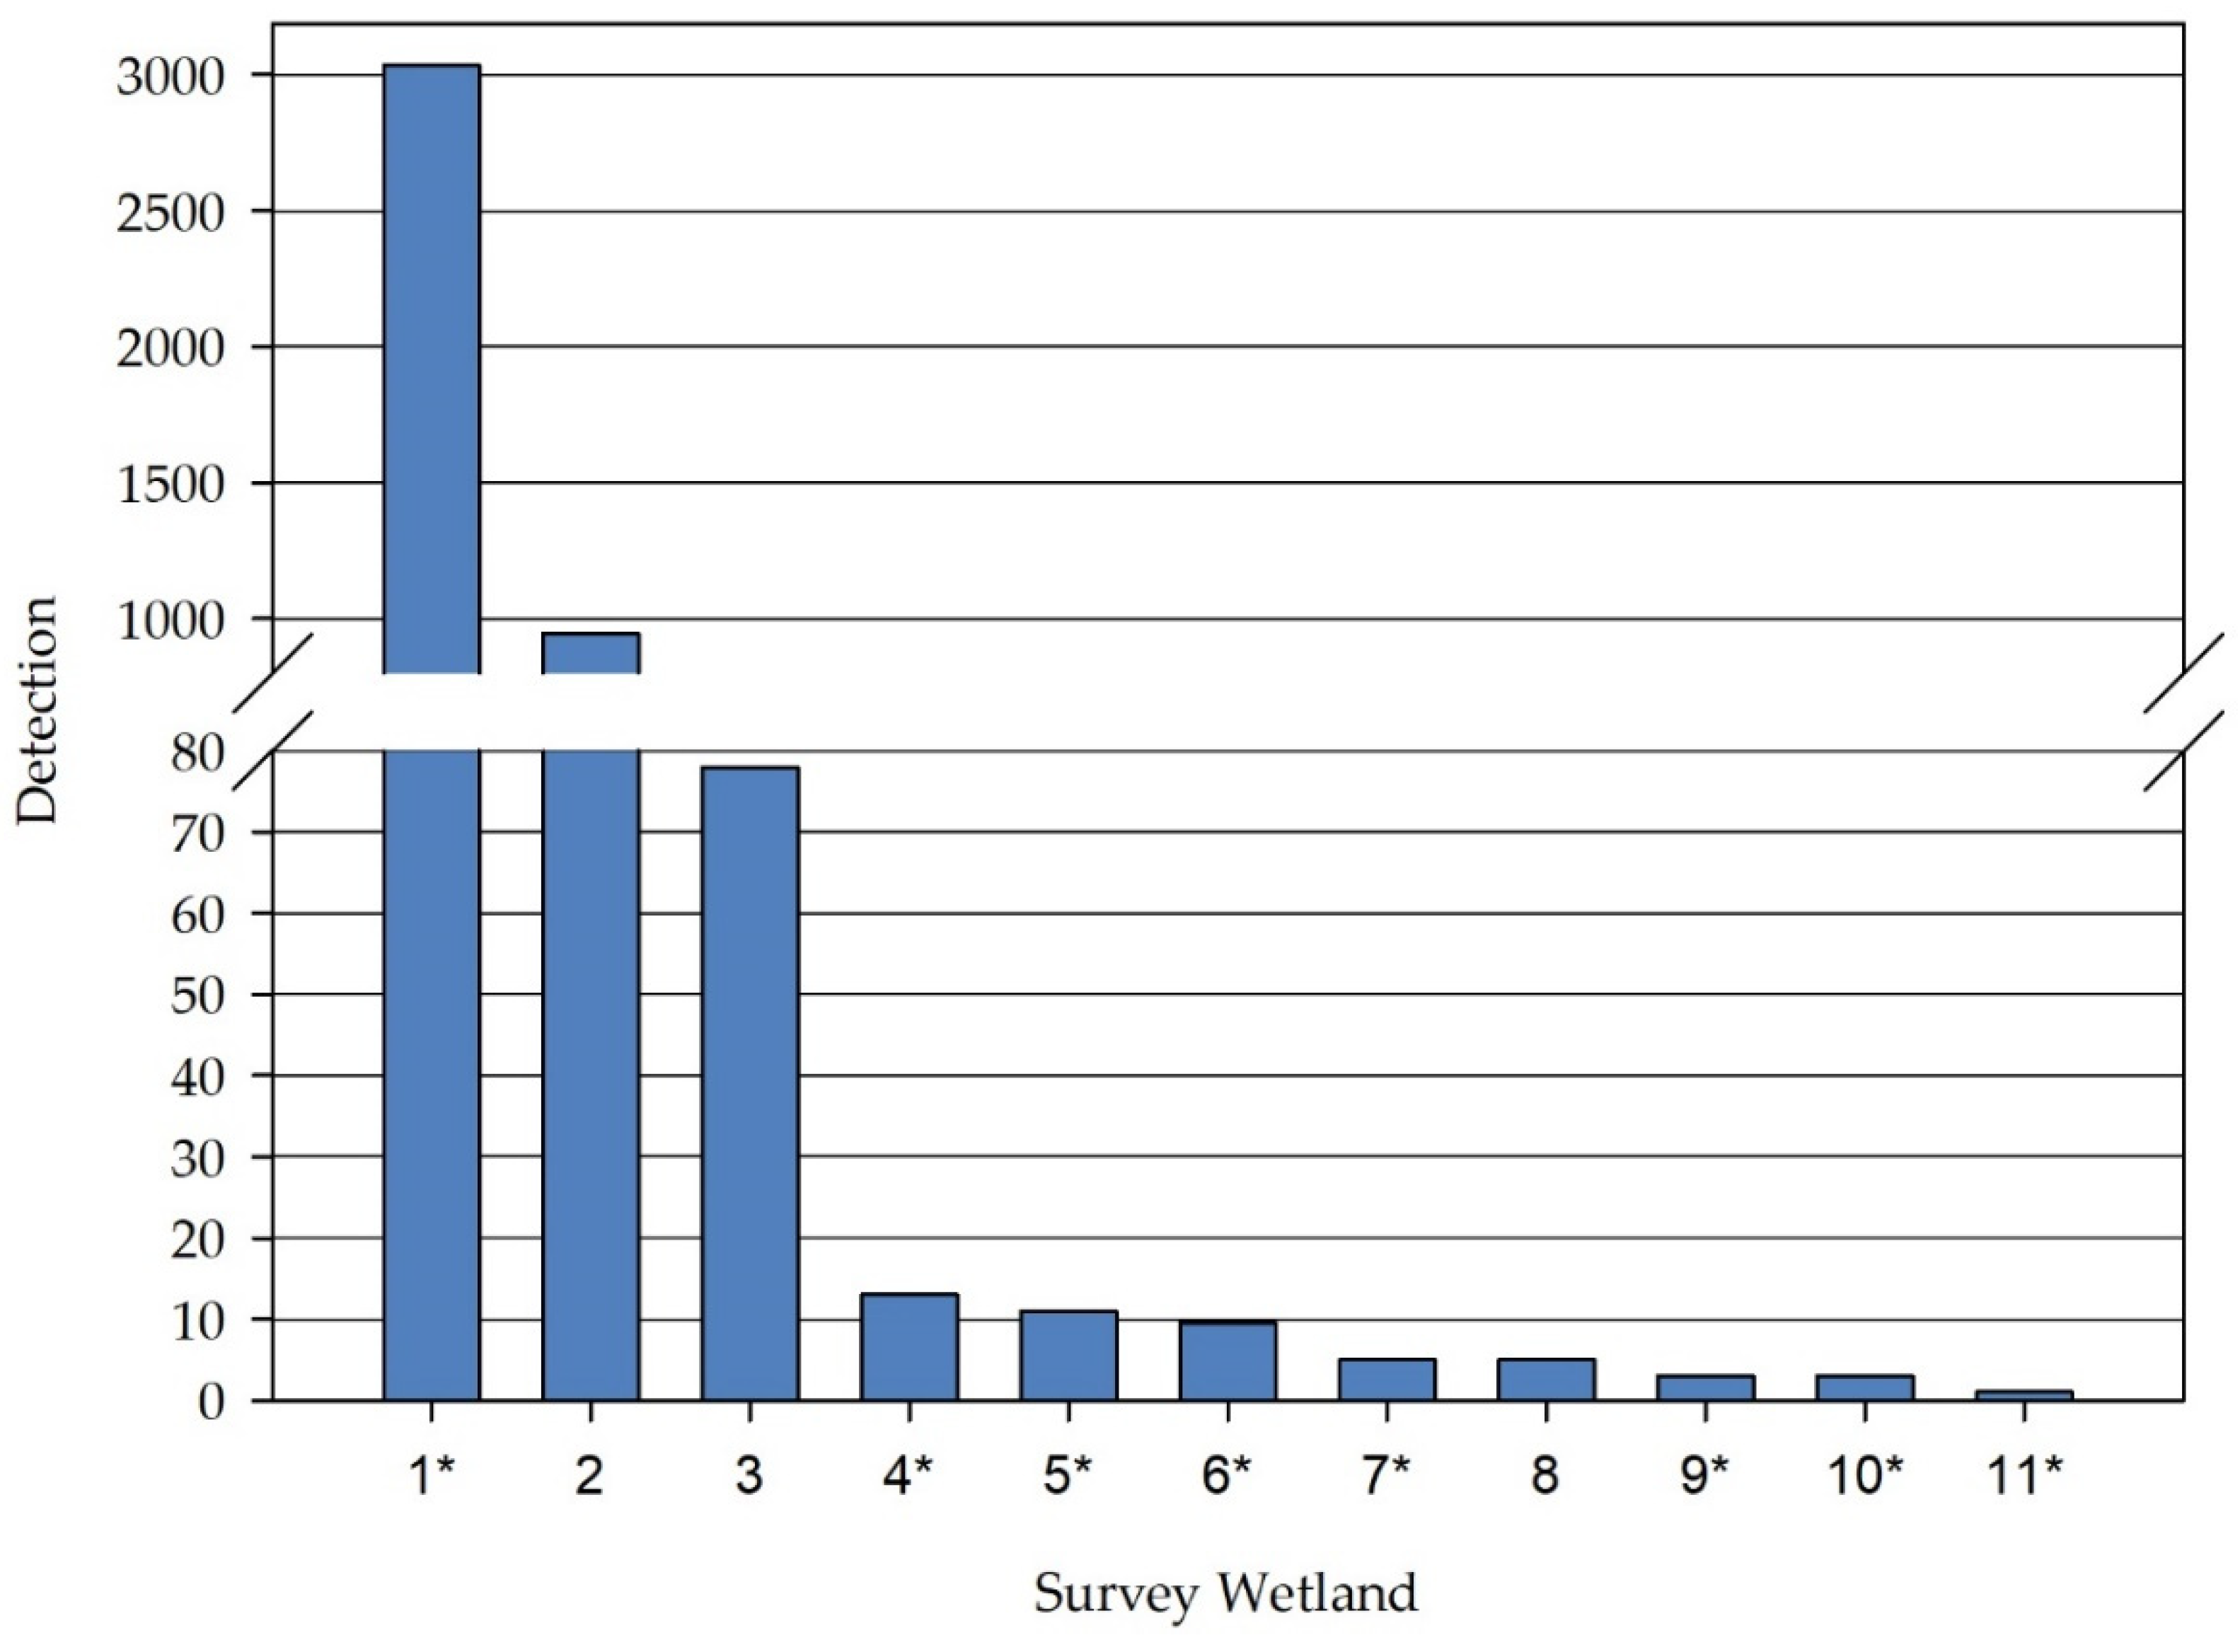
Results comparing ARU observations to citizen scientist observations indicated a Correct Classification Rate for boreal chorus frog of 82% and for wood frog of 44%, due to false negatives (citizen scientists missed wood frogs) (Table 1). There were no false positives for either species, an important finding for occupancy modeling that assumes there are no false positives. Wood frog detections occurred at 12 of the 16 ARU wetland sites. Citizen scientists failed to report wood frog at nine of the sites, of which six recorded low detection rates (<15 auditory calls) and one had a high detection rate (>3000 auditory calls) (Figure 3).
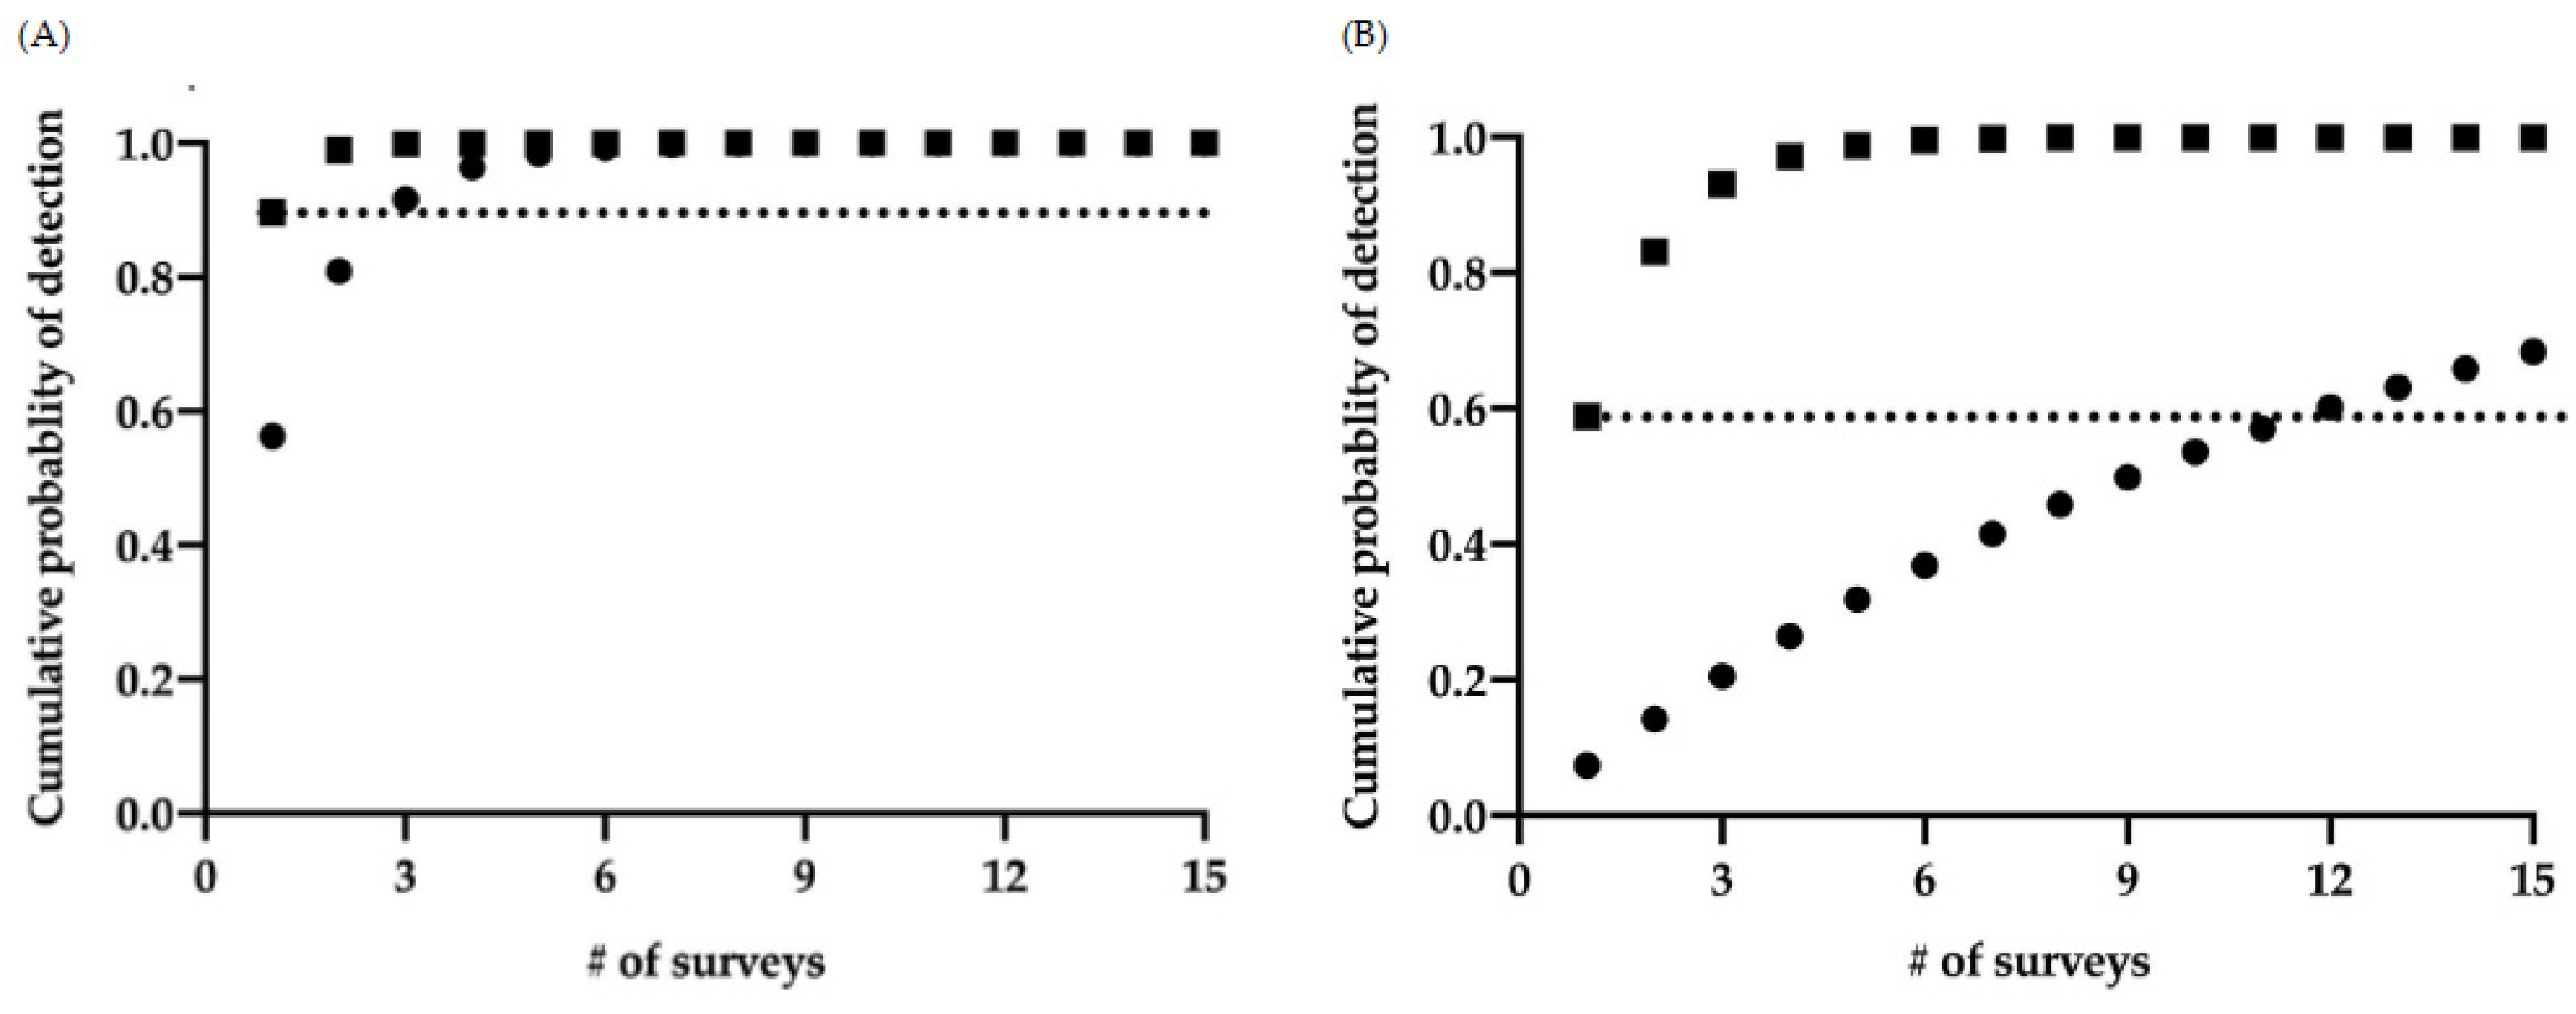
We compared probability of detection for both species between ARUs and citizen scientists. The single survey probability of detection (p) for boreal chorus frogs using citizen scientists was 0.56 ± 0.07 SE and 0.90 ± 0.04 SE for ARUs, whereas (p) for wood frogs using citizen scientists was 0.07 ± 0.04 SE and 0.59 ± 0.08 SE for ARUs. Models that included survey type were >12 ΔAICc above models without survey type. Citizen scientists would need to do three surveys to match the probability of detection of the ARUs for boreal chorus frogs (Figure 4A) and approximately 12 surveys to match the probability of detection for ARUs for wood frogs (Figure 4B).

3.3. Participant Engagement Survey

We engaged 546 individuals in the program, measured by downloads of the smartphone app over the duration of the project. On average, 51 citizen scientists (48 in 2017, 59 in 2018, and 47 in 2019) completed surveys or contributed an amphibian observation each year via the smartphone application. We estimate at least 100 people contributed to data collection each year as citizen scientists were required to go out in pairs. Participants submitted 1116 amphibian and null observations across three years. Wetland sites were surveyed an average of 6.4 times annually, short of the survey design methodology of nine surveys per wetland site annually.
Forty citizen scientists responded to our survey (to achieve a 95% with margin of error of 5% we needed 150 survey responses) and therefore did not statistically represent our participant population. Although survey results were not indicative of all citizen scientists contributing to the program, we gained insights.
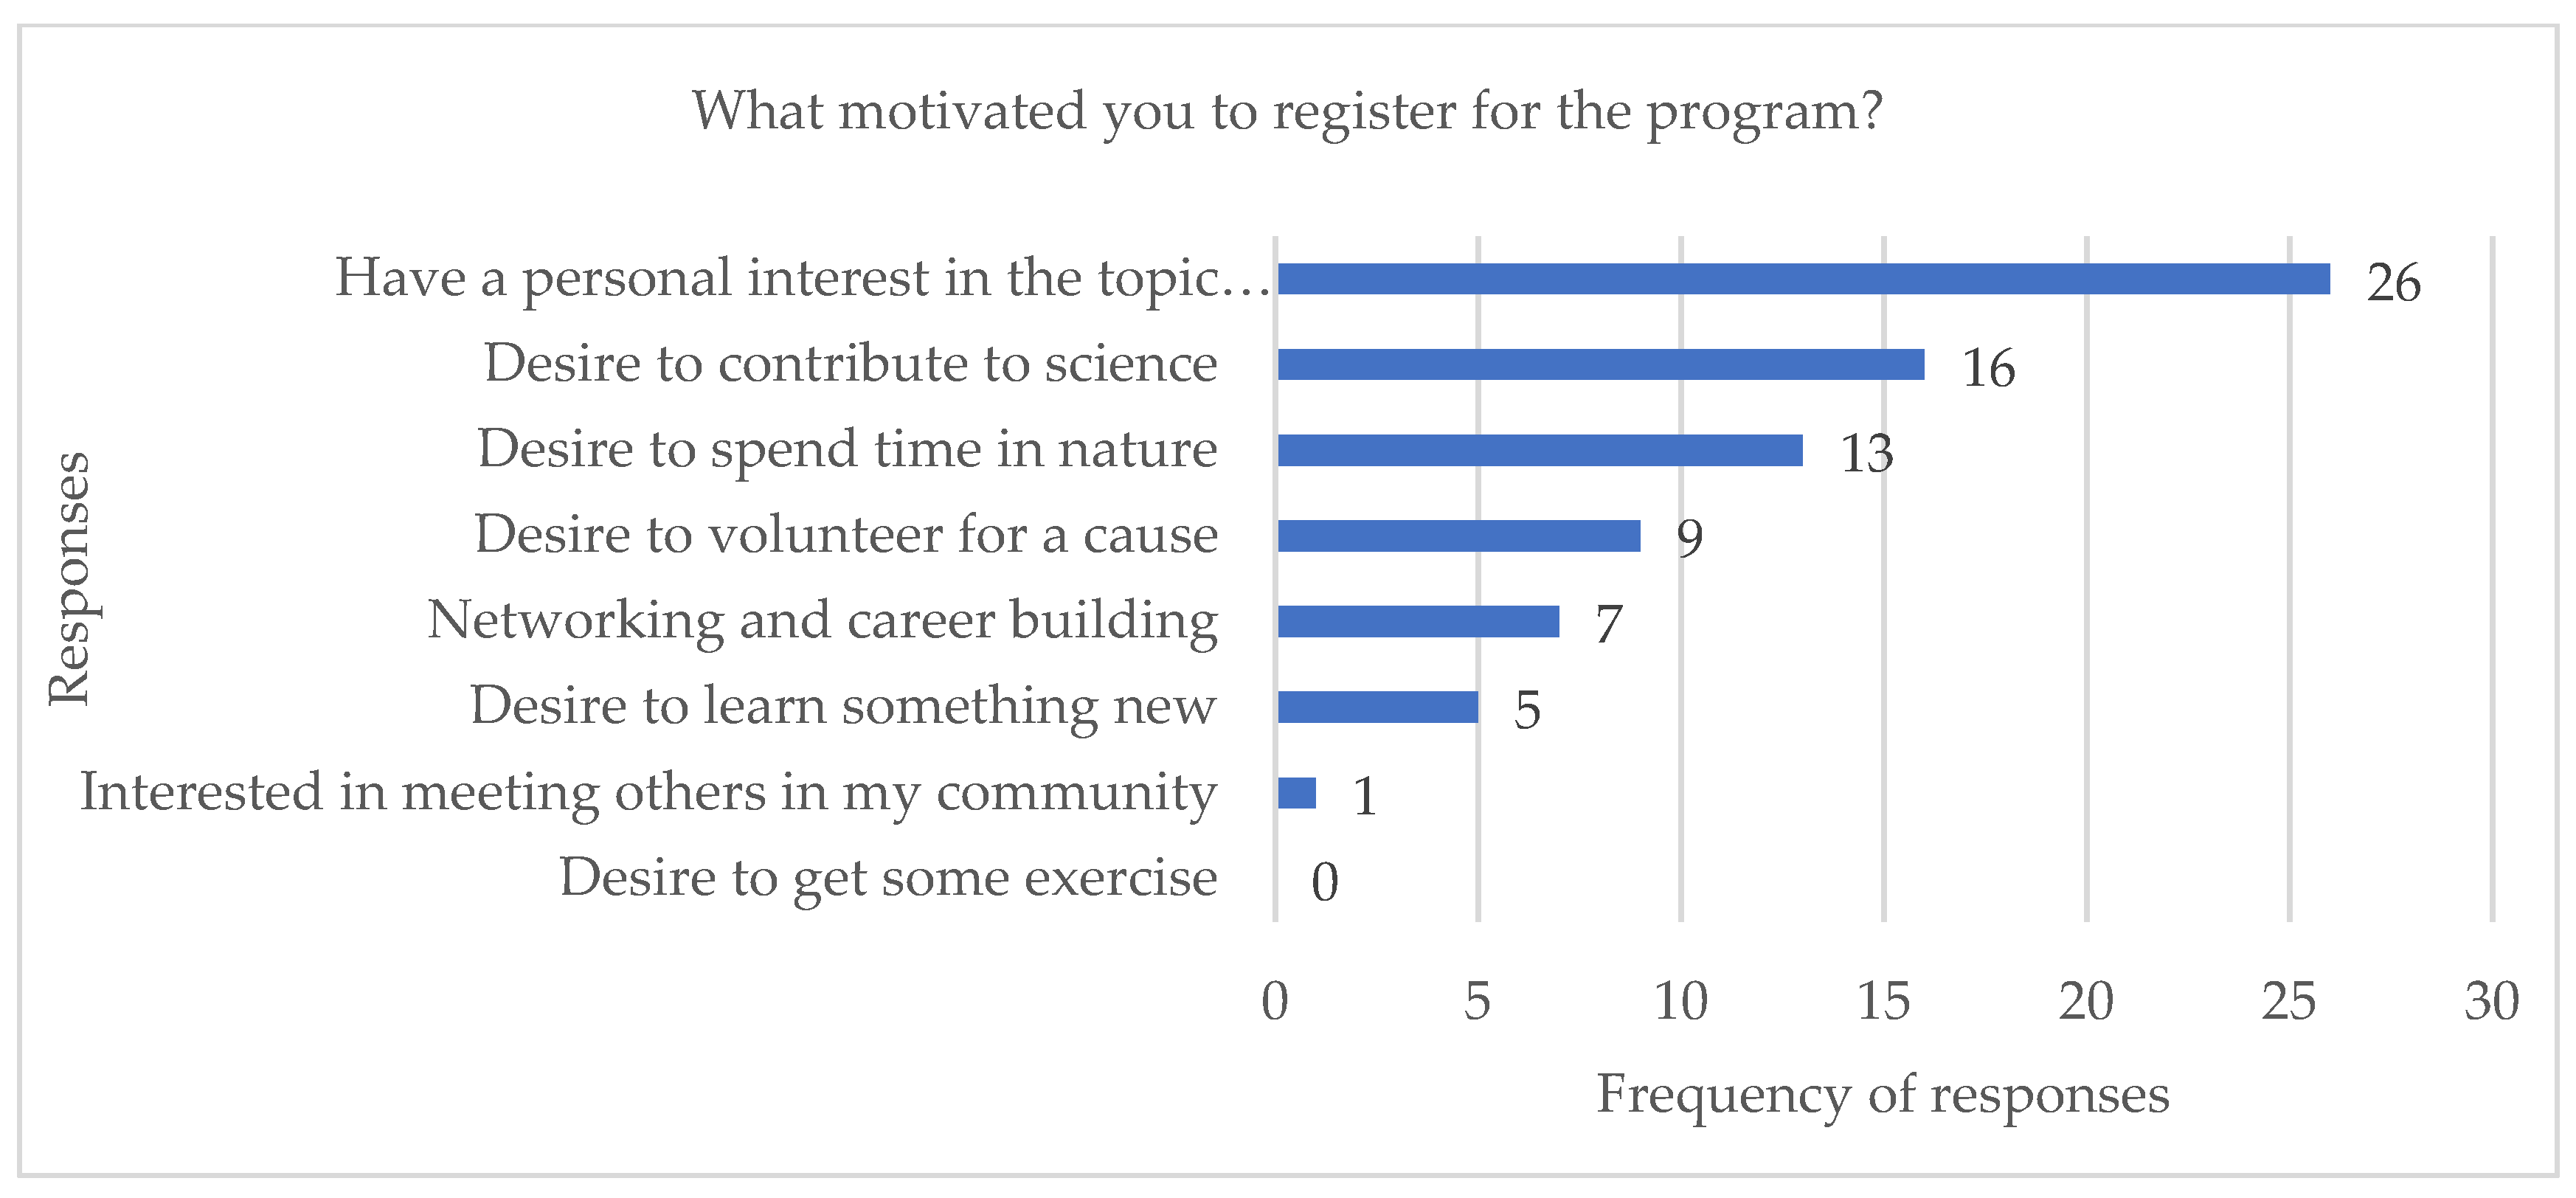
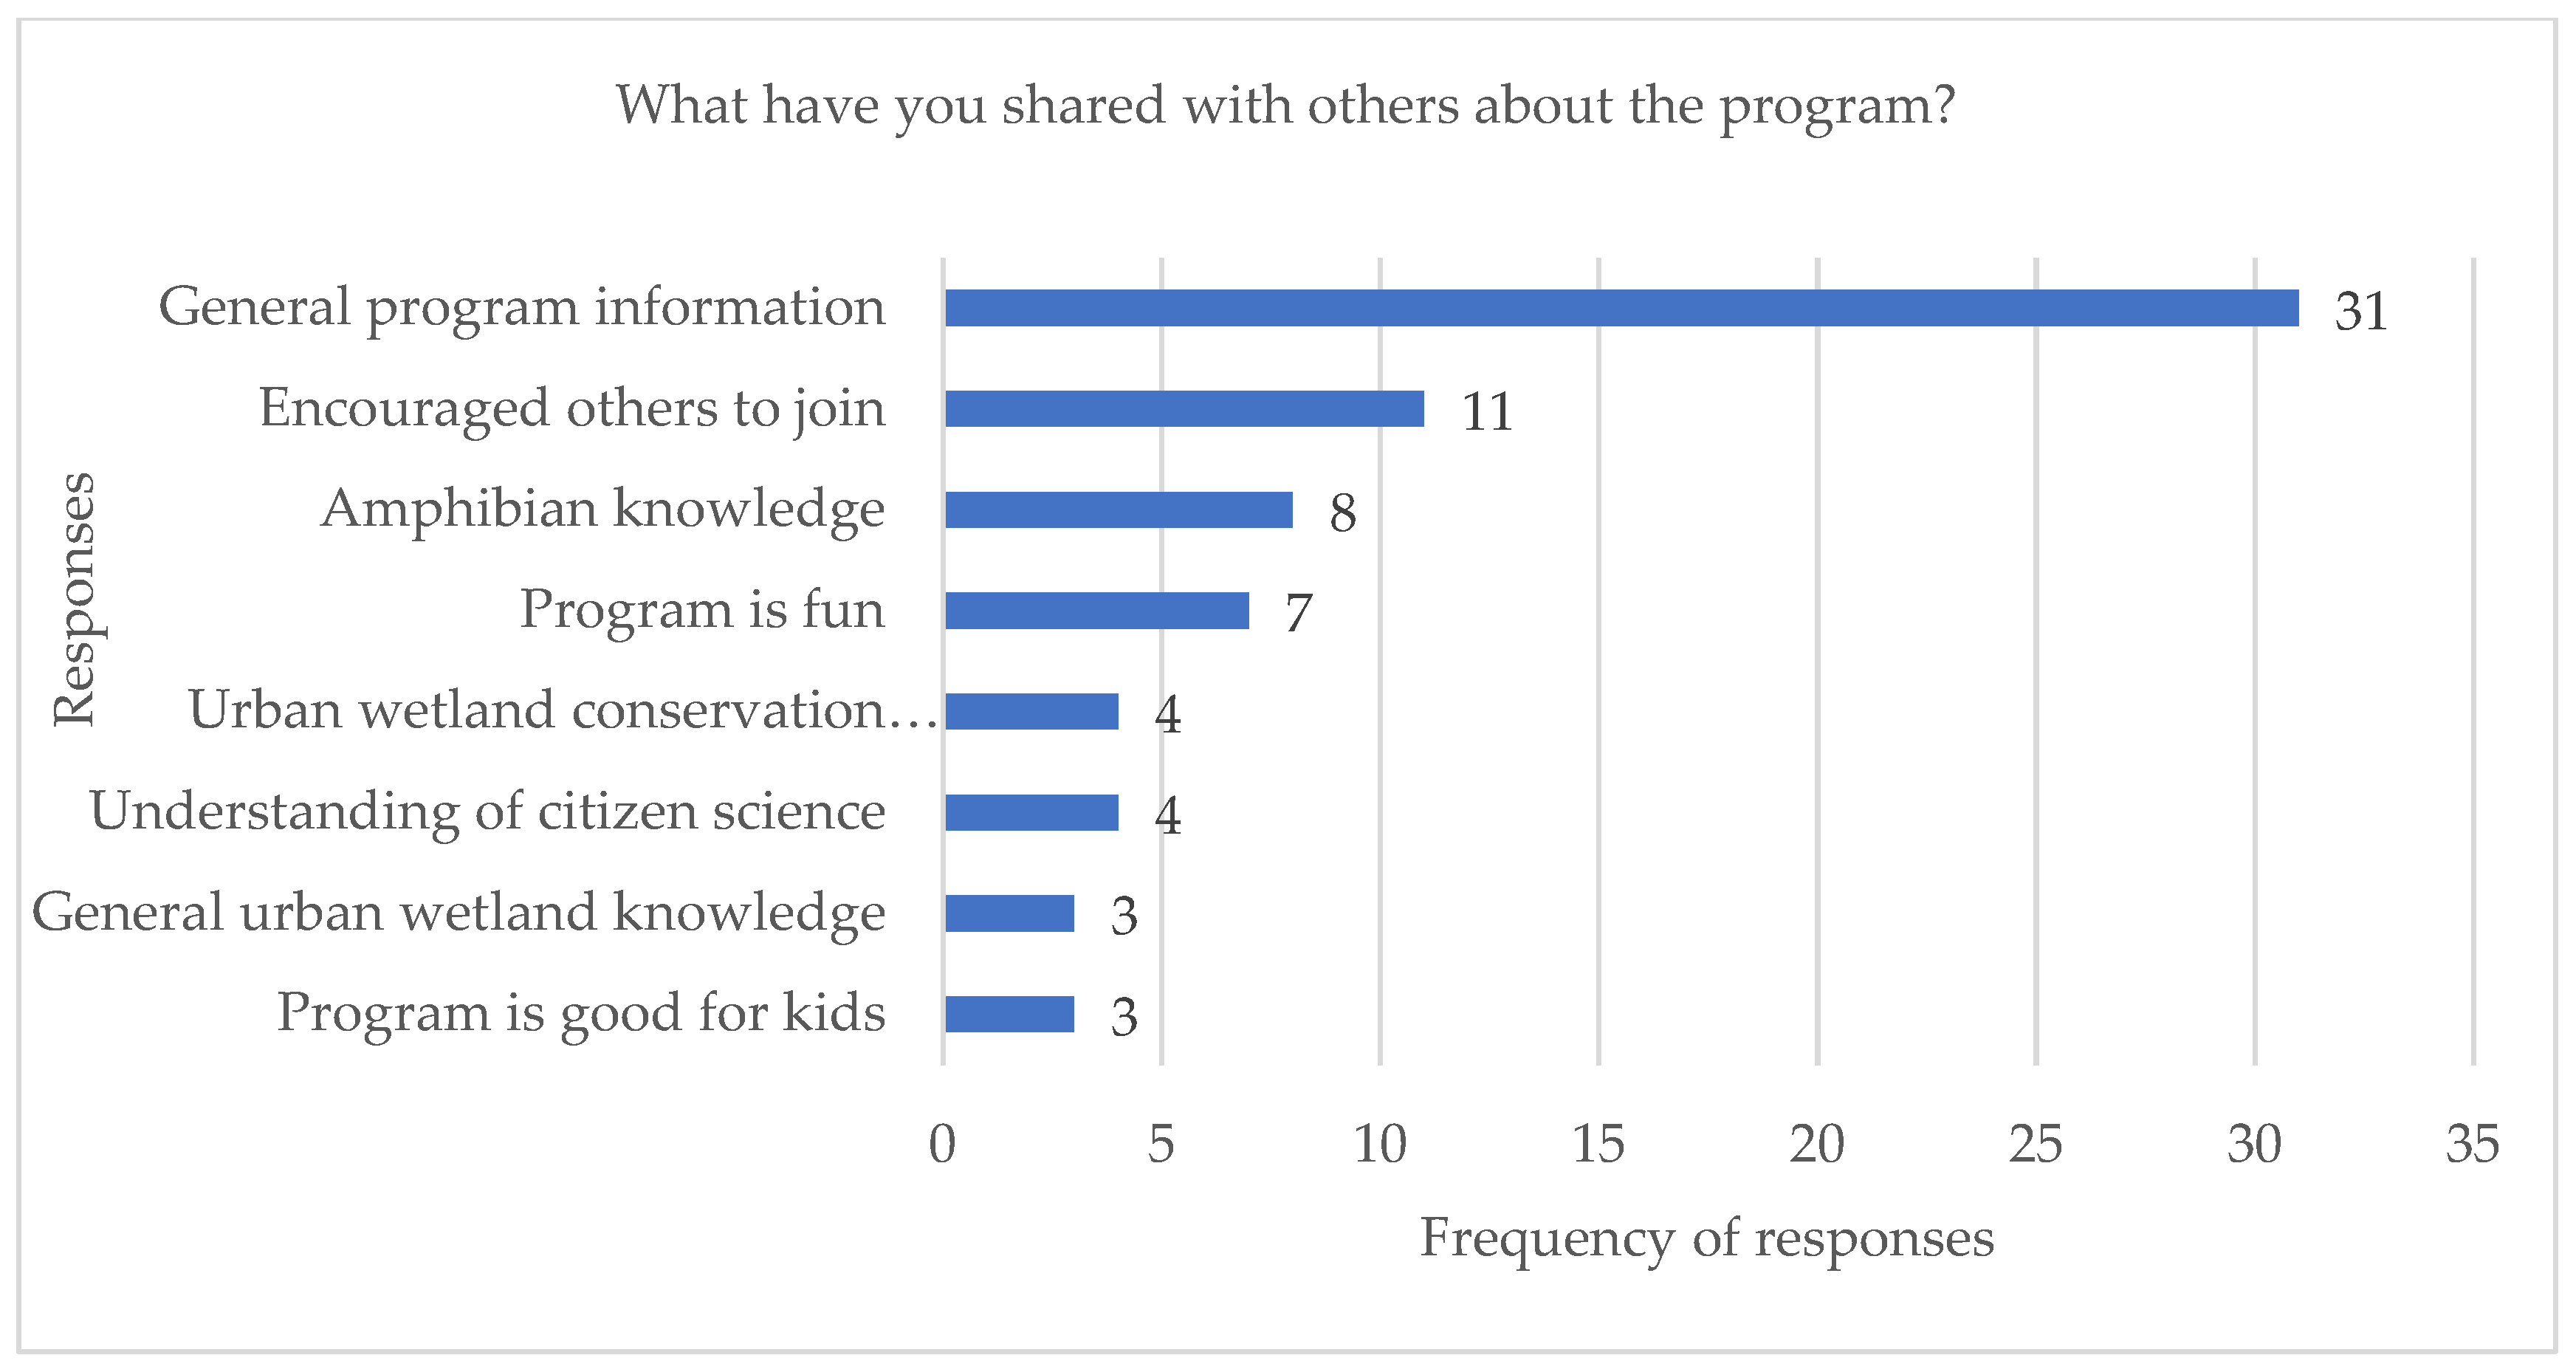
Survey responses indicated the program attracted individuals who were already interested in environmental issues (65%) and gave them a means to act on their interest or concern (Figure 5). In addition, 95% of respondents confirmed they had spoken to others (friends, family, neighbours, colleagues) generally about the program and recruited others to contribute. However, it was less common for a participant to share specific knowledge on urban wetlands, amphibian conservation, and/or municipal planning issues (Figure 6).

4. Discussion

Urbanization results in a unique set of impacts to biodiversity due to intensive alteration of physical and biological structures [8,57]. To develop effective biodiversity conservation strategies in urban areas, knowledge of how species respond to urbanization is necessary [58]. For conservation to be successful in urban areas, public input and engagement in conservation are also needed as competing land use and pressures to remove natural habitat escalate while urban biodiversity losses continue to exceed conservation or compensation action [59]. We identified citizen science as an important tool in tackling a key component to the wicked problem of urban biodiversity conservation, by engaging the public in civic participation relating to biodiversity and generating an accurate amphibian data set to inform city planning and policy [60,61]. Our citizen science program, developed to monitor amphibians in a city of over 1 million people, demonstrated the value of engaging the public in data collection to improve ecological knowledge of urban biodiversity.

4.1. Enhanced Amphibian Ecological Knowledge

Although urban ecology studies are on the increase, there are many knowledge gaps related to how biodiversity responds to urbanization [62]. Our program enhanced knowledge of amphibians in an urban environment by documenting amphibian species diversity and indicating evidence of amphibian breeding activity and their specific habitat associations [54]. Prior to this study, knowledge of amphibian species diversity within the city was limited. Our study also highlighted which species are absent from the city, which could have important implications for conservation strategies such as reintroductions or translocations [63].
Similar to other urban studies, our results highlighted the ecological needs of amphibian species in the urban landscape [11]. These findings represent important considerations for wetland restoration and best management practices to improve amphibian abundance. For example, wood frogs were strongly associated with forest landcover, which was consistent with other urban studies [64,65,66]. Wood frog distribution was driven by the presence of forests, and therefore preserving forests near wetlands is an important strategy for maintaining wood frog populations. A recent study in the U.S. highlighted urban forest declines at a rate of 1% every five years, being replaced by impervious surfaces [67]. Indeed, other studies have documented that species dependent on forests tend to decline over time in urban areas as urban forests decline [58].
As the city of Calgary continues to expand and converts remaining natural landscapes into residential and commercial areas, the results of this study, including amphibian species diversity and habitat associations, can aid planning processes. Furthermore, the amphibian monitoring data set and occupancy modeling provided the platform for habitat suitability and connectivity modeling at a city scale [54]. These models are being used to help prioritize the urban landscape in terms of protection and restoration is an important tool for city planners.

4.2. Lessons on Citizen Science Program Development

Our study highlighted important lessons for the development of urban citizen science programs, including the need to engage decision makers early in the process, test if data collection methods fit the intended monitoring purpose, carefully consider tensions between public engagement and monitoring protocols, and be explicit in communicating conservation messaging.

4.2.1. Engage Decision Makers Early

We engaged city representatives in the program design phase to ensure the program generated a data set to address amphibian ecology knowledge gaps that would be useful to planning, park management, water management, and biodiversity policy. For example, Calgary has numerous policies where amphibian information could be incorporated, including the citywide municipal development plan [68], biodiversity strategy [69], urban forest strategic plan [70], wetland conservation plan [40], natural area park management plan [71], riparian action program [72], and environmental reserve setback guidelines [73]. Early engagement with city personnel enabled the identification of where amphibian knowledge could be integrated into existing plans or management practices to improve amphibian populations and support biodiversity conservation.

4.2.2. Data Quality Assessment

Most citizen science programs address data quality by comparing citizen scientist data to those of professional scientists. Research indicates this method is flawed as scientists are also prone to data collection errors [74,75]. Instead, we sought to determine if citizen-science-collected data compared to ARU detections at a sub-set of the wetland sites. We assumed ARUs would capture all species present due to ARUs having higher survey effort (10 minutes of every hour) than citizen scientists (average of six surveys per wetland per season). Our data quality assessment focused on determining if citizen scientists reported false negatives and positives, important assumptions for occupancy modeling [45].
In our study, ARUs proved to have a higher probability of detection for both boreal chorus frogs and wood frogs than citizen scientists, but the difference was particularly acute for wood frogs. Our quality control assessment highlighted the importance of determining if the data collection method is appropriate for the intended purpose. Citizen scientists did well with boreal chorus frog classification when compared to ARUs (82% correct classification) but our survey methodology for wood frog classification when compared to ARUs (44%) was poor. The poor result was driven by low duty cycle of auditory calls and possibly due to masking from the louder, more frequent calling of the boreal chorus frog, highlighting the importance of mixed methods in amphibian monitoring [76]. There were no false positives at sites surveyed by citizen scientists, but false negatives were recorded, and therefore citizen science data alone underestimated occupancy for wood frogs in Calgary. These may be wetlands where wood frogs were moving through or are not well established [77]. For a citizen scientist to detect wood frogs at wetland sites with low auditory output they would need to survey the wetland site 12 times, a considerable time commitment for citizen scientists. We postulate that our survey methodology, rather than citizen scientists, was a limitation. However, there was one wetland where ARU detections were high and citizen scientists did not report wood frogs, likely due to insufficient experience and/or the low citizen scientist survey rate of this wetland.

4.2.3. Balancing Data and Engagement Tensions

Our program experienced tensions arising from the need to engage the public while ensuring the data collection methodology met standard protocols [78]. To encourage participation, we allowed citizen scientists to register for any one of the 52 wetland sites during any of the nine time periods. A study design optimized to data needs would have assigned a citizen scientist to a specified wetland and requested a commitment to survey all nine survey time periods. Although our program offered flexibility and encouraged citizen scientists to explore wetlands across Calgary, it resulted in an uneven number of surveys at each wetland with some wetlands receiving limited interest and others receiving more surveys than needed. Wetland sites located in industrial or commercial areas received less survey interest than wetland sites located within residential neighbourhoods. To address this challenge, we hired a summer intern to monitor wetlands with low participation, and we also truncated the survey periods to five time periods for occupancy analysis. We recommend a program design that assigns citizen scientists to specific wetland sites and requests commitment-required surveys to improve sampling effort.
Our program experienced app downloads and participation in engagement events by individuals who did not participate in data collection. While this does not work toward science goals, it contributes to engagement goals by providing opportunities to engage those who may not be interested or do not have access to participate in data collection. We recommend providing a range of meaningful ways to participate in the program to broaden the pool of individuals reached.
We attempted to increase diversity among participants by recruiting new Canadian immigrants through presentations at relevant organizations. Lack of access to natural areas, language barriers, and lack of alignment with priorities may have been reasons for low participation from minority groups.
Frameworks for citizen science programs in which community members are involved at each step require that research questions align with community priorities and that multiple types of knowledge are incorporated into results [79]. To increase citizen participation in underrepresented groups we recommend an increased investment in communication during program development to ensure community values and concerns are integrated into program design and communications.

4.2.4. Conservation Messaging

Our participant survey results indicated that recruitment attracted individuals who were already interested in amphibian conservation or biodiversity. If a program goal is to improve eco-literacy and/or introduce amphibian ecology to citizens, participant recruitment intentionally needs to further consider how to draw the attention of audiences new to amphibian conservation. After the second season of data collection, we made efforts to recruit new immigrants to Canada via targeted presentations to organizations focused on assisting new Canadians in gaining relevant work and cultural experiences. Although this targeted engagement successfully attracted new Canadians, anecdotally, individuals had a background in conservation and recognized the program as a networking opportunity. We recommend program design that considers the specific identification of audiences, targets communication, and invests time in building relationships with each identified audience.
Similar to other citizen science participant surveys, we found that most of our survey respondents shared information about the program with family or friends [36,55]. Our participant survey results indicated that messaging from citizen scientists to other community members focused on participating in the program, sharing general information about amphibians, and recruiting others to the program. We found conservation messaging concerning key impacts on amphibians, including wetland loss, degradation and fragmentation, and actions to protect and restore amphibian habitat in the urban environment, were not commonly shared messages. One of the solutions identified to better address wicked conservation problems was individual ownership of urban biodiversity loss and accountability for actions to reduce loss [10]. We learned that conservation messaging and actions need to be implicitly incorporated into communication materials and individual actions clearly outlined. During the last year of monitoring, conservation messaging was incorporated into all public events and materials, and we outlined civic actions to promote amphibian conservation. For example, we included information on how to navigate the confusing municipal planning, public consultation, and development approvals process where a wetland may be impacted by a new development.
Our program provided citizens living in a large urban center that continues to expand, with meaningful engagement in biodiversity conservation through data collection. We generated a large amphibian monitoring data set that would otherwise not exist, to use in planning, management, and policy in a large urban center. Although citizen science represents a form of civic participation, we could not document individual conservation actions or outcomes stemming from participation in this citizen science project, such as engagement in municipal and provincial planning processes. Instead, we relied on other research that demonstrated these benefits are often realized as a result of participation in citizen science initiatives [80,81]. Anecdotally, however, we found that participants in the amphibian monitoring project increasingly posed thoughtful questions around how Calgary and Alberta governments considered wetlands in urban development decision-making and conservation of urban wetlands. They also expressed interest in identifying opportunities for public input into urban planning. Ultimately, preservation of biodiversity in urban areas requires strong environmental policies, proactive investment in protection and restoration of habitats, and the reimagination of hard infrastructure to minimize habitat fragmentation, all of which require strong public support.

Author Contributions

All listed authors played a significant role in the Call of the Wetland citizen science program. Program conceptualization, T.S.L. and D.D.; methodology, T.S.L., L.A.R., K.K. and V.A.C.; software, K.S.; validation, H.L.K. and T.M.B.; formal analysis, L.A.R., T.S.L., N.L.K., T.M.B. and H.L.K.; data curation, N.L.K.; writing, T.S.L., N.L.K., H.L.K., V.A.C. and L.A.R.; writing—revisions and editing, all authors; citizen science participant coordination, N.L.K. and T.M.B.; project administration, T.S.L.; funding acquisition, T.S.L., N.L.K., V.A.C. and D.D. All authors have read and agreed to the published version of the manuscript.

Funding

The Call of the Wetland Program was funded by Enbridge, Parks Foundation Calgary, The Calgary Foundation, Alberta Innovates, Alberta Ecotrust Foundation, TD Friends of the Environment Foundation, World Wildlife Fund—Canada, Mount Royal University: Institute for Environmental Sustainability, RBC Tech for Nature, and Canada Summer Jobs.

Institutional Review Board Statement

Not applicable.

Informed Consent Statement

Not applicable.

Data Availability Statement

Amphibian data collected through the Call of the Wetland Program is available on request of the corresponding author.

Acknowledgments

We thank the Call of the Wetland citizen scientists for their participation collecting amphibian observations across the city of Calgary. We thank the Call of the Wetland Mount Royal University summer interns: Jen Demone, Coral Sawatzky, Rachel Pizante, Devon Henry, Alexis Handford, Astrid Waite, Rosey Easton and Shelby Hansen. We thank Steve O’Gorman from STAR EcoWorks for his contribution to the solar power setup for several of the ARUs used. Lastly, we thank Connie van der Byl, Dorothy Hill, Melanie Rathburn and Felix Nwaishi from Mount Royal University for their contributions to the program, and for engaging students through class projects or as summer interns in Call of the Wetland Program activities.

Conflicts of Interest

The authors declare no conflict of interest.

References

  1. Zari, M.P. The importance of urban biodiversity—An ecosystem services approach. Biodivers. Int. J. 2018, 2, 357–360. [Google Scholar] [CrossRef]
  2. Oliver, T.O.; Isaac, N.J.B.; August, T.A.; Woodcock, B.A.; Roy, D.B.; Bullock, J.M. Declining resilience of ecosystem functions under biodiversity loss. Nat. Commun. 2015, 6. [Google Scholar] [CrossRef] [Green Version]
  3. UN Department of Economic and Social Affairs (UN DESA). Revision of World Urbanization Prospects. Available online: https://population.un.org/wup/ (accessed on 28 March 2021).
  4. Local Governments for Sustainability (ICLEI). Local Action for Biodiversity: An ICLEI and IUCN Programme; ICLEI: Bonn, Germany, 2017. [Google Scholar]
  5. Mason, T.H.E.; Pollard, C.R.J.; Chimalakonda, D.; Guerrero, A.M.; Kerr-Smith, C.; Milheiras, S.A.G.; Roberts, M.; Ngafack, P.R.; Bunnefeld, N. Wicked conflict: Using wicked problem thinking for holistic management of conservation conflict. Conserv. Lett. 2018, 11, 1–9. [Google Scholar] [CrossRef] [Green Version]
  6. Rittel, H.W.J.; Webber, M.M. Dilemmas in a general theory of planning. Policy Sci. 1973, 4, 155–169. [Google Scholar] [CrossRef]
  7. Suwa, A.; Gasparatos, A.; Doll, C.; Iossifova, D.; Puppim de Oliviera, J.A.; Balaban, O.; Moreno-Penaranda, R. Cities, Biodiversity and Governance. Available online: https://ourworld.unu.edu/en/cities-biodiversity-and-governance (accessed on 29 March 2021).
  8. Pierce, J.R.; Barton, M.A.; Tan, M.M.J.; Oertel, G.; Halder, M.D.; Lopez-Guijosa, P.A.; Nuttall, R. Actions, indicators, and outputs in urban biodiversity plans: A multinational analysis of city practice. PLoS ONE 2020, 15, e0235773. [Google Scholar] [CrossRef]
  9. McDonnell, M.J. Linking and promoting research and practice in the evolving discipline of urban ecology. J. Urban Ecol. 2015, 1, 1–6. [Google Scholar] [CrossRef] [Green Version]
  10. Sharman, M.; Mlambo, M.C. Wicked: The Problems of Biodivesrity Loss. GAIA 2012, 21, 274–277. [Google Scholar] [CrossRef]
  11. Cushman, S.A. Effects of habitat loss and fragmentation on amphibians: A review and prospectus. Biol. Conserv. 2006, 128, 231–240. [Google Scholar] [CrossRef]
  12. Konowalik, A.; Najbar, A.; Konowalik, K.; Dylewski, Ł.; Frydlewicz, M.; Kisiel, P.; Starzecka, A.; Zaleśna, A.; Kolenda, K. Amphibians in an urban environment: A case study from a central European city (Wrocław, Poland). Urban Ecosyst. 2020, 23, 235–243. [Google Scholar] [CrossRef] [Green Version]
  13. Koen, E.L.; Bowman, J.; Sadowski, C.; Walpole, A.A. Landscape connectivity for wildlife: Development and validation of multispecies linkage maps. Methods Ecol. Evol. 2014, 5, 626–633. [Google Scholar] [CrossRef]
  14. Shulse, C.D.; Semlitsch, R.D.; Trauth, K.M.; Williams, A.D. Influences of design and landscape placement parameters on amphibian abundance in constructed wetlands. Wetlands 2010, 30, 915–928. [Google Scholar] [CrossRef]
  15. Dutta, H. Insights into the impacts of three environmental problems on Amphibians. Eur. J. Ecol. 2018, 4, 15–27. [Google Scholar] [CrossRef]
  16. Sordello, R.; Ratel, O.; De Lapachelle, F.F.; Leger, C.; Dambry, A.; Vanpeene, S. Evidence of the impact of noise pollution on biodiversity: A systematic map. Environ. Evid. 2020, 9, 1–27. [Google Scholar] [CrossRef]
  17. Calderon, M.R. Influence of water quality and habitat conditions on amphibian community metrics in rivers affected by urban activity. Urban Ecosyst. 2019, 22, 743–755. [Google Scholar] [CrossRef]
  18. Holtmann, L.; Philipp, K.; Becke, C.; Fartmann, T. Effects of habitat and landscape quality on amphibian assemblages of urban stormwater ponds. Urban Ecosyst. 2017, 20, 1249–1259. [Google Scholar] [CrossRef]
  19. Garcia-Gonzalez, C.; Garcia-Vazquez, E. Urban ponds, neglected Noah’s ark for amphibians. J. Herpetol. 2012, 46, 507–514. [Google Scholar] [CrossRef]
  20. Parris, K.M. Urban amphibian assemblages as metacommunities. J. Anim. Ecol. 2006, 75, 757–764. [Google Scholar] [CrossRef] [PubMed]
  21. Collins, J.P.; Crump, J.P.; Martha, L. Extinction in Our Times: Global Amphibian Decline; Oxford University Press: New York, NY, USA, 2009. [Google Scholar]
  22. Scheffers, B.R.; Paszkowski, C.A. The effects of urbanization on North American amphibian species: Identifying new directions for urban conservation. Urban Ecosyst. 2012, 15, 133–147. [Google Scholar] [CrossRef]
  23. Kestemont, B. The bottom-up assessment of threatened species. Nat. Conserv. Res. 2019, 4, 93–106. [Google Scholar] [CrossRef]
  24. Chifundera, K.Z. Using diversity indices for identifying the priority sites for herpetofauna conservation in the democratic republic of the Congo. Nat. Conserv. Res. 2019, 4, 13–33. [Google Scholar] [CrossRef]
  25. Bridges, C.M.; Semlitsch, R.D. Variation in pesticide tolerance of tadpoles among and within species of Ranidae and patterns of amphibian decline. Conserv. Biol. 2000, 14, 1490–1499. [Google Scholar] [CrossRef]
  26. Sinsch, U. Migration and orientation in anuran amphibians. Ethol. Ecol. Evol. 1990, 2, 65–79. [Google Scholar] [CrossRef]
  27. Hussain, Q.A. Global amphibian declines: A review. Int. J. Biodivers. Conserv. 2012, 4, 348–357. [Google Scholar] [CrossRef]
  28. Kueller, C.; Kaiser-Bunbury, C.N. Reconciling conflicting perspectives for biodiversity conservation in the Anthropocene. Front. Ecol. Environ. 2014, 12, 131–137. [Google Scholar] [CrossRef]
  29. Riesch, H.; Potter, C. Citizen science as seen by scientists: Methodological, epistemological and ethical dimensions. Public Underst. Sci. 2013, 23, 107–120. [Google Scholar] [CrossRef]
  30. Follett, R.; Strezov, V. An analysis of citizen science based research: Usage and publication patterns. PLoS ONE 2015, 10, e0143687. [Google Scholar] [CrossRef] [PubMed] [Green Version]
  31. McKinley, D.C.; Miller-Rushing, A.J.; Ballard, H.L.; Bonney, R.; Brown, H.; Cook-Patton, S.C.; Evans, D.M.; French, R.A.; Parrish, J.K.; Phillips, T.B.; et al. Citizen science can improve conservation science, natural resource management, and environmental protection. Biol. Conserv. 2017, 208, 15–28. [Google Scholar] [CrossRef] [Green Version]
  32. Sterrett, S.C.; Katz, R.A.; Fields, W.R.; Campbell Grant, E.H. The contribution of road-based citizen science to the conservation of pond-breeding amphibians. J. Appl. Ecol. 2019, 56, 988–995. [Google Scholar] [CrossRef]
  33. Tiago, P.; Pereira, H.M.; Capinha, C. Using citizen science data to estimate climatic niches and species distributions. Basic Appl. Ecol. 2017, 20, 75–85. [Google Scholar] [CrossRef]
  34. Cosentino, B.J.; Marsh, D.M.; Jones, K.S.; Apodaca, J.J.; Bates, C.; Beach, J.; Beard, K.H.; Becklin, K.; Bell, J.M.; Crockett, C.; et al. Citizen science reveals widespread negative effects of roads on amphibian distributions. Biol. Conserv. 2014, 180, 31–38. [Google Scholar] [CrossRef] [Green Version]
  35. Mckinley, D.C.; Miller-rushing, A.J.; Ballard, H.L.; Bonney, R.; Brown, H.; Evans, D.M.; French, R.A.; Parrish, J.K.; Phillips, T.B.; Ryan, S.F.; et al. Investing in citizen science can improve natural resource management and environmental protection. Issues Ecol. 2015, 1–27. [Google Scholar]
  36. Phillips, T.B.; Ballard, H.L.; Lewenstein, B.V.; Bonney, R. Engagement in science through citizen science: Moving beyond data collection. Sci. Educ. 2019, 103, 665–690. [Google Scholar] [CrossRef]
  37. Bonney, R.; Byrd, J.; Carmichael, J.T.; Cunningham, L.; Oremland, L.; Shirk, J.; Harten, A.V.O.N. Sea change: Using citizen science to inform fisheries management. Bioscience 2021, 1, biab016. [Google Scholar] [CrossRef]
  38. Cruickshank, S.S.; Bühler, C.; Schmidt, B.R. Quantifying data quality in a citizen science monitoring program: False negatives, false positives and occupancy trends. Conserv. Sci. Pract. 2019, e54. [Google Scholar] [CrossRef] [Green Version]
  39. Gollan, J.; De Bruyn, L.L.; Reid, N.; Wilkie, L. Can Volunteers Collect Data that are Comparable to Professional Scientists? A Study of Variables Used in Monitoring the Outcomes of Ecosystem Rehabilitation. Environ. Manag. 2012, 50, 969–978. [Google Scholar] [CrossRef]
  40. City of Calgary. Calgary Wetland Conservation Plan; City of Calgary: Calgary, AB, Canada, 2004.
  41. Bushell, C. Central Region Leopard Frog Survey. Available online: https://www.alberta.ca/fisheries-and-wildlife-management-information-system-overview.aspx (accessed on 30 January 2020).
  42. Ehrenfeld, J.G. Evaluating wetlands within an urban context. Ecol. Eng. 2000, 15, 253–265. [Google Scholar] [CrossRef]
  43. Government of Alberta. Sensitive Species Inventory Guidelines; Government of Alberta: Stony Plain, AB, Canada, 2013.
  44. Miistakis Institute Call of the Wetland. Available online: http://www.callofthewetland.ca (accessed on 28 March 2021).
  45. MacKenzie, D.I.; Nichols, J.D.; Royle, J.A.; Pollock, K.H.; Bailey, L.; Hines, J.E. Occupancy Estimation and Modeling: Inferring Patterns and Dynamics of Species Occurrence, 2nd ed.; Elsevier: Amsterdam, The Netherlands, 2017; ISBN 0124072453. [Google Scholar]
  46. Shonfield, J.; Bayne, E.M. Autonomous recording units in avian ecological research: Current use and future applications. Avian Conserv. Ecol. 2017, 12, 1–14. [Google Scholar] [CrossRef]
  47. Government of Saskatchewan. Species Detection Survey Protocol: 1.0 Amphibian Auditory Surveys; Government of Saskatchewan: Regina, SK, USA, 2020.
  48. Annich, N.C. Use of Bioacoustic Technology to Evaluate Habitat Use and Road Effects on Two Anuran Amphibians in the Boreal Region of Northeastern Alberta. Master’s Thesis, University of Alberta, Edmonton, AB, Canada, 2017. [Google Scholar]
  49. Wildlife Accoustics Inc. Song Meter SM4: Bioacoustics Recorder User Guide; Wildlife Accoustics Inc.: Maynard, MA, USA, 2016. [Google Scholar]
  50. Manchester Metropolitan University Clustering and Classification Methods for Biologists: Classification Accuracy. Available online: http://www.alanfielding.co.uk/multivar/accuracy.htm (accessed on 3 March 2020).
  51. Eigenbrod, F.; Hecnar, S.J.; Fahrig, L. The relative effects of road traffic and forest cover on anuran populations. Biol. Conserv. 2008, 141, 35–46. [Google Scholar] [CrossRef]
  52. Dodd, C.K. Frogs of the United States and Canada, 2nd ed.; Johns Hopkins University Press: Baltimore, MD, USA, 2013. [Google Scholar]
  53. Warton, D.I.; Hui, F.K.C. The arcsine is asinine: The analysis of proportions in ecology. Ecology 2011, 92, 3–10. [Google Scholar] [CrossRef] [Green Version]
  54. Lee, T.S.; Sanderson, K.; Lora Colquhoun, N. Amphibians at Risk: An Analysis of Wetland Habitat and Corridors Needed to Secure Amphibian Populations in Calgary; Miistakis Institute: Calgary, AB, Canada, 2020. [Google Scholar]
  55. Phillips, T.B.; Ferguson, M.; Minarchek, M.; Porticella, N.; Bonney, R. User’s Guide for Evaluating Learning Outcomes From Citizen Science; Cornell Lab of Ornithology: Ithaca, NY, USA, 2015. [Google Scholar]
  56. West, S.; Pateman, R. Recruiting and retaining participants in citizen science: What can be learned from the volunteering literature. Citiz. Sci. Theory Pract. 2016, 1, 1–10. [Google Scholar] [CrossRef] [Green Version]
  57. Magle, S.B.; Fidino, M.; Lehrer, E.W.; Gallo, T.; Mulligan, M.P.; Ríos, M.J.; Ahlers, A.A.; Angstmann, J.; Belaire, A.; Dugelby, B.; et al. Advancing urban wildlife research through a multi-city collaboration. Front. Ecol. Environ. 2019, 17, 232–239. [Google Scholar] [CrossRef]
  58. Rubbo, M.J.; Kiesecker, J.M. Amphibian breeding distribution in an urbanized landscape. Conserv. Biol. 2005, 19, 504–511. [Google Scholar] [CrossRef]
  59. Damiens, F.L.P.; Backstrom, A.; Gordon, A. Governing for “no net loss” of biodiversity over the long term: Challenges and pathways forward. One Earth 2021, 4, 60–74. [Google Scholar] [CrossRef]
  60. Todd, B.D.; Rose, J.P.; Price, S.J.; Dorcas, M.E. Using citizen science data to identify the sensitivity of species to human land use. Conserv. Biol. 2016, 30, 1266–1276. [Google Scholar] [CrossRef] [Green Version]
  61. Toogood, M. Engaging Publics: Biodiversity Data Collection and the Geographies of Citizen Science. Geogr. Compass 2013, 7, 611–621. [Google Scholar] [CrossRef]
  62. Westgate, M.J.; Scheele, B.C.; Ikin, K.; Hoefer, A.M.; Beaty, R.M.; Evans, M.; Osborne, W.; Hunter, D.; Rayner, L.; Driscoll, D.A. Citizen science program shows urban areas have lower occurrence of frog species, but not accelerated declines. PLoS ONE 2015, 10, e0140973. [Google Scholar] [CrossRef] [Green Version]
  63. Jarchow, C.J.; Hossack, B.R.; Sigafus, B.H.; Schwalbe, C.R.; Muths, E. Modeling habitat connectivity to inform reintroductions: A case study with the Chiricahua leopard frog. J. Herpetol. 2016, 50, 63–69. [Google Scholar] [CrossRef]
  64. Porej, D.; Micacchion, M.; Hetherington, T.E. Core terrestrial habitat for conservation of local populations of salamanders and wood frogs in agricultural landscapes. Biol. Conserv. 2004, 120, 399–409. [Google Scholar] [CrossRef]
  65. Browne, C.L.; Paszkowski, C.A.; Foote, A.L.; Moenting, A.; Boss, S.M. The relationship of amphibian abundance to habitat features across spatial scales in the Boreal Plains. Écoscience 2009, 16, 209–223. [Google Scholar] [CrossRef]
  66. Guerry, A.D.; Hunter, M.L. Amphibian distributions in a landscape of forests and agriculture: An examination of landscape composition and configuration. Conserv. Biol. 2002, 16, 745–754. [Google Scholar] [CrossRef]
  67. Nowak, D.J.; Greenfield, E.J. Declining urban and community tree cover in the United States. Urban For. Urban Green. 2018, 32, 32–55. [Google Scholar] [CrossRef]
  68. City of Calgary. Calgary Municipal Development Plan; City of Calgary: Calgary, AB, Canada, 2020.
  69. City of Calgary. Our BiodiverCity. Calgary’s 10 Year Biodiversity Strategic Plan; City of Calgary: Calgary, AB, Canada, 2015.
  70. City of Calgary. A City of Trees: Parks Urban Forest Strategic Plan; City of Calgary: Calgary, AB, Canada, 2007.
  71. City of Calgary. Natural Area Management Plan; City of Calgary: Calgary, AB, Canada, 1994.
  72. City of Calgary. The Riparian Action Program: A Blueprint for Resilience; City of Calgary: Calgary, AB, Canada, 2017.
  73. City of Calgary. Environmental Reserve Setback Guidelines; City of Calgary: Calgary, AB, Canada, 2007.
  74. Austen, G.E.; Bindemann, M.; Griffiths, R.A.; Roberts, D.L. Species identification by experts and non-experts: Comparing images from field guides. Sci. Rep. 2016, 6. [Google Scholar] [CrossRef] [PubMed]
  75. Austen, G.E.; Bindemann, M.; Griffiths, R.A.; Roberts, D.L. Species identification by conservation practitioners using online images: Accuracy and agreement between experts. PeerJ 2018, 6. [Google Scholar] [CrossRef] [PubMed] [Green Version]
  76. Sewell, D.; Beebee, T.J.C.; Griffiths, R.A. Optimising biodiversity assessments by volunteers: The application of occupancy modelling to large-scale amphibian surveys. Biol. Conserv. 2010, 143, 2102–2110. [Google Scholar] [CrossRef]
  77. Altwegg, R.; Nichols, J.D. Occupancy models for citizen science data. Methods Ecol. Evol. 2019, 10, 8–12. [Google Scholar] [CrossRef] [Green Version]
  78. Dickinson, J.L.; Zuckerberg, B.; Bonter, D.N. Citizen science as an ecological research tool: Challenges and benefits. Annu. Rev. Ecol. Evol. Syst. 2010, 41, 149–172. [Google Scholar] [CrossRef] [Green Version]
  79. Pandya, R.E. Framework for engaging diverse communities in citizen science in the US. Front. Ecol. Environ. 2012, 10, 314–317. [Google Scholar] [CrossRef]
  80. Stepenuck, K.F.; Genskow, K.D. Traits of volunteer water monitoring programs that influence natural resource management and policy impact. Soc. Nat. Resour. 2019, 32, 275–291. [Google Scholar] [CrossRef]
  81. Sterling, E.J.; Betley, E.; Sigouin, A.; Gomez, A.; Toomey, A.; Cullman, G.; Malone, C.; Pekor, A.; Arengo, F.; Blair, M.; et al. Assessing the evidence for stakeholder engagement in biodiversity conservation. Biol. Conserv. 2017, 209, 159–171. [Google Scholar] [CrossRef]
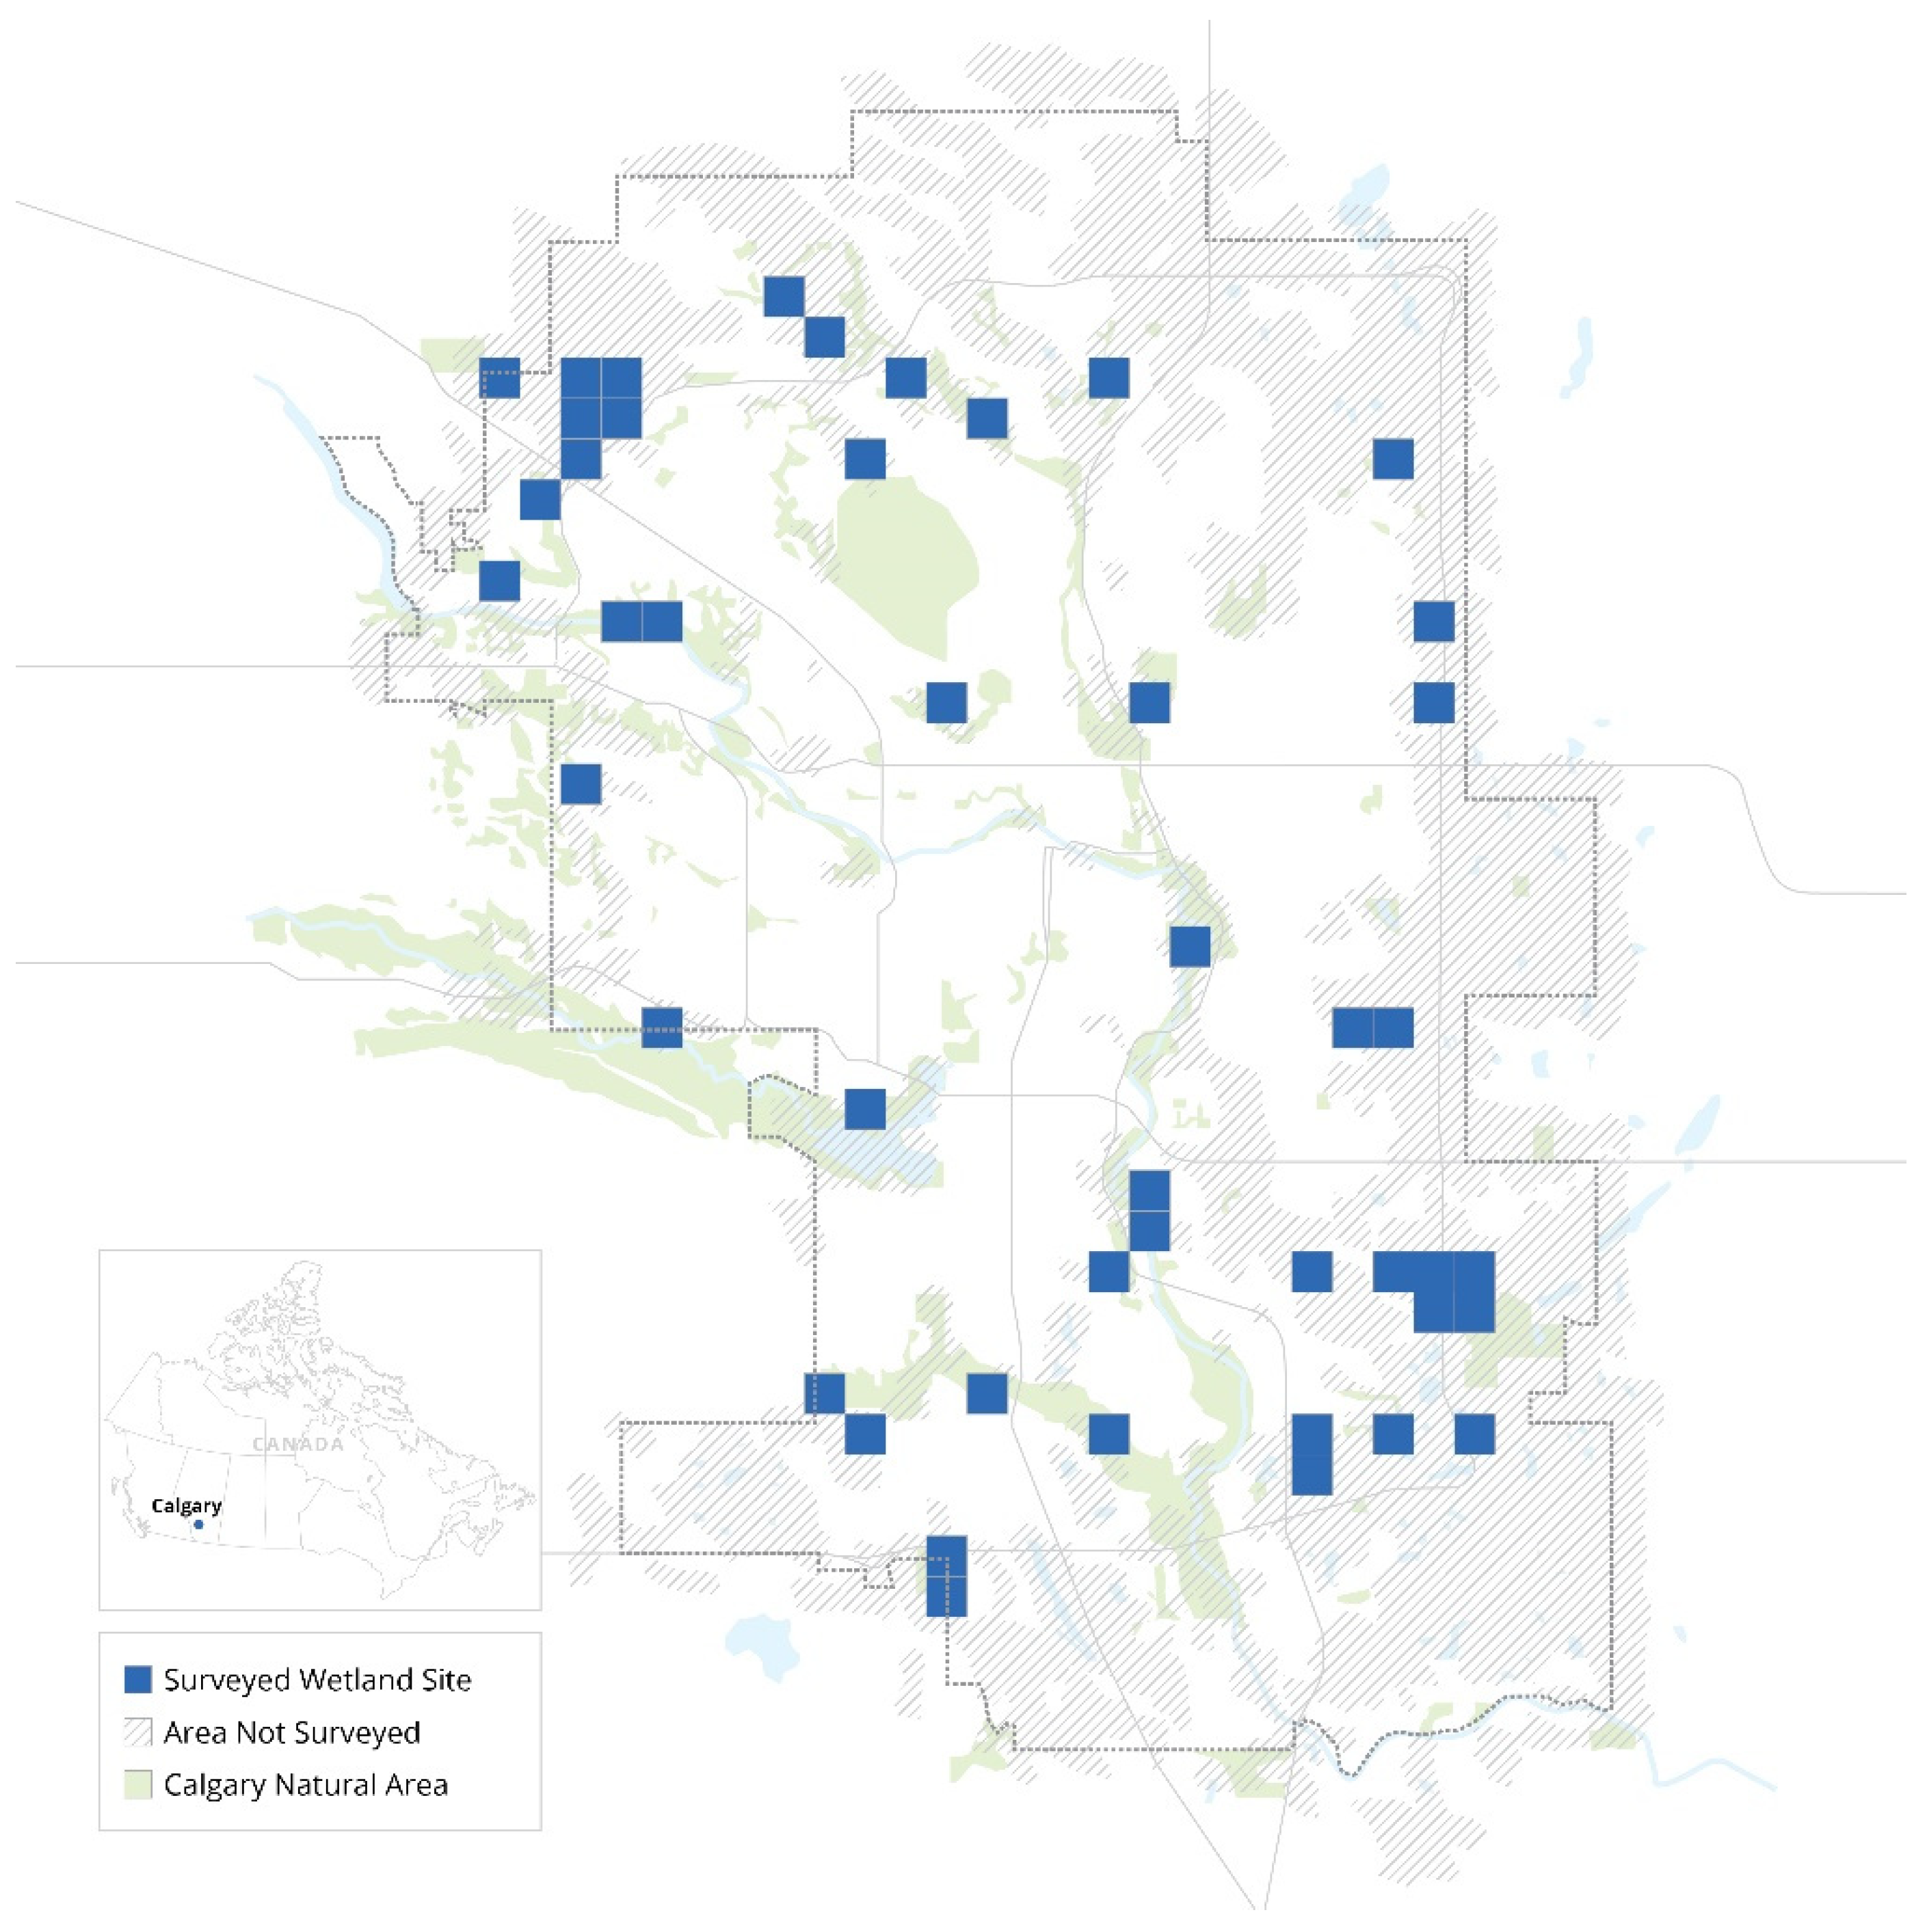
Figure 1. Map depicting wetland areas surveyed by citizens in Calgary, AB, Canada. More than one wetland site can occur in a blue square.
Diversity 13 00211 g001
Figure 2. Map depicting the number of amphibian species observed at Calgary wetlands from 2017 to 2019. Species were not necessarily observed in the same year. Map includes incidental observations submitted in addition to observations at survey sites.
Diversity 13 00211 g002
Figure 3. Autonomous recording unit (ARU) detections for wood frog at 12 wetland sites in Calgary, AB, Canada whereby * indicates sites where wood frogs were not reported by citizen scientists (only 11 sites are displayed because wetland 6 was a repeat monitoring site and citizen scientists missed recording wood frog both years, displayed here as average number of detections). Of those sites where wood frogs were not reported by citizen scientists, only wetland 1 had greater than 15 recorded calls during the duration of the season. Four wetland sites with no recorded wood frog detections are not displayed on the graph.
Diversity 13 00211 g003
Figure 4. Cumulative probability of detection of citizen scientists surveys (circles) compared to ARUs (squares) for boreal chorus frogs Pseudacris maculata (A) and wood frogs Lithobates sylvaticus (B). Where the dashed line intersects the circles indicates the number of surveys that would need to be completed by citizen scientists to equal the single survey probability of detection for ARUs.
Diversity 13 00211 g004
Figure 5. Survey responses depicting the motivations of surveyed participants when asked the multiple choice question: “What motivated you to register for the program?”.
Diversity 13 00211 g005
Figure 6. Frequency of coded topics found in responses to the open-ended question: “What have you shared with others about the program?”.
Diversity 13 00211 g006
Table 1. Confusion matrix categories comparing citizen science and autonomous recording unit reports at 16 wetland sites over two years for boreal chorus frog Pseudacris maculata (BCFR) and wood frog Lithobates sylvaticus (WOFR) in Calgary, Alberta, Canada.
Confusion Matrix CategoriesBCFRWOFR
True Positive (participant recorded, acoustics recorded)113
True Negative (participant did not record, acoustics did not record)24
False Positive (participant recorded, acoustics did not record)00
False Negative (participant did not record, acoustics did record)39
Publisher’s Note: MDPI stays neutral with regard to jurisdictional claims in published maps and institutional affiliations.