Article

Protein Structure, Models of Sequence Evolution, and Data Type Effects in Phylogenetic Analyses of Mitochondrial Data: A Case Study in Birds

Department of Biology, University of Florida, Gainesville, FL 32611, USA
*
Author to whom correspondence should be addressed.
Diversity 2021, 13(11), 555; https://doi.org/10.3390/d13110555
Submission received: 28 September 2021 / Revised: 26 October 2021 / Accepted: 27 October 2021 / Published: 1 November 2021
(This article belongs to the Special Issue Generation of Genome-Wide Genetic Data and Evolutionary Analyses)

Abstract

:
Phylogenomic analyses have revolutionized the study of biodiversity, but they have revealed that estimated tree topologies can depend, at least in part, on the subset of the genome that is analyzed. For example, estimates of trees for avian orders differ if protein-coding or non-coding data are analyzed. The bird tree is a good study system because the historical signal for relationships among orders is very weak, which should permit subtle non-historical signals to be identified, while monophyly of orders is strongly corroborated, allowing identification of strong non-historical signals. Hydrophobic amino acids in mitochondrially-encoded proteins, which are expected to be found in transmembrane helices, have been hypothesized to be associated with non-historical signals. We tested this hypothesis by comparing the evolution of transmembrane helices and extramembrane segments of mitochondrial proteins from 420 bird species, sampled from most avian orders. We estimated amino acid exchangeabilities for both structural environments and assessed the performance of phylogenetic analysis using each data type. We compared those relative exchangeabilities with values calculated using a substitution matrix for transmembrane helices estimated using a variety of nuclear- and mitochondrially-encoded proteins, allowing us to compare the bird-specific mitochondrial models with a general model of transmembrane protein evolution. To complement our amino acid analyses, we examined the impact of protein structure on patterns of nucleotide evolution. Models of transmembrane and extramembrane sequence evolution for amino acids and nucleotides exhibited striking differences, but there was no evidence for strong topological data type effects. However, incorporating protein structure into analyses of mitochondrially-encoded proteins improved model fit. Thus, we believe that considering protein structure will improve analyses of mitogenomic data, both in birds and in other taxa.

Graphical Abstract

1. Introduction

The accumulation of molecular data has revolutionized our ability to understand biodiversity, especially since the dawn of the phylogenomic era approximately 20 years ago [1,2]. However, phylogenomics has also revealed that many conflicting signals can emerge when different parts of the genome are analyzed [3]. It has long been appreciated that there are a variety of processes that can create genuine discordance among gene trees [4,5] and the ability to collect large amounts of data that can capture the variation among gene trees has led to a paradigm shift in systematics [6]. In fact, mathematical models that describe discordance due to the multispecies coalescent, arguably the most prominent source of genuine conflicts among gene trees, are now quite mature [7,8]. However, efforts to estimate species trees and to understand the amount of genuine discordance among gene trees are complicated by two sources of error: stochastic and systematic error [3]. Stochastic error is a simple consequence of the fact that all results of phylogenetic analyses are based on a finite number of characters [9]. In principle, it is possible to reduce or even overcome stochastic error by sequencing complete genomes (or relatively large proportions of the genome). In contrast to stochastic error, systematic error reflects cases where specific analytical methods are expected to converge on an incorrect estimate of phylogeny, typically with increasing certainty, as the number of characters used in analyses is increased. Ultimately, systematic error can only be addressed by improving the model of evolution underlying the analytical method or by excluding data that are misleading given the method of phylogenetic analyses.
Reddy et al. [10] highlighted a type of systematic error in phylogenetic analyses that they called data type effects, an idea related to the “process partitions” of Bull et al. [11]. Reddy et al. [10] invoked data type effects to explain the observation that phylogenetic analyses focused on the earliest divergences among avian orders using coding versus non-coding data yield different trees (compare trees within Jarvis et al. [12] and compare the non-coding Jarvis et al. [12] trees to the coding tree in Prum et al. [13]). Reddy et al. [10] controlled for taxon sampling, finding that the important variable was the use of coding versus non-coding data types (see also Braun and Kimball [14]). Unlike the case of process partitions, where at least some process partitions might exhibit incongruent topologies due to genuine discordance among gene trees (e.g., due to the multispecies coalescent [4,5,6]), Reddy et al. [10] restricted the definition of data type effects to cases where the spectra of gene trees for the data types are expected to be similar (since they were describing a phenomenon that emerges in phylogenomic studies where they expected a mixture of gene trees). Phylogenomic studies focused on taxa other than birds have also found differences among trees estimated using distinct data types [3,15,16,17,18,19,20,21], suggesting data type effects are a general phenomenon that can complicate our ability to use molecular data to understand the evolutionary relationships that underlie existing biodiversity.
Data type effects differ from the sources of systematic error that have received the most attention in the phylogenetic literature. Those sources of error include long-branch attraction [22,23], convergence in nucleotide and/or amino acid composition [24,25], and biases due to discordance among gene trees [26,27]. Those phenomena represent specific parts of parameter space for the evolutionary process that can be shown to be misleading for specific analytical methods using simulations and/or a rigorous mathematical proof. Reddy et al. [10] defined data type effects using two criteria: (1) phylogenetic analyses of the data types reveal distinct topological signals; and (2) analyses using multiple independent samples of each data type converge on the same parts of tree space. The second criterion indicates that data type effects are systematic error(s), but the term is agnostic regarding the source of that error. For example, a case where one data type exhibits strong base compositional convergence and the other data type does not would be a data type effect. Another data type effect would be the case where one data type is subject to long-branch attraction but the other is not. The only source of error that cannot be a data type effect is biases due to discordance among gene trees; Reddy et al. [10] explicitly limited data type effects to cases where gene tree spectra for both data types are expected to be similar. The conflict between trees based on coding versus non-coding sequences in birds is the best-studied example of a data type effect [10,12,14,28]; that data type effect is likely to reflect, at least in part, model misspecification due to deviations from stationary base composition in the coding regions [14]. Pandey and Braun [17,20] described another data type effect involving solvent-exposed versus buried residues in globular proteins that has an impact on the topology for the earliest divergences among metazoan. Although the basis for that data type effect is unclear, it is clear that the best models of sequence evolution differ for buried versus exposed residues [17,29,30,31]. We believe that data type effects related to protein structure might be especially fertile ground for understanding data type effects. After all, the extensive information about the biochemical and biophysical basis of protein structure (reviewed by Kessel and Ben-Tal [32]) opens the door to improved models of sequence evolution for structurally defined data types.
The mitochondrially-encoded subset of the animal proteome might be a useful “model system” for the study of protein structure data type effects. A classic study by Naylor and Brown [33,34] (hereafter NB) showed that different topological signals are associated with distinct subsets of amino acids in mitochondrially-encoded proteins. More specifically, NB found that sites dominated by hydrophobic residues had a poor fit to a number of strongly corroborated relationships in the vertebrate species tree based on the maximum parsimony (MP) criterion. This suggests that mitochondrially-encoded proteins will exhibit a structural data type effect because all proteins encoded by vertebrate mitogenomes are transmembrane proteins [35,36] and hydrophobic amino acids are concentrated in transmembrane (TM) helices. Thus, we expect exhibit distinct topological signals to be evident if we define TM helices and extra-membrane (ExM) loops as the two data types to consider. The central question is how to detect that data type effect, if it exists, in other taxonomic groups. The “known phylogeny” approach, used by NB, suffers from the fact that any phylogeny that can be viewed as “known” is likely to be characterized by a strong historical signal (i.e., it will have many site patterns that support bipartitions in the true tree). After all, it is the existence of a strong historical signal that provides the corroboration of relationships that causes systematists to view the phylogeny as known. Unless the non-historical signal(s) (site patterns that support bipartitions that are not present in the true tree) are equally strong they are likely to be overwhelmed by strong historical signals, rendering weak non-historical signals essentially undetectable. Thus, the ideal datasets to examine for data type effects are those for which the historical signal is very weak; the relationships among avian orders (Figure 1) represent such a phylogeny.
Takezaki and Gojobori [37] challenged the broader implications of the NB results by showing that using models of evolution that incorporate among-sites rate variation ameliorates the poor fit of the hydrophobic residues to vertebrate phylogeny. Virtually all of the programs currently used in modern phylogenetic analyses, such as the fast maximum likelihood (ML) program IQ-TREE [38], implement models that incorporate among-sites rate heterogeneity. Although this suggests that relatively simple model improvements might eliminate the data type effect implied by the NB results, they do not necessarily indicate that adding among-sites rate heterogeneity to analytical models in the most straightforward manner (the discrete approximation to the Γ distribution [39]) will be a panacea for topological errors in analyses of mitogenomic data. Indeed, more recent studies indicate that the details of the rate-heterogeneity model can have an impact on estimates of phylogeny for mitogenomic data [40,41]. Moreover, many phylogenetic analyses of metazoan mitogenomes have revealed evidence of systematic biases [42,43,44,45,46,47,48,49] and the sources of those errors is far from clear.
In addition to their potential to improve phylogenetic estimation, models of sequence evolution can provide insights into the underlying processes of molecular evolution [31]. Examining the evolution of TM and ExM sites in a broadly sampled set of mitogenomes (in this study, sampled from birds) has the potential to yield a number of insights. When the results of Jones et al. [50] and Liò and Goldman [51] (which largely reflect nuclear-encoded TM proteins) are considered in light of the support for different relative exchangeabilities of amino acids in distinct structural environments [17,29,30,31], it seems likely that analyses focused on mitochondrially-encoded proteins will yield evidence of model differences between data types. If those model differences result in model misspecification for at least one of those data types, we might find evidence for strong data type effects (strong support for clades that conflict with the monophyly of the strongly corroborated avian orders), weak data type effects (strong topological conflicts for the weakly-supported relationships among orders), or both.
Here, we conducted a study motivated by the classic NB studies and previous work on models of TM protein evolution [50,51]. We generated an aligned data matrix comprising the 12 proteins encoded by the heavy strand of the avian mitogenome sampled from 420 bird species, annotated the alignment with structural information, and used those data to examine three predictions that emerge when the NB studies are considered. First, we predicted that if we use the 20-state general time-reversible (GTR20) model to estimate the relative exchangeabilities of amino acids in TM versus ExM environments we would find evidence for very different parameter values. This prediction is already corroborated by other studies focused on transmembrane protein evolution [50,51], so it is very likely to be true. However, we can make a more specific prediction regarding the patterns we are likely to see in our estimated rate matrices: we predicted that relative exchangeabilities for pairs of amino acids that are rare in a particular structural environment would be elevated in mitochondrially-encoded proteins because this has already been shown for globular proteins [31]. Second, we expected phylogenetic analyses of the ExM loops to perform better than analyses of TM helices. Since the relationships among avian orders are highly uncertain (Figure 1) we tested this prediction by examining the monophyly of orders (monophyly of avian orders as they are currently circumscribed is strongly corroborated; reviewed by Braun et al. [61]). Third, we expected different topological signals to emerge in phylogenetic analyses of each data type. Even if there were no strong non-historical signals, it seems likely that even very weak biases might perturb the highly uncertain portions of the bird tree (Figure 1). We then used a mixture model framework to determine whether there were model violations that remained after estimating GTR20 rate matrices for each data type. To complement our analyses of amino acid data, we analyzed the nucleotide sequences for each data type (including analyses conducted after RY-coding, in which the data are encoded as purines or pyrimidines). These analyses provided insights into the processes of molecular evolution for mitochondrially-encoded proteins and they have the potential to improve phylogenetic analyses of mitochondrial sequences, a major tool in the study of biodiversity.

2. Materials and Methods

2.1. Data Matrix Construction

We started with the alignment used by Nabholz et al. [62], which includes 92 taxa, identified gene boundaries and began adding annotated coding regions for each of the 12 proteins encoded on the heavy strand of the avian mitogenome. We added sequences from taxa with complete or nearly complete mitogenome sequences and the coding regions from one study [63] where the sequences for each gene were obtained separately from the same specimen. Sequences were aligned by eye because avian mitochondrial coding regions have few indels and they are easy to align. We did not construct chimeric sequences from multiple individuals. Ultimately, this resulted in a data matrix with 420 species. After translating the sequences we used the TM helix boundaries annotated for the chicken (Gallus gallus) in UniProt [64] to create a NEXUS charset [65] for the TM helices. Although the lengths of TM helices can vary depending on the tilt angle of the helix [66], their lengths are highly constrained by the width of the lipid bilayer. Thus, we believed that it was reasonable to assume that the sites were either associated with TM helices or ExM segments across all birds. These datasets are available as Supplementary File S1.

2.2. Analyses of Molecular Evolution and Phylogeny

We used IQ-TREE version 2.0.6 [38] for all tree estimation and we assessed support using the ultrafast bootstrap [67], with 1000 replicates. We used the Bayesian information criterion (BIC) [68] values calculated by IQ-TREE to identify the best-fitting model.
We analyzed three amino acid datasets (TM sites, ExM sites, and all sites) using the GTR20 and mtVer [69] models. We accommodated among sites rate heterogeneity using a combination of invariant sites and Γ-distributed rates across sites. We used empirical amino acid frequencies (+F) for the mtVer. For the partitioned analysis, we fixed R matrix parameters at the values estimated using the separate TM and ExM alignments, which we call the bird mtTM model and bird mtExM model (hereafter, TM and ExM will be used as abbreviations for transmembrane and extramembrane sites while mtTM and mtExM will be used for the R matrices). The mixture model (bird mtMIX) was constructed using the bird mtTM and bird mtExM R matrices as the two mixture components with the rate of each mixture component set to a value proportional to the tree lengths (the sum of all ML branch length estimates) for each separate analysis; the relative rates (rounded to three decimal places) were mtTM = 0.918 and mtExM = 1.082. We assumed Γ-distributed rates to accommodate rate heterogeneity beyond that of the mixture component rates. We estimated mixture weights by ML and calculated the relative contributions to the site likelihoods using the -wslm option. We generated a generalized TM helix model to compare with the bird mtTM model; we generated this model (JTTtm) by using the DCMut method [70] method to convert the data in Jones et al. [50] into an R matrix. All R matrices (bird mtTM, bird mtExM, and JTTtm) are available in PAML format in Supplementary File S2 and https://github.com/ebraun68/protmodels (accessed on 26 September 2021). The bird mtMIX model is also available as a NEXUS models block, which can be read by IQ-TREE (this file includes unrounded values for the mixture component rates).
We conducted four analyses of nucleotide data, all of which were partitioned by codon position. As with the amino acid datasets, we analyzed three nucleotide datasets: (1) TM sites; (2) ExM sites; and (3) all sites. We conducted two analyses of the all-sites data, one using three partitions (the codon positions) and a second with six partitions (the three codon positions for TM sites and the three codon positions in the ExM sites). The same four analyses were conducted using binary (RY) versions of the three datasets. Since the IQ-TREE binary model uses 0 and 1 as character states, we actually coded the data as purines = 0 and pyrimidines = 1; we generated the binary data matrix using recodeRY.pl, available from https://github.com/ebraun68/RYcode (accessed on 26 September 2021).
We assessed the topological distances among trees using matching distances [71,72], calculated in PAUP* 4.0a169 [73]. We used the Kimball et al. [52] supertree (specifically, the matrix representation of the parsimony supertree from that paper) as our estimate of the avian species tree. To facilitate comparisons between estimates of the mitogenomic tree and the Kimball supertree, we reduced the trees to a set of 51 taxa, each of which represent major lineages that were monophyletic in the mitogenomic tree. All trees are included in Supplementary File S3. Taxa used for the comparison with the Kimball supertree are included in that file as a taxset. We visualized distances among trees by clustering the matching distances using neighbor joining [74]. The matrix of matching distances is available in Supplementary File S4.
We used a simple dataset subdivision similar to the Farris et al. [75,76] incongruence length difference (ILD) test to assess the differences between the TM and ExM data types. Briefly, we generated 100 randomly subdivided dataset pairs, where one data subset had the same number of sites as the TM sites and the other had the same number of sites as the ExM sites. The ILD test uses the sum of the MP treelengths for the optimal trees for each data subset as the test statistic; we eschewed the use of MP treelengths because they can confound topology and model. Instead, we used three different test statistics: (1) Euclidean distances between vectors of normalized R matrix parameters; (2) Euclidean distances between vectors of amino acid frequencies; and (3) topological distances (matching distances). This separates model differences (captured by two Euclidean distances) from topological differences. Euclidean distances were calculated using a program written by E.L.B. and available from https://github.com/ebraun68/protmodels (accessed on 26 September 2021). The use of dataset subdivision and model distances might be seen as yielding results similar to the BIC, but we believe it might have more power when the number of free parameters is large, many parameters are relatively constrained, and the set of parameters that differ is difficult to predict. This is the case for the GTR20 model.

3. Results

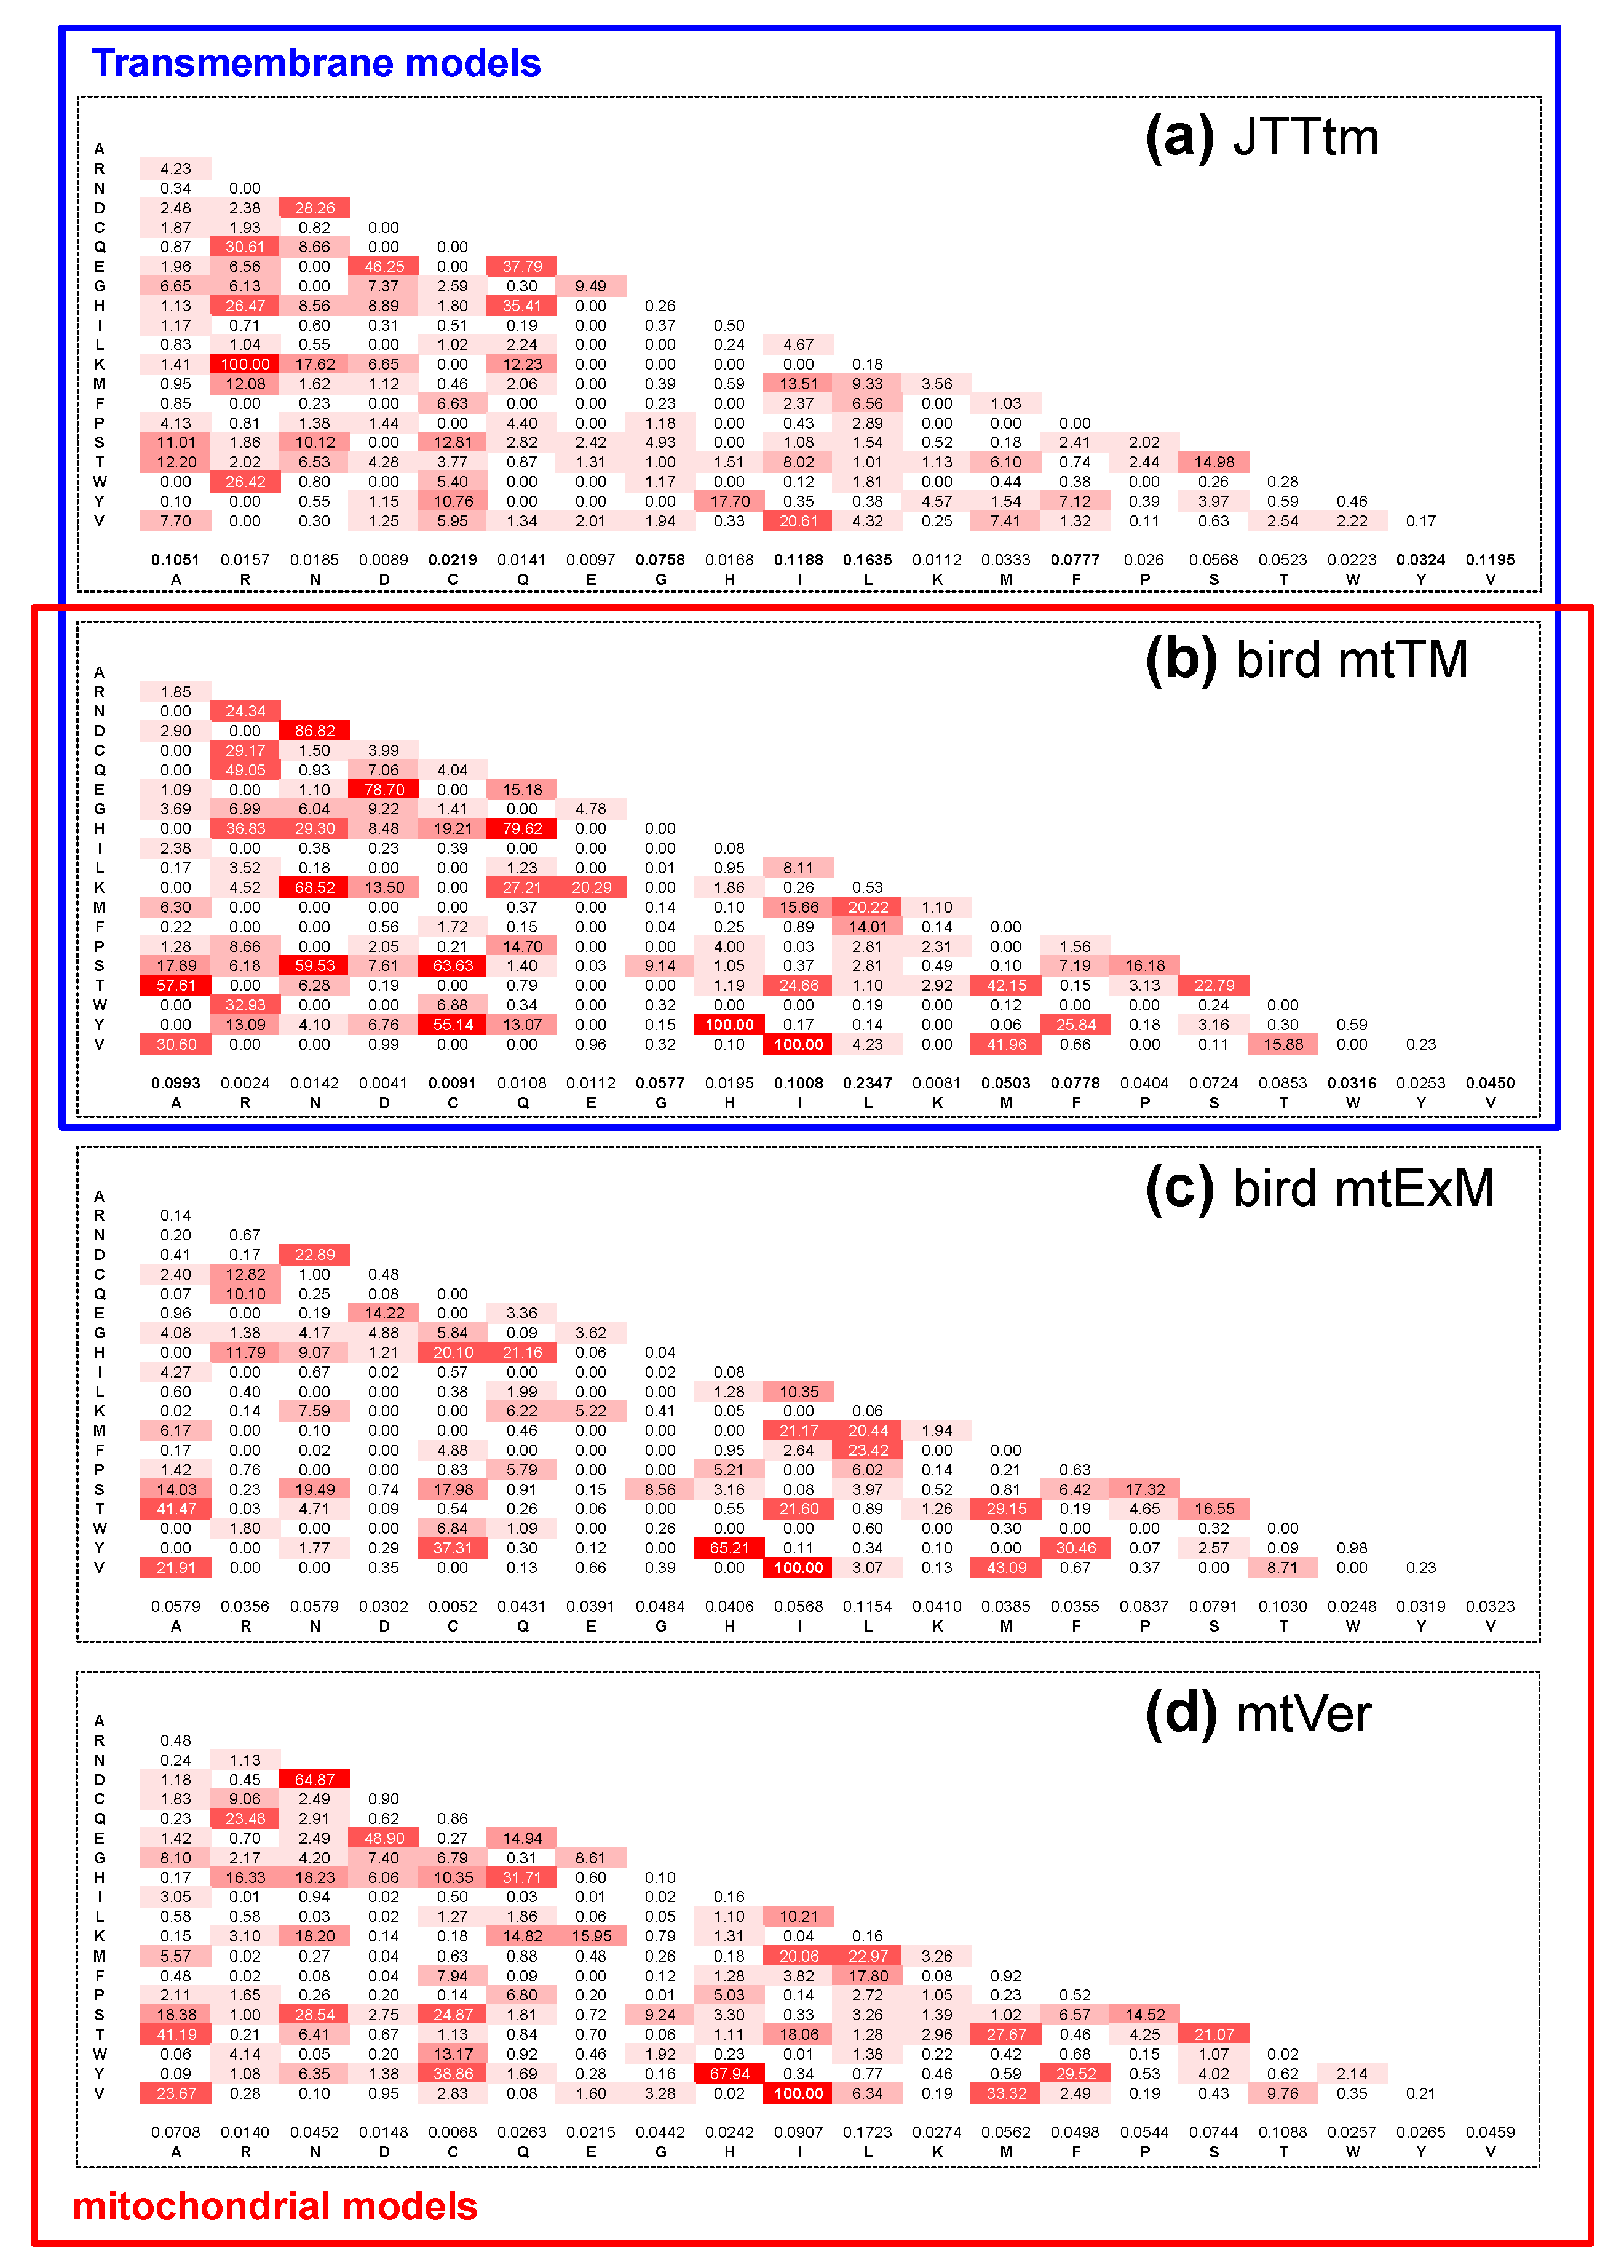
3.1. Do the mtTM (Transmembrane) and mtExM (Extramembrane) Models Differ?

We estimated relative exchangeability (R matrix) and amino acid frequency parameters for the TM and ExM sites using the GTR20 and mtVer models (+I + Γ rate heterogeneity, see Methods); GTR20 had a better fit to both datasets (ΔBIC for TM = 677.0478 and ΔBIC for ExM = 861.4969). This suggests the relative exchangeability parameters for the two data types exhibit significant differences. We used a random dataset subdivision to determine whether that was true; we asked whether the distances between model parameters estimated using TM versus ExM sites exceeded our null expectation. Our null hypothesis was that the two data types are best described by very similar models (i.e., the model distances will be low). The observed distances between models for the TM and ExM sites fell outside the null distribution for the R matrices and for amino acid frequencies (Figure 2). These results corroborated our first prediction (that the distances between estimated model parameters for TM and ExM sites were greater than expected by chance).
Comparing our novel mtTM and mtExM models to other TM and mitochondrial models can provide insights into the patterns of molecular evolution for each data type. The parameters that are most obviously expected to differ between TM and ExM models are the amino acid frequency parameters and the existence of this difference is strongly corroborated by our random subdivision test (Figure 2). As stated in the introduction, TM helices are expected to be enriched for hydrophobic residues whereas ExM segments will be enriched for polar residues. This is exactly what we observed when the bird mtTM and mtExM matrices were compared (the blue boxes in Figure 3 indicate cases where the two TM matrices have a higher amino acid frequency parameter than the bird mtExM matrix). All nine of the amino acids with an elevated amino acid frequency in bird mtTM that was elevated relative to mtExM had very low to moderate Grantham [77] polarity values; seven of those nine amino acids (L, I, F, W, C, M, and V) form a group at the very lowest end of the Grantham polarity scale (Supplementary File S2). Jones et al. [50] reported data for a TM helix mutation data matrix based on nuclear- and mitochondrially-encoded transmembrane proteins from a variety of taxa; we derived the JTTtm matrix (Figure 3a) using their data. There were a few differences in the set of amino acids enriched in JTTtm versus those enriched in bird mtTM, but the set of amino acid frequencies in JTTtm that were elevated relative to bird mtExM (L, I, F, C, V, Y, A, and G) was quite similar to the set enriched in bird mtTM.
Differences in amino acid exchangeability (R matrix) parameters were also evident (Figure 3). Polar–polar exchangeabilities (e.g., N-K, D-E, and N-D) were elevated relative to bird mtExM in both TM matrices whereas hydrophobic-hydrophobic exchangeabilities (e.g., I-V, M-V, and F-Y) were elevated in mtExM (Supplementary File S2). However, the largest relative exchangeability parameters in the mtTM matrix in absolute terms were not polar–polar; they were I-V and H-Y instead. The largest exchangeability in JTTtm was a polar–polar exchange (R-K), which also has a relatively high value in the bird mtTM matrix, albeit not to the same degree (Figure 3). Regardless, it is clear that there are substantial differences between models of TM helix versus ExM loop evolution, as expected based on our first prediction.

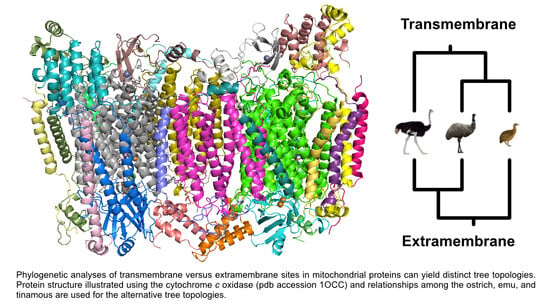
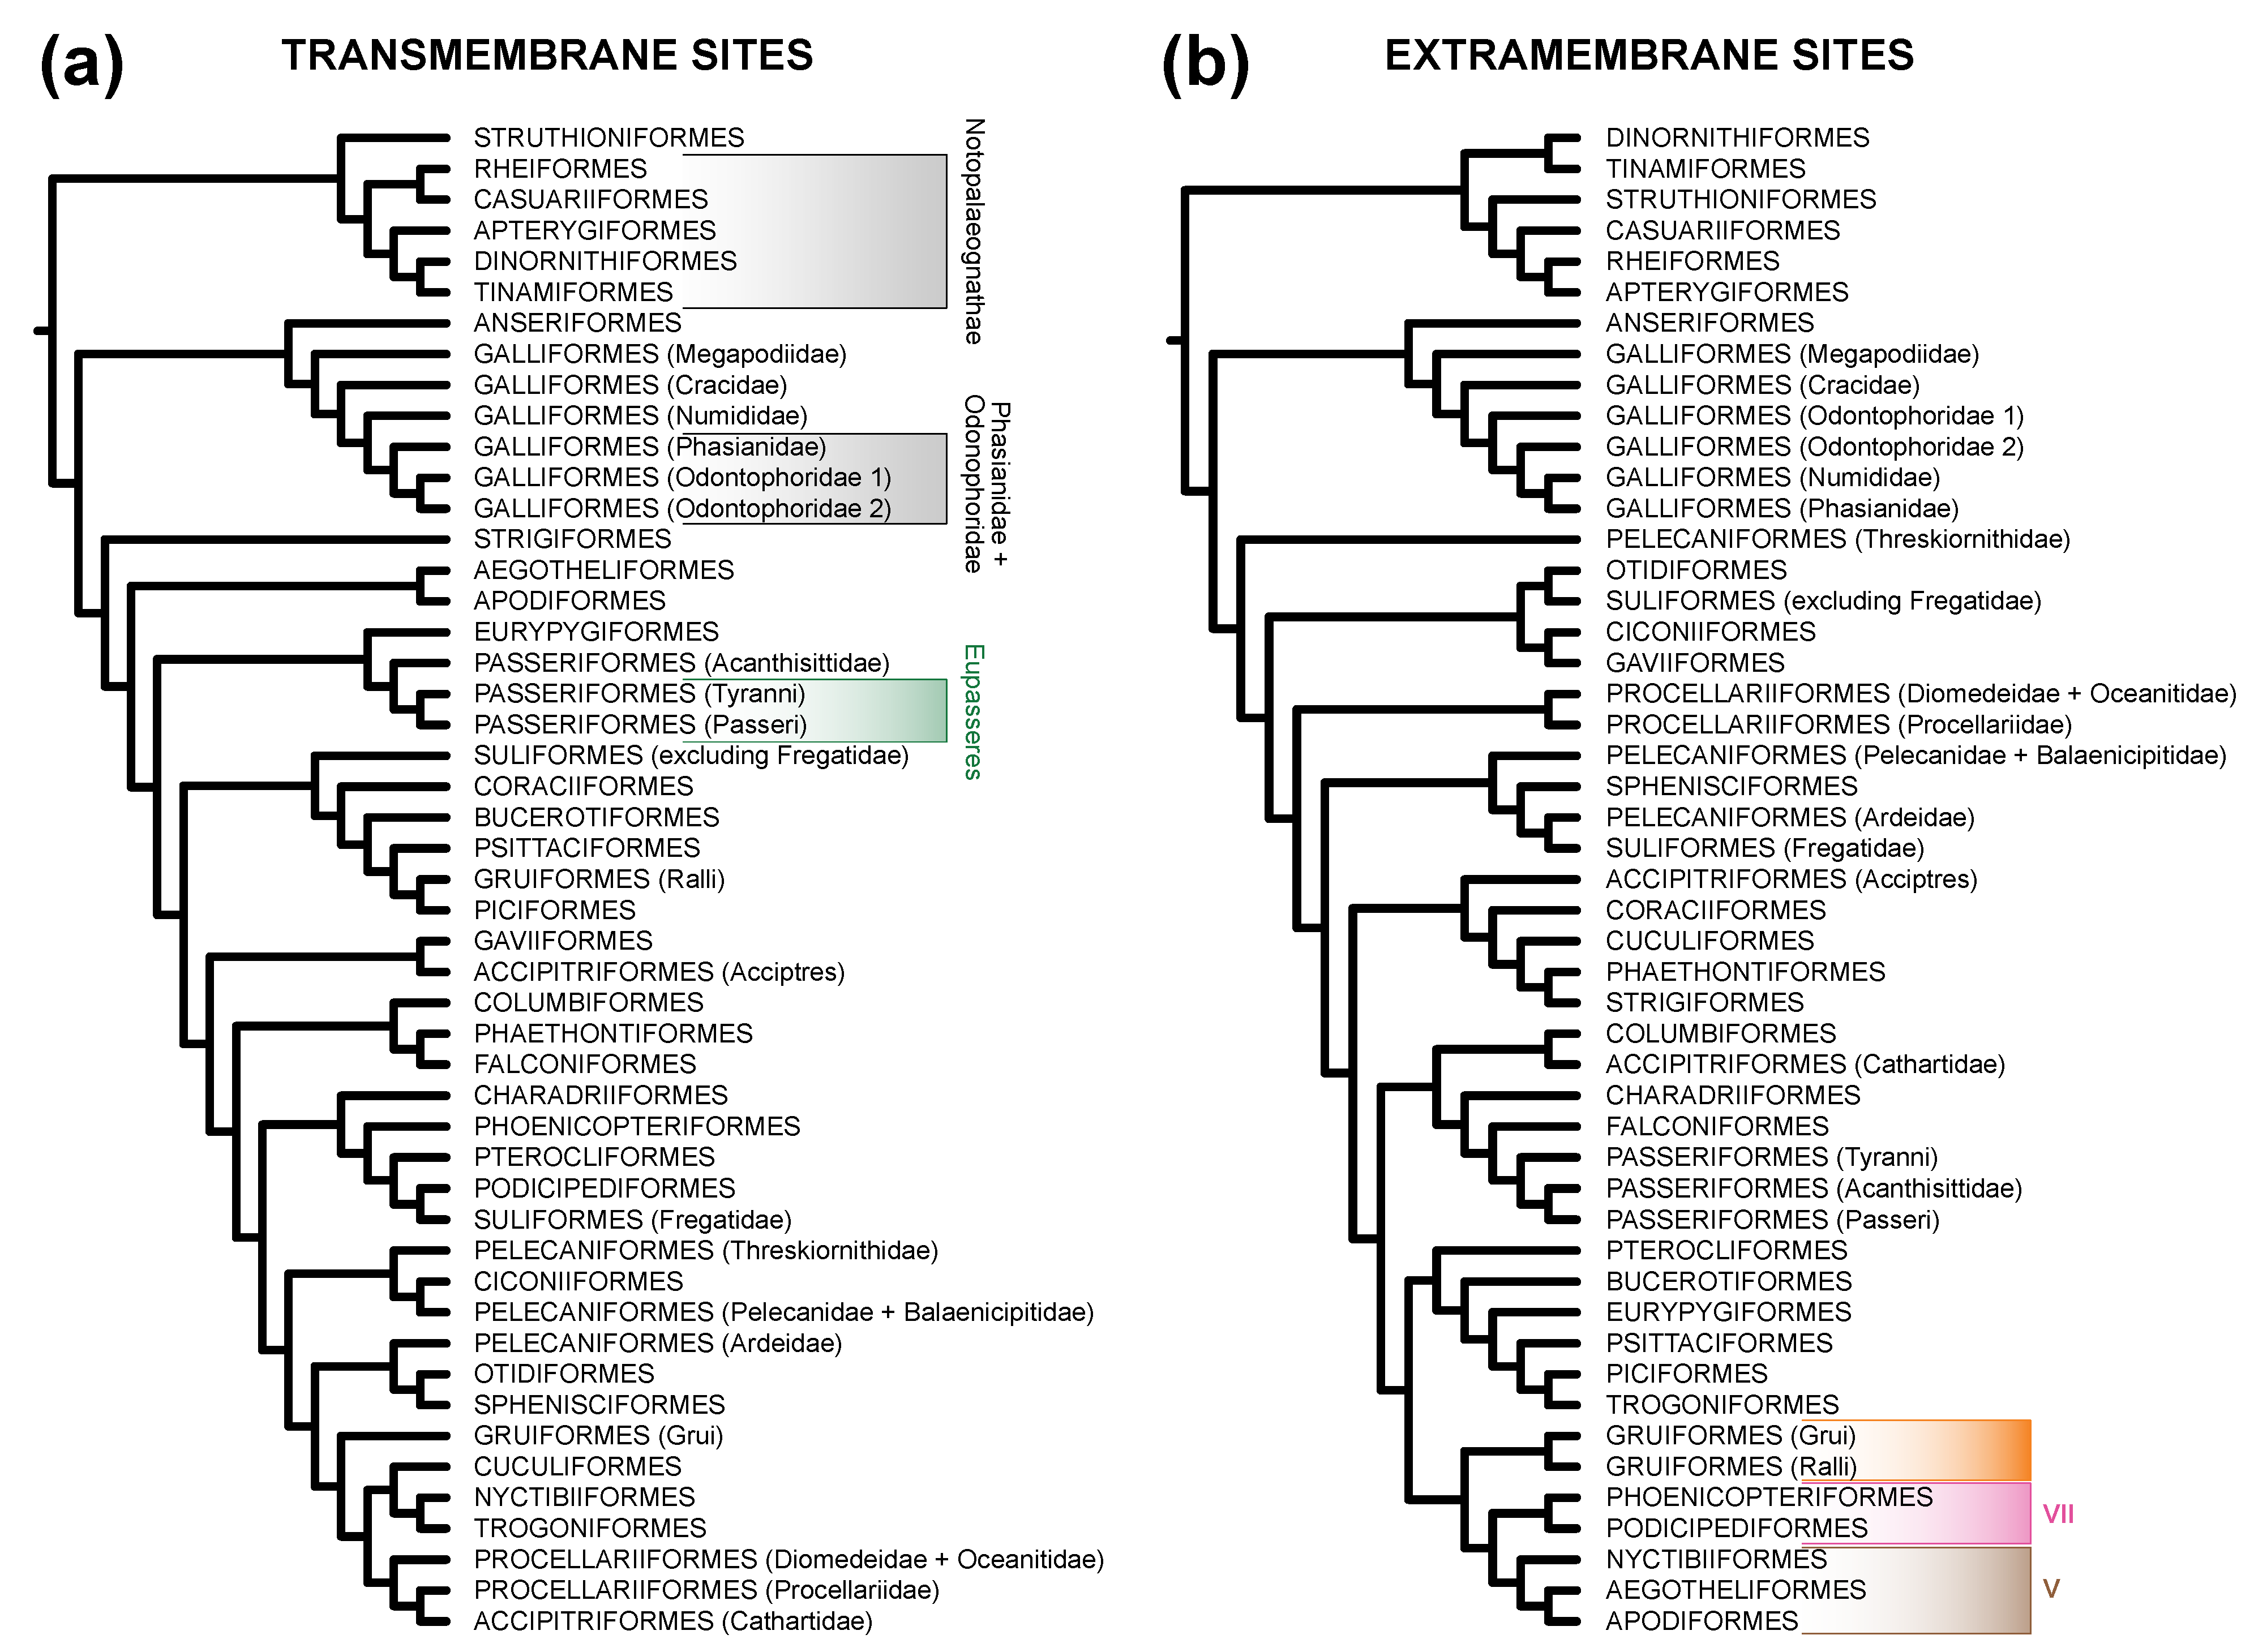
3.2. TM Helix and ExM Loops Tree Topologies: Stochastic Error, Not Data Type Effects

ML analyses of amino acid alignments of both data types yielded trees with similar treelengths but a large number of differences for the relationships among orders (Figure 4). The TM tree and the ExM tree both exhibited substantial conflict with the best available estimates of the bird tree (Figure 1). Although this is consistent with the results of published broadly sampled mitogenomic trees of birds [62,78], it emphasized the fact that the additional taxon sampling in this study did not result in increased support.
In contrast to our second prediction, neither data type appeared to perform substantially better based on the “known clade” criterion. Analysis of TM sites recovered Notopalaeognathae, Phasianidae + Odontophoridae, and Eupasseres whereas analysis of ExM sites recovered monophyly of the order Gruiformes and two magnificent seven clades: V (Strisores [55]) and VII (Mirandornithes [79]). Although there were cases where analyses of both data types yielded 100% support for specific clades, support for orders and other strongly corroborated clades was often surprisingly low (Table 1). Conducting a combined analysis of all sites often increased support relative to analyses of the individual data types, as expected if the primary reason for differences between the analyses of TM and ExM sites was increased stochastic error due to the smaller size of the data subsets. When there were conflicts between the analyses of the TM and ExM site, the combined analyses did not appear to agree with one subset more than the other (Table 1). Results were similar when analyses were conducted using the mtVer model (Supplementary File S3), although the fit of this model was not as good as the fit of the GTR20 + I + Γ model (see above, Section 3.1).
There are two clades that could reflect data type effects based on the support values in Table 1: Notopalaeognathae and the Odontophoridae + Phasianidae clade. In both cases, there is conflict between the TM and ExM trees and support is higher in the TM tree than it is in the all-sites tree. This suggests that the topological signal in each data type actually conflicts. This pattern contrasts with Mirandornithes and Strisores; both of those clades are present in the ExM tree and absent in the TM tree but the all-sites tree had substantially higher support than the ExM tree. This suggests that there is hidden support [81,82] for both Mirandornithes and Strisores in the TM data). In all of the cases we highlighted, the TM tree includes a signal congruent with the likely topology (albeit mixed in the case of Mirandornithes and Strisores) of the true mitogenomic tree. This suggests that ExM sites might perform slightly worse than TM sites, which is the opposite of our prediction.
Our third prediction was that phylogenetic analyses of TM and ExM sites will yield significantly different tree topologies. It is possible to exclude the existence of strongly misleading data type effects because we did not recover strong support for any backbone relationships (Table 1 and Supplementary File S3). Despite the obvious differences between the tree topologies we recovered (Figure 4), the low support along the backbone and for many orders (Table 1 and Supplementary File S3) led us to postulate that the topological differences simply reflect the stochastic error associated with dividing the complete mitochondrial protein alignment into smaller sub-alignments for the TM and ExM sites. We calculated topological distances for the 100 randomly subdivided datasets used above. Unlike the case for model distances, the topological distance between the TM and ExM trees fell within the null distribution (Figure 5), with analyses of nine of the 100 randomly subdivided dataset pairs yielding trees with higher matching distances. Although we acknowledge that the topological distance between the TM and ExM trees fell at the upper end of the null distribution and that much of the topological similarity between the TM and ExM trees appears to reflect nodes closer to the tips (284 out of 417 possible internal branches were present in a strict consensus of the TM and ExM trees), we believe that these results are best interpreted as evidence for strong stochastic error due to the reduced size of the TM and ExM data matrices. Thus, we were unable to corroborate our third prediction (that topological distances between trees estimated using TM versus ExM sites would be greater than expected by chance.

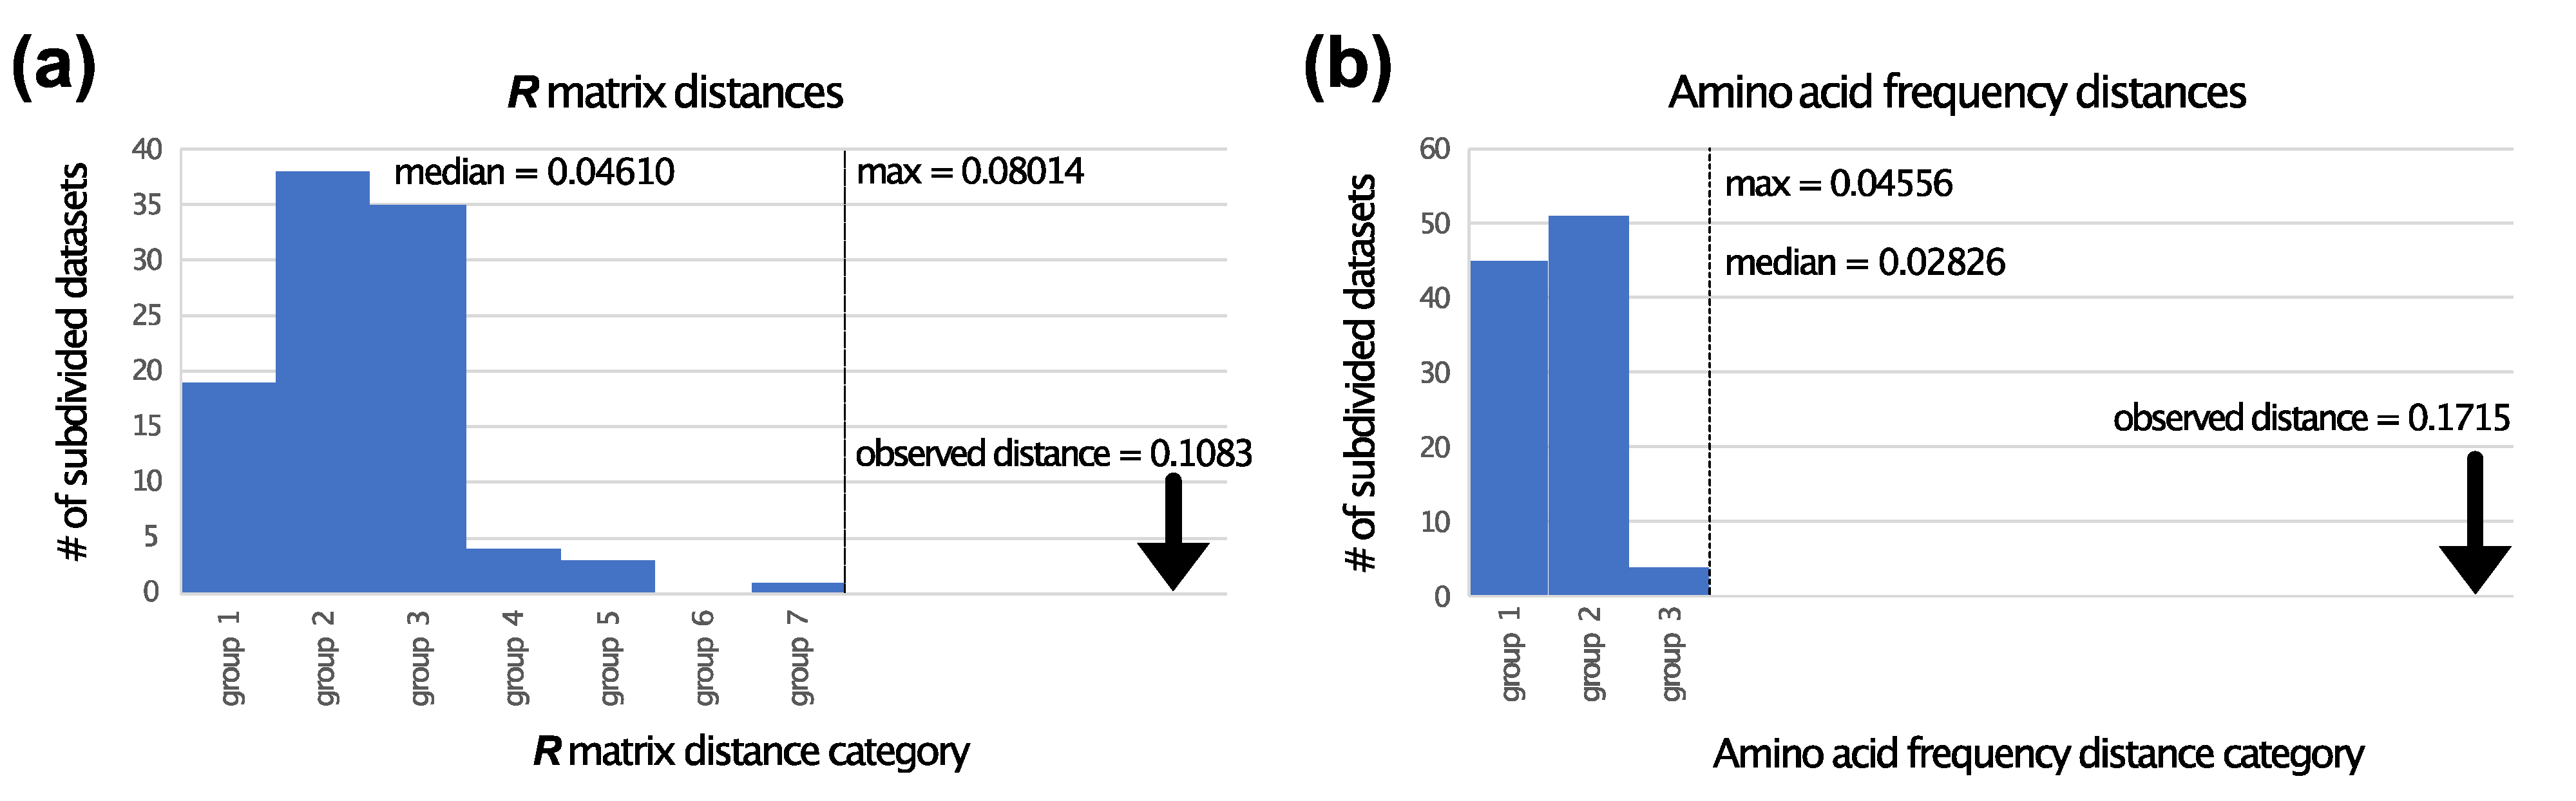
3.3. Is There Evidence for Heterogeneity within TM and ExM Sites?

One type of model misspecification might be the assumption of homogeneity within each data type implicit in our analyses. If the bird mtTM and bird mtExM matrices are good approximating models for each data type we would expect them to exhibit a better fit to the vast majority of sites within the appropriate data type (i.e., bird mtTM would fit TM sites better than bird mtExM and vice versa). It is straightforward to test this by fitting a two-component mixture model, with one component corresponding to bird mtTM R matrix and the second component corresponding to bird mtExM R matrix. Since there are clear differences between the models for TM and ExM sites (Figure 2 and Figure 3) we expect the mixture model that combines bird mtTM and bird mtExM, which we call bird mtMIX, to fit the data better than a single matrix. This is precisely what we found (ΔBIC for bird mtMIX relative to all-sites GTR20 + I + Γ = 5045.4351).
It is possible to make two predictions about the behavior of the bird mtMIX model if the patterns of sequence evolution for TM and ExM sites differ between data types but are relatively homogeneous within each data type: 1) estimates of the mixture weights for each component will be close to the proportions of sites in each data type; and 2) the contributions of each mixture component to each site likelihood are expected to differ for the two data types and be largely non-overlapping (see Pagel and Meade [83] for an illustration of the second prediction). This is not what we found (Table 2 and Supplementary File S5); the ML estimate of the mixture weight for the bird mtTM model component was higher than the proportion of TM sites and the weight of the bird mtExM mixture component was lower than the proportion of ExM sites. The contributions of each mixture component to the site likelihoods (the lnL difference in Table 2) are in broad agreement with our second prediction. The median contribution of the bird mtTM mixture component to the likelihoods of TM sites was higher than the median contribution of the bird mtTM mixture component to ExM sites. However, there was a wider range of contributions of each model component to the site likelihoods than we expected. The bird mtTM mixture component made a surprisingly large contribution to the likelihood of many ExM sites. In fact, the median contribution of the bird mtTM mixture component was very close to zero, indicating that the bird mtTM mixture component actually makes the larger contribution to the likelihood of half of the ExM sites. Overall, these results indicate that the patterns of sequence evolution in heavy strand-encoded mitochondrial proteins is more complex than one might predict based on the straightforward assumption that sites have evolved under two models, one for TM sites and one for ExM sites.
Estimates of phylogeny generated using partitioned analysis and mixture models were generally similar to the unpartitioned tree (Table 3). Unsurprisingly, both the partitioned analysis and use of the bird mtMIX model resulted in a better fit to the complete data matrix than the GTR20 + I + Γ model with parameters estimated using all sites (ΔBIC for partitioned analysis = 2480.0035; ΔBIC for bird mtMIX = 5045.4351). A strict consensus of the unpartitioned and partitioned trees had 377 resolved branches (90.4% of the potential branches) and a strict consensus of the unpartitioned and bird mtMIX tree had 383 resolved branches (91.8% of the potential branches). Support for various clades in the partitioned and bird mtMIX trees was generally similar to support in the unpartitioned all-sites tree (compare the values in Table 3 to the all-sites column in Table 1). Both partitioned analysis and use of the mixture model had an impact on branch length estimates; relative to tree resulting from the all-sites unpartitioned analysis, the bird mtMIX treelength was 1.148 and the partitioned analysis treelength was 1.235. The ratio of the sum of the internal branch lengths to the total treelength was virtually identical across analyses (31.98% for the bird mtMIX model, 32.019% for partitioned analysis, and 32.03% for the unpartitioned analysis). However, it will be necessary to conduct simulations to understand whether the branch length estimates based on analyses using mtMIX or partitioned analyses are closer to the true branch lengths.

3.4. Protein Structure Has an Impact on Analyses of Nucleotide and Purine-Pyrimidine Data

Arguably, mitochondrial sequence data have the greatest potential as sources of information for biodiversity studies near the tips of the vertebrate tree of life [84,85,86]. Thus, it would be desirable to assess the impact of protein structure on analyses of nucleotide data. For our partitioned analyses of the TM and ExM codons (three partitions, one for each codon position), the TM and ExM nucleotide trees exhibit a number of differences from the trees based on amino acid data (Table 4 and Supplementary File S3). We did not observe a simple pattern of either increased or decreased congruence with the likely species tree.
The six-partition analysis of all sites (partitioning by structure and codon position) improved the fit to the data (ΔBIC favoring the six-partition analysis = 1811.5226) relative to three partitions (partitioning by codon position alone). The six-partition tree exhibited a number of differences from the trees based on separate analyses of TM and ExM sites and the three partition all-sites tree. The most notable difference between the three partition and six partition trees was the non-monophyly of Charadriiformes and Gruiformes in the former and the strongly supported monophyly of those orders in the six-partition analysis (Table 4). That result was surprising because separate nucleotide analysis of TM and ExM data yielded trees with monophyly of Charadriiformes and Gruiformes. The estimated nucleotide frequencies for TM sites and ExM sites were very different (Table 5), suggesting that the three-partition analysis resulted in model misspecification that, based on the topological results, had a meaningful impact on phylogenetic estimation.
Recoding nucleotide data as two states (purines and pyrimidines; typically called RY-coding) has been used in a number of studies, especially those using mitochondrial data. In fact, RY-coding has resulted in very clear improvements to estimates of avian phylogeny when limited taxon samples are used [43]. When we used RY-coding for the four analyses conducted using nucleotide data (Table 6), we did observe several differences. One notable shift relative to four-state data was the support in Notopalaegnathae in the TM sites; however, other analyses (ExM sites, all sites/three partitions, and all sites/six partitions) all placed Rheiformes sister to other Palaeognathae, similar to some of the nucleotide analyses. Although this shift represented greater congruence with the species tree, we noticed that analyses of TM sites after RY-coding also resulted in the loss of Strigiformes monophyly (Table 6). This was surprising given the high support for Strigiformes in other analyses (Table 1, Table 3, Table 4, and Table 6). Similar to the analyses using nucleotide data, the six-partition model had a better fit to the data than the three-partition model (ΔBIC favoring the six-partition RY analysis = 303.0233). This is likely to represent the fact that the hydrophobic amino acids I, L, M, F, and V, which are enriched in the TM helices (Figure 3), have codons with T in their second position. These results emphasize that researchers should consider protein structure when conducting analyses of mitochondrial nucleotide sequences, regardless of whether or not they employed RY-coding.

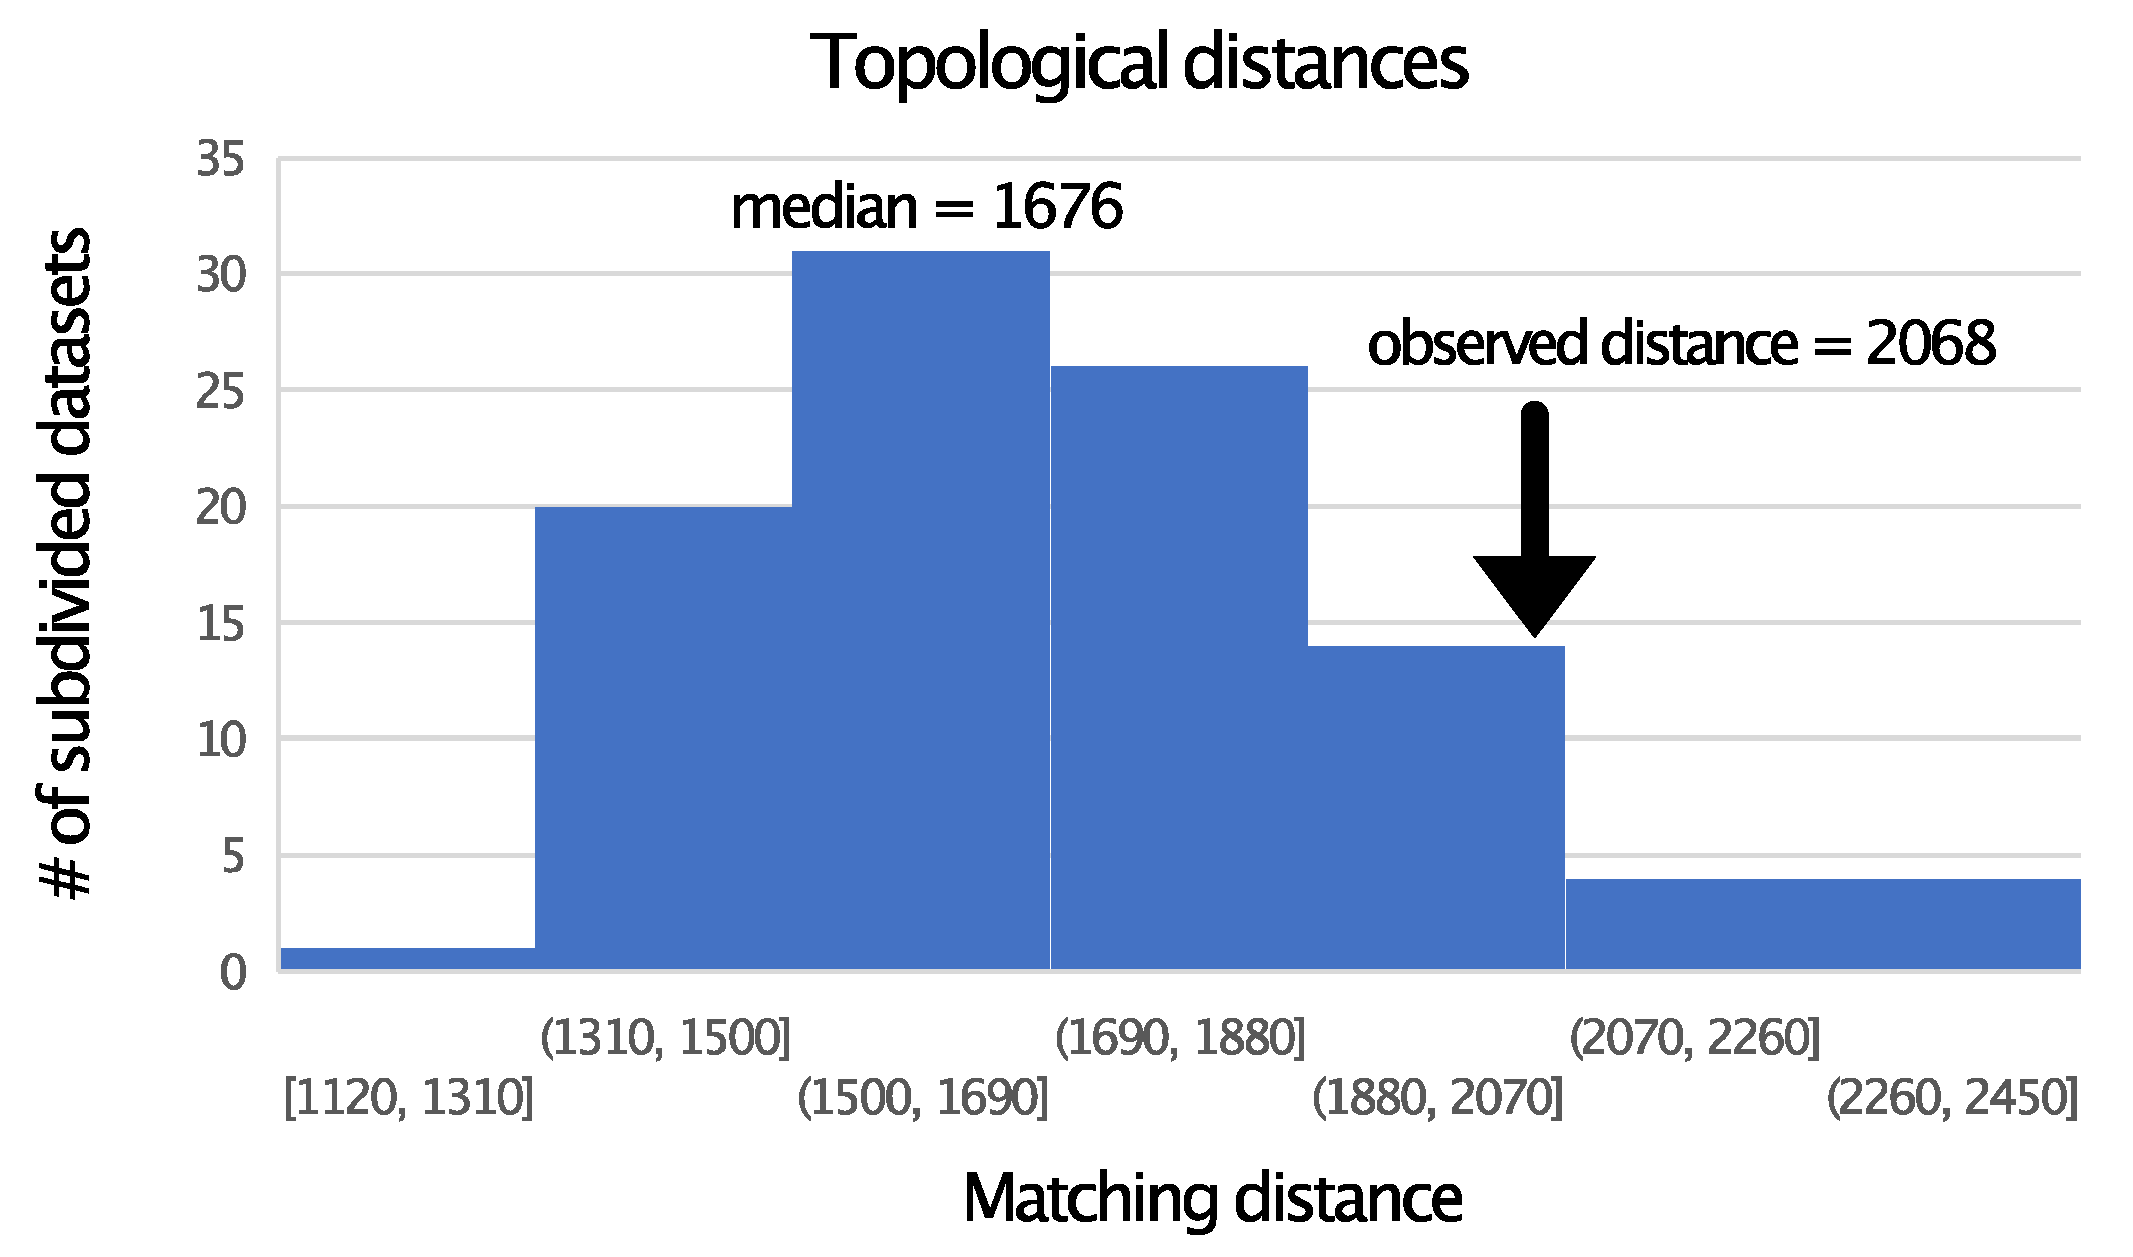
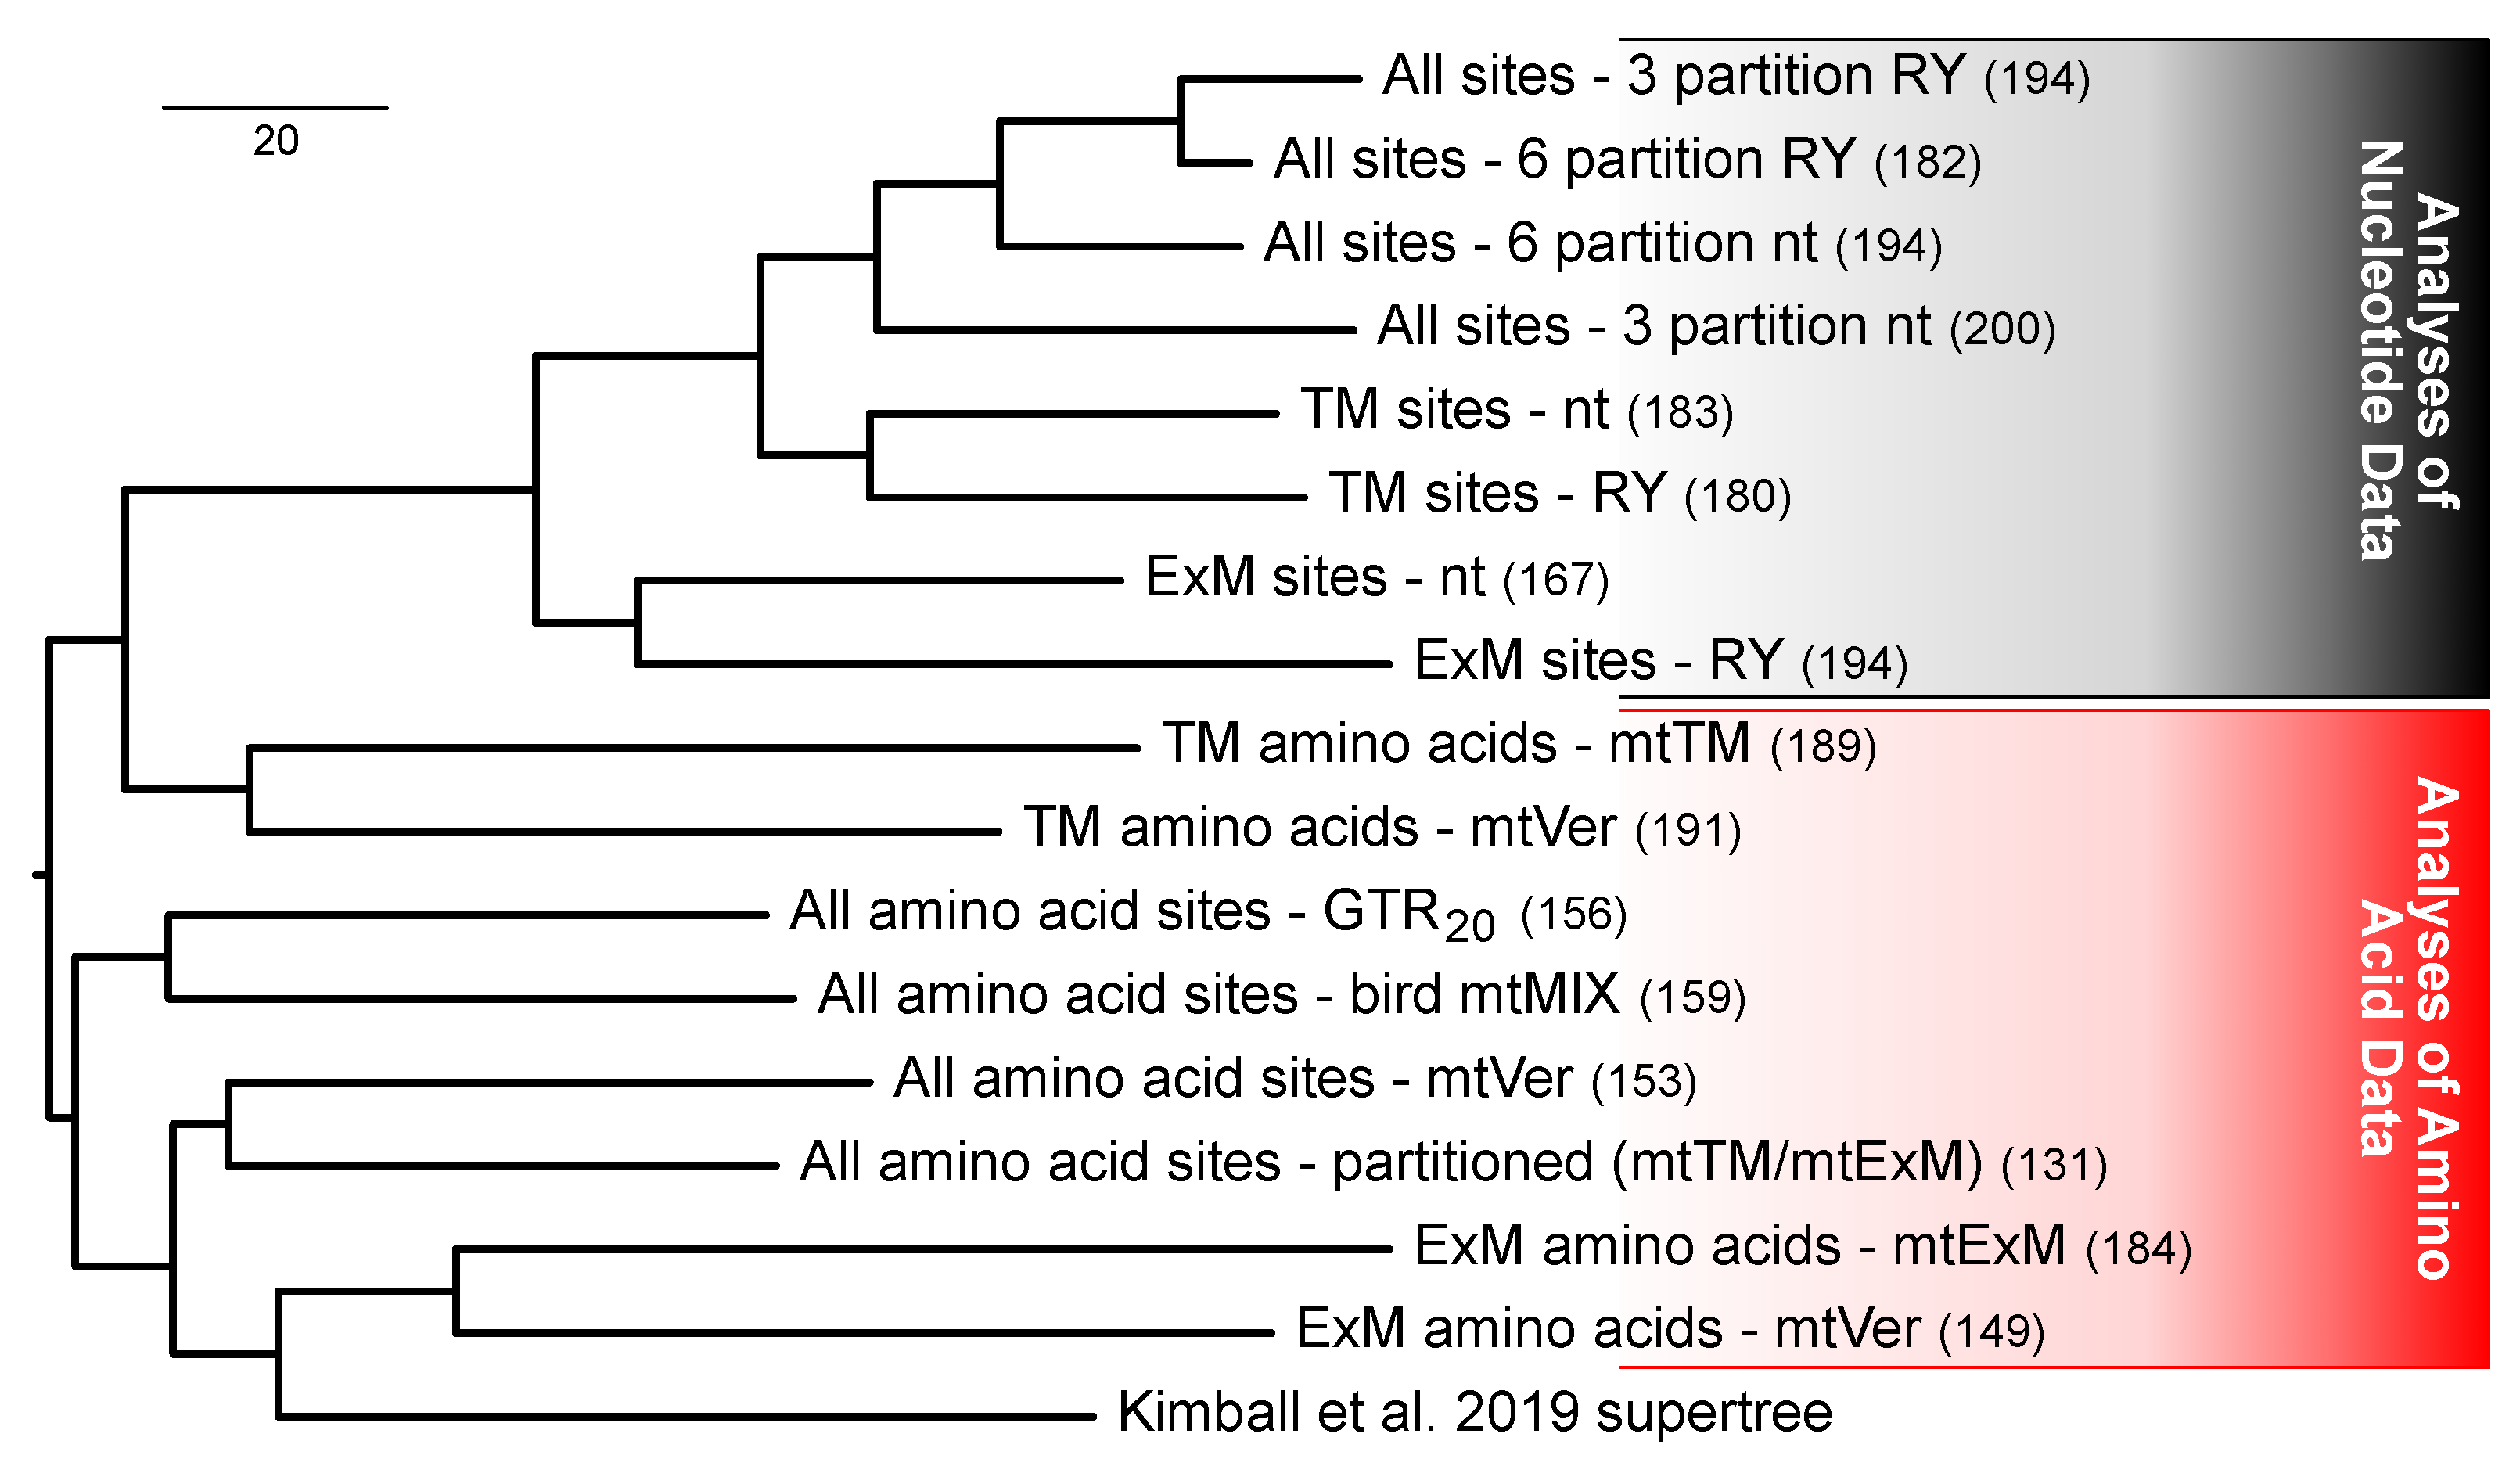
3.5. Multiple Factors Shape the Tree Space for Analyses of Mitochondrial Proteins

We assessed the topological distances among our estimates of the mitogenomic tree for birds and between those trees and the likely species tree (represented by the Kimball et al. [52] supertree). It was necessary to reduce the taxon sample to compare our mitogenomic trees to the Kimball supertree. This limited the comparisons major clades, although we did capture all of the topological variation highlighted in the tables along with all relationships among orders. The matching distances between the mitogenomic trees and the Kimball supertree ranged from 131 to 200 (Figure 5), much lower than expected for matches among random trees (the median matching distances for a sample of 1000 random trees was 428; 95% of comparisons fell in the range of 369–496). Thus, the topological distances between the Kimball supertree and the mitogenomic trees was between 31% and 47% of the expected distance for pairs of random trees. The ExM amino acid data clustered with the Kimball supertree, but the distance to the TM amino acid trees was only slightly higher in absolute terms (Figure 6 and Supplementary File S4). The nucleotide trees clustered in tree space and the trees estimated using the same datasets (TM, ExM, and all sites) clustered regardless of whether they were two-state (RY) or four-state (unaltered nucleotide data) trees. The most striking pattern was the large distances among all estimates of the mitogenomic tree and between estimates of the mitogenomic tree and the Kimball supertree.

4. Discussion

We addressed three hypotheses related to the potential relationship between the structure of mitochondrially-encoded proteins and the behavior of phylogenetic analyses, using a dataset comprising all 12 heavy strand-encoded proteins from 420 bird species. First, we corroborated our hypothesis that the relative exchangeabilities and equilibrium frequencies of amino acids would differ between TM and ExM environments. We also found evidence that the bird mtTM model exhibited similarities to a general model of TM helix evolution (JTTtm). Moreover, the observed similarities between the bird mtTM and JTTtm models conformed to our expectations based on the analyses of buried versus solvent-exposed residues in globular proteins [31]. We did not corroborate our second hypothesis, that phylogenetic analyses of ExM loops would exhibit better performance in terms of topological estimation than analyses of TM helices (based on the NB observations). We found that some a priori expected clades emerged only in analyses of ExM sites and that others emerged only in analyses of TM sites. The overall support for many clades was also quite low. Third, we hypothesized that distinct topological signals would emerge in phylogenetic analyses of each data type. Although the trees based on each data type differed (Figure 4), it seems reasonable to postulate that stochastic error can explain the observed incongruence between the data types. The broad distribution of topological distances in the data subdivision test (Figure 5) suggests that stochastic error played a large role in shaping the differences among trees. Overall, we concluded that the best models for TM and ExM sites were very different but found little or no evidence for topological data type effects in the mitochondrially-encoded proteins of birds.

4.1. Data Type Effects and Process Partitions

It has long been appreciated that patterns of evolution are heterogeneous, with distinct subsets of the genome and suites of morphological characters having the potential to exhibit different patterns of evolution. Bull et al. [11] defined process partitions as subsets of characters in a larger phylogenetic data matrix that evolved according to rules that differ from the other subset(s) in some demonstrable way. They provided a number of examples, such as (1) codon positions; (2) coding versus non-coding regions; (3) different genes and different regions within genes (including regions defined by the three-dimensional protein structure); (4) stems versus loops in ribosomal RNAs; and (5) nuclear versus organellar genes. As described in the introduction, the data type effects idea modifies this in two ways. The first is that data type effects exclude cases where discordance among gene trees can provide a simple explanation for any observed incongruence. Reddy et al. [10] explicitly excluded sex chromosome versus autosome comparisons from data type effects because different gene tree spectra are expected in such a comparison. Thus, it would certainly be inappropriate to view differences between a tree based on analyses of multiple nuclear loci and a tree based on a large non-recombining region such as the avian mitogenome [87,88] as a data type effect. On the other hand, it is reasonable to describe incongruence among estimates of phylogeny obtained using different subsets of sites in organelle genomes (or sex chromosomes) as data type effects.
The second criterion for data type effects is that multiple independent samples of each data type converge on trees in similar parts of tree space. It difficult to test this criterion in the same way as Reddy et al. [10] given the size of vertebrate mitogenomes, although observing similar topologies in jackknifed subsets of the TM and ExM sites would corroborate the hypothesis that different signals are associated with TM versus ExM sites. However, a prerequisite for such a test would be finding that the trees estimated using the TM and ExM sites are different enough to define two distinct parts of tree space. For that to be true the distance between the TM and ExM trees should exceed the expected distances between pairs of trees estimated using random subsets of the complete data matrix identical in size to the TM and ExM subsets; we did not meet that criterion.
A similar criterion can be used to judge distances between models, although such a test might not appear to yield information beyond the information available from standard model selection criteria such as the BIC. However, a random subdivision test might have an advantage relative to criteria such as the BIC for protein models. Most models of protein sequence evolution, such as the Dayhoff/PAM [89], JTT [90], LG [91], and mtVer [69] models, are fixed R matrices estimated based large training dataset, so they have no free R matrix parameters. In contrast, the GTR20 model is very parameter-rich (it has 189 free R matrix parameters). However, many R matrix parameters are highly constrained (e.g., amino acid substitutions that require multiple nucleotide changes will have R matrix parameters equal to or close to zero). However, fixing those parameters at a value of zero is not a good solution; Kosiol et al. [92] and Pandey and Braun [31] used very different analytical frameworks but both showed that some amino acid substitutions that require multiple nucleotide changes are associated with values much larger than zero. Thus, when faced with the question of whether a potentially heterogeneous protein dataset is best described by a single R matrix or multiple R matrices, one may find conditions where optimizing all GTR20 model parameters, including those constrained to be close to zero, cannot be justified using the BIC. However, a few important parameters might have very different values; dataset subdivision provides a simple method to determine whether this is the case. In this study, both the BIC and random subdivision corroborated the hypothesis that the best models for TM and ExM sites were significantly different whereas random subdivision revealed that topological data type effects are either very weak or non-existent.

4.2. Models of Transmembrane Protein Evolution and the NB Hypothesis

The new models of mitochondrial protein evolution we developed exhibit patterns consistent with the “rule of opposites,” described by Pandey and Braun [31] for buried versus solvent-exposed residues in globular proteins. The rule of opposites is a statement that the most exchangeable amino acids in a specific structural environment are the less common amino acids in that environment. In this study, polar–polar exchanges were associated with the most elevated relative exchangeabilities in both of our new TM models (bird mtTM and JTTtm) and hydrophobic-hydrophobic exchangeabilities were the most elevated in mtExM. The rule of opposites applies to relative exchangeabilities (R matrix parameters) and not to instantaneous rates (Q matrix parameters). Therefore, the rule of opposites could reflect, at least in part, the time reversibility constraint. Pairs of rare amino acids require large exchangeabilities to explain even modest instantaneous rates of change between those amino acids. Pandey and Braun [31] proposed two mutually-exclusive verbal models regarding protein evolution relevant to the rule of opposites: (1) amino acids that are rare in a specific environment would not be exchangeable because they are necessary for specific functions; and (2) exchanges between pairs of amino acids that are rare in a specific environment are actually common (relative to their frequency) as long as the physicochemical nature of the amino acid is conserved. If the first model was correct it is necessary to invoke the high variance of R matrix parameters for pairs of low frequency amino acids. However, the first hypothesis also predicts that models based on some training datasets would not show evidence of the rule of opposites, at least for some exchangeabilities. Pandey and Braun [31] argued that their results for globular proteins, where they estimated parameters from seven different training datasets, favored the second model. This study shows that a similar pattern emerges in the bird mtTM model and in the more general JTTtm models, further corroborating the second verbal model.
Although we were able to improve the fit of evolutionary models to mitochondrially-encoded proteins by considering TM and ExM sites separately, we interpret the results of the mixture model analyses as evidence that there is substantial heterogeneity within each data type. All of the mitochondrially-encoded proteins of vertebrates are subunits within large multiprotein complexes that include nuclear-encoded, mitochondrially-localized proteins. This could cause some sites in the ExM loops to evolve under rules similar to those for buried sites in globular proteins, reflecting their contacts with other subunits. Since buried sites in globular proteins are enriched for hydrophobic amino acids [17,93] the existence of these sites could explain both the elevated estimate of the mtTM component mixture weight and the large contribution of the bird mtTM mixture component to the site likelihoods for some ExM sites (Table 2). Regardless, that heterogeneity suggests further improvements to models of sequence evolution have the potential to be useful, both for efforts to understand patterns of molecular evolution and for improving estimates of phylogenetic trees.
The topological distances between our estimates of the avian mitogenomic tree and the likely species tree (represented by the Kimball supertree; see Figure 6) were very high, ranging from 31% to 47% of the expected distance between pairs of random trees. The largest distance among estimated mitochondrial trees was even higher (the distance between the ExM amino acid tree and the three-partition RY tree for all sites was 250, 58% of the median distance between pairs of random trees). The simplest interpretation of these results is that they further emphasize the role of stochastic error in our estimates of the mitogenomic tree of birds. The clustering of nucleotide trees in tree space is likely due to the influence of information from synonymous substitutions on topology. The observation that there were three clusters (TM, ExM, and all sites) within the nucleotide trees suggests that deviations from stationarity in base composition did not lead to a strong topological signal. The hypothesis that the shifts base composition led to a strong topological signal would predict two clusters, one for four state data and one for two state6, because RY-coding reduces deviations from stationarity [45,94,95] under most conditions. Although we believe that our “tree-of-trees” is useful, we emphasize that it is simply a tool to reduce high-dimensional data (topological distances among trees) to facilitate visualization. Thus, the clustering of the ExM trees with the Kimball supertree in the dendrogram should not be overinterpreted. Although it could indicate that analyses of ExM sites perform better than those of TM sites (which would be consistent with the prediction based on NB), the long terminal branches provide evidence that any such effect is weak. Overall, the structure of the tree-of-trees supports two conclusions: (1) analyses of all datasets are very sensitive to the details of analytical methods (compare the distances between trees estimated using mtVer versus the optimized mtTM and mtExM models in Figure 6); and (2) stochastic error plays a large role in our estimates of the mitogenomic tree.
Using non-historical topological signals to study molecular evolution has one potential advantage over methods that focus on parameter estimation (e.g., the rate matrices in this study). If we assume model misspecification leads to non-historical signals, then it becomes possible to identify sites with a poor fit to the model used for the analysis finding sites associated with the unexpected topological signal. It is challenging to identify sites with poor fit to a model of sequence evolution in absolute (rather than relative) terms [96,97], making approaches that are able to highlight sites characterized by model violations useful. This was our goal when we searched for a topological data type effect associated with structural environments in mitochondrially-encoded proteins.
There are also challenges associated with using non-historical topological signals to study molecular evolution. First, there is always some uncertainty in empirical phylogenies, making it difficult to identify the true historical signal. Discordance among gene trees further complicates this issue because a tree that conflicts with a “known” species tree can also be explained by gene tree–species tree discordance. Second, the best method to reveal non-historical signals is unclear. NB used the MP criterion, a computationally efficient method [98] with a simple biological interpretation (MP treelength is the minimum number of changes for a character given a specific tree topology). However, the model implicit in MP has troubling mathematical properties when it is used with molecular data; (Holder et al. [99] describes the problems associated with branch lengths in MP-equivalent models). This motivated us to use a standard ML framework. Third, misleading signals, such as those identified by NB, might emerge only at certain depths in the tree of life. Our taxon sampling largely limited our topological assessments to clades that diversified in the lower Paleogene or upper Cretaceous (see Field et al. [100]); biases that might appear at other depths in the tree would not be detectable. Finally, substitutions responsible for misleading signals accumulate in a stochastic manner, just like substitutions responsible for historical signals. Even if one knew that a specific tree topology and evolutionary model is misleading in expectation (given a specific analytical method), analysis of a finite sample of sites generated under that model might not show evidence of the misleading topological signal (Kim [101] presents an example of a topology + model that exhibits this behavior in Figure 13 of that publication). However, that scenario would be expected to yield a dataset with very weak non-historical signals. Since it is impossible to distinguish a weak misleading signal from simple stochastic error, this could be the case for the avian mitogenomic tree, although that scenario requires more assumptions than a scenario involving stochastic error alone.

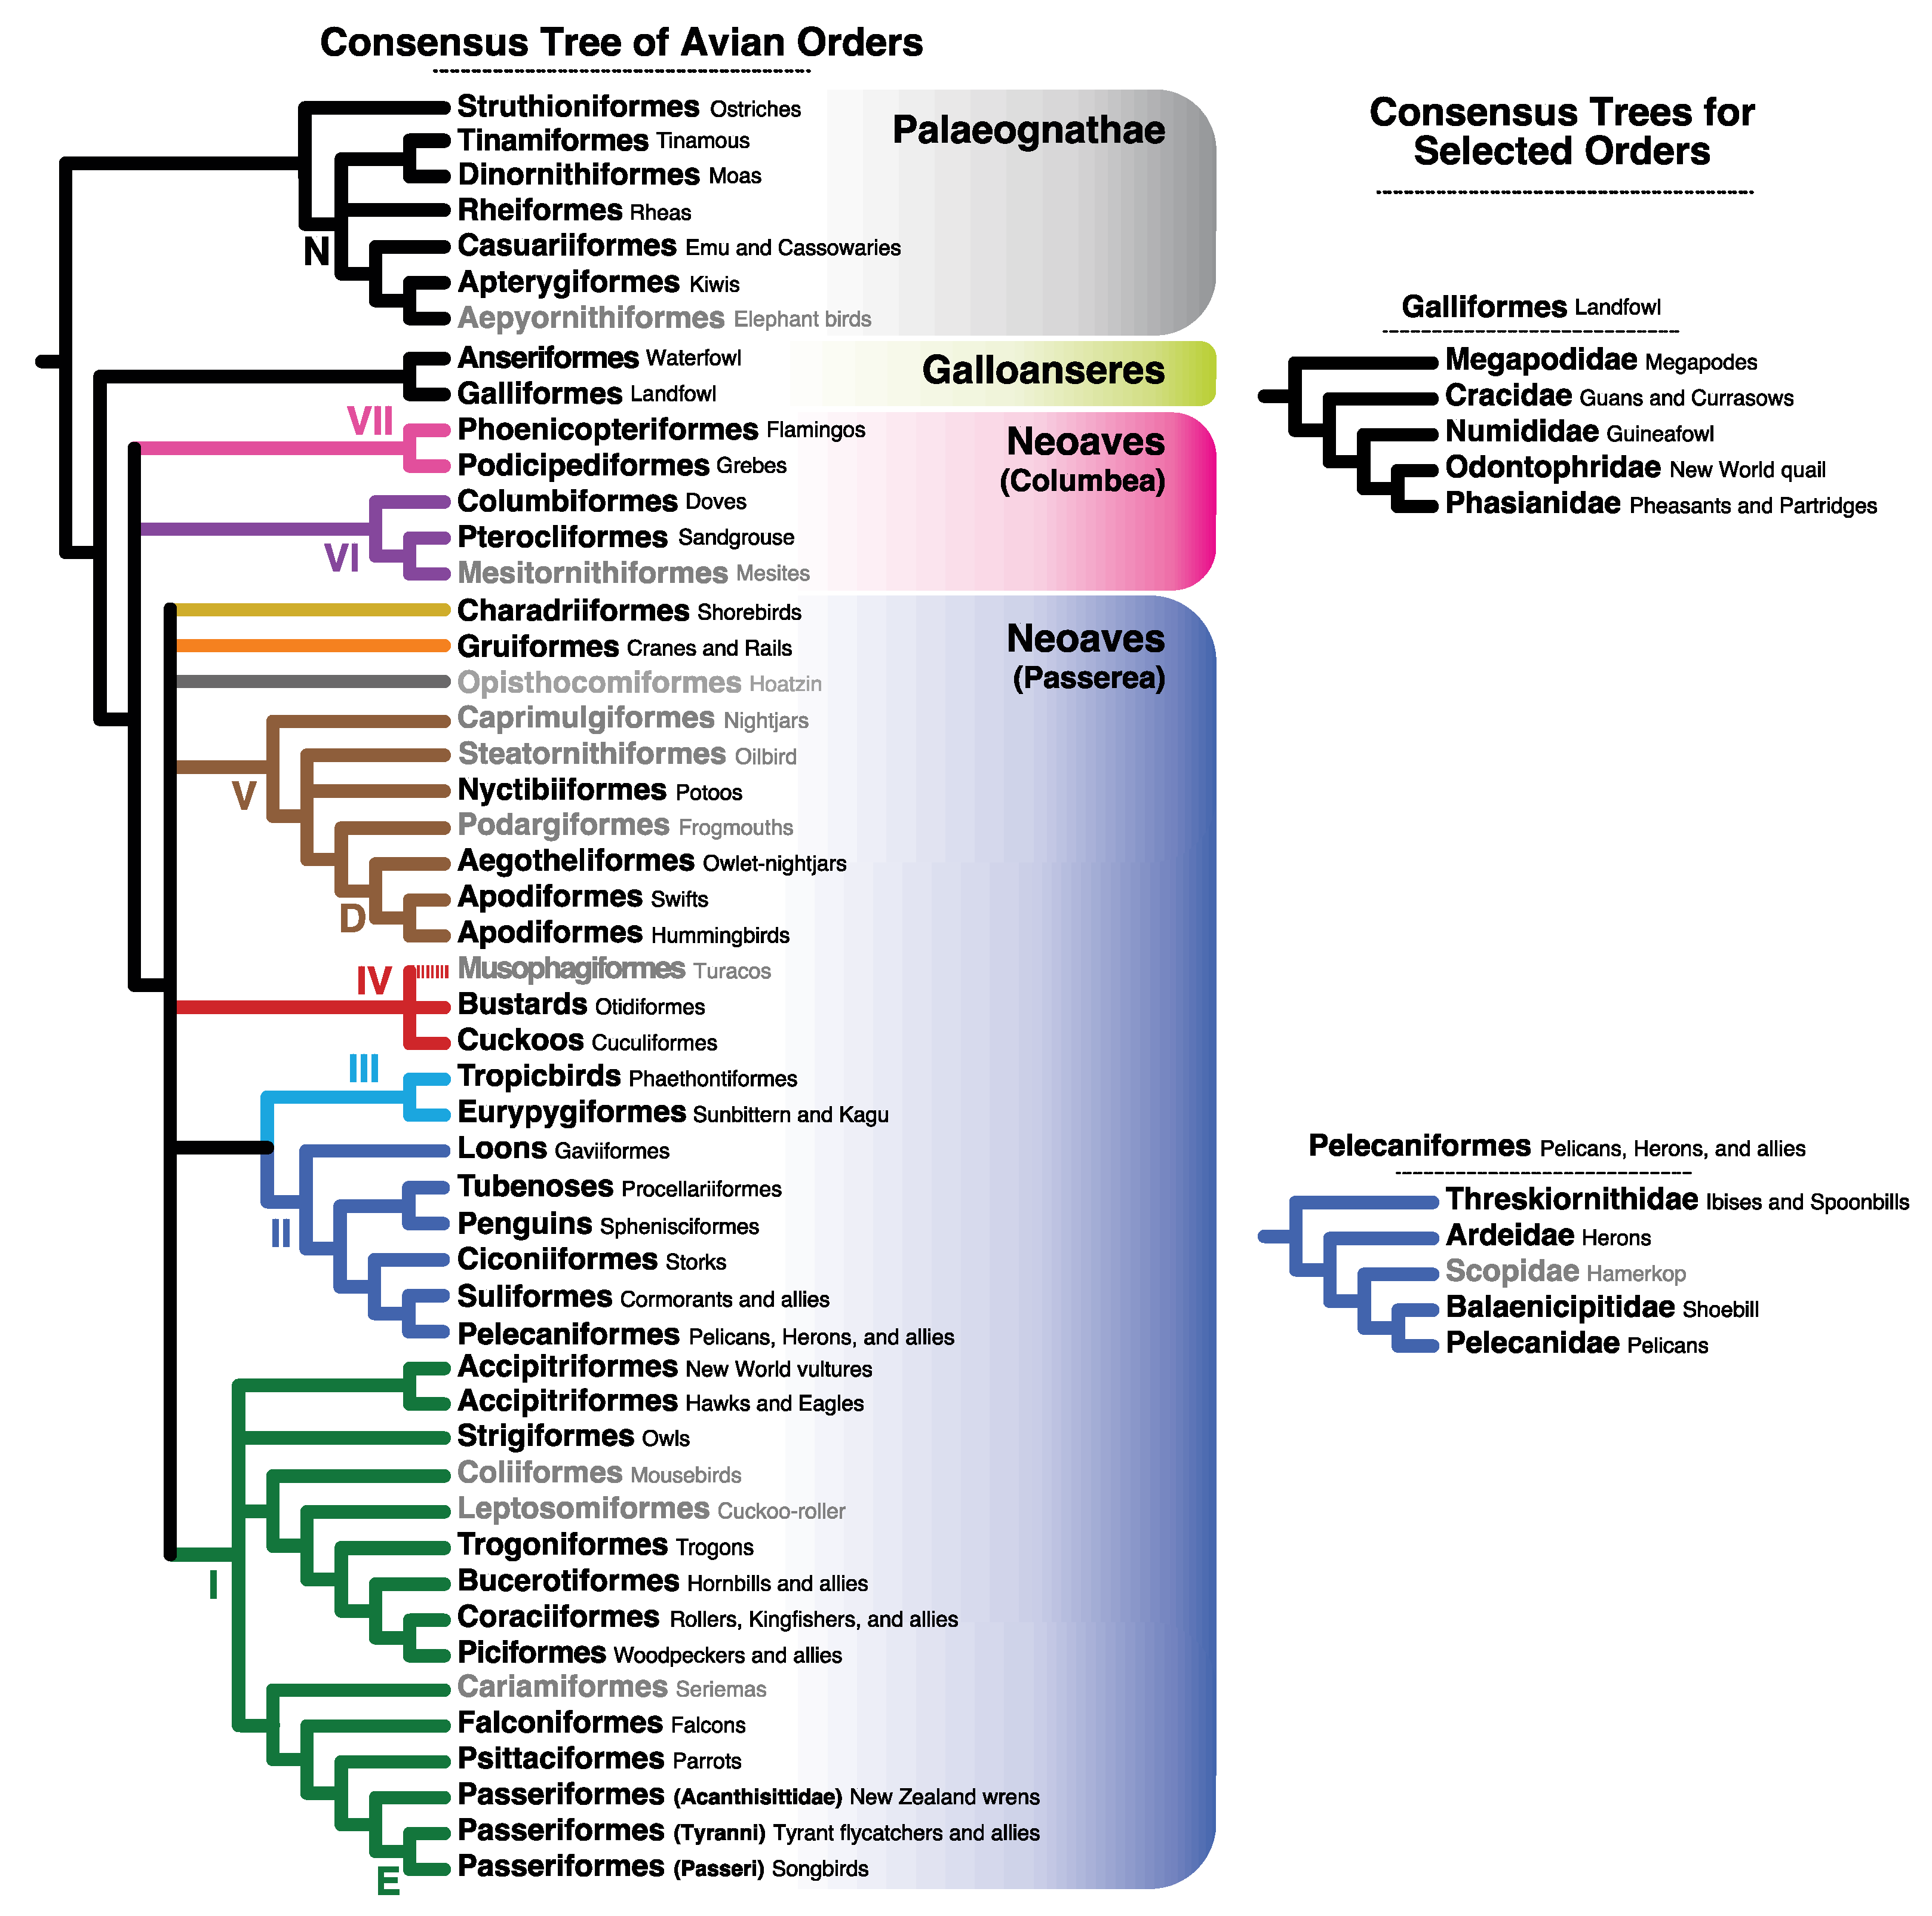
4.3. Implications for Avian Systematics and Evolution

Two additional questions emerge if we shift our focus from molecular evolution to the study of avian biodiversity: (1) What information about avian evolution does an accurate estimate of the mitogenomic tree of birds provide? (2) Have our analyses generated an accurate estimate of the avian mitogenomic tree? The first question is especially important in the era of genomics; whole-genome sequences for birds are now accumulating at an ever accelerating pace [102,103] and those data are being used to revolutionize phylogenetics [61]. Ultimately, the mitogenomic tree is a single gene tree and discordance among gene trees is known to be ubiquitous [6]. This is especially true for the diversification of avian orders at the base of Neoaves [12,104,105]. However, the mitogenomic tree is also an unusual gene tree because it is expected to be more congruent with the species tree than the average nuclear gene tree [106] and, when it differs from the species tree, that discordance can have important biological implications.
The unusual nature of the mitochondrial gene tree is likely to reflect, in large part, the maternal inheritance of the mitogenome. Maternal inheritance is expected to reduce the effective population size of the mitogenome relative to nuclear genes under many circumstances [107]. The ZW sex chromosome system of birds probably has an additional impact on avian mitochondrial population biology; Berlin et al. [108] suggested that Hill-Robertson interference [109] between the W chromosome and mitogenome can explain the low intraspecific variation observed in avian mitogenomes. Hickey [110] and Lane [111] suggested the opposite pattern (that selection on mitogenome leads to low W chromosome variation) is more likely; however, the locus of selection is actually irrelevant for birds because both scenarios reduce the effective population size of the mitogenome and therefore increase the likelihood of congruence with the species tree. In fact, both scenarios could be true in that selection on either the mitogenome or the W chromosome is expected to lead to selective sweeps that reduce variation on both genetic elements (obviously, the locus of selection would be relevant in taxa with different sex determination systems). On the other hand, some analyses support instances of genuine discordance between the mitogenomic tree and the species tree [112,113,114]. Although incomplete lineage sorting is likely to explain some instances of mitochondrial incongruence, mitochondrial capture probably explains many instances of discordance between the mitogenomic tree and the species tree [115]. Mitochondrial capture is likely to have a functional basis; introgression of a mitochondrial genotype is favored if it is better adapted to the local environment than the genotype of the recipient and/or when the mitochondrial genotype of the recipient taxon has a high mutational load. This creates two situations: (1) the true mitogenomic tree typically matches the species tree more closely than the true gene tree for a typical nuclear locus; and (2) genuine discordance between the species tree and mitogenomic tree can indicate interesting biological processes. Thus, an accurate estimate of the mitogenomic tree is likely to provide interesting information.
The second question was whether the evidence suggested that we were able to generate an accurate estimate of the mitogenomic tree; obviously, we were unable to do so. Although the incongruence among our estimates of mitochondrial phylogeny speak volumes, an even bigger problem is that concordance with the likely avian species tree is approximately evenly split between TM and ExM sites. This evaluation of the performance of analyses using a specific data type is predicated on the assumption that congruence between the estimated mitochondrial tree and the likely species tree indicates better performance. Although it is possible that any specific example of congruence is coincidental it is a virtual certainty that this will be true on average, especially in cases where the branch uniting a group is long in terms of the multispecies coalescent. For example, the branch uniting Notopalaeognathae is known to be long based on retroelement insertion data [116] (also note the high estimate of the concordance factor in Smith et al. [117]). Thus, one can place a very high prior probability that the true mitogenomic tree includes that clade and further leads us to the conclusion that analyses of the TM sites are correct (and those of ExM sites are incorrect) in this case. On the other hand, Mirandornithes is also recovered in a large number of individual gene trees [12,118], indicating that the branch uniting it is long in coalescent units. However, in this case, it is the ExM sites that yield a tree with Mirandornithes and TM amino that fail to do so (although analyses of TM nucleotides do yield the clade). We chose these examples because both are clades that appear in many nuclear gene trees and therefore it is very likely that the relevant clades are in the true mitogenomic tree. Indeed, it is likely that many of the clades that are present in at least some estimates of the mitogenomic tree as well as the likely species tree are present in the true mitogenomic tree. However, there is no clear pattern relating the topological signal in different structural environments to clades that are present in the species tree. This makes it impossible to assess the evidence for clades without reference to the species tree; this makes it impossible to identify genuine discordance between the true mitogenomic tree and the species tree.

5. Conclusions

The central conclusion of this study is that the best-fitting models of sequence evolution for TM versus ExM sites differ substantially but the tree topologies for those two data types exhibit few, if any, significant differences. Thus, we did not corroborate the NB hypothesis for the bird tree, at least for the parts of the tree we could examine given our taxon sample. Nevertheless, the conclusion that there are significant differences between the best-fitting models for TM and ExM sites suggests that it would be wise to incorporate information about these model differences into analyses of mitochondrial data. In general, better-fitting models will yield more accurate estimates of phylogeny and it seems reasonable to assert that better models of mitochondrial protein evolution will be useful in at least some parts of the tree. Even if the direct improvements to estimates of the topology for the mitogenomic tree are limited, incorporating differences related to protein structure into models of mitochondrial sequence evolution is likely to improve studies focused on shifts in the strength of purifying selection [62] or those focused on positive selection and convergence in mitochondrial proteins [119,120,121].
Despite our focus on a single gene tree, we believe our results have implications for the theory and practice of phylogenomics. Most modern phylogenomic studies combine gene trees estimated using many different loci to generate the species tree using summary coalescent methods, such as the method in the program ASTRAL [122] (although most studies also present trees estimated using other methods). Summary coalescent methods are unbiased when two conditions are met: (1) conflicts among gene trees reflect the multispecies coalescent; and (2) true gene trees are used as input [123]. However, they can be sensitive to gene tree estimation error [124,125,126,127]. Even when the species tree generated by a summary coalescent method has the correct topology, low-quality input gene trees lead to the underestimation of coalescent branch lengths [128]. This raises a profound question: how accurate are our estimates of gene trees? Although simulations provide some guidance, it seems likely that trees estimated from empirical data are often less accurate than trees based on simulated data. This study suggests that most estimates of the avian mitogenomic tree are inaccurate but many of these conflicts were uncovered because we incorporated information about mitochondrial protein structure. However, we have much less information about most loci used to generate gene trees. This study suggests that it would be valuable to incorporate more detailed information to better assess the accuracy of typical nuclear gene trees; structure is one such source of information for gene trees estimated using protein-coding regions.

Supplementary Materials

The following are available online at https://www.mdpi.com/article/10.3390/d13110555/s1, File S1: Zip file containing multiple sequence alignments; File S2: Zip file containing rate matrices; File S3: Nexus format treefile; File S4: topological distances; File S5: Excel file with mixture model results.

Author Contributions

Conceptualization, E.L.G. and E.L.B.; methodology, E.L.G. and E.L.B.; software, E.L.G. and E.L.B.; validation, E.L.G., R.T.K. and E.L.B.; formal analysis, E.L.B.; investigation, E.L.G.; resources, R.T.K. and E.L.B.; data curation, E.L.G. and E.L.B.; writing—original draft preparation, E.L.B.; writing—review and editing, E.L.G., R.T.K. and E.L.B.; visualization, E.L.B.; supervision, E.L.B.; project administration, R.T.K. and E.L.B.; funding acquisition, R.T.K. and E.L.B. All authors have read and agreed to the published version of the manuscript.

Funding

This research was funded by the US National Science Foundation, grant number DEB-1655683.

Institutional Review Board Statement

Not applicable.

Informed Consent Statement

Not applicable.

Data Availability Statement

All data are available in the Supplementary Materials or from github (https://github.com/ebraun68/protmodels).

Acknowledgments

We are grateful to three anonymous reviewers and to the academic editor for helpful comments on this manuscript. We thank Brant Faircloth for assistance running the dataset subdivision tests; those portions of this research were conducted with high performance computing resources provided by Louisiana State University (http://www.hpc.lsu.edu).

Conflicts of Interest

The authors declare no conflict of interest.

References

  1. Gee, H. Evolution: Ending incongruence. Nature 2003, 425, 782. [Google Scholar] [CrossRef]
  2. Rokas, A.; Williams, B.L.; King, N.; Carroll, S.B. Genome-scale approaches to resolving incongruence in molecular phylogenies. Nature 2003, 425, 798–804. [Google Scholar] [CrossRef]
  3. Jeffroy, O.; Brinkmann, H.; Delsuc, F.; Philippe, H. Phylogenomics: The beginning of incongruence? Trends Genet. 2006, 22, 225–231. [Google Scholar] [CrossRef] [Green Version]
  4. Pamilo, P.; Nei, M. Relationships between gene trees and species trees. Mol. Biol. Evol. 1988, 5, 568–583. [Google Scholar] [CrossRef]
  5. Maddison, W.P. Gene trees in species trees. Syst. Biol. 1997, 46, 523–536. [Google Scholar] [CrossRef]
  6. Edwards, S.V. Is a new and general theory of molecular systematics emerging? Evolution 2009, 63, 1–19. [Google Scholar] [CrossRef] [PubMed] [Green Version]
  7. Degnan, J.H.; Rosenberg, N.A. Gene tree discordance, phylogenetic inference and the multispecies coalescent. Trends Ecol. Evol. 2009, 24, 332–340. [Google Scholar] [CrossRef]
  8. Edwards, S.V.; Xi, Z.; Janke, A.; Faircloth, B.C.; McCormack, J.E.; Glenn, T.C.; Zhong, B.; Wu, S.; Lemmon, E.M.; Lemmon, A.R.; et al. Implementing and testing the multispecies coalescent model: A valuable paradigm for phylogenomics. Mol. Phylogenet. Evol. 2016, 94, 447–462. [Google Scholar] [CrossRef] [PubMed]
  9. Braun, E.L.; Kimball, R.T. Polytomies, the power of phylogenetic inference, and the stochastic nature of molecular evolution: A comment on Walsh (1999). Evolution 2001, 55, 1261–1263. [Google Scholar] [CrossRef] [PubMed]
  10. Reddy, S.; Kimball, R.T.; Pandey, A.; Hosner, P.A.; Braun, M.J.; Hackett, S.J.; Han, K.-L.; Harshman, J.; Huddleston, C.J.; Kingston, S.; et al. Why do phylogenomic data sets yield conflicting trees? Data type influences the avian tree of life more than taxon sampling. Syst. Biol. 2017, 66, 857–879. [Google Scholar] [CrossRef]
  11. Bull, J.J.; Huelsenbeck, J.P.; Cunningham, C.W.; Swofford, D.L.; Waddell, P.J. Partitioning and combining data in phylogenetic analysis. Syst. Biol. 1993, 42, 384. [Google Scholar] [CrossRef]
  12. Jarvis, E.D.; Mirarab, S.; Aberer, A.J.; Li, B.; Houde, P.; Li, C.; Ho, S.Y.W.; Faircloth, B.C.; Nabholz, B.; Howard, J.T.; et al. Whole-genome analyses resolve early branches in the tree of life of modern birds. Science 2014, 346, 1320–1331. [Google Scholar] [CrossRef] [PubMed] [Green Version]
  13. Prum, R.O.; Berv, J.S.; Dornburg, A.; Field, D.J.; Townsend, J.P.; Lemmon, E.M.; Lemmon, A.R. A comprehensive phylogeny of birds (Aves) using targeted next-generation DNA sequencing. Nature 2015, 526, 569–573. [Google Scholar] [CrossRef]
  14. Braun, E.L.; Kimball, R.T. Data types and the phylogeny of Neoaves. Birds 2021, 2, 1. [Google Scholar] [CrossRef]
  15. Chen, M.-Y.; Liang, D.; Zhang, P. Phylogenomic resolution of the phylogeny of laurasiatherian mammals: Exploring phylogenetic signals within coding and noncoding sequences. Genome Biol. Evol. 2017, 9, 1998–2012. [Google Scholar] [CrossRef] [Green Version]
  16. Chan, K.O.; Hutter, C.R.; Wood, P.L.; Grismer, L.L.; Brown, R.M. Larger, Unfiltered datasets are more effective at resolving phylogenetic conflict: Introns, exons, and UCEs resolve ambiguities in golden-backed frogs (Anura: Ranidae; Genus Hylarana). Mol. Phylogenet. Evol. 2020, 151, 106899. [Google Scholar] [CrossRef]
  17. Pandey, A.; Braun, E.L. Phylogenetic analyses of sites in different protein structural environments result in distinct placements of the metazoan root. Biology 2020, 9, 64. [Google Scholar] [CrossRef] [Green Version]
  18. Zhang, J.; Lindsey, A.R.I.; Peters, R.S.; Heraty, J.M.; Hopper, K.R.; Werren, J.H.; Martinson, E.O.; Woolley, J.B.; Yoder, M.J.; Krogmann, L. Conflicting signal in transcriptomic markers leads to a poorly resolved backbone phylogeny of chalcidoid wasps. Syst. Entomol. 2020, 45, 783–802. [Google Scholar] [CrossRef]
  19. Zhang, R.; Wang, Y.-H.; Jin, J.-J.; Stull, G.W.; Bruneau, A.; Cardoso, D.; De Queiroz, L.P.; Moore, M.J.; Zhang, S.-D.; Chen, S.-Y.; et al. Exploration of plastid phylogenomic conflict yields new insights into the deep relationships of Leguminosae. Syst. Biol. 2020, 69, 613–622. [Google Scholar] [CrossRef] [PubMed]
  20. Pandey, A.; Braun, E.L. The roles of protein structure, taxon sampling, and model complexity in phylogenomics: A case study focused on early animal divergences. Biophysica 2021, 1, 8. [Google Scholar] [CrossRef]
  21. Tiley, G.P.; Pandey, A.; Kimball, R.T.; Braun, E.L.; Burleigh, J.G. Whole genome phylogeny of Gallus: Introgression and data-type effects. Avian Res. 2020, 11, 7. [Google Scholar] [CrossRef] [Green Version]
  22. Felsenstein, J. Cases in which parsimony or compatibility methods will be positively misleading. Syst. Zool. 1978, 27, 401–410. [Google Scholar] [CrossRef]
  23. Hendy, M.D.; Penny, D. A framework for the quantitative study of evolutionary trees. Syst. Zool. 1989, 38, 297–309. [Google Scholar] [CrossRef]
  24. Conant, G.C.; Lewis, P.O. Effects of nucleotide composition bias on the success of the parsimony criterion in phylogenetic inference. Mol. Biol. Evol. 2001, 18, 1024–1033. [Google Scholar] [CrossRef] [Green Version]
  25. Katsu, Y.; Braun, E.L.; Guillette, L.J.; Iguchi, T. From reptilian phylogenomics to reptilian genomes: Analyses of c-Jun and DJ-1 proto-oncogenes. Cytogenet. Genome Res. 2009, 127, 79–93. [Google Scholar] [CrossRef] [PubMed]
  26. Kubatko, L.S.; Degnan, J.H. Inconsistency of phylogenetic estimates from concatenated data under coalescence. Syst. Biol. 2007, 56, 17–24. [Google Scholar] [CrossRef] [PubMed] [Green Version]
  27. Roch, S.; Steel, M. Likelihood-based tree reconstruction on a concatenation of aligned sequence data sets can be statistically inconsistent. Theor. Popul. Biol. 2015, 100C, 56–62. [Google Scholar] [CrossRef]
  28. Wang, N.; Braun, E.L.; Liang, B.; Cracraft, J.; Smith, S.A. Categorical edge-based analyses of phylogenomic data reveal conflicting signals for difficult relationships in the avian tree. BioRxiv 2021, 2021.05.17.444565. [Google Scholar] [CrossRef]
  29. Goldman, N.; Thorne, J.L.; Jones, D.T. Assessing the impact of secondary structure and solvent accessibility on protein evolution. Genetics 1998, 149, 445–458. [Google Scholar] [CrossRef]
  30. Le, S.Q.; Gascuel, O. Accounting for solvent accessibility and secondary structure in protein phylogenetics is clearly beneficial. Syst. Biol. 2010, 59, 277–287. [Google Scholar] [CrossRef] [Green Version]
  31. Pandey, A.; Braun, E.L. Protein evolution is structure dependent and non-homogeneous across the tree of life. In Proceedings of the 11th ACM International Conference on Bioinformatics, Computational Biology and Health Informatics, Virtual Event, 21–24 September 2020; ACM: New York, NY, USA, 2020; pp. 1–11, Article 28. [Google Scholar] [CrossRef]
  32. Kessel, A.; Ben-Tal, N. Introduction to Proteins: Structure, Function, and Motion, 2nd ed.; Chapman & Hall/CRC Computational Biology Series; Chapman and Hall/CRC: Boca Raton, FL, USA, 2018; p. 988. ISBN 9781498747172. [Google Scholar]
  33. Naylor, G.J.; Brown, W.M. Structural biology and phylogenetic estimation. Nature 1997, 388, 527–528. [Google Scholar] [CrossRef]
  34. Naylor, G.J.; Brown, W.M. Amphioxus mitochondrial DNA, chordate phylogeny, and the limits of inference based on comparisons of sequences. Syst. Biol. 1998, 47, 61–76. [Google Scholar] [CrossRef] [Green Version]
  35. Gustafsson, C.M.; Falkenberg, M.; Larsson, N.-G. Maintenance and expression of mammalian mitochondrial DNA. Annu. Rev. Biochem. 2016, 85, 133–160. [Google Scholar] [CrossRef] [PubMed]
  36. Formenti, G.; Rhie, A.; Balacco, J.; Haase, B.; Mountcastle, J.; Fedrigo, O.; Brown, S.; Capodiferro, M.R.; Al-Ajli, F.O.; Ambrosini, R.; et al. Complete vertebrate mitogenomes reveal widespread repeats and gene duplications. Genome Biol. 2021, 22, 120. [Google Scholar] [CrossRef] [PubMed]
  37. Takezaki, N.; Gojobori, T. Correct and incorrect vertebrate phylogenies obtained by the entire mitochondrial DNA sequences. Mol. Biol. Evol. 1999, 16, 590–601. [Google Scholar] [CrossRef] [PubMed] [Green Version]
  38. Minh, B.Q.; Schmidt, H.A.; Chernomor, O.; Schrempf, D.; Woodhams, M.D.; von Haeseler, A.; Lanfear, R. IQ-TREE 2: New models and efficient methods for phylogenetic inference in the genomic era. Mol. Biol. Evol. 2020, 37, 1530–1534. [Google Scholar] [CrossRef] [Green Version]
  39. Yang, Z. Maximum likelihood phylogenetic estimation from DNA sequences with variable rates over sites: Approximate methods. J. Mol. Evol. 1994, 39, 306–314. [Google Scholar] [CrossRef] [Green Version]
  40. Kjer, K.M.; Honeycutt, R.L. Site specific rates of mitochondrial genomes and the phylogeny of Eutheria. BMC Evol. Biol. 2007, 7, 8. [Google Scholar] [CrossRef] [PubMed] [Green Version]
  41. Tamashiro, R.A.; White, N.D.; Braun, M.J.; Faircloth, B.C.; Braun, E.L.; Kimball, R.T. What are the roles of taxon sampling and model fit in tests of cyto-nuclear discordance using avian mitogenomic data? Mol. Phylogenet. Evol. 2019, 130, 132–142. [Google Scholar] [CrossRef]
  42. Meiklejohn, K.A.; Danielson, M.J.; Faircloth, B.C.; Glenn, T.C.; Braun, E.L.; Kimball, R.T. Incongruence among different mitochondrial regions: A case study using complete mitogenomes. Mol. Phylogenet. Evol. 2014, 78, 314–323. [Google Scholar] [CrossRef]
  43. Braun, E.L.; Kimball, R.T. Examining basal avian divergences with mitochondrial sequences: Model complexity, taxon sampling, and sequence length. Syst. Biol. 2002, 51, 614–625. [Google Scholar] [CrossRef] [Green Version]
  44. Delsuc, F.; Phillips, M.J.; Penny, D. Comment on “Hexapod origins: Monophyletic or paraphyletic? ” Science 2003, 301, 1482. [Google Scholar] [CrossRef] [Green Version]
  45. Phillips, M.J.; Penny, D. The root of the mammalian tree inferred from whole mitochondrial genomes. Mol. Phylogenet. Evol. 2003, 28, 171–185. [Google Scholar] [CrossRef]
  46. Gibson, A.; Gowri-Shankar, V.; Higgs, P.G.; Rattray, M. A comprehensive analysis of mammalian mitochondrial genome base composition and improved phylogenetic methods. Mol. Biol. Evol. 2005, 22, 251–264. [Google Scholar] [CrossRef] [PubMed]
  47. Pratt, R.C.; Gibb, G.C.; Morgan-Richards, M.; Phillips, M.J.; Hendy, M.D.; Penny, D. Toward resolving deep Neoaves phylogeny: Data, signal enhancement, and priors. Mol. Biol. Evol. 2009, 26, 313–326. [Google Scholar] [CrossRef] [PubMed]
  48. Nesnidal, M.P.; Helmkampf, M.; Bruchhaus, I.; Hausdorf, B. The complete mitochondrial genome of Flustra foliacea (Ectoprocta, Cheilostomata)—Compositional bias affects phylogenetic analyses of lophotrochozoan relationships. BMC Genom. 2011, 12, 572. [Google Scholar] [CrossRef]
  49. Song, F.; Li, H.; Jiang, P.; Zhou, X.; Liu, J.; Sun, C.; Vogler, A.P.; Cai, W. Capturing the phylogeny of Holometabola with mitochondrial genome data and Bayesian site-heterogeneous mixture models. Genome Biol. Evol. 2016, 8, 1411–1426. [Google Scholar] [CrossRef]
  50. Jones, D.T.; Taylor, W.R.; Thornton, J.M. A mutation data matrix for transmembrane proteins. FEBS Lett. 1994, 339, 269–275. [Google Scholar] [CrossRef] [Green Version]
  51. Liò, P.; Goldman, N. Using protein structural information in evolutionary inference: Transmembrane proteins. Mol. Biol. Evol. 1999, 16, 1696–1710. [Google Scholar] [CrossRef] [PubMed] [Green Version]
  52. Kimball, R.T.; Oliveros, C.H.; Wang, N.; White, N.D.; Barker, F.K.; Field, D.J.; Ksepka, D.T.; Chesser, R.T.; Moyle, R.G.; Braun, M.J.; et al. A phylogenomic supertree of birds. Diversity 2019, 11, 109. [Google Scholar] [CrossRef] [Green Version]
  53. Kuhl, H.; Frankl-Vilches, C.; Bakker, A.; Mayr, G.; Nikolaus, G.; Boerno, S.T.; Klages, S.; Timmermann, B.; Gahr, M. An unbiased molecular approach using 3′UTRs resolves the avian family-level tree of life. Mol. Biol. Evol. 2020, 1, 26–39. [Google Scholar] [CrossRef] [PubMed]
  54. Chen, A.; White, N.D.; Benson, R.B.J.; Braun, M.J.; Field, D.J. Total-evidence framework reveals complex morphological evolution in nightbirds (Strisores). Diversity 2019, 11, 143. [Google Scholar] [CrossRef] [Green Version]
  55. Chen, A.; Field, D.J. Phylogenetic definitions for Caprimulgimorphae (Aves) and major constituent clades under the International Code of Phylogenetic Nomenclature. Vertebr. Zool. 2020, 70, 571–585. [Google Scholar] [CrossRef]
  56. Yuri, T.; Kimball, R.T.; Harshman, J.; Bowie, R.C.K.; Braun, M.J.; Chojnowski, J.L.; Han, K.-L.; Hackett, S.J.; Huddleston, C.J.; Moore, W.S.; et al. Parsimony and model-based analyses of indels in avian nuclear genes reveal congruent and incongruent phylogenetic signals. Biology 2013, 2, 419–444. [Google Scholar] [CrossRef] [PubMed]
  57. Sangster, G. A name for the clade formed by owlet-nightjars, swifts and hummingbirds (Aves). Zootaxa 2005, 799, 1. [Google Scholar] [CrossRef] [Green Version]
  58. Ericson, P.G.P.; Irestedt, M.; Johansson, U.S. Evolution, biogeography, and patterns of diversification in passerine birds. J. Avian Biol. 2003, 34, 3–15. [Google Scholar] [CrossRef] [Green Version]
  59. Cox, W.A.; Kimball, R.T.; Braun, E.L. Phylogenetic position of the New World quail (Odontophoridae): Eight nuclear loci and three mitochondrial regions contradict morphology and the Sibley-Ahlquist Tapestry. Auk 2007, 124, 71–84. [Google Scholar] [CrossRef]
  60. Gibb, G.C.; Kennedy, M.; Penny, D. Beyond phylogeny: Pelecaniform and Ciconiiform birds, and long-term niche stability. Mol. Phylogenet. Evol. 2013, 68, 229–238. [Google Scholar] [CrossRef]
  61. Braun, E.L.; Cracraft, J.; Houde, P. Resolving the avian tree of life from top to bottom: The promise and potential boundaries of the phylogenomic era. In Avian Genomics in Ecology and Evolution: From the Lab into the Wild; Kraus, R.H.S., Ed.; Springer International Publishing: Cham, Switzerland, 2019; pp. 151–210. ISBN 978-3-030-16476-8. [Google Scholar]
  62. Nabholz, B.; Uwimana, N.; Lartillot, N. Reconstructing the phylogenetic history of long-term effective population size and life-history traits using patterns of amino acid replacement in mitochondrial genomes of mammals and birds. Genome Biol. Evol. 2013, 5, 1273–1290. [Google Scholar] [CrossRef] [Green Version]
  63. Paton, T.A.; Baker, A.J. Sequences from 14 mitochondrial genes provide a well-supported phylogeny of the charadriiform birds congruent with the nuclear RAG-1 tree. Mol. Phylogenet. Evol. 2006, 39, 657–667. [Google Scholar] [CrossRef]
  64. UniProt Consortium. UniProt: The universal protein knowledgebase in 2021. Nucleic Acids Res. 2021, 49, D480–D489. [Google Scholar] [CrossRef] [PubMed]
  65. Maddison, D.R.; Swofford, D.L.; Maddison, W.P. NEXUS: An extensible file format for systematic information. Syst. Biol. 1997, 46, 590–621. [Google Scholar] [CrossRef]
  66. Hildebrand, P.W.; Preissner, R.; Frömmel, C. Structural features of transmembrane helices. FEBS Lett. 2004, 559, 145–151. [Google Scholar] [CrossRef] [Green Version]
  67. Hoang, D.T.; Chernomor, O.; von Haeseler, A.; Minh, B.Q.; Vinh, L.S. Ufboot2: Improving the ultrafast bootstrap approximation. Mol. Biol. Evol. 2018, 35, 518–522. [Google Scholar] [CrossRef]
  68. Schwarz, G. Estimating the dimension of a model. Ann. Statist. 1978, 6, 461–464. [Google Scholar] [CrossRef]
  69. Le, V.S.; Dang, C.C.; Le, Q.S. Improved mitochondrial amino acid substitution models for metazoan evolutionary studies. BMC Evol. Biol. 2017, 17, 136. [Google Scholar] [CrossRef] [PubMed] [Green Version]
  70. Kosiol, C.; Goldman, N. Different versions of the Dayhoff rate matrix. Mol. Biol. Evol. 2005, 22, 193–199. [Google Scholar] [CrossRef] [PubMed]
  71. Bogdanowicz, D.; Giaro, K. Matching split distance for unrooted binary phylogenetic trees. IEEE/ACM Trans. Comput. Biol. Bioinform. 2011, 9, 150–160. [Google Scholar] [CrossRef]
  72. Lin, Y.; Rajan, V.; Moret, B.M.E. A metric for phylogenetic trees based on matching. IEEE/ACM Trans. Comput. Biol. Bioinform. 2012, 9, 1014–1022. [Google Scholar] [CrossRef]
  73. Swofford, D.L. PAUP*. Phylogenetic Analysis Using Parsimony (*and Other Methods); Sinauer Associates: Sunderland, UK, 2003. [Google Scholar]
  74. Saitou, N.; Nei, M. The neighbor-joining method: A new method for reconstructing phylogenetic trees. Mol. Biol. Evol. 1987, 4, 406–425. [Google Scholar] [CrossRef]
  75. Farris, J.S.; Kallersjo, M.; Kluge, A.G.; Bult, C. Testing significance of incongruence. Cladistics 1994, 10, 315–319. [Google Scholar] [CrossRef]
  76. Farris, J.S.; Kallersjo, M.; Kluge, A.G.; Bult, C. Constructing a significance test for incongruence. Syst. Biol. 1995, 44, 570. [Google Scholar] [CrossRef]
  77. Grantham, R. Amino acid difference formula to help explain protein evolution. Science 1974, 185, 862–864. [Google Scholar] [CrossRef]
  78. Pacheco, M.A.; Battistuzzi, F.U.; Lentino, M.; Aguilar, R.F.; Kumar, S.; Escalante, A.A. Evolution of modern birds revealed by mitogenomics: Timing the radiation and origin of major orders. Mol. Biol. Evol. 2011, 28, 1927–1942. [Google Scholar] [CrossRef] [Green Version]
  79. Sangster, G. A name for the flamingo-grebe clade. Ibis 2005, 147, 612–615. [Google Scholar] [CrossRef]
  80. Houde, P.; Braun, E.L.; Narula, N.; Minjares, U.; Mirarab, S. Phylogenetic signal of indels and the neoavian radiation. Diversity 2019, 11, 108. [Google Scholar] [CrossRef] [Green Version]
  81. Gatesy, J.; O’Grady, P.; Baker, R.H. Corroboration among data sets in simultaneous analysis: Hidden support for phylogenetic relationships among higher level artiodactyl taxa. Cladistics 1999, 15, 271–313. [Google Scholar] [CrossRef]
  82. Gatesy, J.; Baker, R.H. Hidden likelihood support in genomic data: Can forty-five wrongs make a right? Syst. Biol. 2005, 54, 483–492. [Google Scholar] [CrossRef] [Green Version]
  83. Pagel, M.; Meade, A. A phylogenetic mixture model for detecting pattern-heterogeneity in gene sequence or character-state data. Syst. Biol. 2004, 53, 571–581. [Google Scholar] [CrossRef]
  84. Zink, R.M.; Barrowclough, G.F. Mitochondrial DNA under siege in avian phylogeography. Mol. Ecol. 2008, 17, 2107–2121. [Google Scholar] [CrossRef] [PubMed]
  85. Barrowclough, G.F.; Zink, R.M. Funds enough, and time: mtDNA, nuDNA and the discovery of divergence. Mol. Ecol. 2009, 18, 2934–2936. [Google Scholar] [CrossRef]
  86. Smith, B.T.; McCormack, J.E.; Cuervo, A.M.; Hickerson, M.J.; Aleixo, A.; Cadena, C.D.; Pérez-Emán, J.; Burney, C.W.; Xie, X.; Harvey, M.G.; et al. The drivers of tropical speciation. Nature 2014, 515, 406–409. [Google Scholar] [CrossRef]
  87. Berlin, S.; Ellegren, H. Evolutionary genetics. Clonal inheritance of avian mitochondrial DNA. Nature 2001, 413, 37–38. [Google Scholar] [CrossRef] [PubMed]
  88. Berlin, S.; Smith, N.G.C.; Ellegren, H. Do avian mitochondria recombine? J. Mol. Evol. 2004, 58, 163–167. [Google Scholar] [CrossRef] [PubMed]
  89. Dayhoff, M.O.; Schwartz, R.M.; Orcutt, B.C. A model of evolutionary change in proteins. In Atlas of Protein Sequence and Structure; Dayhoff, M.O., Ed.; National Biomedical Research Foundation: Silver Springs, MD, USA, 1978; Volume 5, pp. 345–352. [Google Scholar]
  90. Jones, D.T.; Taylor, W.R.; Thornton, J.M. The rapid generation of mutation data matrices from protein sequences. Bioinformatics 1992, 8, 275–282. [Google Scholar] [CrossRef]
  91. Le, S.Q.; Gascuel, O. An improved general amino acid replacement matrix. Mol. Biol. Evol. 2008, 25, 1307–1320. [Google Scholar] [CrossRef] [Green Version]
  92. Kosiol, C.; Holmes, I.; Goldman, N. An empirical codon model for protein sequence evolution. Mol. Biol. Evol. 2007, 24, 1464–1479. [Google Scholar] [CrossRef] [Green Version]
  93. Worth, C.L.; Gong, S.; Blundell, T.L. Structural and functional constraints in the evolution of protein families. Nat. Rev. Mol. Cell Biol. 2009, 10, 709–720. [Google Scholar] [CrossRef]
  94. Woese, C.R.; Achenbach, L.; Rouviere, P.; Mandelco, L. Archaeal phylogeny: Reexamination of the phylogenetic position of Archaeoglohus fulgidus in light of certain composition-induced artifacts. Syst. Appl. Microbiol. 1991, 14, 364–371. [Google Scholar] [CrossRef]
  95. Phillips, M.J.; Delsuc, F.; Penny, D. Genome-scale phylogeny and the detection of systematic niases. Mol. Biol. Evol. 2004, 21, 1455–1458. [Google Scholar] [CrossRef] [PubMed] [Green Version]
  96. Gatesy, J. A tenth crucial question regarding model use in phylogenetics. Trends Ecol. Evol. 2007, 22, 509–510. [Google Scholar] [CrossRef] [PubMed]
  97. Shepherd, D.A.; Klaere, S. How well does your phylogenetic model fit your data? Syst. Biol. 2019, 68, 157–167. [Google Scholar] [CrossRef]
  98. Sanderson, M.J.; Kim, J. Parametric phylogenetics? Syst. Biol. 2000, 49, 817–829. [Google Scholar] [CrossRef] [Green Version]
  99. Holder, M.T.; Lewis, P.O.; Swofford, D.L. The Akaike information criterion will not choose the no common mechanism model. Syst. Biol. 2010, 59, 477–485. [Google Scholar] [CrossRef] [Green Version]
  100. Field, D.J.; Berv, J.S.; Hsiang, A.Y.; Lanfear, R.; Landis, M.J.; Dornburg, A. Timing the extant avian radiation: The rise of modern birds, and the importance of modeling molecular rate variation. PeerJ Preprints 2019, 7, e27521. [Google Scholar] [CrossRef]
  101. Kim, J. Slicing hyperdimensional oranges: The geometry of phylogenetic estimation. Mol. Phylogenet. Evol. 2000, 17, 58–75. [Google Scholar] [CrossRef] [PubMed] [Green Version]
  102. Feng, S.; Stiller, J.; Deng, Y.; Armstrong, J.; Fang, Q.; Reeve, A.H.; Xie, D.; Chen, G.; Guo, C.; Faircloth, B.C.; et al. Dense sampling of bird diversity increases power of comparative genomics. Nature 2020, 587, 252–257. [Google Scholar] [CrossRef] [PubMed]
  103. Bravo, G.A.; Schmitt, C.J.; Edwards, S.V. What have we learned from the first 500 avian genomes? Annu. Rev. Ecol. Evol. Syst. 2021, 52. early access online. [Google Scholar] [CrossRef]
  104. Suh, A. The phylogenomic forest of bird trees contains a hard polytomy at the root of Neoaves. Zool. Scr. 2016, 45, 50–62. [Google Scholar] [CrossRef]
  105. Houde, P.; Braun, E.L.; Zhou, L. Deep-time demographic inference suggests ecological release as driver of neoavian adaptive radiation. Diversity 2020, 12, 164. [Google Scholar] [CrossRef]
  106. Moore, W.S. Inferring phylogenies from mtDNA variation: Mitochondrial gene trees versus nuclear gene trees. Evolution 1995, 49, 718–726. [Google Scholar] [CrossRef]
  107. Ballard, J.W.O.; Whitlock, M.C. The incomplete natural history of mitochondria. Mol. Ecol. 2004, 13, 729–744. [Google Scholar] [CrossRef] [PubMed] [Green Version]
  108. Berlin, S.; Tomaras, D.; Charlesworth, B. Low mitochondrial variability in birds may indicate Hill-Robertson effects on the W chromosome. Heredity 2007, 99, 389–396. [Google Scholar] [CrossRef] [Green Version]
  109. Hill, W.G.; Robertson, A. The effect of linkage on limits to artificial selection. Genet. Res. 1966, 8, 269. [Google Scholar] [CrossRef]
  110. Hickey, A.J.R. Avian mtDNA diversity?: An alternate explanation for low mtDNA diversity in birds: An age-old solution? Heredity 2008, 100, 443. [Google Scholar] [CrossRef]
  111. Lane, N. Mitochondria and the W chromosome: Low variability on the W chromosome in birds is more likely to indicate selection on mitochondrial genes. Heredity 2008, 100, 444–445. [Google Scholar] [CrossRef]
  112. Persons, N.W.; Hosner, P.A.; Meiklejohn, K.A.; Braun, E.L.; Kimball, R.T. Sorting out relationships among the grouse and ptarmigan using intron, mitochondrial, and ultra-conserved element sequences. Mol. Phylogenet. Evol. 2016, 98, 123–132. [Google Scholar] [CrossRef] [PubMed] [Green Version]
  113. Andersen, M.J.; McCullough, J.M.; Gyllenhaal, E.F.; Mapel, X.M.; Haryoko, T.; Jønsson, K.A.; Joseph, L. Complex histories of gene flow and a mitochondrial capture event in a nonsister pair of birds. Mol. Ecol. 2021, 30, 2087–2103. [Google Scholar] [CrossRef]
  114. Kimball, R.T.; Guido, M.; Hosner, P.A.; Braun, E.L. When good mitochondria go bad: Cyto-nuclear discordance in landfowl (Aves: Galliformes). Gene 2021, 801, 145841. [Google Scholar] [CrossRef] [PubMed]
  115. Hill, G.E. Reconciling the mitonuclear compatibility species concept with rampant mitochondrial introgression. Integr. Comp. Biol. 2019, 59, 912–924. [Google Scholar] [CrossRef]
  116. Springer, M.S.; Gatesy, J. Retroposon insertions within a multispecies coalescent framework suggest that ratite phylogeny is not in the ‘Anomaly Zone’. BioRxiv 2019, 643296. [Google Scholar] [CrossRef]
  117. Smith, J.V.; Braun, E.L.; Kimball, R.T. Ratite nonmonophyly: Independent evidence from 40 novel loci. Syst. Biol. 2013, 62, 35–49. [Google Scholar] [CrossRef] [Green Version]
  118. Hackett, S.J.; Kimball, R.T.; Reddy, S.; Bowie, R.C.K.; Braun, E.L.; Braun, M.J.; Chojnowski, J.L.; Cox, W.A.; Han, K.-L.; Harshman, J.; et al. A phylogenomic study of birds reveals their evolutionary history. Science 2008, 320, 1763–1768. [Google Scholar] [CrossRef]
  119. Castoe, T.A.; de Koning, A.P.J.; Kim, H.-M.; Gu, W.; Noonan, B.P.; Naylor, G.; Jiang, Z.J.; Parkinson, C.L.; Pollock, D.D. Evidence for an ancient adaptive episode of convergent molecular evolution. Proc. Natl. Acad. Sci. USA 2009, 106, 8986–8991. [Google Scholar] [CrossRef] [PubMed] [Green Version]
  120. Shen, Y.-Y.; Liang, L.; Zhu, Z.-H.; Zhou, W.-P.; Irwin, D.M.; Zhang, Y.-P. Adaptive evolution of energy metabolism genes and the origin of flight in nats. Proc. Natl. Acad. Sci. USA 2010, 107, 8666–8671. [Google Scholar] [CrossRef] [PubMed] [Green Version]
  121. Zhou, T.; Shen, X.; Irwin, D.M.; Shen, Y.; Zhang, Y. Mitogenomic analyses propose positive selection in mitochondrial henes for high-altitude adaptation in galliform nirds. Mitochondrion 2014, 18, 70–75. [Google Scholar] [CrossRef]
  122. Zhang, C.; Sayyari, E.; Mirarab, S. ASTRAL-III: Increased scalability and impacts of contracting low support nranches. In Comparative Genomics; Meidanis, J., Nakhleh, L., Eds.; Lecture Notes in Computer Science; Springer International Publishing: Cham, Switzerland, 2017; Volume 10562, pp. 53–75. ISBN 978-3-319-67978-5. [Google Scholar]
  123. Roch, S.; Warnow, T. On the robustness to gene tree estimation error (or lack thereof) of coalescent-nased species tree methods. Syst. Biol. 2015, 64, 663–676. [Google Scholar] [CrossRef] [PubMed] [Green Version]
  124. Patel, S.; Kimball, R.T.; Braun, E.L. Error in phylogenetic estimation for nushes in the tree of life. J. Phylogenet. Evol. Biol. 2013, 1, 110. [Google Scholar] [CrossRef] [Green Version]
  125. Gatesy, J.; Springer, M.S. Phylogenetic analysis at deep timescales: Unreliable gene trees, bypassed hidden support, and the coalescence/concatalescence conundrum. Mol. Phylogenet. Evol. 2014, 80, 231–266. [Google Scholar] [CrossRef]
  126. Meiklejohn, K.A.; Faircloth, B.C.; Glenn, T.C.; Kimball, R.T.; Braun, E.L. Analysis of a rapid evolutionary radiation using ultraconserved elements: Evidence for a bias in some multispecies coalescent methods. Syst. Biol. 2016, 65, 612–627. [Google Scholar] [CrossRef] [PubMed] [Green Version]
  127. Molloy, E.K.; Warnow, T. To include or not to include: The impact of gene filtering on species tree estimation methods. Syst. Biol. 2018, 67, 285–303. [Google Scholar] [CrossRef] [PubMed]
  128. Forthman, M.; Braun, E.L.; Kimball, R.T. Gene tree quality affects empirical coalescent branch length estimation. Zool. Scr. 2021. [Google Scholar] [CrossRef]
Figure 1. Consensus phylogeny of birds based on phylogenomic data. This cladogram reflects a recent phylogenomic supertree analysis [52] modified based on the results of two more recent phylogenomic studies [14,53]; relationships that are highly uncertain are presented as polytomies. Most terminal taxa correspond to orders as defined in the IOC World Bird List v. 6.1, with the exception of the IOC Caprimulgiformes (clade V) where we used the ordinal definitions of Chen et al. [54,55]. These ordinal definitions are strongly corroborated so we view their monophyly as “known.” Roman numerals indicate the “magnificent seven” superordinal clades defined by Reddy et al. [10]; the historical signal uniting the magnificent seven is weak, but they are relatively well corroborated. The dashed line highlights an exception; support for the position of Musophagiformes is especially weak [14], this is not relevant to the present study given our taxon sample. Three additional clades are indicated using letters: “N” (within Palaeognathae) indicates Notopalaeognathae (non-ostrich paleognaths [56]); “D” (within clade V) indicates Daedalornithes (owlet-nightjars, swifts, and hummingbirds [57]); and “E” (within Passeriformes) indicates Eupasseres (all passerines except the New Zealand wrens [58]). Relationships within two selected orders are also shown; they were chosen because they highlight relationships where the positions of taxa in published mitochondrial phylogenies differed from the position in nuclear phylogenies [42,59,60]. Orders and families without a complete (or nearly complete) mitogenome sequence included in this analysis are presented in gray.
Diversity 13 00555 g001
Figure 2. Results of the 100 randomly subdivided datasets showing Euclidean distances between (a) relative exchangeabilities (R matrix parameters) and (b) amino acid frequencies. The distributions were compared to the observed values for the TM versus ExM distances (black arrows). Although group boundaries for the histogram are arbitrary, the scale of the x-axis places the observed distance for the empirical data correctly relative to distances for random subdivisions.
Diversity 13 00555 g002
Figure 3. Models of sequence evolution for TM and ExM sites, showing amino acid frequencies (bottom) and R matrices (above). Four models of protein sequence evolution: (a) the JTTtm model, a general model of TM helix evolution; (b) bird mtTM, our new model of TM helix evolution; (c) bird mtExM, our new model of ExM loop evolution; and (d) the mtVer model [69], which was trained using all sites in mitochondrially-encoded proteins from diverse vertebrates. The TM models are inside the blue box and the mitochondrial models are inside the red box. All matrices were normalized to have a maximum exchangeability of 100. Progressively darker shades of red are used for larger relative exchangeability values. Amino acid frequency parameters highlighted in blue in the TM models have values that are higher than the bird ExM amino acid frequency. These R matrices available from https://github.com/ebraun68/protmodels (accessed on 26 September 2021) and in Supplementary File S2.
Diversity 13 00555 g003
Figure 4. Condensed ML trees for 420 taxon mitochondrial data matrix estimated for each data type using the GTR20 + I + Γ model. (a) Sites annotated as TM. (b) Sites annotated as ExM. Most tips reflect multiple taxa, with orders collapsed to yield a single tip whenever they were monophyletic. Cases where taxa in the same order were not recovered as monophyletic in at least one of the analyses (e.g., Accipitriformes, Suliformes, and Gruiformes) are presented as two or more tips with information regarding the subset of the order that the tip represents in parentheses. Boxes to the right of each tree indicate clades highlighted in the results. Complete trees with branch lengths and ultrafast bootstrap support for all branches are available as a Nexus format treefile in Supplementary File S3.
Diversity 13 00555 g004
Figure 5. Results of the random subdivision analysis for topological distances based on matching distances between the TM and ExM trees.
Diversity 13 00555 g005
Figure 6. Dendrogram generated by clustering topological distances for the major lineages. We viewed the Kimball et al. [52] supertree, which is a summary of phylogenomic studies, as an estimate of the species tree and included for comparison to the mitogenomic trees. The parenthetical number that follows each mitochondrial tree is the matching distance to the Kimball supertree. To facilitate visualization, the root of the tree has been placed at the midpoint. The complete distance matrix is available in Supplementary File S4.
Diversity 13 00555 g006
Table 1. Support for selected clades 1 in GTR20 + I + Γ analyses of TM, ExM, and All (TM+ExM) sites.
Clade 2TM SitesExM SitesAll Sites
PALAEOGNATHAE100100100
Notopalaeognathae7257
(-) “Ratites”—Dinornithiformes 342
Dinornithiformes + Tinamiformes879298
GALLOANSERES100100100
Galliformes100100100
(-) Numididae + Phasianidae7457
Odontophoridae + Phasianidae75
Odontophoridae8471
NEOAVES9599100
VII. Mirandornithes7893
VI. Columbimorphae
“Orphan Orders” 4n/an/an/a
Charadriiformes897698
Gruiformes90
V. Strisores5975
Daedalornithes823580
Apodiformes979299
IV. Otidimorphae
III. Phaethontimorphae
II. Aequornithes
Procellariiformes9696
Suliformes92
Sulidae + Phalacrocoracidae + Anhingidae99100100
Pelecaniformes
(-) Ardeidae + Threskiornithidae64
Balaenicipitidae + Pelecanidae728195
I. Telluraves
Accipitriformes
Accipitres (Acciptriformes—Cathartidae)964993
Strigiformes99100100
Coraciiformes368479
Passeriformes94100100
Eupasseres9487
1 We present ultrafast bootstrap support for clades present in the optimal tree and we have shaded support values when analyses of the data subsets disagree. In those cases, we shaded cells light gray if they agree with our best estimate of the avian species tree and we shaded cells black with white text if they conflict with our best estimate of the avian species tree. 2 Clades were included if they met one of these three criteria: (1) they were members of the “magnificent seven”; (2) they had <100% support in at least one analysis; or (3) they included a subclade that met the second criterion. 3 We have highlighted a small number of groups that are unlikely to be present in the avian species tree. The putative clades that are unlikely to be correct begin with (-) and are underlined. 4 Although some studies [12,80] have supported a Charadriiformes+Gruiformes clade we do not view that clade to be sufficiently corroborated to be scored in this table. Therefore, we designate these orders as “orphans” to indicate that they are not members of the “magnificent seven” superordinal clades.
Table 2. Mixture weights and contribution of each mixture component to site likelihoods.
Site Type 1ML Estimate of WeightProportion of Sites
TM0.59430.5103
ExM0.40570.4897
lnL mtTM—lnL mtExM2TM SitesExM Sites
Lower Quartile0.3038−1.6424
Median1.28270.0894
Upper Quartile2.169751.23255
1 The estimated mixture weight is expected to equal the observed proportion of sites. 2 Positive values are expected for TM sites and negative values are expected for ExM sites.
Table 3. Support for selected clades 1 in analyses of all amino acid sites using partitioned and mixture models.
CladePartitionedbirdMIX
PALAEOGNATHAE100100
Notopalaeognathae57
(-) “Ratites”—Dinornithiformes23
Dinornithiformes + Tinamiformes9899
GALLOANSERES100100
Galliformes100100
(-) Numididae + Phasianidae5761
Odontophoridae + Phasianidae
Odontophoridae6771
NEOAVES9799
VII. Mirandornithes9493
VI. Columbimorphae
“Orphan Orders”n/an/a
Charadriiformes99100
Gruiformes97
V. Strisores7186
Daedalornithes7781
Apodiformes9999
IV. Otidimorphae
III. Phaethontimorphae
II. Aequornithes
Procellariiformes9797
Suliformes9465
Sulidae + Phalacrocoracidae + Anhingidae100100
Pelecaniformes
(-) Ardeidae + Threskiornithidae35
Balaenicipitidae + Pelecanidae9898
I. Telluraves
Accipitriformes
Accipitres (Acciptriformes—Cathartidae)9796
Strigiformes100100
Coraciiformes8089
Passeriformes100100
Eupasseres7280
1 We have shaded support values when analyses presented in this table disagree. In those cases, we shaded cells light gray if they agree with our best estimate of the avian species tree and we shaded the cells black with white text if they conflict with our best estimate of the avian species tree.
Table 4. Support for selected clades 1 in analyses of nucleotide sequences for TM, ExM, and all sites.
CladeTM SitesExM SitesAll Sites (3)All Sites (6)
PALAEOGNATHAE100100100100
Notopalaeognathae
(-) PALAEOGNATHAE—Rheiformes 26234
(-) “Ratites”—Dinornithiformes 259
(-) “Ratites” 27948
Dinornithiformes + Tinamiformes8455
GALLOANSERES100100100100
Galliformes100100100100
(-) Numididae + Phasianidae64
Odontophoridae + Phasianidae656970
Odontophoridae9976100100
NEOAVES10099100100
VII. Mirandornithes8898100100
VI. Columbimorphae
“Orphan Orders”n/an/an/an/a
Charadriiformes991003100
Gruiformes799799
V. Strisores84
Daedalornithes977995100
Apodiformes9999100100
IV. Otidimorphae46
III. Phaethontimorphae
II. Aequornithes73
Procellariiformes100100100100
Suliformes10086100100
Sulidae + Phalacrocoracidae + Anhingidae100100100100
Pelecaniformes40
(-) Ardeidae + Threskiornithidae60849497
Balaenicipitidae + Pelecanidae93100100100
I. Telluraves
Accipitriformes22
Accipitres (Acciptriformes—Cathartidae)98100100100
Strigiformes10099100100
Coraciiformes
Passeriformes100100100100
Eupasseres1007672
1 We have shaded support values when analyses of the data subsets disagree. Cells were shaded light gray if they agree with our best estimate of the avian species tree and black with white text if they conflict with our best estimate of the avian species tree. 2 We have added two groups that are unlikely to be correct because they appeared in nucleotide analyses and they relate to the topology for Palaeognathe (see discussion for additional information). 3 All Charadriiformes except Turnix sylvaticus form a clade with 100% support in the three-partition nucleotide analysis of all sites. The family Turnicidae (hemipodes) has a long branch in many analyses of molecular data [56,61,63].
Table 5. ML estimates of base frequencies and relative partition rates in the analyses of nucleotide sequences.
CladeRateACGTA + G 1
All sites (3 partition analysis)
1st codon positions0.28060.2926280.2945180.2125060.2003480.505134
2nd codon positions0.15780.1852340.2957010.1216010.3974640.306835
3rd codon positions2.56160.3996640.4221780.04562320.1325350.4452872
TM sites (6 partition analysis)
1st codon positions0.27300.2742860.2844180.2164390.2248570.490725
2nd codon positions0.12530.08712390.2803070.1167060.5158640.2038299
3rd codon positions2.76290.3866190.4337480.04395580.1356780.4305748
ExM sites (6 partition analysis)
1st codon positions0.25400.3113410.3048230.2084930.1753430.519834
2nd codon positions0.16110.2853250.3114070.1265960.2766720.411921
3rd codon positions2.42350.4129720.4103750.04732430.1293290.4602963
1 Sum of the nucleotide frequency parameters for purines.
Table 6. Support for selected clades 1 in analyses of purine-pyrimidine (RY) data for TM, ExM, and all sites.
CladeTM SitesExM SitesAll Sites (3)All Sites (6)
PALAEOGNATHAE100100100100
Notopalaeognathae83
(-) PALAEOGNATHAE—Rheiformes564260
Dinornithiformes + Tinamiformes75959594
GALLOANSERES100100100100
Galliformes100100100100
(-) Numididae + Phasianidae77
Odontophoridae + Phasianidae575054
Odontophoridae97818999
NEOAVES100100100100
VII. Mirandornithes10098100100
VI. Columbimorphae58
“Orphan Orders”n/an/an/an/a
Charadriiformes10098100100
Gruiformes9298100100
V. Strisores72
Daedalornithes958010099
Apodiformes10098100100
IV. Otidimorphae
III. Phaethontimorphae
II. Aequornithes
Procellariiformes10097100100
Suliformes9935100100
Sulidae + Phalacrocoracidae + Anhingidae100100100100
Pelecaniformes54
(-) Ardeidae + Threskiornithidae717578
Balaenicipitidae + Pelecanidae93100100100
I. Telluraves
Accipitriformes
Accipitres (Acciptriformes—Cathartidae)100100100100
Strigiformes949897
Coraciiformes
Passeriformes100100100100
Eupasseres797069
1 We have shaded support values when analyses of the data subsets disagree. Cells were shaded light gray if they agree with our best estimate of the avian species tree and black with white text if they conflict with our best estimate of the avian species tree.
Publisher’s Note: MDPI stays neutral with regard to jurisdictional claims in published maps and institutional affiliations.

