1. Introduction
Both climate and land-use changes are the major drivers of habitat loss worldwide and dramatically affect the ecological integrity of many systems as well as species distribution and extinction rates [
1,
2,
3,
4]. Global average temperature increased by 0.85 °C from 1880 to 2012, and by the end of the XXI century, it is expected to rise further [
5] (up to 4.8 °C; Intergovernmental Panel on Climate Change (IPCC) 2014). Consequently, climate change is going to cause substantial shifts in the ranges of several species [
6] and may surpass habitat loss as the primary threat to global biodiversity over the next decades [
7]. Anthropogenic climate change is already affecting ecological systems and biodiversity distribution [
8,
9,
10,
11,
12] and has influenced >80% of all biological processes [
13].
The most common ecological response to climate change is the shifts in species distribution ranges [
11,
12]. Nevertheless, land-use changes and subsequent landscape fragmentation compromises the ability of species to move following these climate changes under the current climate velocity [
14] (0.42 km yr
−1). Building connected environments that enable species to follow the pace of climate changes, decreasing extinction risk for many of them, is the most repeated suggestion to adapt our conservation strategies [
15,
16,
17]. Enhancing connectivity, through the provision of a network of habitat corridors or stepping-stone patches is, nowadays, a key concept in conservation biology and landscape ecology. Connecting populations throughout wildlife corridors would increase the resilience of the metapopulation facilitating biological processes such as dispersal, gene flow, recovery of small populations and allow spatial redistribution of populations in response to climate [
18,
19,
20].
Connectivity is species-specific, depending on the ability of a species to disperse between patches [
16]. Some species, such as birds, are less directly dependent on the patchiness of the terrestrial world due to their high mobility, but others, like amphibians, reptiles, invertebrates and mammals (particularly micro-mammals), have limited dispersal abilities, increasing their extinction risk in the face of global warming. Most of these species are unable to track climate velocity without adequate corridors to overcome fragmentation [
3].
In consequence, it is necessary to build up a network of corridors to facilitate shifts in species ranges as a natural response to climate change in a fragmented landscape. However, the approaches about how to build a network of corridors vary considerably, and little information exists about under what conditions and in which places a particular modelling or planning framework is the best approach to use [
21]. To buy or rent large areas connecting protected natural areas to allow species movements in a corridor network would be non-cost-effective, and alternatives such as translocation projects would be much more interesting from an economical point of view [
21]. Probably, for these reasons, among others, there is nothing like a large-scale network of corridors anywhere in the world. Nothing like continental or even national scale networks of corridors or stepping-stones to facilitate movements of animals with limited dispersal abilities actually exist. To build functional ecological networks that shelter metapopulations of several species from extinction due to climate change should be an ultimate goal for conservation biologists.
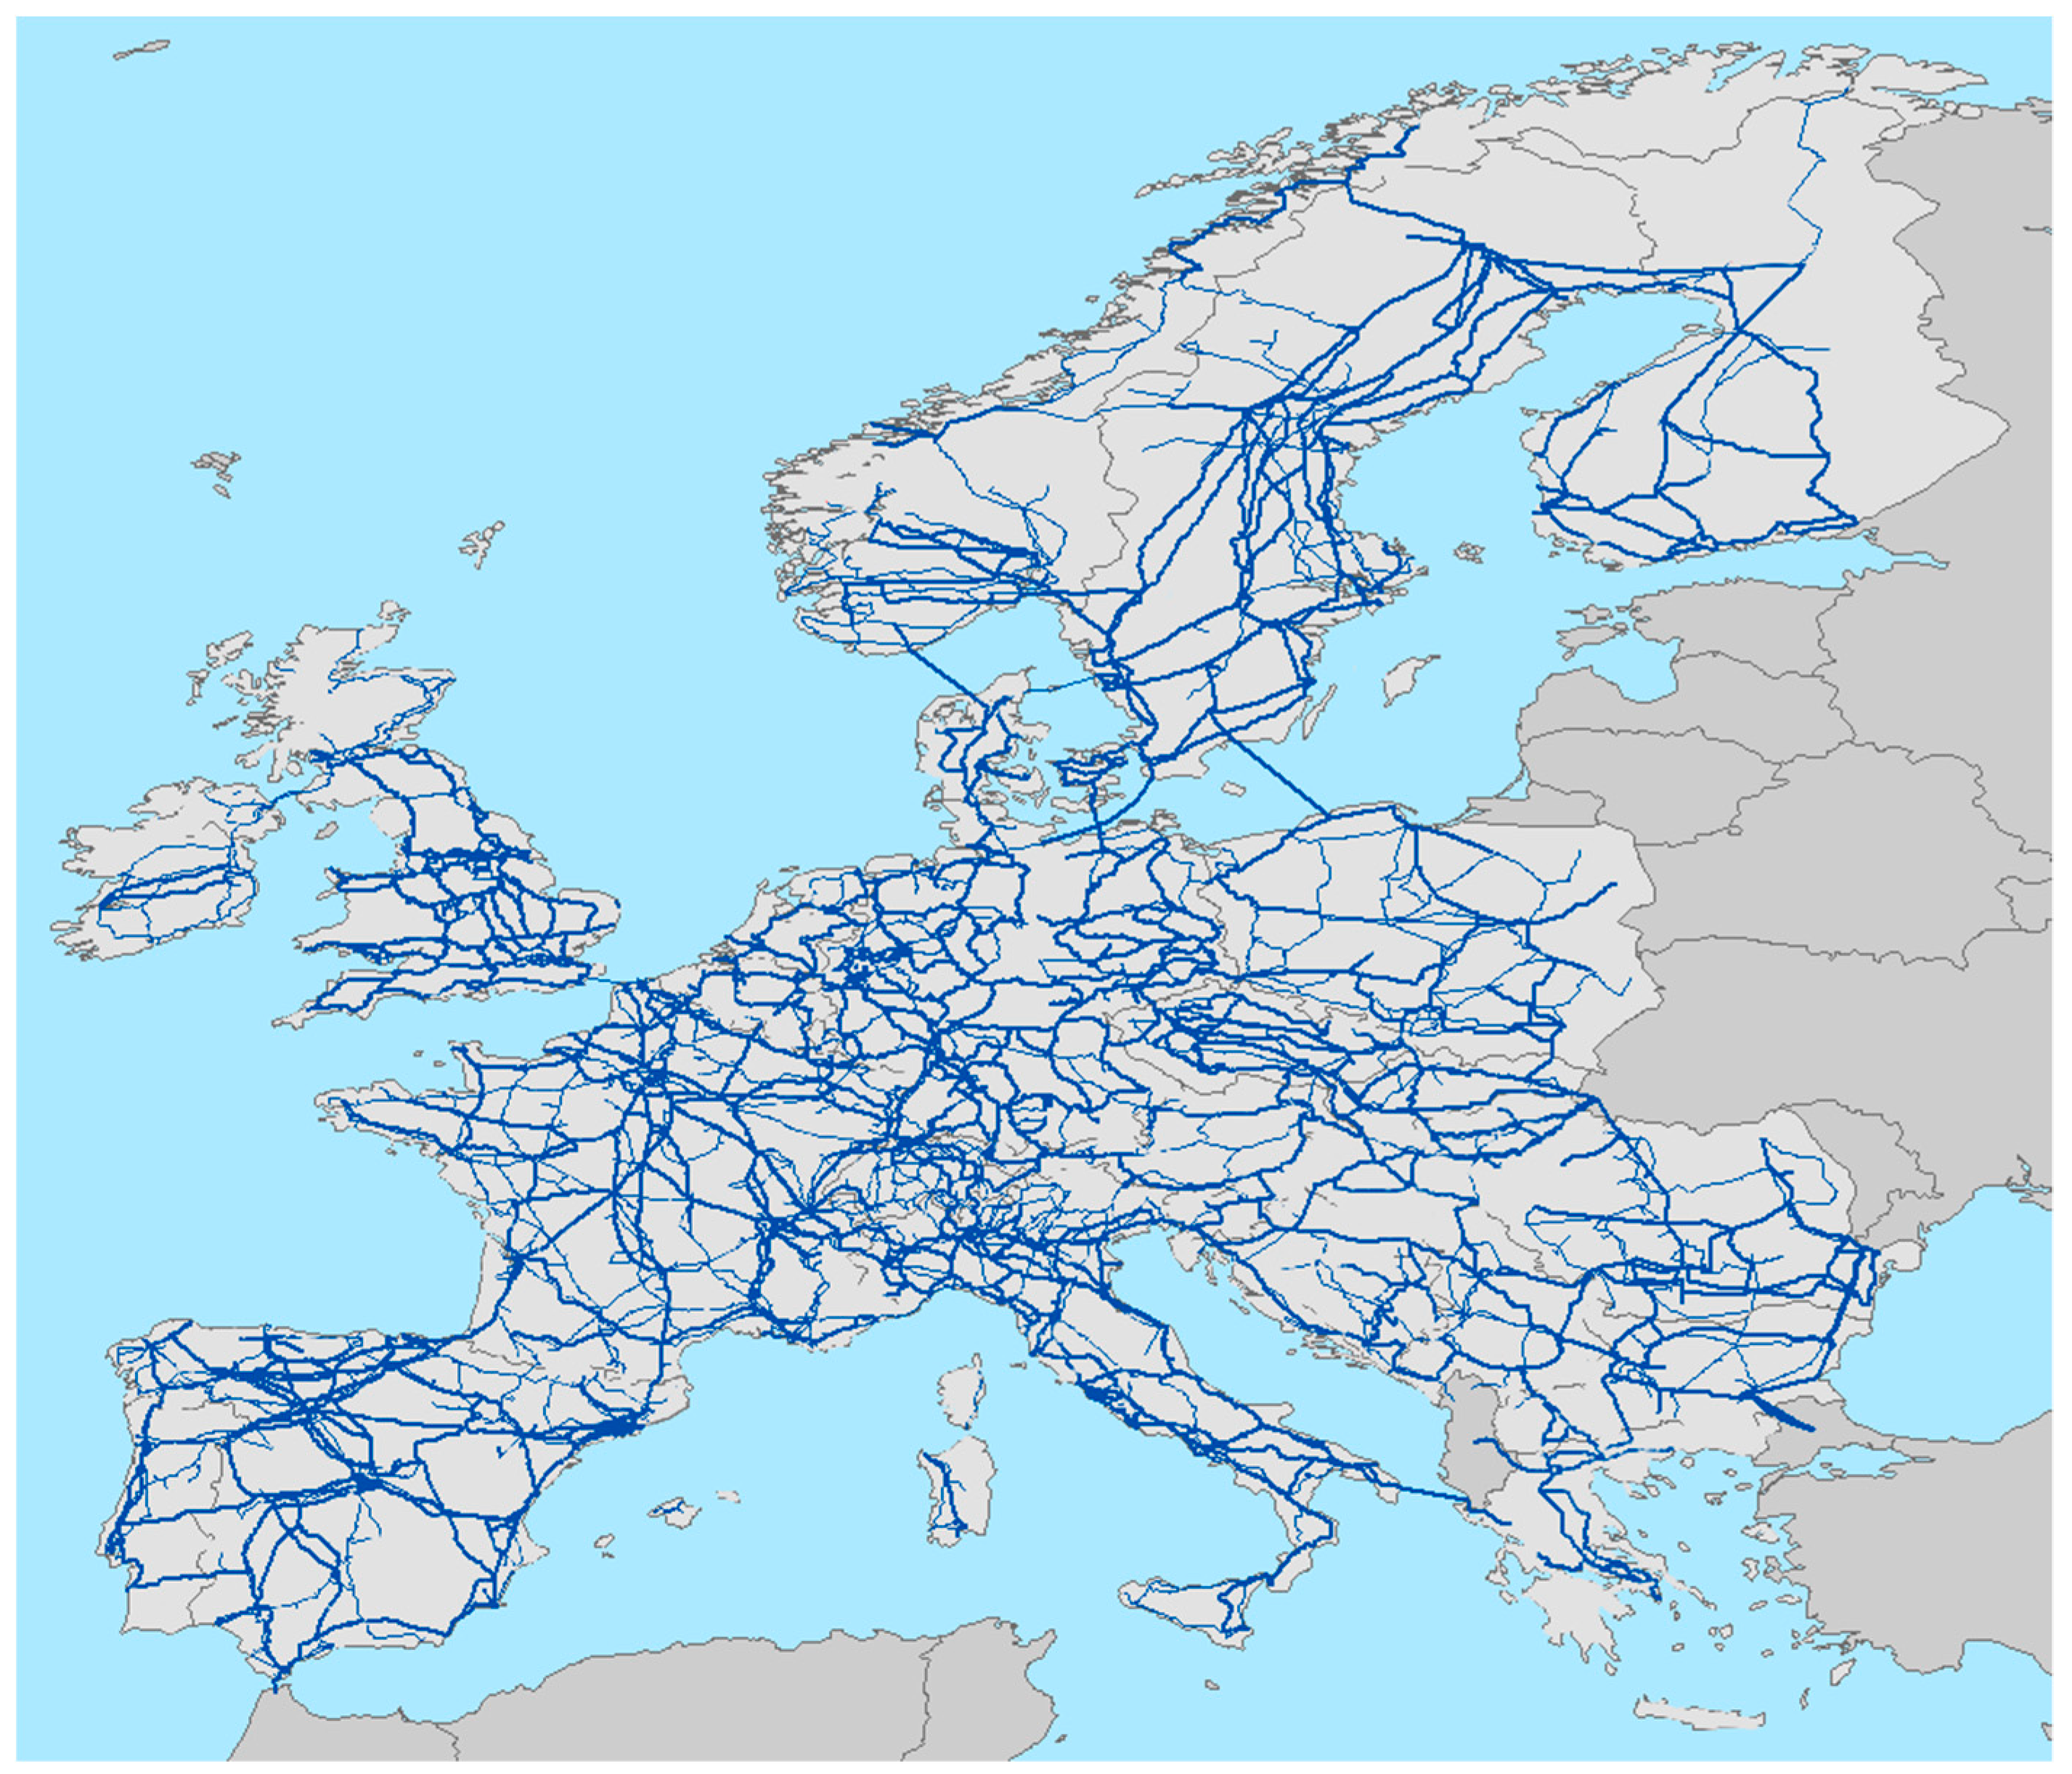
Here, we conduct an experiment to determine if electric power transmission lines, that conforms a huge network in developed countries like United States of America or European Union (
Figure 1), could be transformed in small biodiversity reserves for small animals, creating a kind of rosary of diversity spots. Electric power transmission is the bulk movement of electrical energy from a generating site, such as a power plant, to an electrical substation. The interconnected lines, which facilitate this movement, are known as a transmission network. This is distinct from the electric power distribution, which consist in local wiring between high-voltage substations and customers. Transmission lines have a nominal tension of 220–400 kV. Power is usually transmitted through overhead power lines, supported by transmission towers, generating a huge network of connected lines crossing almost all the territory in developed countries. Typically, towers are placed at 200 m from each other and with a base of 10 × 10 m (100 m
2) on average, depending on the particular design. Nowadays, the EU has a transmission network of 200,000 km approximately and the USA around 254,000 km, which means 1,000,000 and 1,270,000 towers, respectively. Consequently, we have a surface under the towers of around 127,000,000 m
2 in the USA and 100,000,000 m
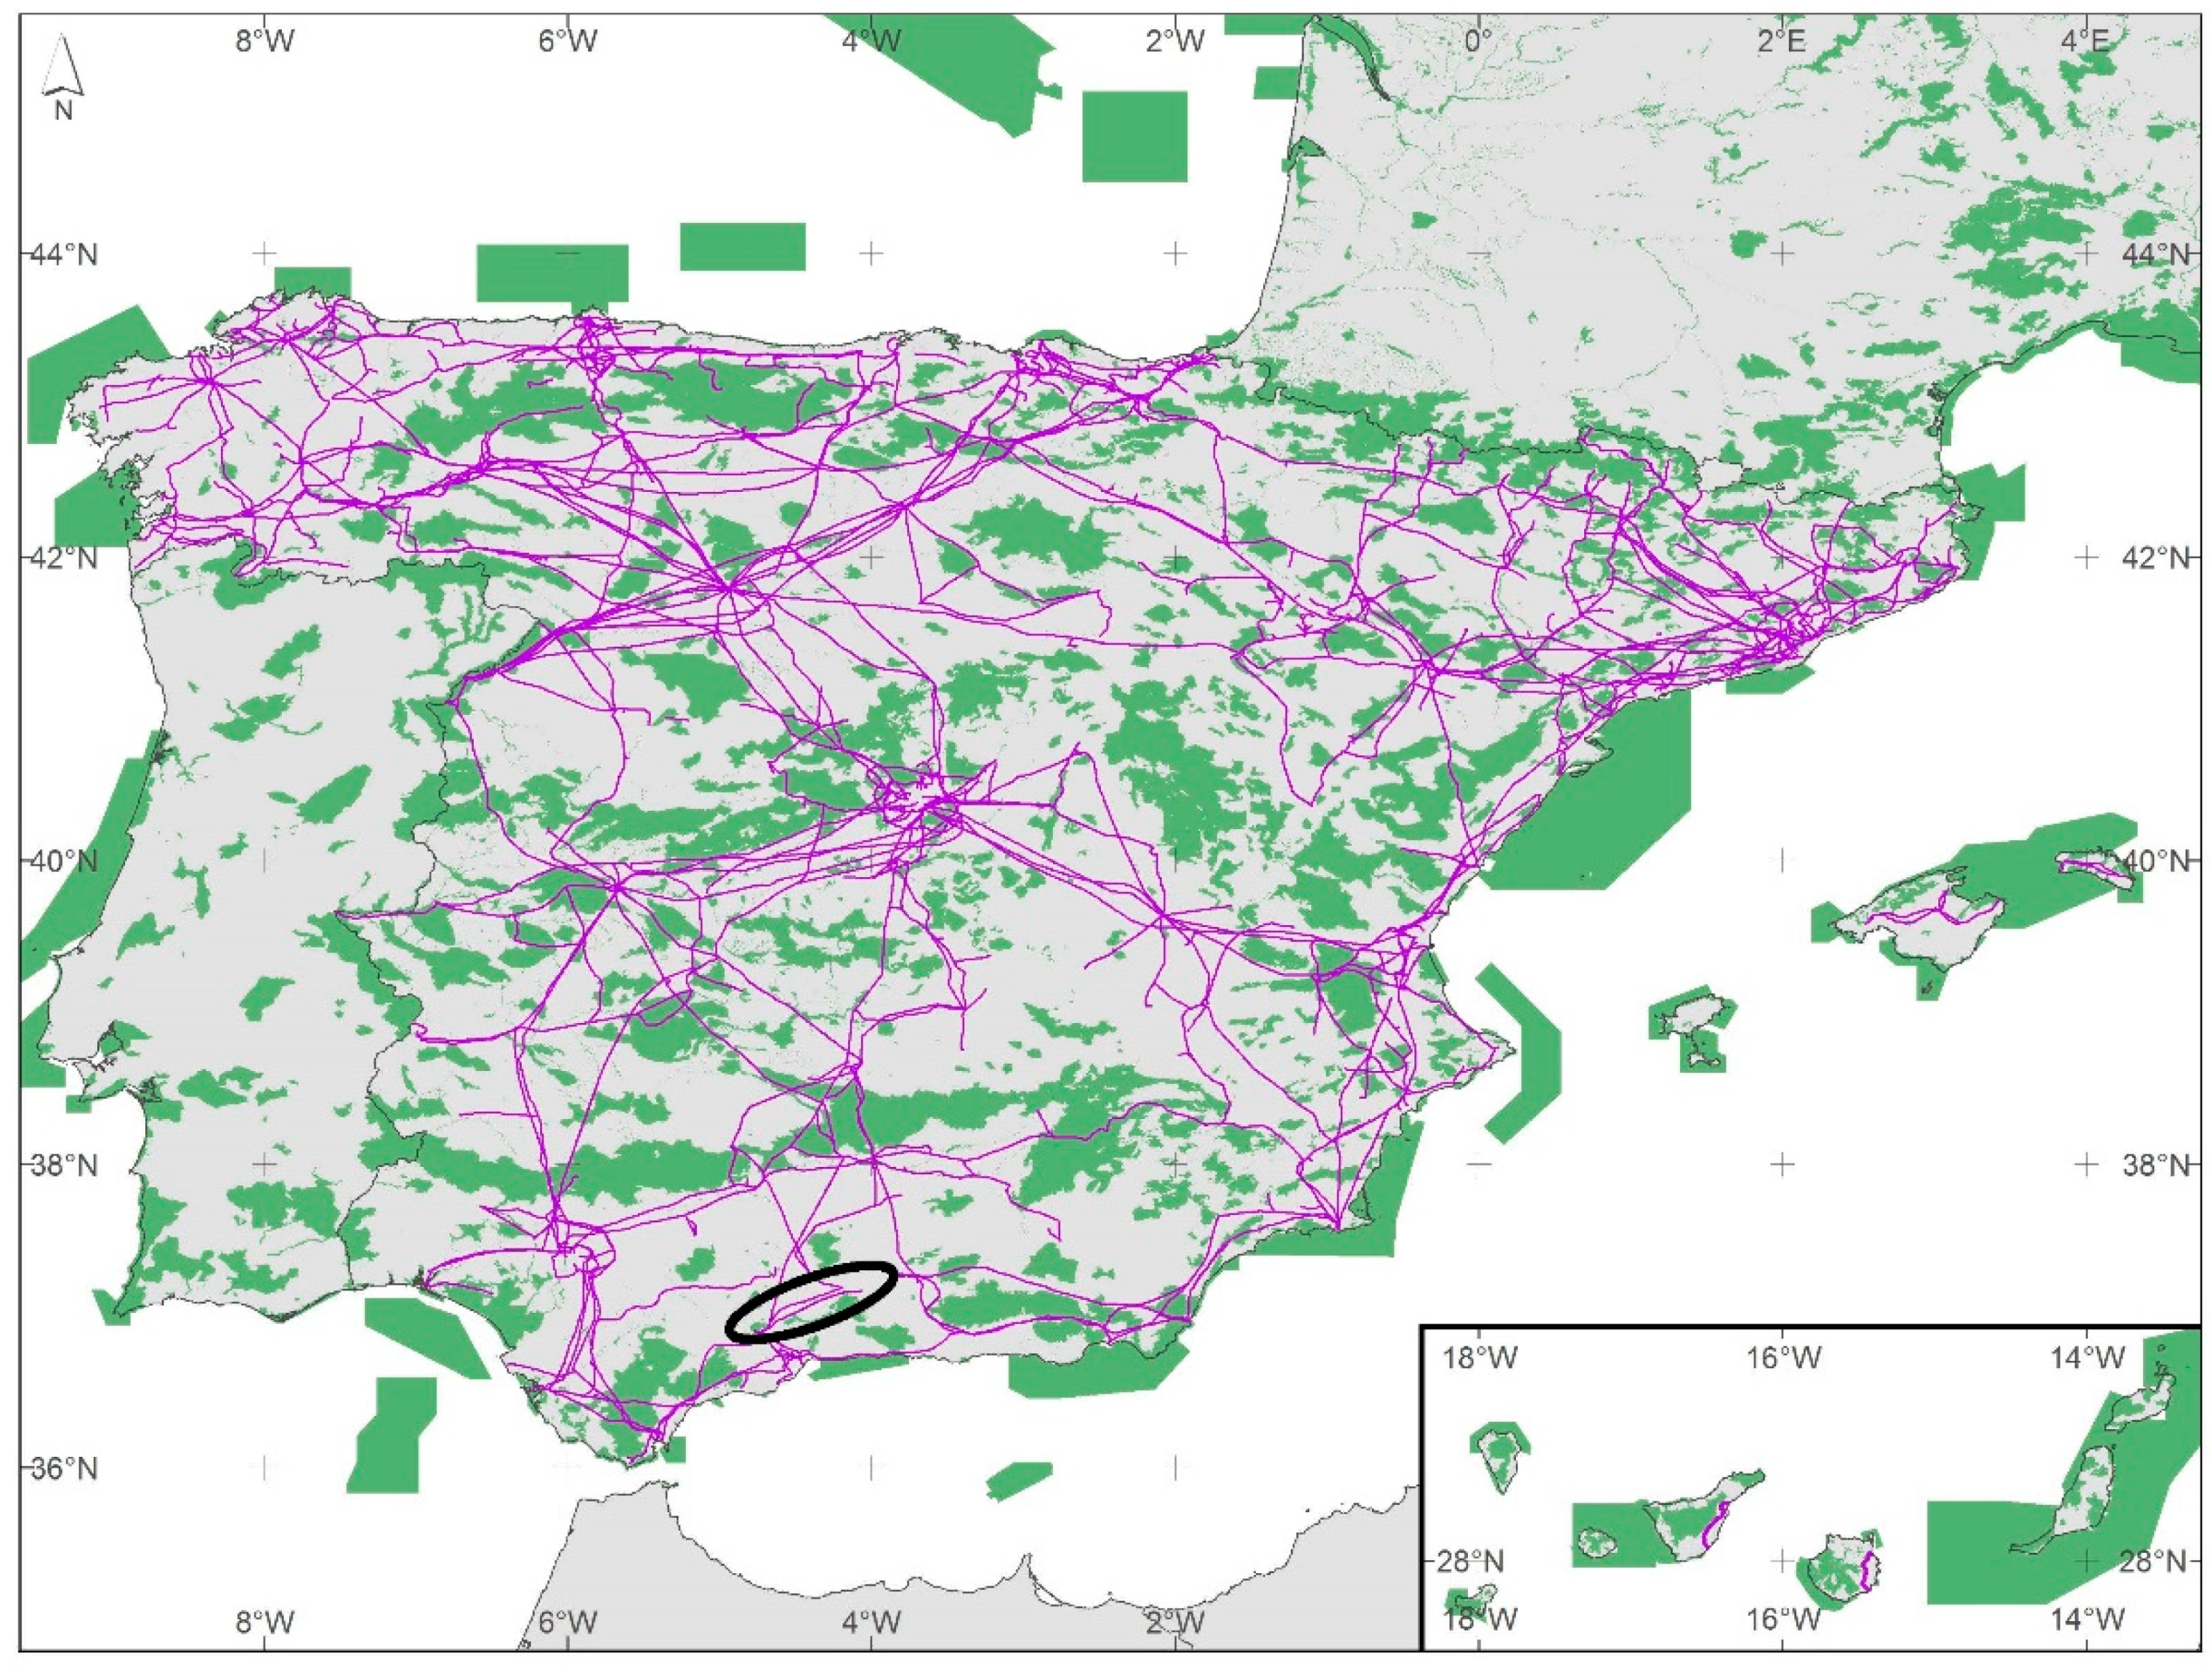
2 in the EU, covering all the country in a network that we can potentially use to connect populations of species with a limited dispersal capacity in fragmented landscapes. Only, in Spain, where the transmission network covers 44,000 km, 15% of the transmission towers are inside the EU Natura 2000 Network (
Figure 2), which practically connects every single natural protected area in the Iberian Peninsula. In the present study, we analysed if managing the habitat located inside the base of the transmission electric towers would increase local richness of target species (i.e., small mammals and some invertebrates’ groups).
2. Materials and Methods
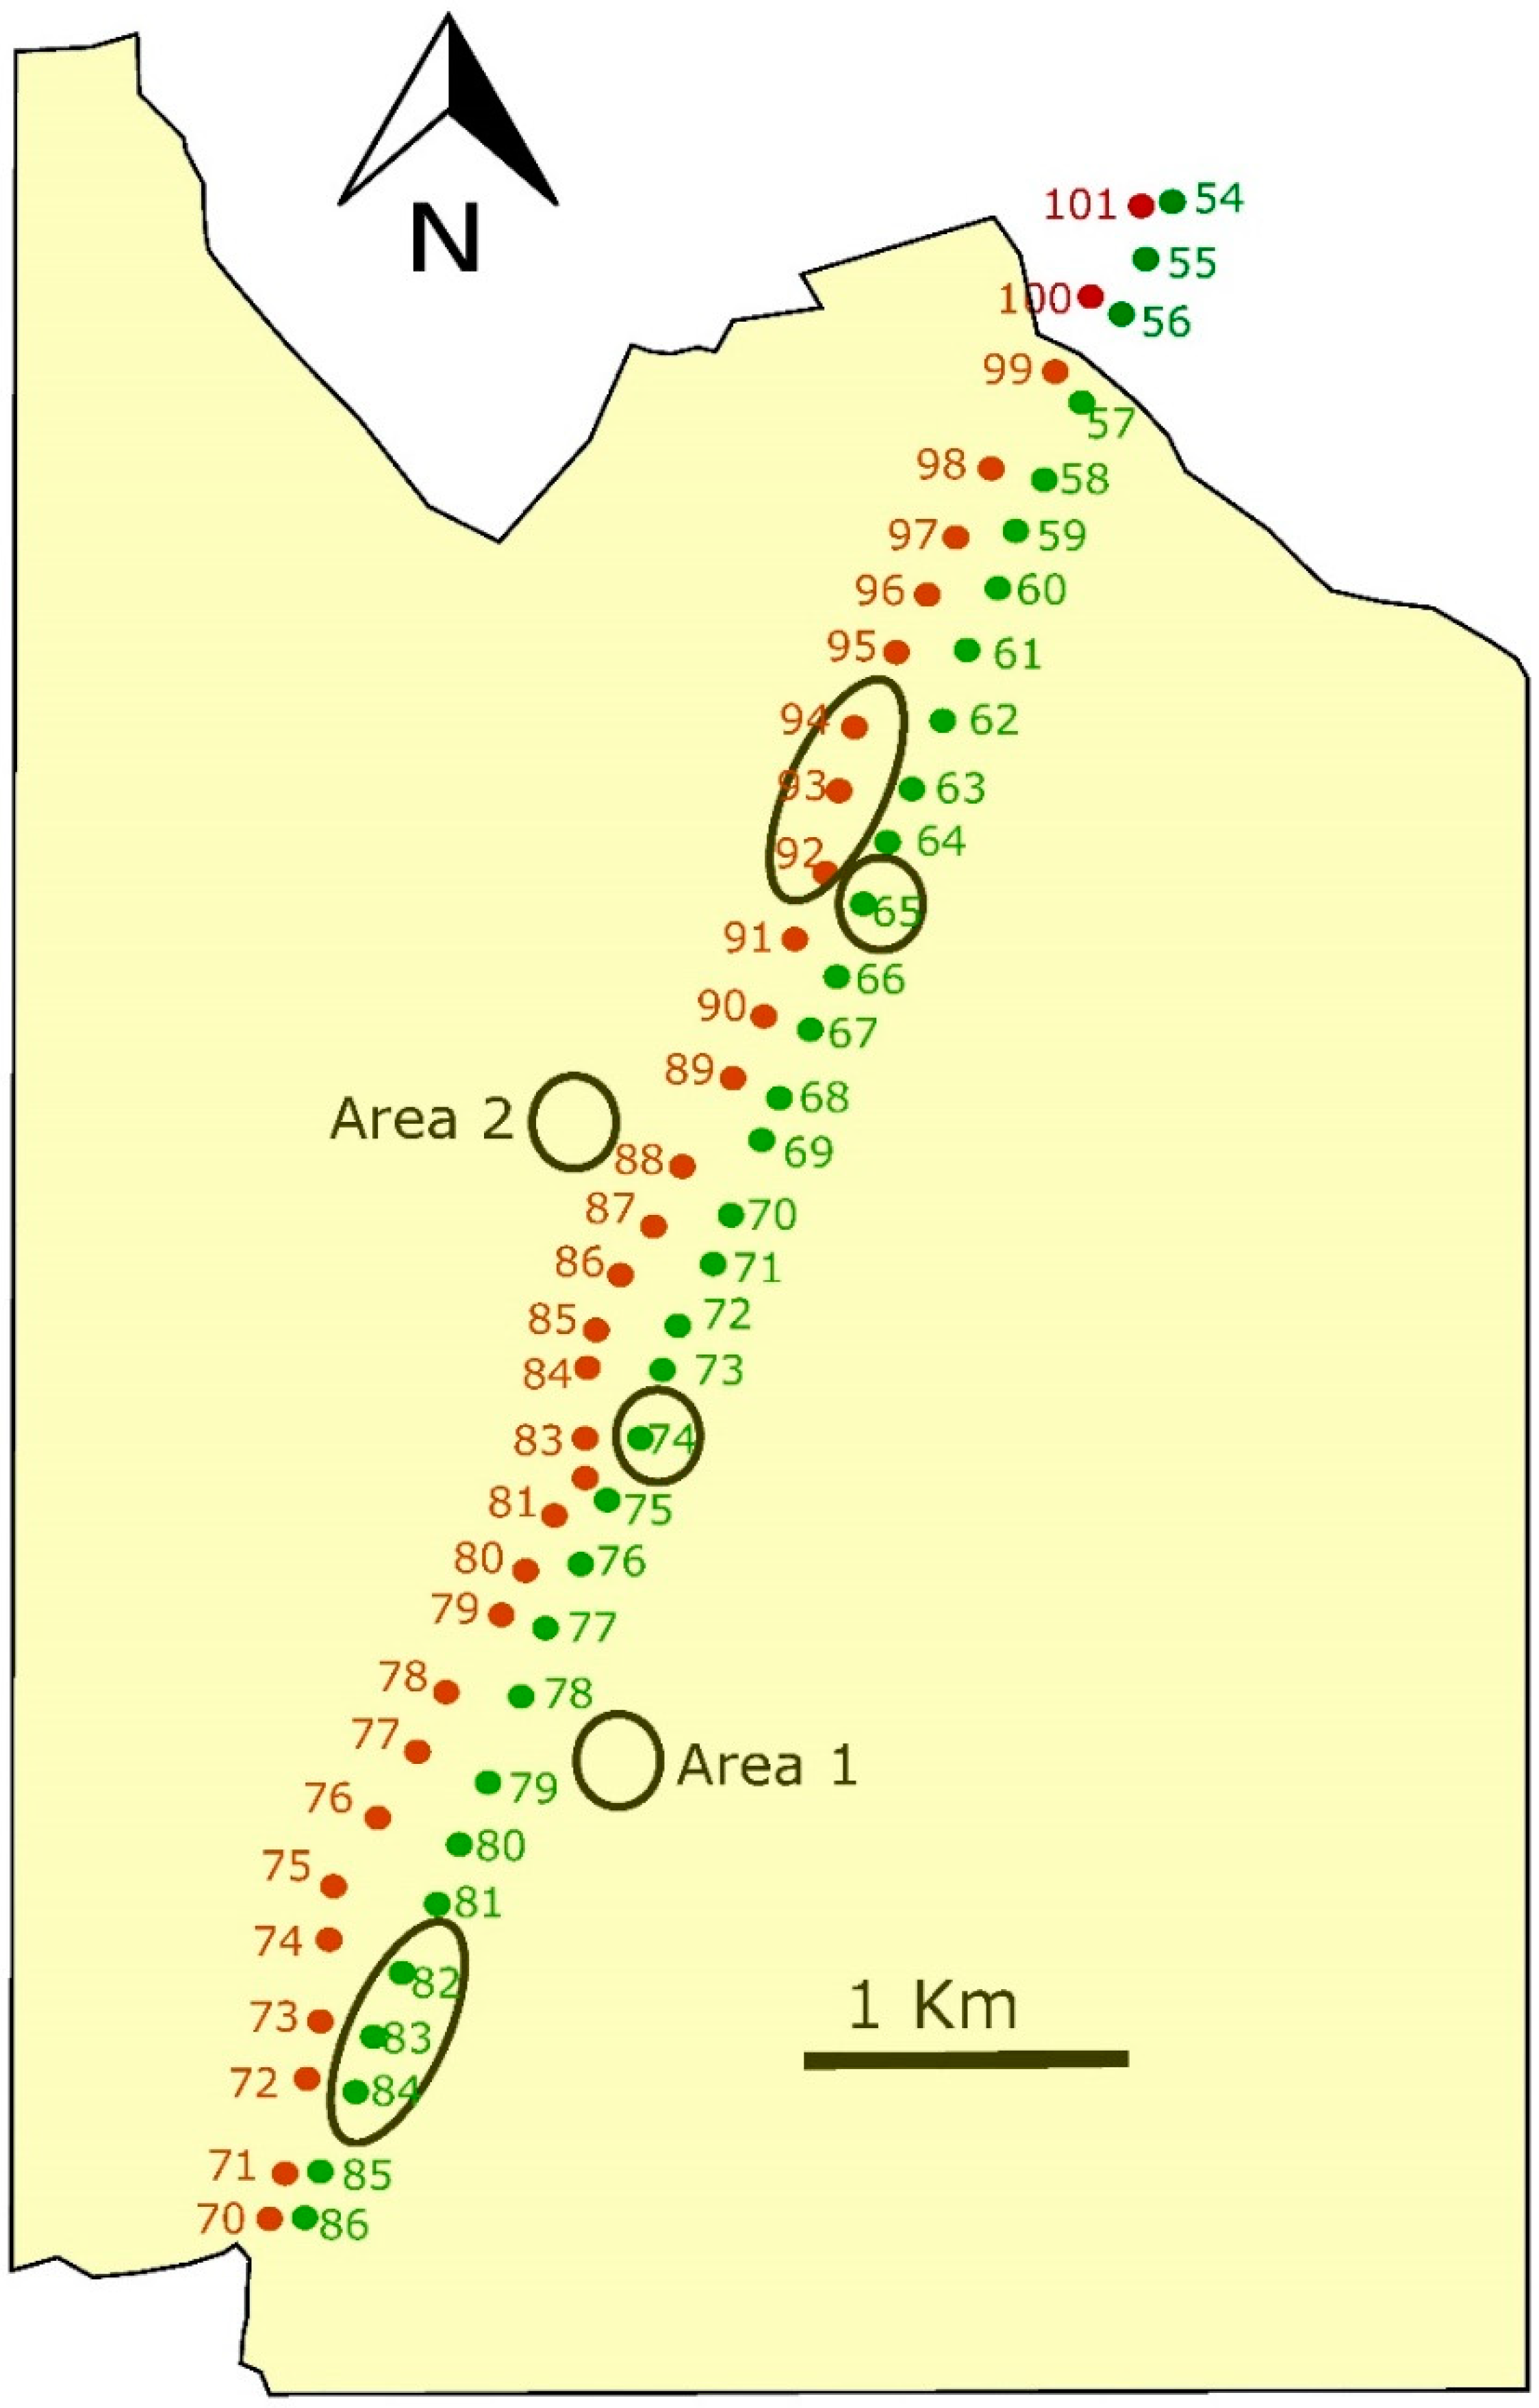
In February 2010, for the experiment, we selected two parallel 400 kV transmission lines located in Andalusia (in Cordoba and Jaen provinces, south of Spain), named the 400 kV Cabra-Guadalquivir Medio line and 400 kV Guadalquivir Medio-Tajo de la Encantada line (
Figure 2). Those transmission lines were separated from each other by 100 m. The area was mainly man-made steppes, occupied by dry cereal crops, with some spotted areas of olive trees and bushes, with a typical Mediterranean climate, characterized by hot and dry summers. We selected a section of 27 km of both lines that cross a large area of cereal steppes. Inside those lines, we selected six transmission towers (three in each one of the parallel transmission lines), to manage the habitat located inside the base of the towers. The managing measures included (1) the provision of refuges to small mammals and invertebrates, with medium to large stones (15 kg on average for each one, accumulating between 50 and 80 units inside each selected tower), and (2) inside the base of these selected towers, we planted seedlings of native shrub of the species
Myrtus communis,
Crataegus monogyna,
Rosa canina,
Rhamnus alaternus,
Phyllirea angustifolia and
Retamas phaerocarpa. We only used the inside of the base of the tower to plant shrub because the surrounding area was intensively used for dry cereal crops. The species of shrub were selected because their native origin and their ability to support local communities of invertebrates. We protected the new plants from herbivores by netting the perimeter of the base of the tower. We provided irrigation during the first four months and survival of the plants was practically 100%.
Additionally, we selected four control sites: the base of two towers without management and two 10 × 10 spots without towers that were 100 m apart from the existing lines (
Figure 3). Vegetation in both types of control sites was mainly grass and short vegetation. Modified towers were inside the pseudo-steppe area, at 1250 m for the border with olive trees and bushes. We conducted samplings from February of 2010, just after plantation and modifications inside the base of the towers, to October 2013, with five sampling days per season each year (80 sampling days in total), in each one of the six modified towers, the two control towers and the two control spots (800 samples in total).
To determine the presence of invertebrates, we used eight pit-fall traps in each sample point over five days each season, collecting the captured dead animals for their identification. We used Sherman traps to determine the presence of small mammals in each sampling site, locating eight traps per tower or control sites over five days per season. We identified the species of each one of the captured individuals, releasing them without any mark at the same capture point. Additionally, we conducted a census of the birds observed in each one of the sampled towers during the same days. We did not mark any individual bird; consequently, potential repeat observations of the same individual were recorded. In this case, we did not include control sites without towers because we only considered birds perching or flying from the tower.
We use Generalized Linear Models (GLM) with Poisson distribution and log link to determine the effect of year, treatment and their interaction on the number of individuals and number of different species trapped, by comparing modified towers and control sites. Statistica 13.0 software statistical package was used to perform statistical procedures, and we used an alpha value of 0.05 to assess significance of results.
Over four years (2010–2013), we were trapping small mammals, arthropods and observing birds in modified and control towers, in two power lines crossing dry cereal crops, a barrier for the dispersal of several species (
Figure 3).
3. Results
In total, 163 micro-mammals belonging to four species were trapped (
Table 1). No differences in frequency of captures in modified towers between both power lines were found (Wald statistic = 0.024,
p = 0.875) nor between the two types of control sites (Wald statistic = 0.125,
p = 0.722).
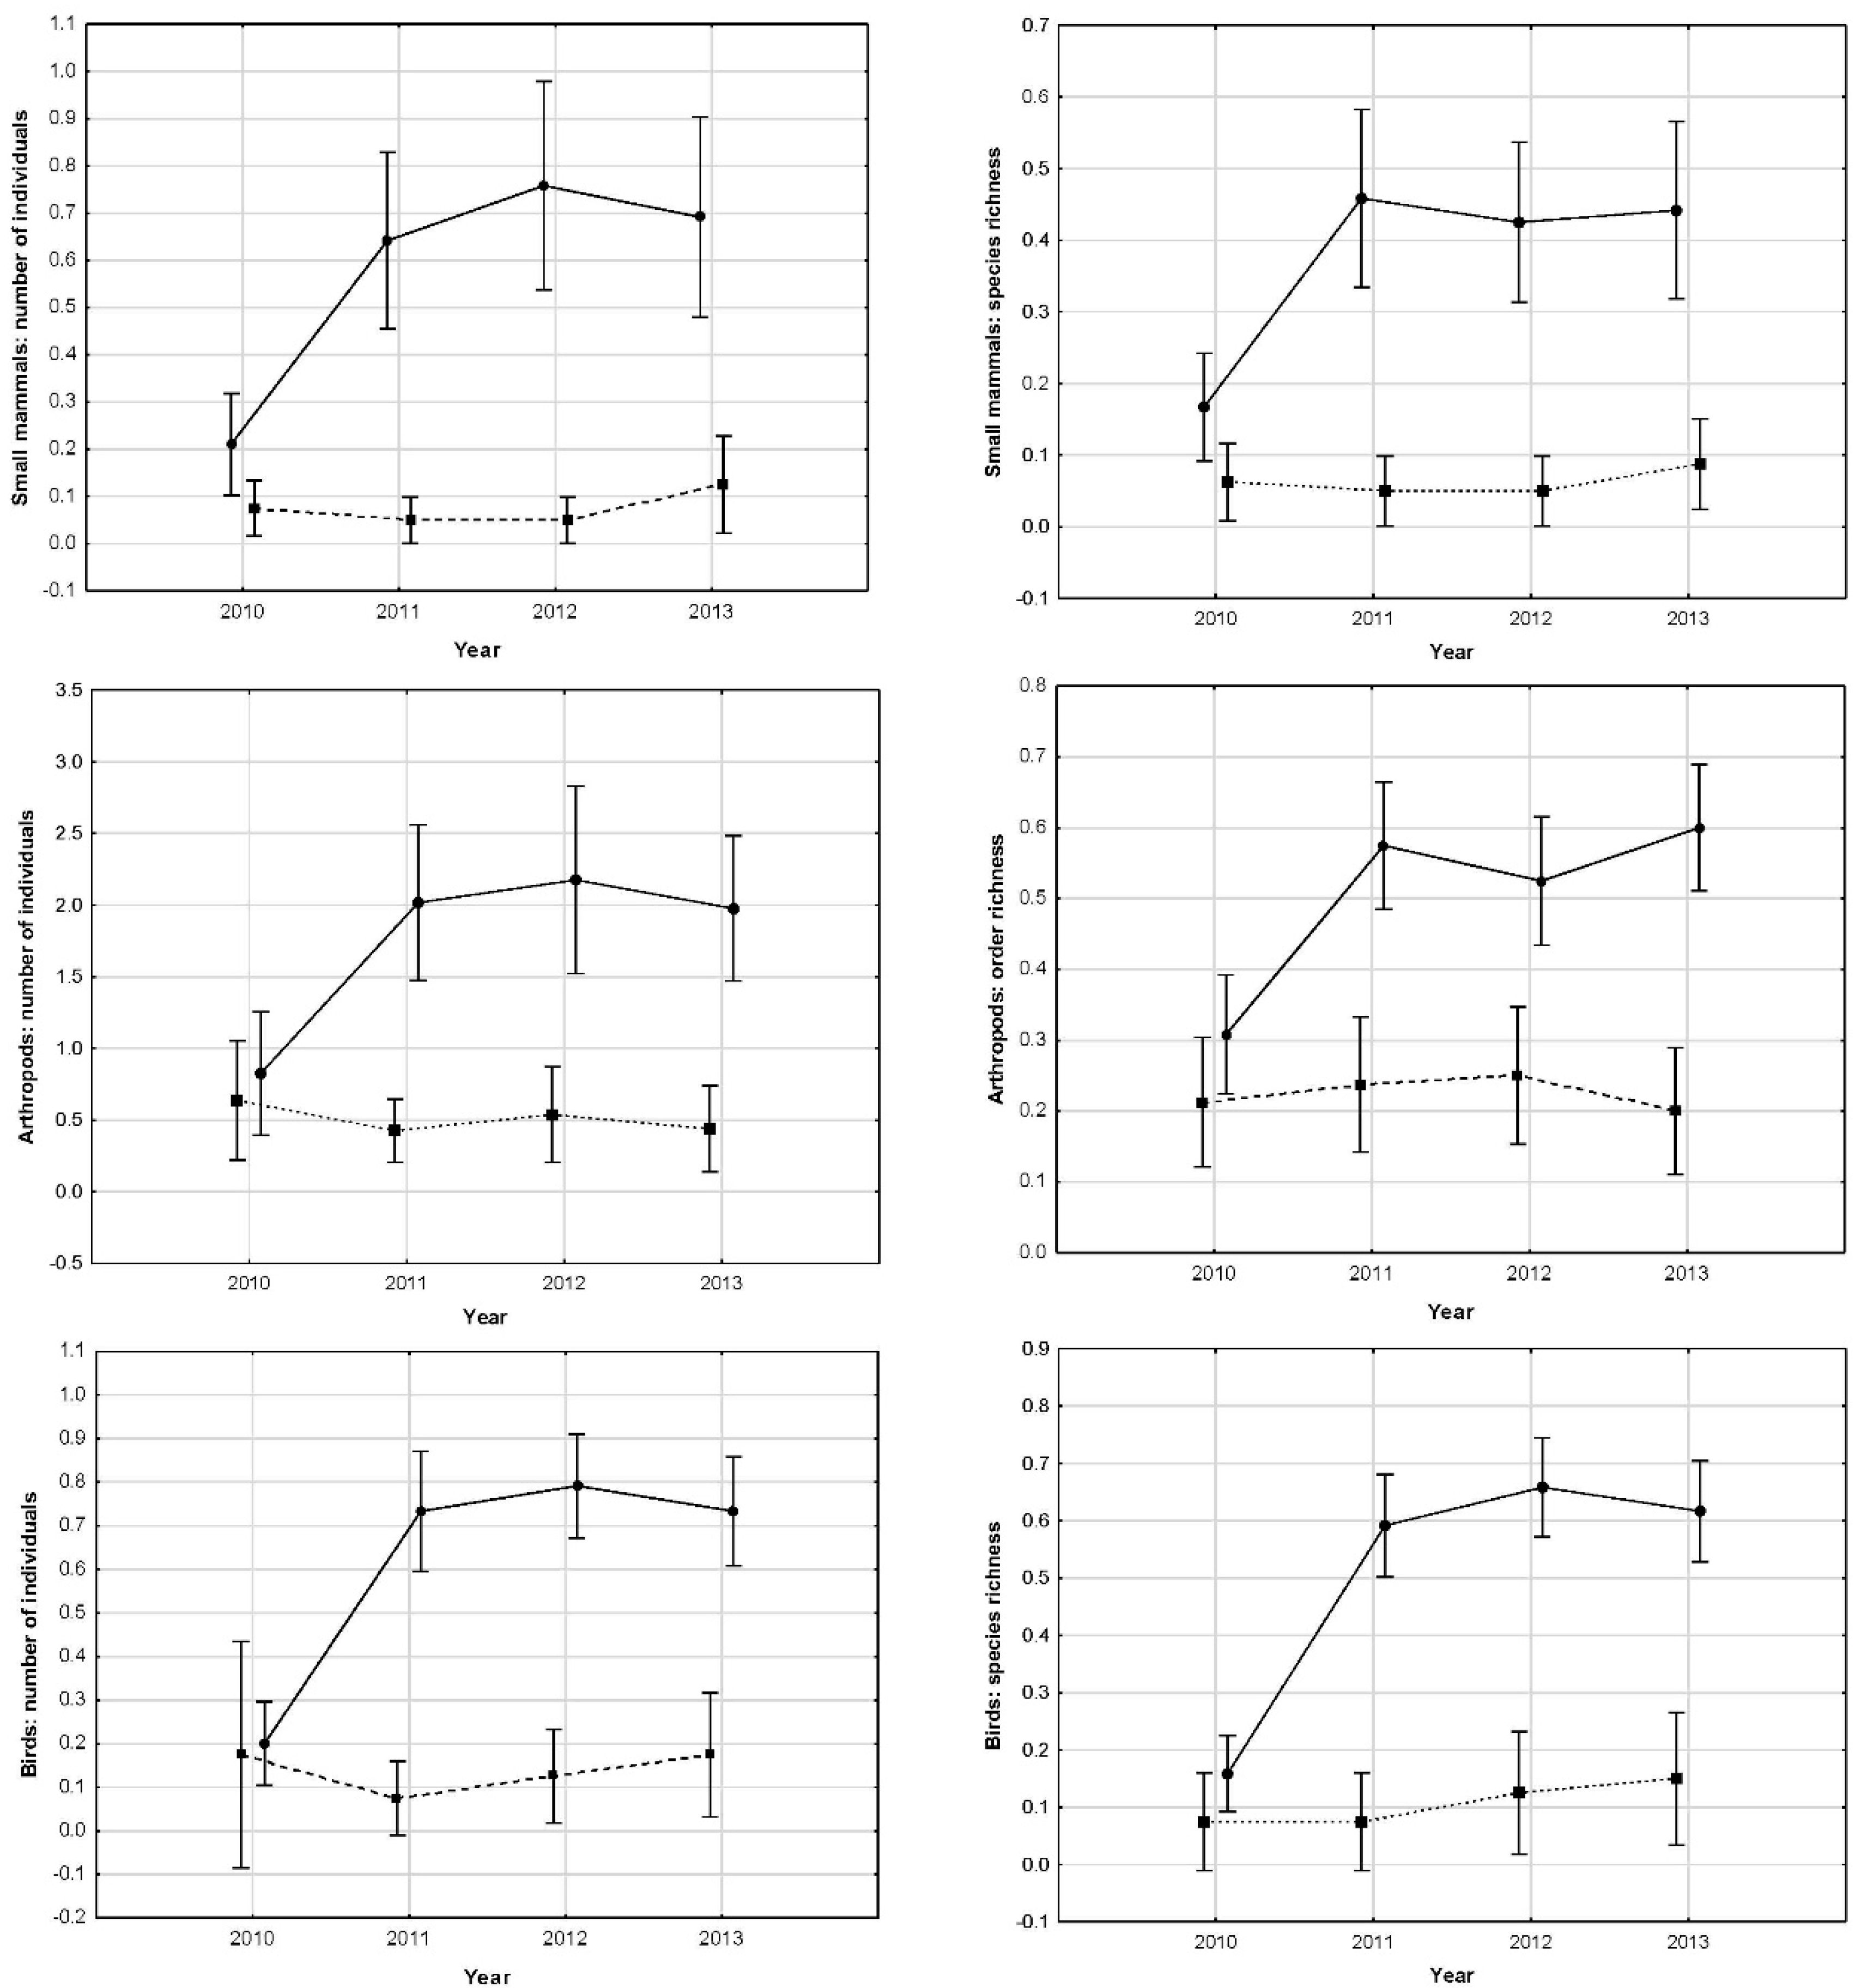
We found a significant effect of the treatment, time and their interaction (
Table 2), with number of individuals of small mammal being ten times higher in modified tower bases than in control sites. These differences emerged one year after the treatment, staying until the end of the experiment (
Figure 4). After removing the first year from analyses, no differences among years in modified towers were found (Wald statistic = 1.17,
p = 0.555), showing that the mean number of captured individuals remained stable after the significant increases experimented during the first year. In control sites, no differences among the 4-year study were found (Wald statistic = 3.77,
p = 0.286). Not only number of trapped individuals but also species richness was significantly affected by modifications in the base of the towers (Wald statistic = 50.95,
p < 0.0001), finding 9 times more different species in modified towers than in control sites.
A total of 313 invertebrates of eight different orders were captured during the study period (
Table 1). Again, no differences in frequency of captures in modified towers between the studied power lines were found (Wald statistic = 0.102,
p = 0.801) nor between control sites (Wald statistic = 0.895,
p = 0.886). We found a significant effect of treatment, time and their interaction (
Table 2), with captured invertebrates being four times higher in modified tower bases than in control sites. These differences appeared one year after the treatment, remaining significant until the end of the experiment (
Figure 4). Removing the first year from analyses, no differences among years in the modified tower were found (Wald statistic = 1.29,
p = 0.522), showing that the mean number of captured individuals remains stable after the significant increases experimented during the first year. In control sites, no differences among the 4-year study were found (Wald statistic = 4.58,
p = 0.204). Orders’ richness was significantly higher in modified tower bases than in control sites (Wald statistic = 32.487,
p < 0.0001), with three times more orders found in modified ones.
We observed 260 individuals of 23 different species of birds perching on the towers (
Table 1). Highly significant effects of treatment, time and their interactions were found again (
Table 2), with observed birds being 7.5 times higher in modified towers than in control ones. These differences follow the same pattern as in invertebrates and micro-mammals, arising one year after the treatment and staying significant until the end of the experiment (
Figure 4). Removing the first year from analyses, no differences among years in modified towers were found (Wald statistic = 0.36,
p = 0.834), showing that the mean number of birds observed remains stable after the significant increase experimented during the first year. In control sites, no differences among the 4-year study were found (Wald statistic = 1.90,
p = 0.591). Again, treatment significantly increased the species richness, with 6 times more different species in modified towers (Wald statistic = 30.780,
p < 0.0001) than in control towers (
Figure 4).
4. Discussion
We did not find any difference in modified towers between the two power lines, nor among control sites, allowing us to directly compare among treatments. At the beginning of the experiment, all the towers and the two control spots showed similar values in number of individuals and diversity of small mammals, invertebrates and in birds perching. But one year after the modification in the tower bases, all these measured parameters increased significantly in modified towers remaining thereafter, however control sites remained at the same low values all throughout the following three years of the study. Consequently, modifications implemented at the base of the towers increased local species richness in a significant way and maintained these higher levels during the whole study period without any further intervention. In modified towers, all differences among years were due to differences between the first and second years. Indeed, there were no differences in any of the studied animal groups among 2–3–4 study years, but very significant between 1 and 2 years. In control sites, no differences among any year of the entire period were found, with all remaining in the same low values throughout the experiment. A decrease in captures at the control sites would be expected if small mammals and invertebrates moved from non-modified towers to modified ones, inducing decreases in the former. This did not happen, suggesting that individuals trapped in modified towers were coming from some other places. A potential explanation would be that they were moving mainly from nearby olive trees and bush areas, and taking into account the distance from modified towers to the border of the fragmentation (the end of the dry cereal crops and beginning of olive trees and bushes, see
Figure 3). All the study groups seem to have been able to move at least at 1.25 km yr
−1, and this dispersal speed would be around three times faster than the current estimation for climate change velocity [
14] (0.42 km yr
−1).
Among invertebrates, some of the orders comprise species that are mainly seed-dispersers and pollinizers, included among what we consider species providing ecosystem services, with a huge influence in ecosystems’ functionality. Thus, with adequate refuge and nidification structures, tower transmission lines could increase pollination and seed dispersal in large areas, and, what is more important, it could facilitate connectivity among fragmented habitats.
Bird numbers were also affected by tower base modifications. Presumably, increases in number of invertebrates and small mammals after modifications could facilitate the increase of bird numbers. The increase in bird numbers might affect potential risks, like bird collisions against power wires. Bird mortality caused by collisions with power lines is well known [
22,
23,
24]. Nevertheless, species attracted to the modified tower in this experiment were not included among those more prone to collisions [
24] and, in any case, effective systems to mitigate collision risk have been developed during the last 20 years [
23], achieving reductions as important as 81%. To mark ground wires in modified lines would be a good suggestion, because making the cables more visible to birds seems the most appropriate method for mitigating mortality. Bird diverter devices have been developed to improve power line visibility for birds, thus reducing collision risk [
23].
Our experiment showed that by modifying the base of the towers we were able to increase density and diversity of several species of invertebrates and small mammals and, probably as a response to that, bird species and numbers. Nevertheless, we can design different kinds of modifications at the base of the towers to favour different target animals. For example, the presence of points of water would facilitate amphibian movements though the power lines. Amphibians are among the groups most affected by global warming and landscape fragmentation [
25]. Installing structures to facilitate bumblebees, bees or other pollinizer nesting would enhance their dispersion. A relevant effect of power lines in seed dispersal by birds has been previously reported, showing that electricity pylons may play an important role in the succession of fleshy-fruited shrubs and trees in intensive farmland [
26,
27].
The cost of implementing modifications used in this experiment was around 450 Euros per tower. That means that to build up a network of potential stepping-stones would cost around 1700 Euros per Km, with no maintenance costs after implementation. However, for this purpose, it is not necessary to adapt all the towers of a line, but just those that surpass barriers fragmenting the landscape for the target species in each case. The property of the base of the tower depends on the country and power company policies. However, generally speaking, the power company usually pays a rent to the owner for the right of use. Typically, owners of the land, due to difficulties to work the area inside the towers with farm equipment, do not use this space. This situation facilitates the use of these bases for other purposes, like to increase local biodiversity and to connect populations without any additional rent cost to the power company. However, in some places in Europe, space under the power lines would be intensively used by humans (like parking places, landfills etc.), making their use difficult.
As far as we know, this is the first time that the potential of the transmission network to preserve biodiversity has been evaluated. Our results suggest the huge potential of the power transmission lines network to be adapted as stepping-stones for small fauna. Modifying the base of the electric towers would allow not only to increase local biodiversity but also to connect fragmented populations. Transmission lines are widespread, especially in developed countries—exactly the same places where habitats’ fragmentation due to land use changes is greater—making it possible for the first time to build up a continental scale network of connectivity for limited dispersal animals.


