Article

Competitive Interactions of Flowering Rush (Butomus umbellatus L.) Cytotypes in Submersed and Emergent Experimental Aquatic Plant Communities

US Army Engineer Research and Development Center, Aquatic Ecology and Invasive Species Branch, Vicksburg, MS 39180-6199, USA
Diversity 2020, 12(1), 40; https://doi.org/10.3390/d12010040
Submission received: 10 December 2019 / Revised: 6 January 2020 / Accepted: 16 January 2020 / Published: 20 January 2020
(This article belongs to the Special Issue Ecology of Invasive Aquatic Plants)

Abstract

:
The ability to invade communities in a variety of habitats (e.g., along a depth gradient) may facilitate establishment and spread of invasive plants, but how multiple lineages of a species perform under varying conditions is understudied. A series of greenhouse common garden experiments were conducted in which six diploid and four triploid populations of the aquatic invasive plant Butomus umbellatus L. (Butomaceae) were grown in submersed or emergent conditions, in monoculture or in a multispecies community, to compare establishment and productivity of cytotypes under competition. Diploid biomass overall was 12 times higher than triploids in the submersed experiment and three times higher in the emergent experiment. Diploid shoot:root ratio was double that of triploid plants in submersed conditions overall, and double in emergent conditions in monoculture. Relative interaction intensities (RII) indicated that triploid plants were sixteen times more negatively impacted by competition under submersed conditions but diploid plants were twice as impacted under emergent conditions. Recipient communities were similarly negatively impacted by B. umbellatus cytotypes. This study supports the idea that diploid and triploid B. umbellatus plants are equally capable of invading emergent communities, but that diploid plants may be better adapted for invading in submersed habitats. However, consistently lower shoot:root ratios in both monoculture and in communities suggests that triploid plants may be better-adapted competitors in the long term due to increased resource allocation to roots. This represents the first examination into the role of cytotype and habitat on competitive interactions of B. umbellatus.

1. Introduction

Aquatic invasive species generate environmental and economic harm through their negative impacts on navigation [1], angling [2,3], water supply and alteration of historical hydrology [4], increased sedimentation [5], reduced habitat quality for wildlife [6,7], property values [8], and displacement of native species [1]. Furthermore, many of these impacts are expected to increase in the future with climate change [9,10]. Given their negative impacts on economies and environments, considerable and high-profile focus has been placed on quantifying such impacts [2,9,11,12], predicting future invaders through development of trait-based frameworks [13,14,15,16], preventing establishment and subsequent impacts through policy and regulatory actions [17,18,19], and developing effective management to contain or reverse negative impacts in recipient communities [20,21,22,23].
The characteristics of introduced species and recipient communities that contribute to establishment and spread of invaders has been an active area of research for a few decades, with considerable effort put towards an understanding of the role of biotic resistance (i.e., negative effects of herbivory, disease, and/or competition from the receiving community on an invader) to successful invasion [24,25,26,27,28,29,30]. Resident plant species can reduce the likelihood of plant invader success through direct or indirect competition, or spillover of herbivores or disease [31,32]. Community characteristics such as species composition, functional and/or phylogenetic similarity or difference, diversity, productivity, and resident competitive traits may all be important in preventing or limiting negative impacts by plant invaders [28,33,34,35,36]. In fact, this has been used in restoration projects to prevent further invasion [27,37,38]. Spatial heterogeneity in biotic resistance may also be considerable if the invader is phenotypically plastic in response to environmental conditions or potential competitors or natural enemies vary at multiple spatial scales [24,39,40,41,42].
Increased plasticity to environmental gradients is a trait thought to benefit many invaders through adaptation to a range of conditions they may experience in the new range [43,44,45]. Plasticity may be particularly important if the invader displays greater plasticity than members of the invaded community [30]. For example, in an examination of twelve salt marsh plant species plasticity to environmental variation was important for success of plants, but that species varied in their responses to the different environmental variables that were measured [43]. In freshwater systems, plasticity of an invader to a range of inundation regimes may be beneficial in habitats that periodically flood or dry out [46]. Ability to withstand periodic flooding or drought is a trait that will be increasingly important under future climate regimes as variability of regional precipitation increases from historical averages [47].
Often, plant invasions occur over a long time and over large areas, with multiple introductions from various source populations. This can lead to genetic structure in the introduced range [48,49,50]. Additional genetic variation occurs through hybridization between introduced lineages or native and introduced lineages, or post-introduction evolution (adaptive or neutral) [51,52,53]. The importance of genetic variation in invasive plants has received considerable attention and has a number of implications for effective prevention and management of nuisance species [54,55,56]. With regards to the interaction between genetic variation and plasticity to environmental gradients such as water level, there has been limited examination. Additionally, there are no examples in which plasticity to water depth was paired with biotic resistance to investigate importance of genetic variation in a species for successful invasion.
Establishment and productivity of an invader in response to interspecific competition in two habitat types (submerged, emergent) was explored to better understand success of the wetland invasive species, Butomus umbellatus L. (Butomaceae) (flowering rush) in North America. Previous observations have indicated that diploid plants more commonly inhabit shallow, emergent habitats whereas triploid plants are commonly found in deeper submerged habitats (Madsen et al. 2016; Appendix A) and also that triploid plants were more efficient at resource (i.e., nutrients) use [57]. Therefore, expectations of this work were that triploid plants would be better competitors than diploid plants when grown submerged but, due to a lack of previous work in this system, the performance of cytotypes in emergent conditions was not predicted.

2. Materials and Methods
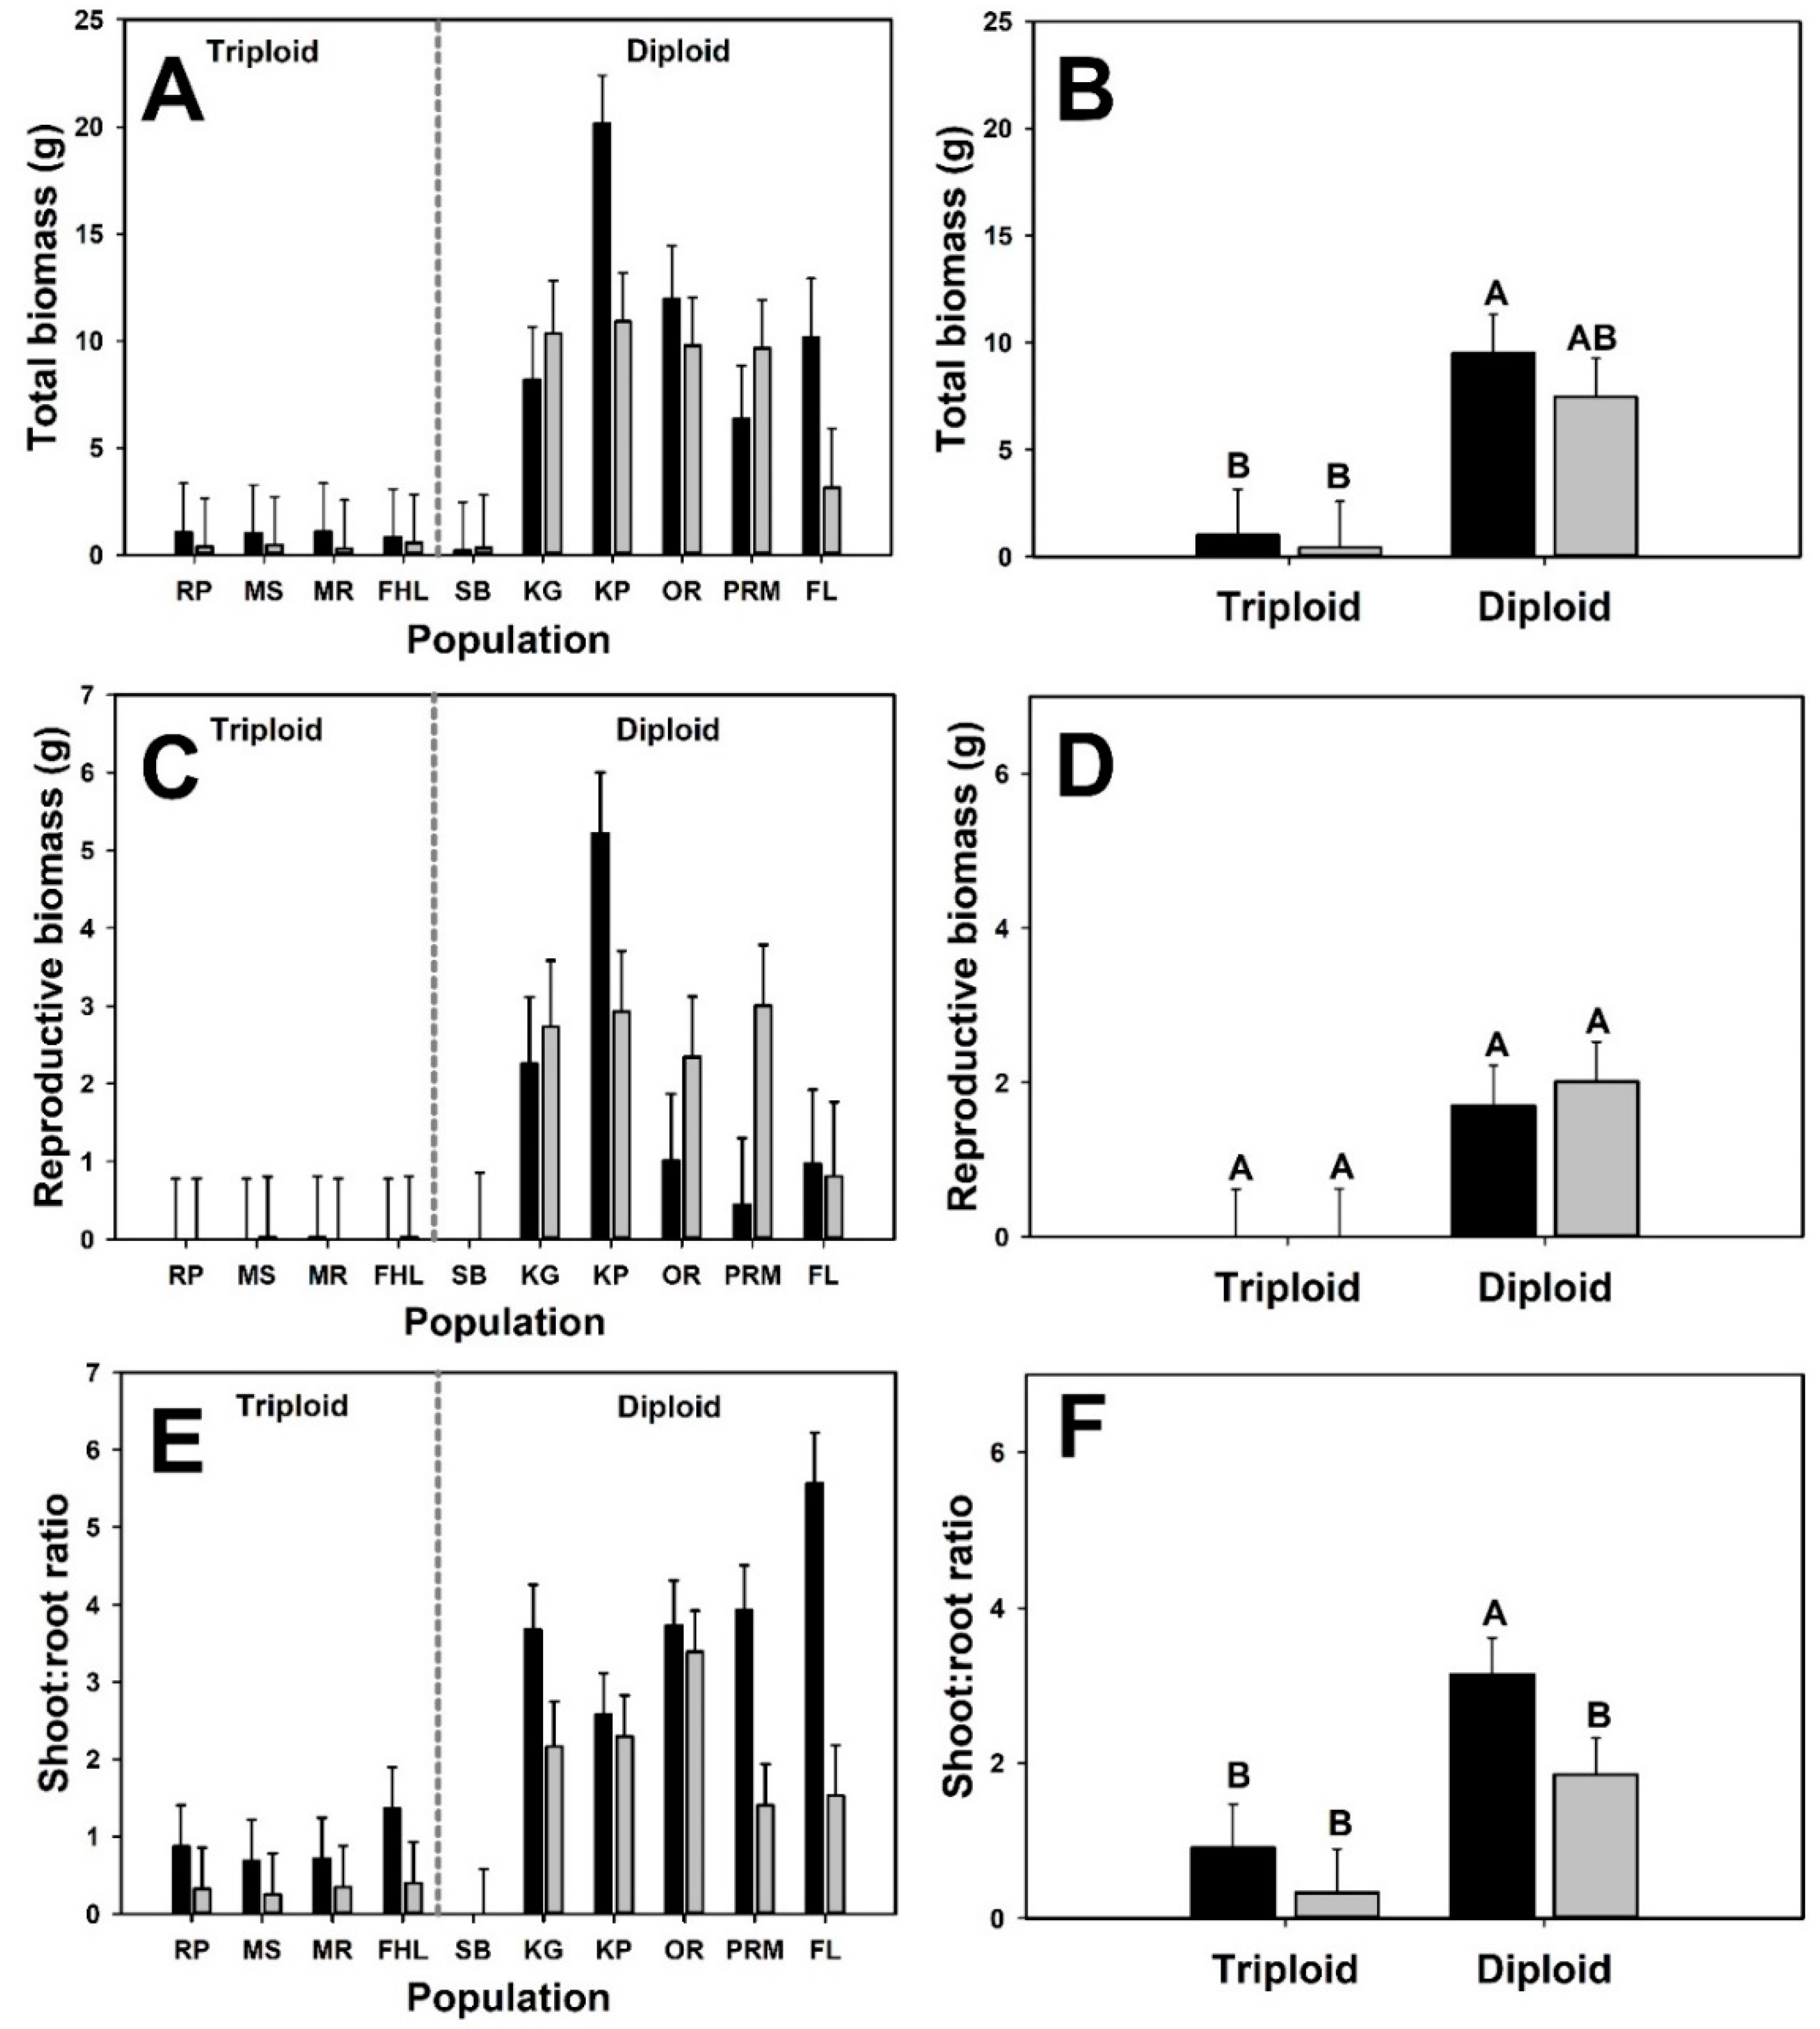
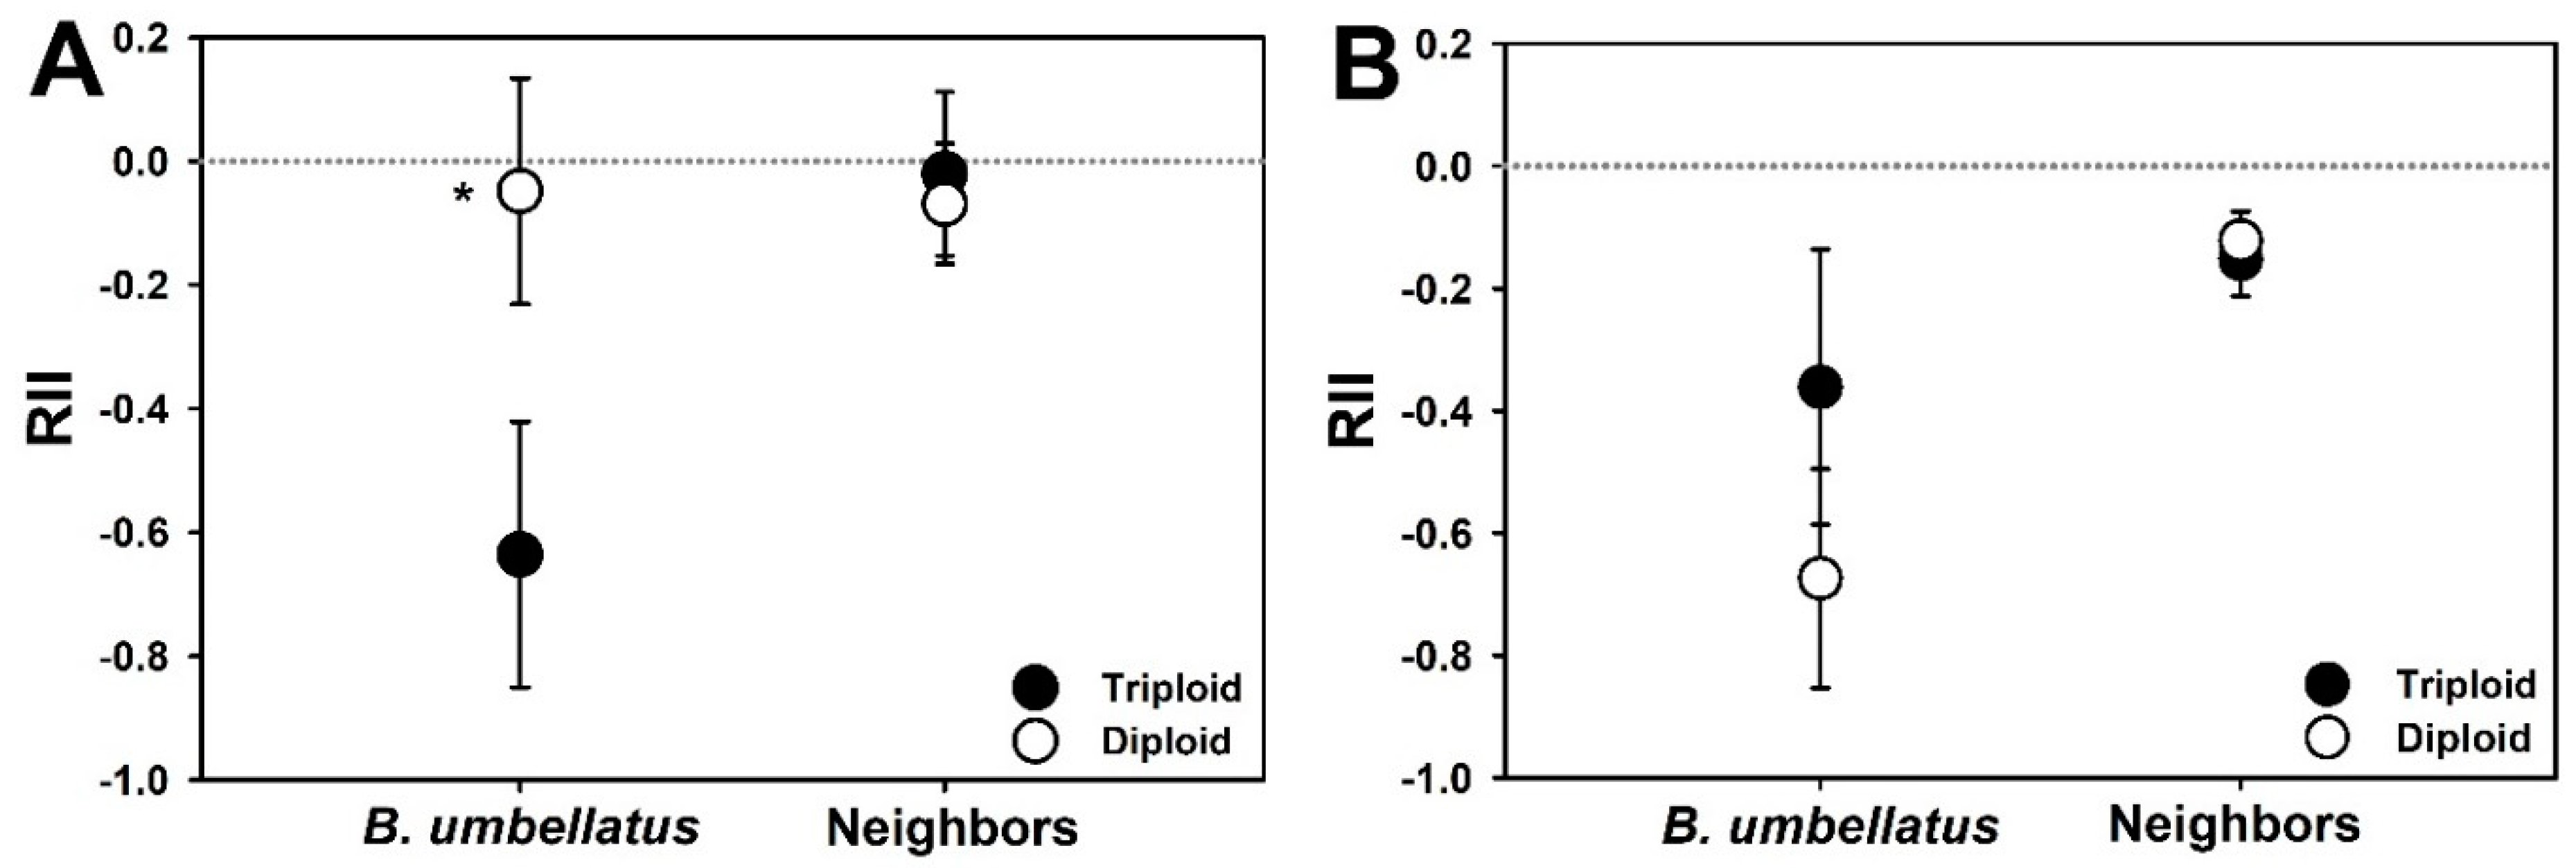
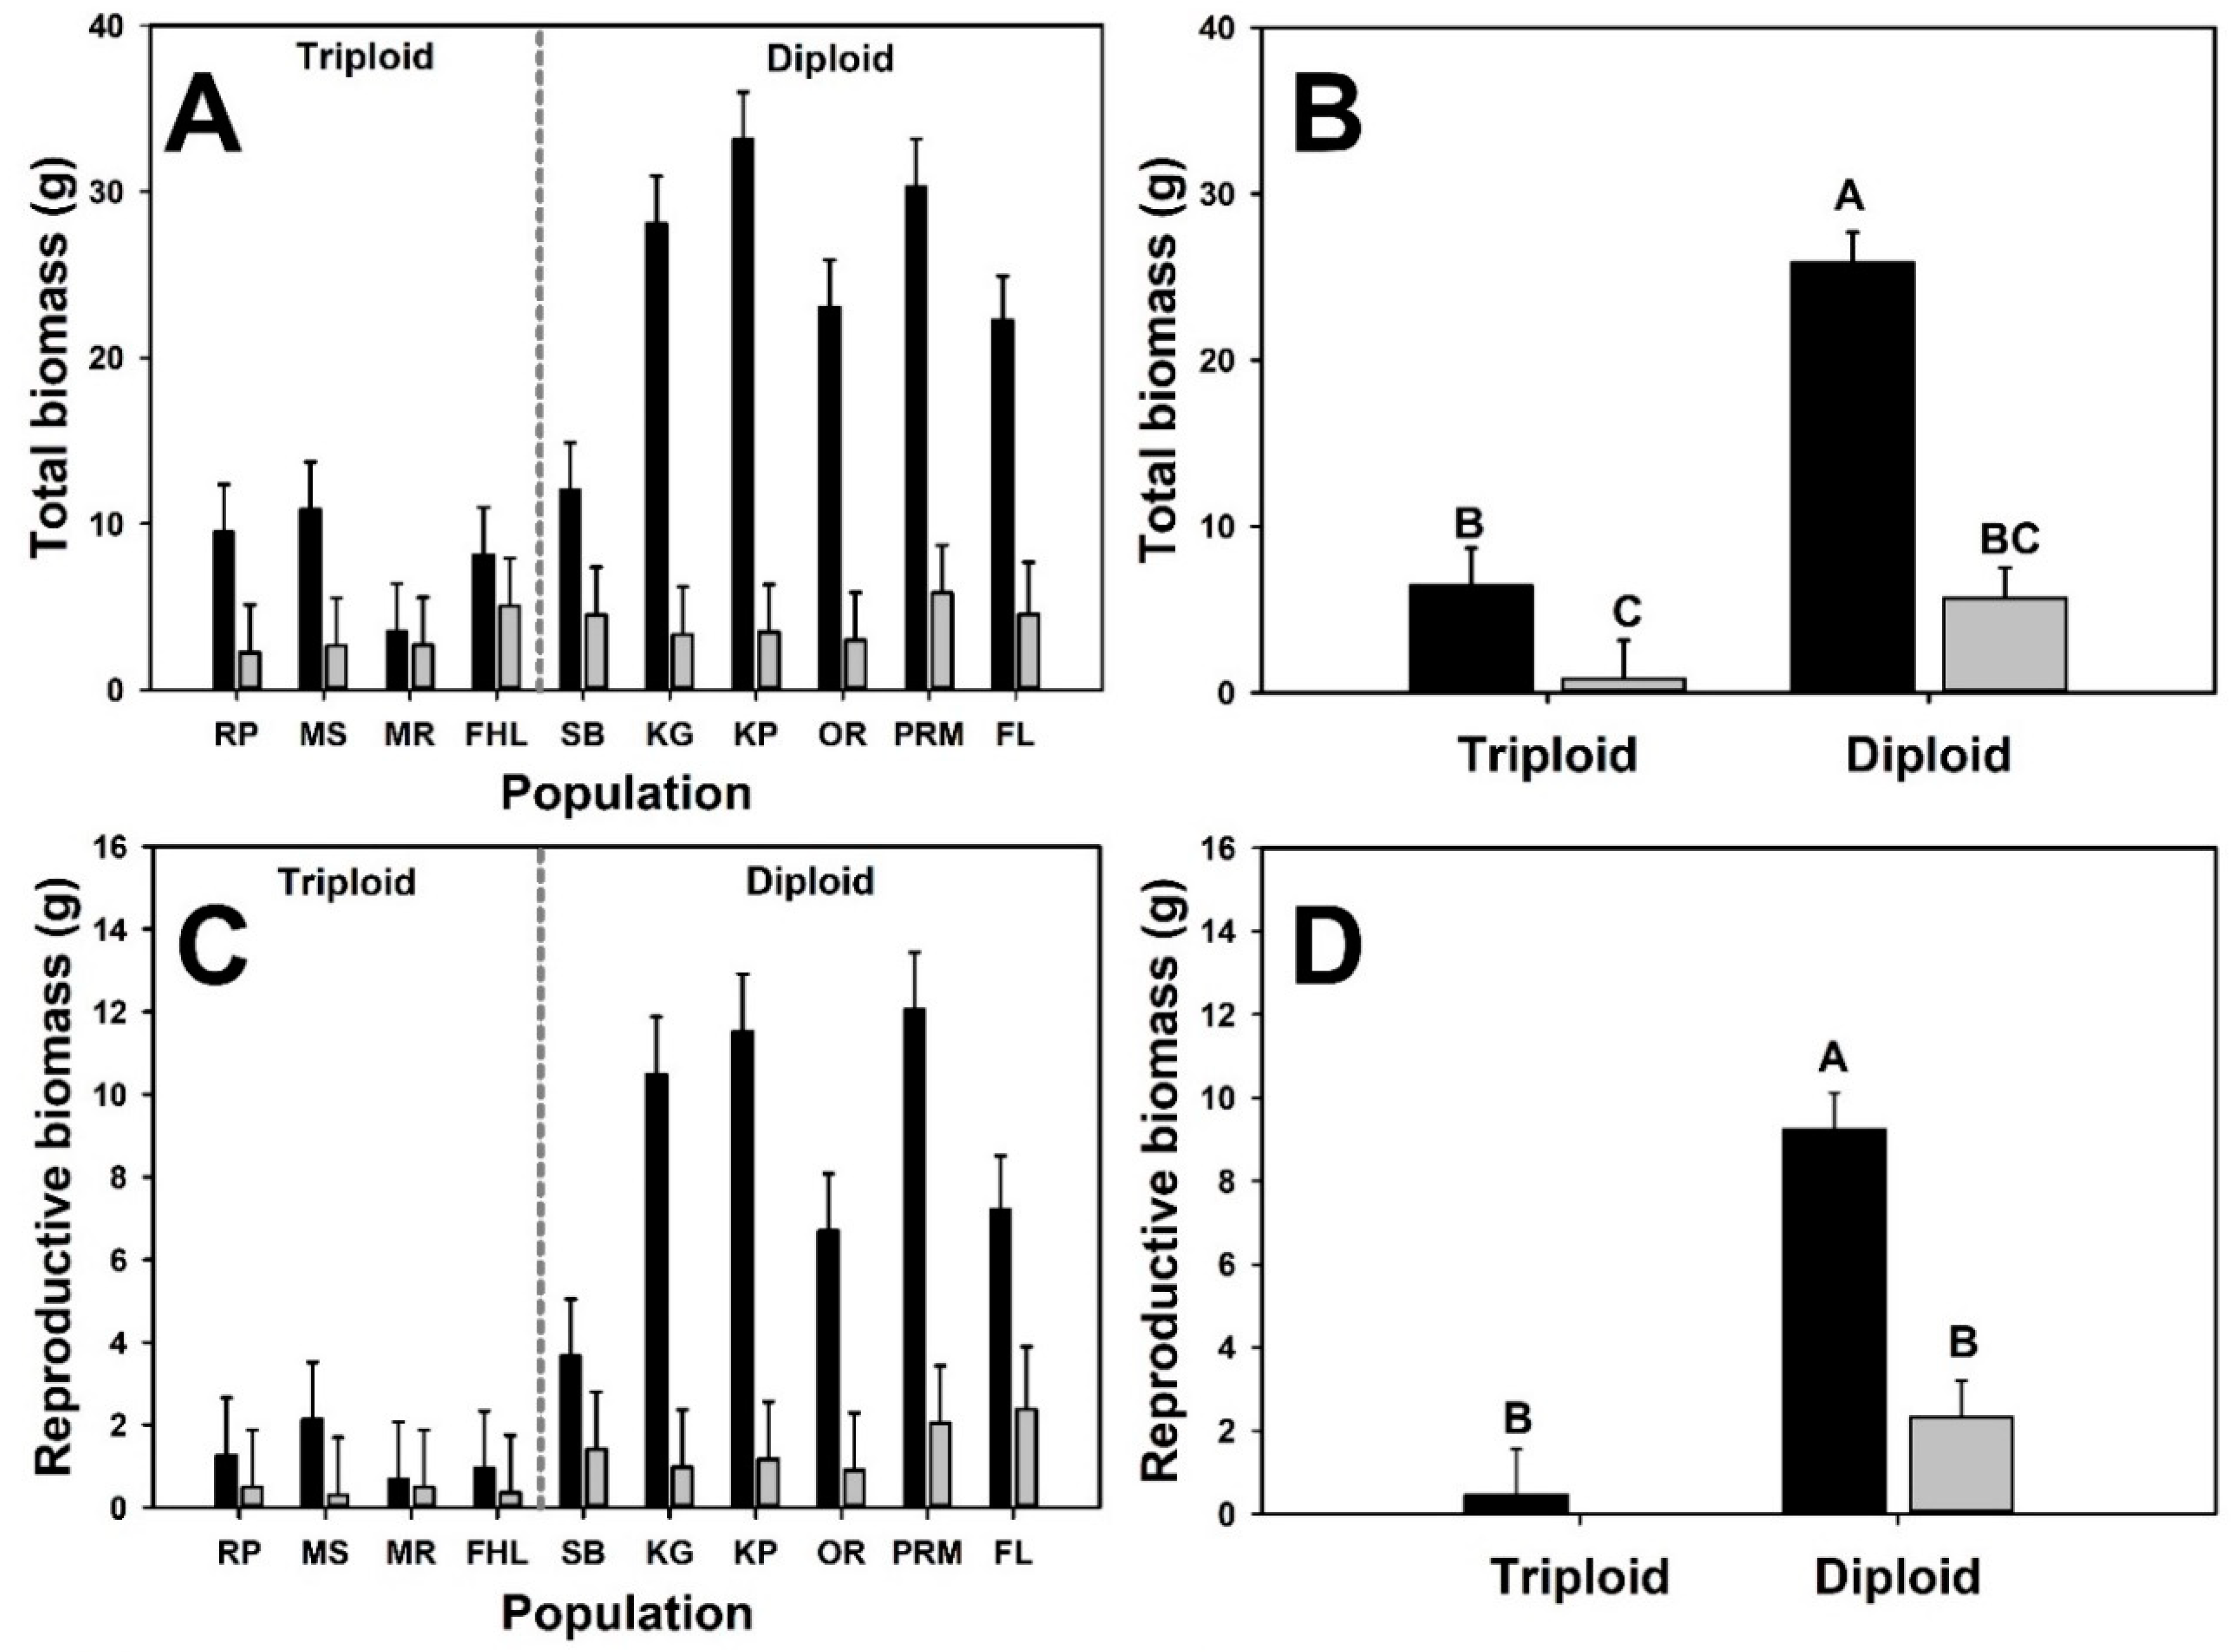
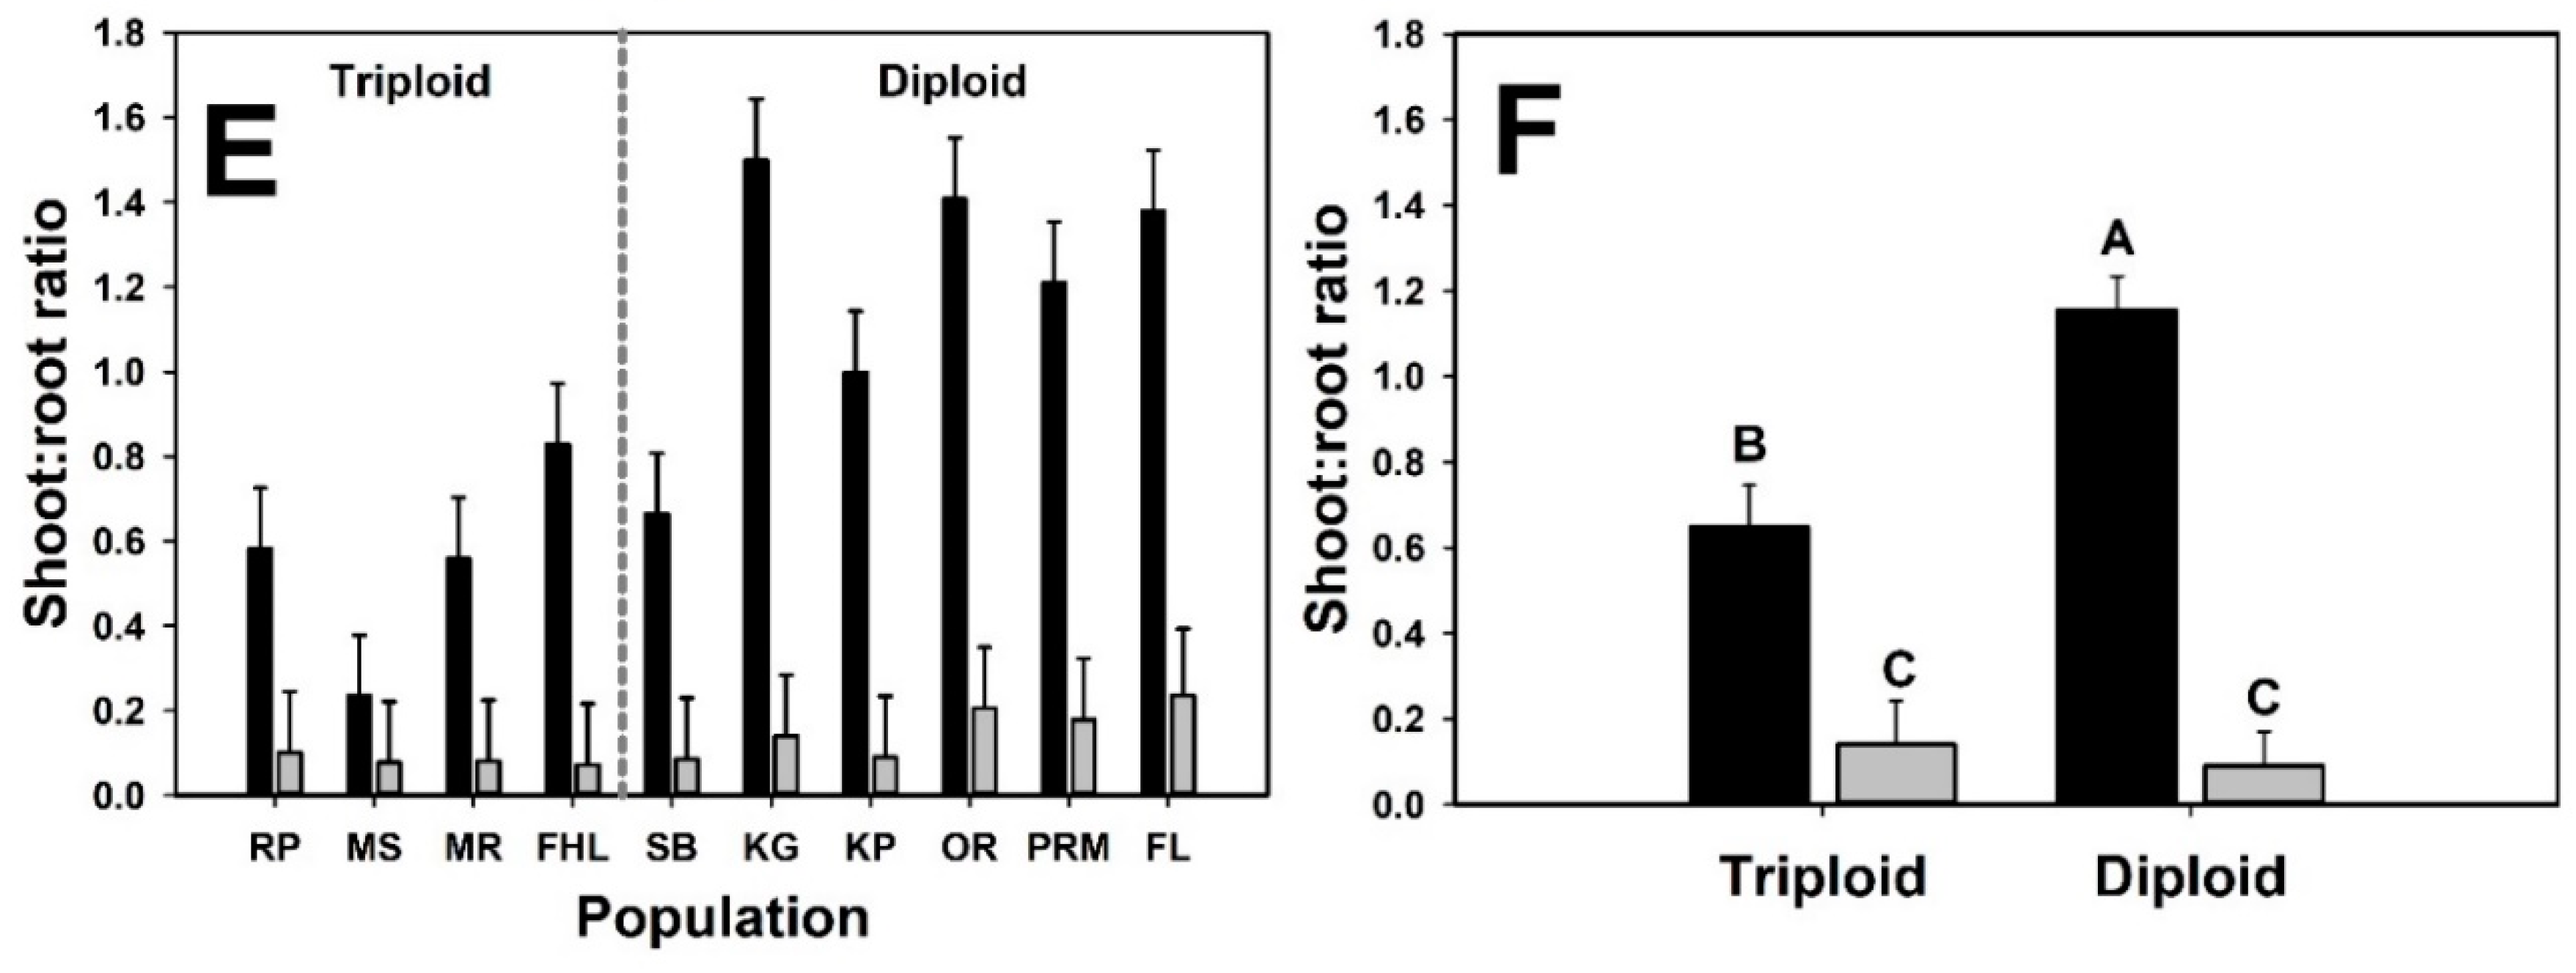
Study System
Butomus umbellatus is a Eurasian wetland plant, introduced in North America over a century ago from multiple source populations [58]. Genetic structure in North American B. umbellatus populations reflects multiple introductions with two cytotypes (diploid, triploid) and several genotypes (G1, G3, G4, G5) identified thus far (John Gaskin, unpublished data). Although there have been multiple introductions into North America, the source areas for introduced genotypes has yet to be determined. However, investigations into ecological differences between cytotypes have uncovered variation in disease susceptibility [59] and nutrient response (Harms et al., in review), with implications for cytotype-specific management strategies. Butomus umbellatus colonizes a variety of wetland and aquatic habitats including shallow wetlands, slow-moving rivers, large reservoirs, ponds, and roadside ditches [60,61,62]. Dense infestations reduce water flow, obstruct navigation, and create habitat for unwanted introduced predator fish species [63]. There is little information available on B. umbellatus invasion success in native plant communities, but there are indications that diverse plant communities may resist expansion of B. umbellatus populations [63]. A number of North American infestations that occur in previously unvegetated littoral zones (e.g., Flathead Lake, MT and Lake Pend Oreille, ID) are particularly severe.
Competition Experiments
Plants (all species) were propagated repeatedly for one and a half years before experiments in order to reduce the lingering effects of the environments where they were collected (i.e., maternal effects; [64]). Potential competitor species (hereafter termed ‘experimental community’ or ‘neighbors’) were all field-collected from sites without B. umbellatus during summer 2017. Sites without B. umbellatus were chosen in order to ensure plants were naïve and not pre-adapted to our focal species [65]. Heteranthera dubia MacMill. (Pontederiaceae) was collected from the Yakima River (Benton County, WA, USA; 46.204, −119.778) on 11 September, 2017. Myriophyllum spicatum L. (Haloragaceae) was collected from Bead Lake (Pend Oreille County, WA, USA; 48.303, −117.110) on 6 September, 2017. Typha latifolia L. (Typhaceae) from Lavender Lake (Kittitas County, WA, USA; 47.219, −121.129) collected 29 August 2017. Schoenoplectus acutus (Muhl. ex Bigelow) Á. Löve & D. Löve (Cyperaceae) from Salmon Lake (Okanogan County, WA, USA; 48.565, −119.731) was collected on 24 August 2017. Butomus umbellatus plants were collected in the field during the period 2014–2016 and subsequently cultured at the US Army Corps Engineer Research and Development Center (ERDC), Vicksburg, MS, USA (32.308, −90.867). Plants were collected from both triploid and diploid populations (Table 1).
Experiments were conducted in temperature-controlled greenhouses at the ERDC. Prior to experiments, neighbor species were collected from cultures, their rhizomes (emergent species) or apical meristems (submersed species) were harvested from culture pots and floated in water for several days, then planted and allowed to root for one week. Propagule size was standardized within species. For emergent species, rhizome pieces were approximately 5–10 cm long and for submersed species, 10–15 cm apical stem cuttings were used. One week after planting the experimental communities, B. umbellatus propagules were added to the containers. B. umbellatus plants were grown from rhizome fragments (4–6 cm; triploid plants) or bulbils (diploid plants) to a similar size, and weighed before planting. The difference in planting times (one week) between neighbor species and B. umbellatus was enough to promote establishment of experimental community species, particularly in the warm greenhouses. For the emergent experiment, plants were potted in 6 L nursery containers with 4 L commercial topsoil amended with a 10 g fertilizer pellet (20–10–5; Scotts Agriform™, Marysville, OH, USA). Pots were placed individually within 20 L plastic buckets, then placed in 1200 L fiberglass tanks (interior dimensions: 1.5 m × 0.94 m × 0.92 m) within greenhouses. For the submersed experiment, plants were potted in 1 L plastic cups, in approximately 500 mL commercial topsoil, amended with a 5 g fertilizer pellet (20–10–5; A.M. Leonard, Piqua, OH, USA). A 2 cm cap of masonry sand was added over the topsoil to prevent resuspension of soil and loss of nutrients into the water column. Pots were placed individually in 48 L aerated aquaria in greenhouse tanks. Prior to placing pots in aquaria, a one-time dose of nutrient solution [66] was added to each aquarium and allowed to equilibrate for several days. Aquaria were aerated prior to introducing plants and aeration was maintained for the duration of the experiment. Diatom filters were used periodically to maintain clear water and remove algae in aquaria. Air temperature was 28.3 ± 3.1 °C (Mean ± SE) in the emergent study (measured in the center of the greenhouse) and water temperature in the submersed study (averaged between three tanks, measured 1 m deep) was 21.0 ± 2.8 °C over the course of the experiments. Experimental design for both experiments was a partial incomplete block design (Cochran and Cox 1968), following Bose, et al. [67], with 21 treatment combinations, 6 replicates per treatment, and 18 blocks. Experimental units (individual pots) were arranged with seven per tank (block), 18 tanks overall.
Plant biomass was harvested after 12 (emergent) and 16 (submersed) weeks. Harvests for both studies were conducted identically. Aboveground (shoots), belowground (roots), and reproductive tissue (bulbils or rhizome buds) biomass was separated for each species and washed of debris, then placed individually in paper bags, dried at 70 °C for one week, then weighed to the nearest 0.01 g. Biomass for all species (i.e., B. umbellatus and neighbors) was measured separately.
Statistical Approach
The same statistical approach was used to analyze data from both (emergent, submersed) experiments. First, it was determined whether biomass variables (total biomass, reproductive tissue biomass, shoot:root ratio) varied between B. umbellatus cytotypes and between growth in monoculture or in a multispecies community. For this, we used mixed effects models with neighbor presence (two levels: monoculture, multi-species) and cytotype (two levels: diploid, triploid) as fixed effects. Additionally, population nested within cytotype was included as a random effect. Initially, tank was included as a block effect (i.e., location within the greenhouses) in all models but was highly insignificant (p > 0.6), so was ultimately removed from most analyses. Tank was retained as a random variable in RII analyses only (see below). Additionally, initial propagule weight was included in all models as a covariate. Submersed and emergent experiments were analyzed separately.
To quantify the effect of neighbor presence (a putative competitive interaction) on flowering rush and neighbor biomass, relative interaction intensities (RII) were calculated [68]. RII has a value between −1 and +1, with negative values indicating competition and positive values indicating facilitation. RII is calculated as:
R I I =   B w B o B w + B o ,
where Bw is the mass of a plant grown in the presence of other species and Bo is the mean mass of plants of a single species grown alone [69]. Differences in RII between cytotypes were determined with a mixed effects model, where cytotype was a fixed effect and population nested within cytotype and tank (block) were random effects. RII was calculated both for flowering rush plants grown in recipient communities and also for the recipient community (as summed biomass of neighbor species). All statistical tests were performed with SAS ver. 9.4.

3. Results

Establishment and growth of Butomus umbellatus in experimental communities largely differed by cytotype. Regardless of water depth, diploid plants outperformed triploid plants in biomass production (both overall and reproductive biomass). However, the relative effect of competition on plant growth varied by cytotype and by experiment.
Submersed Interaction Experiment
In the submersed interaction experiment, we detected no significant effect of competition (i.e., presence of neighbors) on biomass (total or reproductive) variables (Table 2, Figure 1). However, diploid plants produced sixty times more total biomass than triploid plants across treatments. Likewise, reproductive biomass in B. umbellatus was not negatively affected by neighbors, and the cytotype effect was marginally significant, with triploid plants not producing any rhizome buds during the experiment. Shoot:root ratio differed both by neighbor presence and cytotype identity; overall, shoot:root ratio for diploid plants was seven times greater than triploid plants (diploid: 2.65 ± 0.51, triploid: 0.43 ± 0.62).
In contrast to the mixed model results above, there was a significant effect of competition on triploid but not diploid plants, detected based on RII calculations (Figure 2A). Additionally, RII for triploid (RII = −0.64 ± 0.11) plants was thirteen times stronger than for diploid (RII = −0.048 ± 0.09) plants in the submersed experiment. B. umbellatus did not have a significant effect on recipient community RII, regardless of cytotype (Figure 2A).
Emergent Interaction Experiment
Under emergent conditions, diploid plants produced five times more total biomass than triploid plants overall but the impact of neighbor-presence on biomass differed between cytotypes (i.e., a significant neighbor presence × cytotype interaction; Figure 3; Table 2). In monoculture and with neighbors, diploid plants produced four and nearly seven times more total biomass, respectively. Diploid plants produced twenty times more reproductive biomass when grown alone and nearly three times as much under competition. Bulbil production in diploid plants was four times higher in monoculture than under competition (9.2 ± 0.88 g vs. 2.3 ± 0.89 g). A significant neighbor presence x cytotype interaction was detected for shoot:root ratio (Table 2), indicating differential effects of competition on shoot:root ratio for diploid and triploid B. umbellatus plants. Shoot:root ratio was higher in diploid plants in the monoculture treatment (1.16 ± 0.08 vs. 0.65 ± 0.1), whereas shoot:root ratio was similar between cytotypes when grown under competition (0.14 ± 0.1 vs. 0.09 ± 0.08).
The competitive effect in the emergent experiment, calculated as RII, was significant for both B. umbellatus and the recipient community (Figure 2B). Although mean relative interaction intensity (RII) in diploid plants was nearly twice that calculated for triploid plants (−0.67 vs. −0.36), the cytotype difference was marginally insignificant in the emergent experiment (p = 0.07). Although not as strong as the effect on B. umbellatus from the recipient community, B. umbellatus did exert a significant negative competitive effect (i.e., confidence intervals do not overlap zero) on the recipient community, regardless of cytotype (Figure 2B).

4. Discussion

Butomus umbellatus establishment and spread in North American aquatic habitats has generated negative ecological and economic impacts, leading to increased interest in predicting invasiveness, potential distribution (Banerjee et al., in prep), and development of effective management tools for the species [59,70,71]. However, research on B. umbellatus management has largely failed to take into account genetic variation and the implications of differences in ploidy in the invaded range (but see Harms et al. 2019, Harms et al., in review). Genetic-based plasticity to environmental variation has been uncovered in a number of invader systems, including the grass Phragmites australis (Cav.) Steud. (Poaceae) (plasticity to herbivory, plant-soil feedbacks, competition), Ludwigia L. (Onagraceae) (nutrients, light availability, climate), Spartina alterniflora Loisel. (Poaceae) (climate, salinity), and Alternanthera philoxeroides (Mart.) Griseb. (Amaranthaceae) (competition, herbivory, water level) [72,73,74,75,76,77,78,79,80]. However, it is rare that genetic identity of an invader is paired with plasticity to environmental variables and interspecific competition in order to assess invasive potential. The results from the current research demonstrate that genetic variation and habitat heterogeneity can interact to influence plant invasion (e.g., biomass production) in experimental communities.
Similar to previous work (Harms et al. in review), diploid B. umbellatus plants outperformed triploid plants under most experimental conditions. Diploid plants, when grown alone, produced nearly 10 and 4 times more biomass in submersed and emergent experiments, respectively. However, the effect of competition largely negated biomass differences between cytotypes, at least in the emergent experiment. Diploid plants produced 17 times more biomass than triploid plants under competition in submersed conditions but only 1.3 times more biomass in the emergent competition treatment. The disparity between performance in monoculture and under competition for diploid plants signals that superior competitive ability, at least in emergent habitats, is likely not driving invasion success of diploid B. umbellatus in North America. This is also corroborated by RII calculations; diploid plants, despite higher biomass production overall, are twice as impacted by competition than triploid plants in the emergent experiment (−0.67 vs. −0.36.), whereas RIIs in the submersed experiment indicate far more impact of competition to triploid than diploid plants (−0.64 vs. −0.048). In fact, the effect of competition on diploid plants in the submersed experiment were essentially zero (Figure 2). Implications of these findings (diploid superiority in monoculture and in submersed environments) are that (1) diploid plants may be well suited for highly disturbed habitats with few other species, (2) diploid plants may be better at invading submersed communities, and that (3) both cytotypes are equally capable of establishing in emergent communities.
One major phenotypic difference between cytotypes in the current study was in shoot:root ratio and its variation in response to treatment conditions. Disproportionate biomass allocation to underground tissues has been implicated as a trait common to successful competitors [81,82,83,84,85], and B. umbellatus, in particular [86]. In a recent study [86], it was demonstrated that shoot:root ratio varied between introduced B. umbellatus cytotypes and was further influenced by nutrients [72], but the pattern was somewhat counterintuitive: plants increased root biomass allocation with increased availability of nitrogen, and triploid plants had consistently lower shoot:root ratios regardless of nutrient treatment. In the current study, B. umbellatus plants, regardless of cytotype, generally had three times larger shoot:root ratios in the submersed versus the emergent experiment. Furthermore, shoot:root ratios were higher in monoculture in both submersed and emergent experiments regardless of cytotype, indicating increased allocation towards vegetative structures. In contrast, shoot:root ratios were lower across the board in competition treatments, suggesting plasticity to competition in the form of biomass allocation to roots. Differences between cytotypes in biomass allocation from aboveground to belowground tissues may be critical to long-term persistence in a variety of habitats. Ren et al. (2019) found that increased allocation to roots in response to increased nitrogen was a successful strategy for Solidago canadensis L. (Asteraceae), whereas a native focal species did not respond similarly. The implications of their work are that S. candensis is likely to perform better in low resource environments, especially under elevated nutrient deposition. The different allocation patterns between B. umbellatus cytotypes in this and other studies raises interesting questions about the types of habitats that may be invadible by each and whether they are likely to invade similar habitats. Diploid plants tended to have larger shoot:root ratios which may benefit them in environments in which competition for light is high. In fact, the much larger shoot:root ratios of diploid plants in the submersed experiment, and reduced impact (relative to the emergent experiment) on shoot:root ratios due to competition with the canopy forming species M. spicatum and H. dubia, may further reflect adaptation to that environment.
Although the main objective of this work was to compare cytotype (i.e., between-cytotype) mean biomass variables grown alone or with neighbors, within cytotype (i.e., between-population) variation displayed an interesting pattern. Diploid populations were overall more variable when grown in monoculture, but not in competition, than triploid populations. However, this pattern was evident only in the submersed experiment (submersed experiment, coefficient of variation for total biomass in monoculture: diploid = 69.5, triploid = 12.0; emergent experiment, coefficient of variation for total biomass in monoculture: diploid = 30.4, triploid = 39.7). This may have been at least in part influenced by an increased genetic diversity among diploid populations (i.e., three unique genotypes) relative to triploid populations (one genotype). For instance, the Springbrook pond, IL (SB) population used here is diploid but it is a unique multilocus genotype (G3; Gaskin, unpublished data), apart from the common diploid genotype G4 (Table 1). In a previous study to examine differences in nutrient response between cytotypes, this diploid G3 population responded more similarly to triploid than diploid plants in most measured phenotypic responses, including biomass allocation and tissue chemistry [86]. In the current study, SB plant biomass consistently mirrored triploid rather than diploid plants, producing the least biomass of all diploid populations and also lowest shoot:root ratios when grown in monoculture (e.g., Figure 1). Although the goal of this study was not to compare populations, but rather cytotypes, this result demonstrates the value of presenting multiple genetic levels (i.e., population-level and cytotype-level) of results.
Several limitations to this work are worth discussing. First, competition experiments took place under relatively constant greenhouse conditions, whereas real-world interactions would certainly occur in a fluctuating environment with myriad contrasting and interacting biotic and abiotic variables. Furthermore, plant responses to changing conditions may vary in their magnitude or duration [87]. Future experiments might be conducted under realistic field conditions or at least in outdoor mesocosms. In addition, the location of the experiments was considerably south of the most southern natural population of B. umbellatus in North America [88]. However, most of the southeastern states have suitable climates for B. umbellatus establishment (Banerjee et al., in review) and experiments were conducted early in the year (February through May) to more closely reflect northern locations during summer months. Whether the location of this experiment (Mississippi) had any bearing on the results of competition in different water depths is unknown, but future experiments could be conducted across climate or other geographical gradients to further explore how invasion may succeed in different areas.
As demonstrated here and elsewhere, genetic variability in invasive species may be sufficient to generate patterns where some areas are more prone to invasion than others. In North America, B. umbellatus is represented by several genotypes within two cytotypes which vary in a number of important traits, including pathogen susceptibility [59], nutrient response [86], and competitive ability (this study). Future research into ecosystem impacts or to develop effective management strategies for B. umbellatus should take this variability into account. At the very least, future research reporting results should clearly state which genotype was used/observed in the study. If genotype determination is not possible, experimental plant vouchers should be retained for future analyses. Because the genetic variation present in populations of B. umbellatus can manifest to reflect important ecological variation (i.e., competitive ability, nutrient response), it will be critical to consider in future management activities.

Funding

This research received no external funding.

Acknowledgments

I am thankful to Jen Parsons for collecting all field populations of competitor species. Also, thanks to Blake DeRossette, Bradley Sartain, and Damian Walter for assistance maintaining experiments and conducting harvests. Thanks also to Bradley Sartain and Lynde Dodd for comments on an early draft of this manuscript. This work was conducted with support from the US Army Engineer Research and Development Center, Aquatic Plant Control Research Program, under management of Linda Nelson.

Conflicts of Interest

The author declares no conflict of interest.

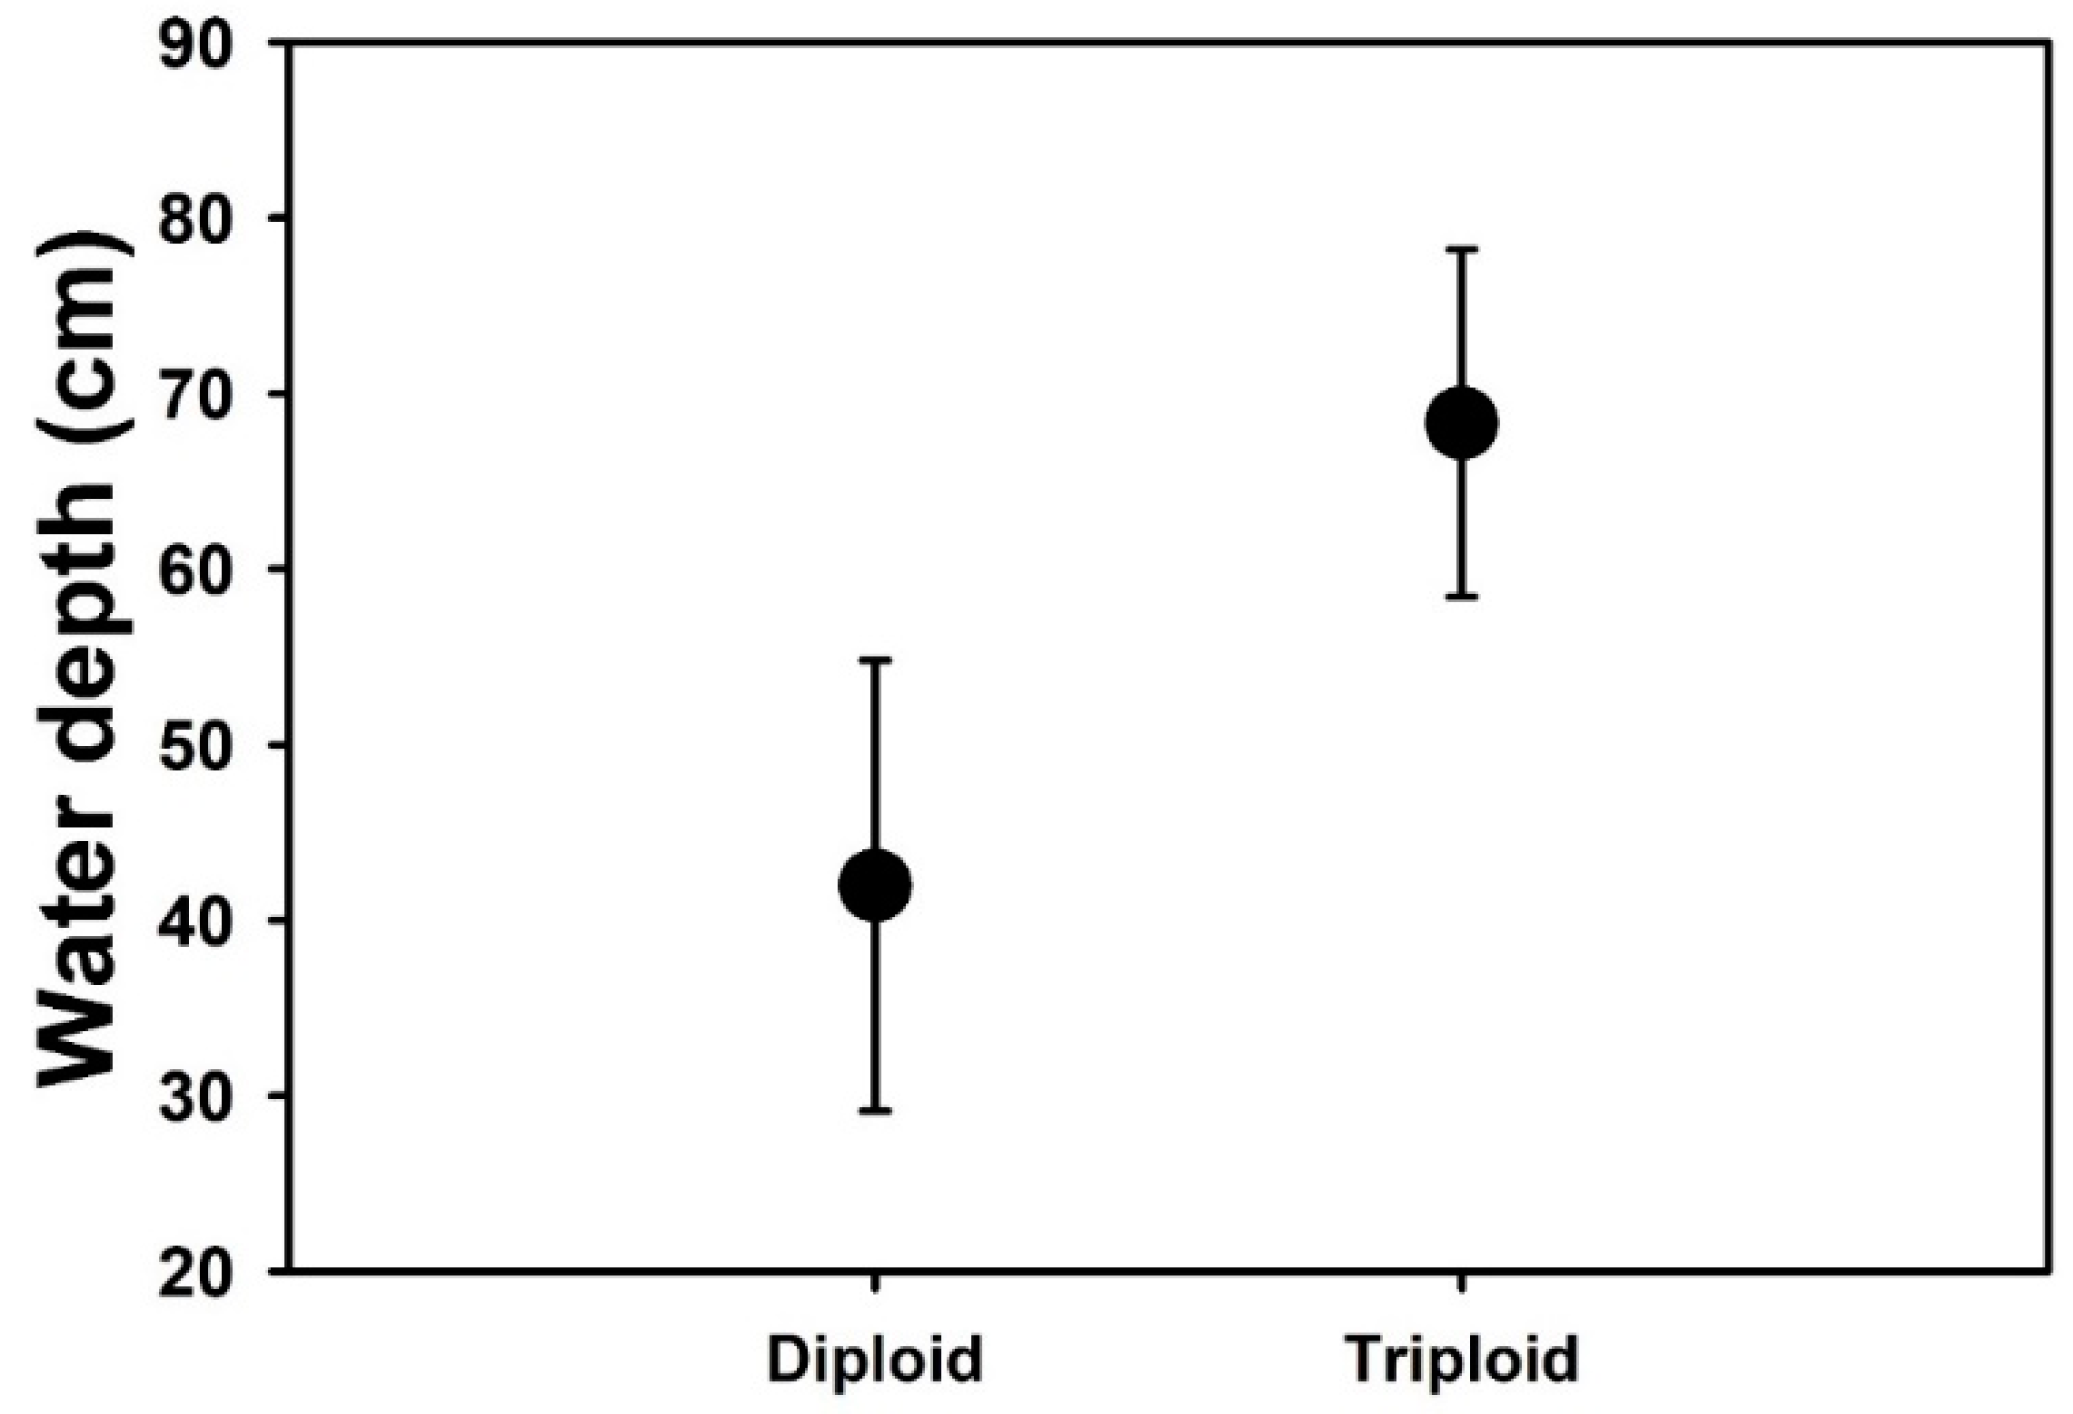
Appendix A. Field Observations on Water Depth of B. umbellatus Populations

Populations of Butomus umbellatus were surveyed in the U.S. from 2014 until 2016 (Table A1). Sites were selected through discussion with state or local personnel, online database searches (e.g., EDDMapS.org) or random encounters during transit. At each site, a number of site characteristics were recorded. Of primary interest for the current research is the variable water depth. Water depth was recorded in the middle of the infestation, the extent of which was determined through visual searching at the surface and upper portion (0.5m) of the water column. Ploidy was subsequently determined for populations (John Gaskin, USDA ARS; unpublished data). Least square means of water depth for cytotypes are shown below (Figure A1). Mean water depths were determined by using a linear mixed model with population nested in cytotype and year as random variables and cytotype as a fixed variable.
Table A1. Locations where B. umbellatus water depth was measured during surveys from 2014 until 2016.
LocationYearCytotypeWater Depth (cm)
Aberdeen Golf Course Canal, ID, USA2014Triploid100
Columbia River @ Kennewick, WA, USA2014Triploid200
Flathead Lake, MT, USA2014Triploid100
Lake Pend Oreille, ID, USA2014Triploid125
Lake Spokane, WA, USA2014Triploid160
Pend Oreille River, WA, USA2014Triploid100
Rose Pond, ID, USA2014Triploid100
Yakima River, Horn Rapids Park, WA, USA2014Triploid100
Forest Lake, MN, USA2015Diploid115
Kildeer Pond 33, OH, USA2015Diploid100
Olentangy River, OH, USA2015Diploid0
Point Rosa Marsh, MI, USA2015Diploid0
Sterling State Park, MI, USA2015Diploid0
Bertram Lake, WI, USA2015Triploid0
Lake Kawaguesaga, WI, USA2015Triploid100
Lanes Lake, MI, USA2015Triploid0
MS River near Galena, IL, USA2015Triploid0
Oconto Falls, WI, USA2015Triploid100
Village Park, Fremont, WI, USA2015Triploid0
Cayuga Lake, NY, USA2016Diploid10
East Bay Wildlife Management Area, NY, USA2016Diploid0
Forest Lake, MN, USA2016Diploid100
Kildeer Pond 33, OH, USA2016Diploid0
Oswegatchie River, VT, USA2016Diploid10
Point Rosa Marsh, MI, USA2016Diploid10
Shelburne Bay, VT, USA2016Diploid0
Springbrook Pond, IL, USA2016Diploid0
Sterling State Park, MI, USA2016Diploid0
Three Mile Bay, NY, USA2016Diploid25
Unity Island, NY, USA2016Diploid30
Aberdeen Golf Course Canal, ID, USA2016Triploid40
Columbia River @ Kennewick, WA, USA2016Triploid125
Flathead Lake, MT, USA2016Triploid70
Lake Pend Oreille, ID, USA2016Triploid80
Missisquoi River, VT, USA2016Triploid0
Pend Oreille River, WA, USA2016Triploid80
Rose Pond, ID, USA2016Triploid70
Sabattus Creek, ME, USA2016Triploid20
Yakima River @ Prosser, WA, USA2016Triploid15
Figure A1. Mean (±SE) water depth recorded for diploid and triploid populations of B. umbellatus at field sites from 2014 to 2016.
Diversity 12 00040 g0a1

References

  1. Gopal, B. Water Hyacinth; Elsevier Science Publishers: Amsterdam, The Netherlands, 1987. [Google Scholar]
  2. Wainger, L.A.; Harms, N.E.; Magen, C.; Liang, N.; Nesslage, G.M.; McMurray, A.M.; Cofrancesco, A.F. Evidence-based economic analysis demonstrates that ecosystem service benefits of water hyacinth management greatly exceed research and control costs. PeerJ 2018, 6, e4824. [Google Scholar] [CrossRef] [PubMed]
  3. Villamagna, A.M.; Murphy, B.R. Ecological and socio-economic impacts of invasive water hyacinth (Eichhornia crassipes): A review. Freshw. Biol. 2010, 55, 282–298. [Google Scholar] [CrossRef]
  4. Pejchar, L.; Mooney, H.A. Invasive species, ecosystem services and human well-being. Trends Ecol. Evol. 2009, 24, 497–504. [Google Scholar] [CrossRef] [PubMed]
  5. Gordon, D.R. Effects of invasive, non-indigenous plant species on ecosystem processes: Lessons from Florida. Ecol. Appl. 1998, 8, 975–989. [Google Scholar] [CrossRef]
  6. Evans, J.M. Ecosystem implications of invasive aquatic plants and aquatic plant control in florida springs. In Summary and Synthesis of Available Literature on the Effects of Nutrients on Springs Organisms and Systems; Florida Department of Environmental Protection: Tallahassee, FL, USA, 2008; pp. 249–270. [Google Scholar]
  7. Gallardo, B.; Clavero, M.; Sánchez, M.I.; Vilà, M. Global ecological impacts of invasive species in aquatic ecosystems. Glob. Chang. Biol. 2016, 22, 151–163. [Google Scholar] [CrossRef]
  8. Zhang, C.; Boyle, K.J. The effect of an aquatic invasive species (Eurasian watermilfoil) on lakefront property values. Ecol. Econ. 2010, 70, 394–404. [Google Scholar] [CrossRef]
  9. Keller, R.P.; Masoodi, A.; Shackleton, R.T. The impact of invasive aquatic plants on ecosystem services and human well-being in Wular Lake, India. Reg. Environ. Chang. 2018, 18, 847–857. [Google Scholar] [CrossRef]
  10. Wu, H.; Ding, J.Q. Global Change Sharpens the Double-Edged Sword Effect of Aquatic Alien Plants in China and Beyond. Front. Plant Sci. 2019, 10, 787. [Google Scholar] [CrossRef] [Green Version]
  11. Dukes, J.S.; Mooney, H.A. Disruption of ecosystem processes in western North America by invasive species. Rev. Chil. Hist. Nat. 2004, 77, 411–437. [Google Scholar] [CrossRef]
  12. Charles, H.; Dukes, J.S. Impacts of Invasive Species on Ecosystem Services. In Biological Invasions; Nentwig, W., Ed.; Springer: Berlin/Heidelberg, Germany, 2007; pp. 217–237. [Google Scholar]
  13. Fournier, A.; Penone, C.; Pennino, M.G.; Courchamp, F. Predicting future invaders and future invasions. Proc. Natl. Acad. Sci. USA 2019, 116, 7905–7910. [Google Scholar] [CrossRef] [Green Version]
  14. Divíšek, J.; Chytrý, M.; Beckage, B.; Gotelli, N.J.; Lososová, Z.; Pyšek, P.; Richardson, D.M.; Molofsky, J. Similarity of introduced plant species to native ones facilitates naturalization, but differences enhance invasion success. Nat. Commun. 2018, 9, 4631. [Google Scholar] [CrossRef]
  15. Kolar, C.S.; Lodge, D.M. Progress in invasion biology: Predicting invaders. Trends Ecol. Evol. 2001, 16, 199–204. [Google Scholar] [CrossRef]
  16. Mack, R.N. Predicting the identity and fate of plant invaders: Emergent and emerging approaches. Biol. Conserv. 1996, 78, 107–121. [Google Scholar] [CrossRef]
  17. Keller, R.P.; Lodge, D.M.; Finnoff, D.C. Risk assessment for invasive species produces net bioeconomic benefits. Proc. Natl. Acad. Sci. USA 2007, 104, 203–207. [Google Scholar] [CrossRef] [PubMed] [Green Version]
  18. Lodge, D.M.; Williams, S.; MacIsaac, H.J.; Hayes, K.R.; Leung, B.; Reichard, S.; Mack, R.N.; Moyle, P.B.; Smith, M.; Andow, D.A.; et al. Biological invasions: Recommendations for U.S. policy and management. Ecol. Appl. 2006, 16, 2035–2054. [Google Scholar] [CrossRef] [Green Version]
  19. Simberloff, D.; Parker, I.M.; Windle, P.N. Introduced species policy, management, and future research needs. Front. Ecol. Environ. 2005, 3, 12–20. [Google Scholar] [CrossRef]
  20. Mack, R.N.; Simberloff, D.; Mark Lonsdale, W.; Evans, H.; Clout, M.; Bazzaz, F.A. Biotic invasions: Causes, epidemiology, global consequences, and control. Ecol. Appl. 2000, 10, 689–710. [Google Scholar] [CrossRef]
  21. Hobbs, R.J.; Humphries, S.E. An Integrated Approach to the Ecology and Management of Plant Invasions. Conserv. Biol. 1995, 9, 761–770. [Google Scholar] [CrossRef] [Green Version]
  22. Zanden, M.J.V.; Olden, J.D. A management framework for preventing the secondary spread of aquatic invasive species. Can. J. Fish. Aquat. Sci. 2008, 65, 1512–1522. [Google Scholar] [CrossRef]
  23. Zanden, M.J.V.; Hansen, G.J.; Higgins, S.N.; Kornis, M.S. A pound of prevention, plus a pound of cure: Early detection and eradication of invasive species in the Laurentian Great Lakes. J. Great Lakes Res. 2010, 36, 199–205. [Google Scholar] [CrossRef]
  24. Byers, J.E.; Noonburg, E.G. Scale dependent effects of biotic resistance to biological invasion. Ecology 2003, 84, 1428–1433. [Google Scholar] [CrossRef]
  25. Levine, J.M.; Adler, P.B.; Yelenik, S.G. A meta-analysis of biotic resistance to exotic plant invasions. Ecol. Lett. 2004, 7, 975–989. [Google Scholar] [CrossRef] [Green Version]
  26. Parker, J.D.; Hay, M.E. Biotic resistance to plant invasions? Native herbivores prefer non-native plants. Ecol. Lett. 2005, 8, 959–967. [Google Scholar] [CrossRef]
  27. Byun, C.; Lee, E.J. Ecological application of biotic resistance to control the invasion of an invasive plant, Ageratina altissima. Ecol. Evol. 2017, 7, 2181–2192. [Google Scholar] [CrossRef]
  28. Byun, C.; de Blois, S.; Brisson, J. Plant functional group identity and diversity determine biotic resistance to invasion by an exotic grass. J. Ecol. 2013, 101, 128–139. [Google Scholar] [CrossRef] [Green Version]
  29. Maron, J.L.; Vilà, M. When do herbivores affect plant invasion? Evidence for the natural enemies and biotic resistance hypotheses. Oikos 2001, 95, 361–373. [Google Scholar] [CrossRef] [Green Version]
  30. Richardson, D.M.; Pyšek, P. Naturalization of introduced plants: Ecological drivers of biogeographical patterns. New Phytol. 2012, 196, 383–396. [Google Scholar] [CrossRef]
  31. Barbosa, P.; Hines, J.; Kaplan, I.; Martinson, H.; Szczepaniec, A.; Szendrei, Z. Associational Resistance and Associational Susceptibility: Having Right or Wrong Neighbors. Annu. Rev. Ecol. Evol. Syst. 2009, 40, 1–20. [Google Scholar] [CrossRef] [Green Version]
  32. Andersen, C.P.; Louda, S.M. Abundance of and Floral Herbivory on Exotic Bull Thistle Versus Native Tall Thistle in Western Tallgrass Prairie; University of Nebraska at Kearney: Kearney, NE, USA, 2006. [Google Scholar]
  33. Yannelli, F.; Koch, C.; Jeschke, J.; Kollmann, J. Limiting similarity and Darwin’s naturalization hypothesis: Understanding the drivers of biotic resistance against invasive plant species. Oecologia 2017, 183, 775–784. [Google Scholar] [CrossRef]
  34. Kennedy, T.A.; Naeem, S.; Howe, K.M.; Knops, J.M.H.; Tilman, D.; Reich, P. Biodiversity as a barrier to ecological invasion. Nature 2002, 417, 636–638. [Google Scholar] [CrossRef]
  35. Thiele, J.; Isermann, M.; Otte, A.; Kollmann, J. Competitive displacement or biotic resistance? Disentangling relationships between community diversity and invasion success of tall herbs and shrubs. J. Veg. Sci. 2010, 21, 213–220. [Google Scholar] [CrossRef]
  36. Britton-Simmons, K.H. Functional group diversity, resource preemption and the genesis of invasion resistance in a community of marine algae. Oikos 2006, 113, 395–401. [Google Scholar] [CrossRef]
  37. Funk, J.L.; Cleland, E.E.; Suding, K.N.; Zavaleta, E.S. Restoration through reassembly: Plant traits and invasion resistance. Trends Ecol. Evol. 2008, 23, 695–703. [Google Scholar] [CrossRef] [PubMed]
  38. Middleton, E.L.; Bever, J.D.; Schultz, P.A. The Effect of Restoration Methods on the Quality of the Restoration and Resistance to Invasion by Exotics. Restor. Ecol. 2010, 18, 181–187. [Google Scholar] [CrossRef]
  39. Iii, B.V.I.; Potter, K.M.; Guo, Q.; Jo, I.; Oswalt, C.M.; Fei, S. Environmental harshness drives spatial heterogeneity in biotic resistance. NeoBiota 2018, 40, 87–105. [Google Scholar]
  40. Iannone, B.V.; Oswalt, C.M.; Liebhold, A.M.; Guo, Q.; Potter, K.M.; Nunez-Mir, G.C.; Oswalt, S.N.; Pijanowski, B.C.; Fei, S. Region-specific patterns and drivers of macroscale forest plant invasions. Divers. Distrib. 2015, 21, 1181–1192. [Google Scholar] [CrossRef] [Green Version]
  41. Araújo, M.B.; Rozenfeld, A. The geographic scaling of biotic interactions. Ecography 2014, 37, 406–415. [Google Scholar] [CrossRef] [Green Version]
  42. Souza, L.; Bunn, W.A.; Simberloff, D.; Lawton, R.M.; Sanders, N.J. Biotic and abiotic influences on native and exotic richness relationship across spatial scales: Favourable environments for native species are highly invasible. Funct. Ecol. 2011, 25, 1106–1112. [Google Scholar] [CrossRef]
  43. Richards, C.L.; Pennings, S.C.; Donovan, L.A. Habitat range and phenotypic variation in salt marsh plants. Plant Ecol. 2005, 176, 263–273. [Google Scholar] [CrossRef]
  44. Davidson, A.M.; Jennions, M.D.; Nicotra, A.B. Do invasive species show higher phenotypic plasticity than native species and, if so, is it adaptive? A meta-analysis. Ecol. Lett. 2011, 14, 419–431. [Google Scholar] [CrossRef]
  45. Turner, K.G.; Fréville, H.; Rieseberg, L.H. Adaptive plasticity and niche expansion in an invasive thistle. Ecol. Evol. 2015, 5, 3183–3197. [Google Scholar] [CrossRef] [PubMed]
  46. Vretare, V.; Weisner, S.E.; Strand, J.A.; Granéli, W. Phenotypic plasticity in Phragmites australis as a functional response to water depth. Aquat. Bot. 2001, 69, 127–145. [Google Scholar] [CrossRef]
  47. Pendergrass, A.G.; Knutti, R.; Lehner, F.; Deser, C.; Sanderson, B.M. Precipitation variability increases in a warmer climate. Sci. Rep. 2017, 7, 17966. [Google Scholar] [CrossRef] [PubMed] [Green Version]
  48. Tang, S.Q.; Wei, F.; Zeng, L.Y.; Li, X.K.; Tang, S.C.; Zhong, Y.; Geng, Y.P. Multiple introductions are responsible for the disjunct distributions of invasive Parthenium hysterophorus in China: Evidence from nuclear and chloroplast DNA. Weed Res. 2009, 49, 373–380. [Google Scholar] [CrossRef]
  49. Kelager, A.; Pedersen, J.S.; Bruun, H.H. Multiple introductions and no loss of genetic diversity: Invasion history of Japanese Rose, Rosa rugosa, in Europe. Biol. Invasions 2013, 15, 1125–1141. [Google Scholar] [CrossRef]
  50. Zhu, X.C.; Gopurenko, D.; Serrano, M.; Spencer, M.A.; Pieterse, P.J.; Skoneczny, D.; Lepschi, B.J.; Reigosa, M.J.; Gurr, G.M.; Callaway, R.M.; et al. Genetic evidence for plural introduction pathways of the invasive weed Paterson’s curse (Echium plantagineum L.) to southern Australia. PLoS ONE 2019, 14, e0222696. [Google Scholar] [CrossRef] [Green Version]
  51. Ward, S.M.; Gaskin, J.F.; Wilson, L.M. Ecological Genetics of Plant Invasion: What Do We Know? Invasive Plant Sci. Manag. 2008, 1, 98–109. [Google Scholar] [CrossRef] [Green Version]
  52. Williams, D.A.; Overholt, W.A.; Cuda, J.P.; Hughes, C.R. Chloroplast and microsatellite DNA diversities reveal the introduction history of Brazilian peppertree (Schinus terebinthifolius) in Florida. Mol. Ecol. 2005, 14, 3643–3656. [Google Scholar] [CrossRef]
  53. Larue, E.A.; Zuellig, M.P.; Netherland, M.D.; Heilman, M.A.; Thum, R.A. Hybrid watermilfoil lineages are more invasive and less sensitive to a commonly used herbicide than their exotic parent (Eurasian watermilfoil). Evol. Appl. 2013, 6, 462–471. [Google Scholar] [CrossRef]
  54. Thum, R.A. Genetic variation and aquatic plant management: Key concepts and practical implications. J. Aquat. Plant Manag. 2018, 56, 101–106. [Google Scholar]
  55. Gaskin, J.F.; Bon, M.C.; Cock, M.J.; Cristofaro, M.; De Biase, A.; De Clerck-Floate, R.; Ellison, C.A.; Hinz, H.L.; Hufbauer, R.A.; Julien, M.H.; et al. Applying molecular-based approaches to classical biological control of weeds. Biol. Control 2011, 58, 1–21. [Google Scholar] [CrossRef]
  56. Williams, W.I.; Friedman, J.M.; Gaskin, J.F.; Norton, A.P. Hybridization of an invasive shrub affects tolerance and resistance to defoliation by a biological control agent. Evol. Appl. 2014, 7, 381–393. [Google Scholar] [CrossRef] [PubMed]
  57. Hroudová, Z.; Zákravský, P. Ecology of two cytotypes of Butomus umbellatus II. Reproduction, growth and biomass production. Folia Geobot. Phytotaxon. 1993, 28, 413–424. [Google Scholar] [CrossRef]
  58. Anderson, L.C.; Zeis, C.D.; Alam, S.F. Phytogeography and Possible Origins of Butomus in North America. Bull. Torrey Bot. Club 1974, 101, 292–296. [Google Scholar] [CrossRef]
  59. Harms, N.; Shearer, J.; Cronin, J.T.; Gaskin, J.F. Geographic and genetic variation in susceptibility of Butomus umbellatus to foliar fungal pathogens. Biol. Invasions 2019, 1–14. [Google Scholar] [CrossRef]
  60. Cao, L.; Berent, L.; Fusaro, A. Butomus umbellatus L. Available online: https://nas.er.usgs.gov/queries/greatLakes/FactSheet.aspx?SpeciesID=1100&Potential=N&Type=0&HUCNumber= (accessed on 21 November 2019).
  61. Parkinson, H.; Mangold, J.; Dupuis, V.; Rice, P. Biology, Ecology and Mangament of Flowering Rush (Butomus umbellatus); Montana State University: Bozeman, MT, USA, 2010; pp. 1–12. [Google Scholar]
  62. Lesica, P.; Lavin, M.; Stickney, P.F. Manual of Montana Vascular Plants; BRIT Press: Ft. Worth, TX, USA, 2012. [Google Scholar]
  63. Jacobs, J.; Mangold, J.; Parkinson, H.; Dupuis, V.; Rice, P. Ecology and management of flowering rush (Butomus umbellatus L.); Invasive Species Technical Note No. MT-33; United States Department of Agriculture: Washington, DC, USA; Natural Resources Conservation Service: Washington, DC, USA, 2011.
  64. Roach, D.A.; Wulff, R.D. Maternal Effects in Plants. Annu. Rev. Ecol. Syst. 1987, 18, 209–235. [Google Scholar] [CrossRef]
  65. Leger, E.A.; Espeland, E.K. PERSPECTIVE: Coevolution between native and invasive plant competitors: Implications for invasive species management. Evol. Appl. 2010, 3, 169–178. [Google Scholar] [CrossRef]
  66. Smart, R.M.; Barko, J.W. Laboratory culture of submersed freshwater macrophytes on natural sediments. Aquat. Bot. 1985, 21, 251–263. [Google Scholar] [CrossRef]
  67. Bose, R.C.; Clatworthy, W.H.; Shrikhande, S.S. Tables of Partially Balanced Designs with Two Associate Classes; North Carolina State University: Raleigh, NC, USA, 1954. [Google Scholar]
  68. Armas, C.; Ordiales, R.; Pugnaire, F.I. Measuring Plant Interactions: A New Comparative Index. Ecology 2004, 85, 2682–2686. [Google Scholar] [CrossRef] [Green Version]
  69. Cavieres, L.A.; Sanhueza, A.K.; Torres-Mellado, G.; Casanova-Katny, A. Competition between native Antarctic vascular plants and invasive Poa annua changes with temperature and soil nitrogen availability. Biol. Invasions 2018, 20, 1597–1610. [Google Scholar] [CrossRef] [Green Version]
  70. Madsen, J.D.; Sartain, B.; Turnage, G.; Marko, M. Management of flowering rush in the Detroit Lakes, Minnesota. J. Aquat. Plant Manag. 2016, 54, 61–67. [Google Scholar]
  71. Turnage, G.; Madsen, J.D.; Wersal, R.M.; Byrd, J.D. Simulated mechanical control of flowering rush (Butomus umbellatus) under mesocosm conditions. Invasive Plant Sci. Manag. 2019, 12, 120–123. [Google Scholar] [CrossRef]
  72. Bhattarai, G.P.; Meyerson, L.A.; Anderson, J.; Cummings, D.; Allen, W.J.; Cronin, J.T. Biogeography of a plant invasion: Genetic variation and plasticity in latitudinal clines for traits related to herbivory. Ecol. Monogr. 2017, 87, 57–75. [Google Scholar] [CrossRef]
  73. Bhattarai, G.P.; Meyerson, L.A.; Cronin, J.T. Geographic variation in apparent competition between native and invasive Phragmites australis. Ecology 2017, 98, 349–358. [Google Scholar] [CrossRef] [Green Version]
  74. Gillard, M.; Grewell, B.J.; Futrell, C.J.; Deleu, C.; Thiébaut, G. Germination and Seedling Growth of Water Primroses: A Cross Experiment between Two Invaded Ranges with Contrasting Climates. Front. Plant Sci. 2017, 8, 1677. [Google Scholar] [CrossRef] [PubMed]
  75. Grewell, B.J.; Thomason, M.J.S.; Futrell, C.J.; Iannucci, M.; Drenovsky, R.E. Trait responses of invasive aquatic macrophyte congeners: Colonizing diploid outperforms polyploid. AoB Plants 2016, 8. [Google Scholar] [CrossRef] [Green Version]
  76. Castillo, J.M.; Grewell, B.J.; Pickart, A.; Bortolus, A.; Peña, C.; Figueroa, E.; Sytsma, M. Phenotypic plasticity of invasive Spartina densiflora (Poaceae) along a broad latitudinal gradient on the Pacific Coast of North America. Am. J. Bot. 2014, 101, 448–458. [Google Scholar] [CrossRef] [Green Version]
  77. Grewell, B.J.; Castillo, J.M.; Thomason, M.J.S.; Drenovsky, R.E. Phenotypic plasticity and population differentiation in response to salinity in the invasive cordgrass Spartina densiflora. Biol. Invasions 2016, 18, 2175–2187. [Google Scholar] [CrossRef] [Green Version]
  78. Zhang, Z.J.; Zhou, F.; Pan, X.Y.; van Kleunen, M.; Liu, M.; Li, B. Evolution of increased intraspecific competitive ability following introduction: The importance of relatedness among genotypes. J. Ecol. 2019, 107, 387–395. [Google Scholar] [CrossRef]
  79. Liu, L.; Dong, B.C.; Alpert, P.; Yu, F.H. Effects of soil substrate heterogeneity and moisture on interspecific competition between Alternanthera philoxeroidesand four native species. J. Plant Ecol. 2016, 10, 528–537. [Google Scholar]
  80. Liu, M.; Zhou, F.; Pan, X.Y.; Zhang, Z.J.; Traw, M.B.; Li, B. Specificity of herbivore-induced responses in an invasive species, Alternanthera philoxeroides (alligator weed). Ecol. Evol. 2018, 8, 59–70. [Google Scholar] [CrossRef] [PubMed] [Green Version]
  81. Aerts, R.; Boot, R.G.A.; Van Der Aart, P.J.M. The relation between above- and belowground biomass allocation patterns and competitive ability. Oecologia 1991, 87, 551–559. [Google Scholar] [CrossRef] [PubMed]
  82. Cahill, J.J.F.; Casper, B.B. Investigating the relationship between neighbor root biomass and belowground competition: Field evidence for symmetric competition belowground. Oikos 2000, 90, 311–320. [Google Scholar] [CrossRef] [Green Version]
  83. Rudak, A.; Wódkiewicz, M.; Znój, A.; Chwedorzewska, K.J.; Galera, H. Plastic biomass allocation as a trait increasing the invasiveness of annual bluegrass (Poa annua L.) in Antarctica. Polar Biol. 2018, 42, 149–157. [Google Scholar] [CrossRef] [Green Version]
  84. Poorter, H.; Niklas, K.J.; Reich, P.B.; Oleksyn, J.; Poot, P.; Mommer, L. Biomass allocation to leaves, stems and roots: Meta-analyses of interspecific variation and environmental control. New Phytol. 2012, 193, 30–50. [Google Scholar] [CrossRef]
  85. Ren, G.Q.; Li, Q.; Li, Y.; Li, J.; Adomako, M.O.; Dai, Z.C.; Li, G.L.; Wan, L.Y.; Zhang, B.; Zou, C.B.; et al. The enhancement of root biomass increases the competitiveness of an invasive plant against a co-occurring native plant under elevated nitrogen deposition. Flora 2019, 261, 151486. [Google Scholar] [CrossRef]
  86. Harms, N.E.; Cronin, J.T.; Gaskin, J.F. Increased ploidy in the invasive range of Butomus umbellatus L. is not associated with higher phenotypic plasticity to N and P. in review. 2020. [Google Scholar]
  87. Sterck, F.J.; Clark, D.B.; Clark, D.A.; Bongers, F. Light fluctuations, crown traits, and response delays for tree saplings in a Costa Rican lowland rain forest. J. Trop. Ecol. 1999, 15, 83–95. [Google Scholar] [CrossRef] [Green Version]
  88. Bargeron, C.T.; Moorhead, D.J. EDDMapS—Early detection and distribution mapping system for the southeast exotic pest plant council. Wildland Weeds 2007, 10, 4–8. [Google Scholar]
Figure 1. Biomass variables for the submersed interaction experiment. Black bars are mean values for plants growing in monoculture and gray bars are mean values of plants growing in experimental communities. Panels with population means (A,C,E) are presented to illustrate variation at the plant level, but statistics are presented for cytotype means only (B,D,F). Letters above bars represent distinct group means designated by Tukey post-hoc comparison.
Diversity 12 00040 g001
Figure 2. Mean (± 95% Confidence Interval) relative interaction intensities (RII) for flowering rush cytotypes and neighbors grown in experimental communities under submersed (A) or emergent (B) conditions. White circles are RII values of diploid plants (or neighbors grown with diploid plants) and black circles are RII for triploid plants (or neighbors grown with triploid plants). The more negative RII values correspond to a greater effect of competition. Significant differences (p < 0.05) between cytotype means (i.e., their 95% CI do not overlap) are indicated by an asterisk. If confidence intervals of a mean do not overlap zero (e.g., neighbor means in panel B), the interpretation is that of a significant competitive effect for that treatment. For example, in panel (A), triploid and diploid RII means are significantly different to each other, but diploid RII is not significantly different to zero (i.e., no effect).
Diversity 12 00040 g002
Figure 3. Biomass variables for the emergent interaction experiment. Black bars are mean values for plants growing in monoculture and gray bars are mean values of plants growing in an experimental community. Panels with population means (A,C,E) are presented to illustrate variation at the plant level, but statistical results (i.e., means separation) are presented for cytotype means only (B,D,F). Letters above bars represent distinct group means designated by Tukey post-hoc comparison.
Diversity 12 00040 g003aDiversity 12 00040 g003b
Table 1. Populations used to test for differences between cytotypes in invasiveness under submersed or emergent conditions.
Population LatitudeLongitudeCytotypeGenotype *
Kildeer Pond, OH, USA40.710−83.369DiploidG4
Springbrook Pond, IL, USA41.730−88.205DiploidG3
Point Rosa Marsh, MI, USA42.576−82.805DiploidG4
Oswegatchie River, NY, USA44.690−75.495DiploidG4
Kenduskeag River, ME, USA44.818−68.793DiploidG4
Forest Lake, MN, USA45.272−92.937DiploidG5
Mississippi River, IL, USA42.343−90.409TriploidG1
Rose Pond, ID, USA43.247−112.315TriploidG1
Mississquoi River, VT, USA44.951−73.162TriploidG1
Flathead Lake, MT, USA47.697−114.071TriploidG1
* Genotype designation from J. Gaskin (personal communication).
Table 2. ANOVA results for submersed and emergent competition experiments with B. umbellatus, based on B. umbellatus biomass variables.
FactorNum dfDen dfFp
SubmersedTotal biomass
Cytotype113.48.740.011
Neighbor presence1981.490.225
Cytotype × Neighbor presence198.80.770.383
Initial mass11031.210.275
Reproductive biomass
Cytotype115.75.390.034
Neighbor presence198.20.180.670
Cytotype × Neighbor presence199.40.090.771
Initial mass190.60.380.539
Shoot:root Ratio
Cytotype111.86.70.024
Neighbor presence197.312.81<0.001
Cytotype × Neighbor presence198.12.20.141
Initial mass11050.590.445
EmergentTotal biomass
Cytotype110.420.93<0.001
Neighbor presence110794.28<0.001
Cytotype × Neighbor presence110734.64<0.001
Initial mass11097.440.007
Reproductive biomass
Cytotype111.523.81<0.001
Neighbor presence110739.67<0.001
Cytotype × Neighbor presence110723.6<0.001
Initial mass196.13.930.05
Shoot:root Ratio
Cytotype111.94.860.048
Neighbor presence1106124.8<0.001
Cytotype × Neighbor presence110618.73<0.001
Initial mass194.14.780.031

