Article

Near Infrared Spectroscopy for On-line Monitoring of Alkali- Free Cloth /Phenolic Resin Prepreg During Manufacture

Polymer Materials and Engineering Division, Department of Applied Chemistry, Harbin Institute of Technology, P.O. Box: 410, Harbin 150001, P. R. China
*
Author to whom correspondence should be addressed.
Int. J. Mol. Sci. 2007, 8(6), 541-552; https://doi.org/10.3390/i8060541
Submission received: 13 February 2007 / Revised: 30 May 2007 / Accepted: 7 June 2007 / Published: 19 June 2007
(This article belongs to the Section Physical Chemistry, Theoretical and Computational Chemistry)

Abstract

:
A NIR method was developed for the on-line monitoring of alkali-free cloth/phenolic resin prepreg during its manufacturing process. First, the sizing content of the alkali-free cloth was analyzed, and then the resin, soluble resin and volatiles content of the prepreg was analyzed simultaneously using the FT-NIR spectrometer. Partial least square (PLS) regression was used to develop the calibration models, which for the sizing content was preprocessed by 1stDER +MSC, for the volatile content by 1stDER +VN, for the soluble resin content by 1stDER +MSC and for the resin content by the VN spectral data preprocessing method. RMSEP of the prediction model for the sizing content was 0.732 %, for the resin content it was 0.605, for the soluble resin content it was 0.101 and for volatiles content it was 0.127. The results of the paired t-test revealed that there was no significant difference between the NIR method and the standard method. The NIR spectroscopy method could be used to predict the resin, soluble resin and the volatiles content of the prepreg simultaneously, as well as sizing content of alkali-free cloth. The processing parameters of the prepreg during manufacture could be adjusted quickly with the help of the NIR analysis results. The results indicated that the NIR spectroscopy method was sufficiently accurate and effective for the on-line monitoring of alkali-free cloth/phenolic resin prepreg.

1. Introduction

A prepreg is a semi-finished, machine-made product in which a reinforcement material has been impregnated with a pre-catalyzed resin [1]. It has been traditionally employed in the fabrication of high performance composites which could be used for aerospace components, high performance yachts, racing cars, sports equipments and so on [24]. As the quality of the prepreg will greatly influence the properties of the composite products, it is important to monitor the quality during the production of prepreg.
In the manufacture of the prepreg, the high sizing content will induce insufficient resin impregnation, while controlling the sizing content of the alkali-free cloth is very important to the impregnation.
In addition, the resin content, the soluble resin content and the volatile content are the key factors to ensure the quality of the prepreg. A low volatiles content could cause aging of the prepreg, while a high resin content could make the resin outflow and be wasted.
The traditional analytic method involves solvent extraction, weighing and burn-off. However, this method is not the best candidate for analyzing the quality of prepreg cloth due to the excessive time required, agent wasted and specimen destroyed. Besides, it can only analyze a small part of the prepreg.
In recent years, many methods such as gamma-ray reflectance [5], beta-ray transmission [68] and ultrasonic techniques [9,10] have been developed for analyzing the quality of the prepreg. However, these methods can only measure the resin content of the prepreg, the other factors cannot be measured. Further more, these radiant rays are also harmful.
Near-infrared (NIR) spectroscopy is a rapid and nondestructive method for the simultaneous measurement of different constituents in various products. Nowadays, NIR spectroscopy has been successfully applied in analysis process during the manufacture of certain polymers [1117]. In previous work, NIR spectroscopy was applied in the quality determination of phenolic resin prepreg cloth [1819]. It is ideally suited to quality control during the manufacture of prepreg. NIR spectra typically contains unselective, extensively overlapped bands, so it is necessary to use multivariate chemometric analytical tools such as partial least squares (PLS), principal components regression (PCR), multiple linear regression (MLR) for quantification analysis.
The aim of the study is to develop an on-line monitoring method using diffuse reflection nearinfrared spectroscopy for controlling the quality of alkali-free cloth/phenolic resin prepreg during the manufacture. Calibration models were developed by PLS, which were used to analyze unknown samples. The technical parameters could be adjusted quickly with the help of the NIR analysis results.

2. Results and Discussion

2.1 NIR spectra information of materials

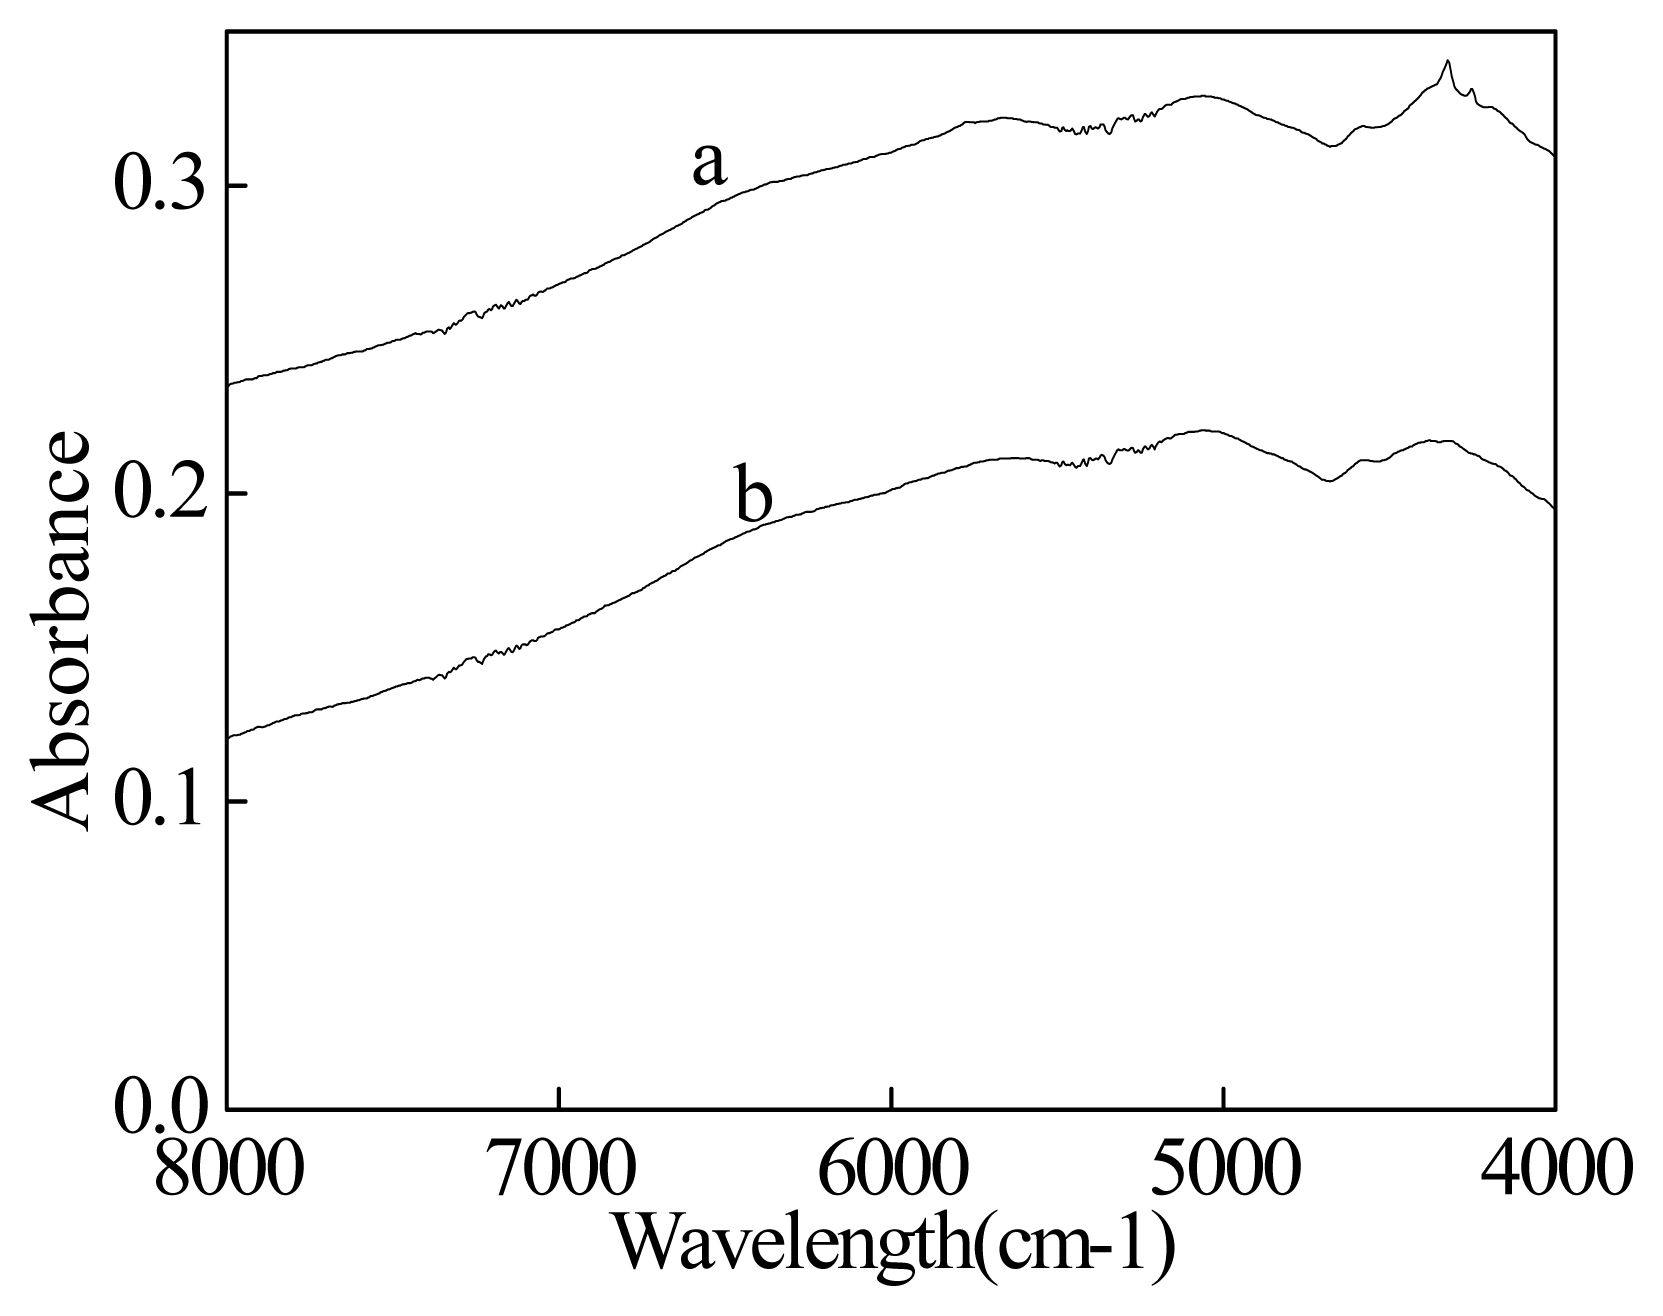
The spectra of original and preheated alkali-free cloth samples were shown in Figure 1. In Figure 1(a), the methyl and methylene groups gave two combination bands corresponding to the CH stretching and deformation mode at 4359 cm−1 and 4250 cm−1, the CH stretching overtone mode at 5668 cm−1. In Figure 1(b), the corresponding absorption bands of alkali-free glass cloth were unclear at 4359 cm−1 and 4250 cm−1, which indicated that the sizing was reduced in the preheating process.
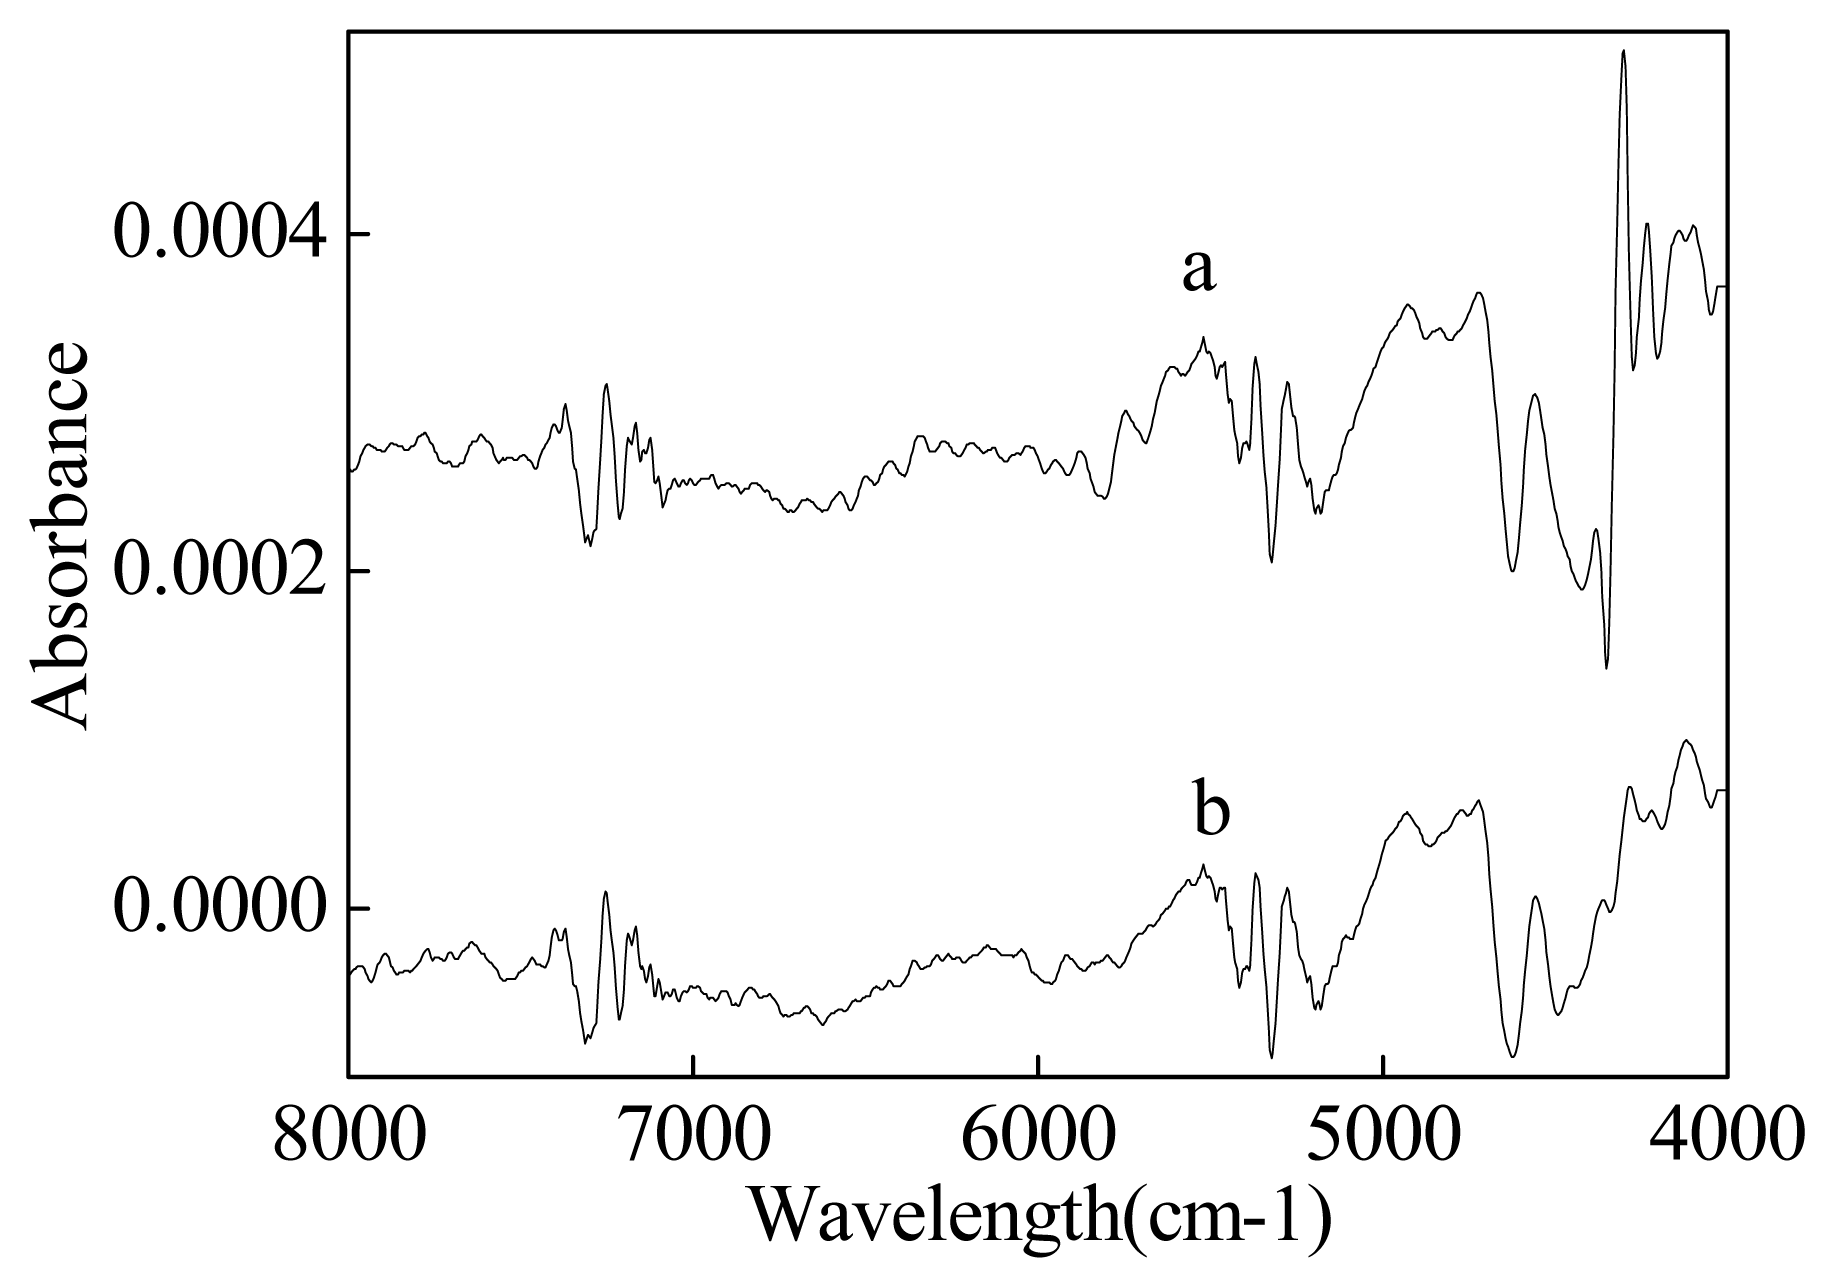
In Figure 1(b), the baseline distortions, scattering effects and overlapped peaks of NIR spectra can also be observed. Therefore, in order to eliminate these influences, the first derivative of spectra was employed and this is presented in Figure 2. The first derivative spectral pretreatments were applied by using the Savitzky-Golay algorithm with 17-point window.
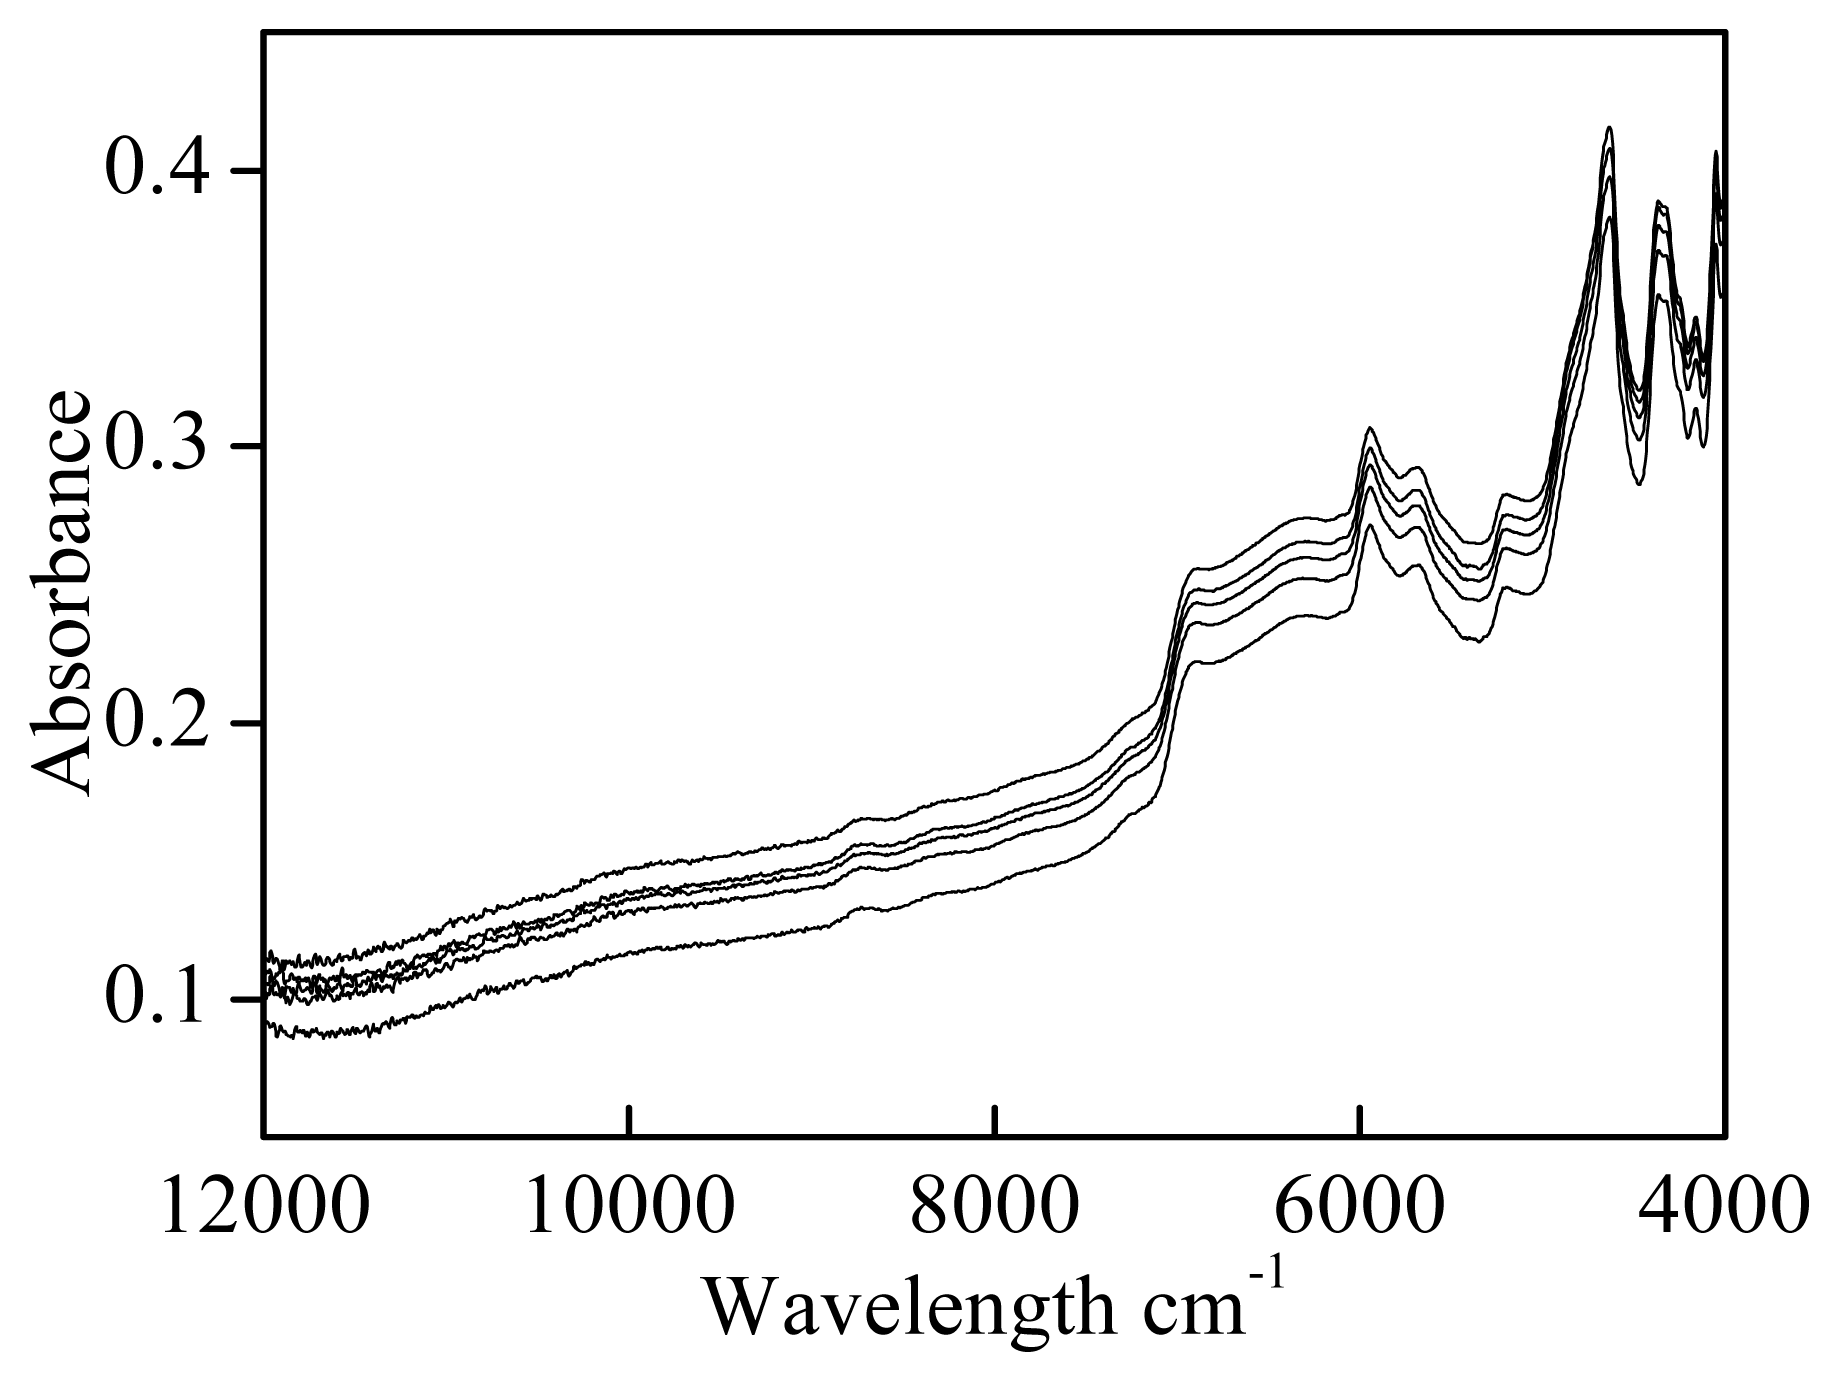
The prepreg resin system mostly contains phenolic resin, ethanol, byproducts, etc. The synthesis scheme for the phenolic resin is shown in Figure 3. Figure 4 shows the NIR spectra of the different concentrations of prepreg during manufacture; it could be observed that there are differences between them. In Figure 4, a combination band of CH stretching and deformation mode given by the benzene groups was at 4643 cm−1, and the first overtone of CH stretching mode from 5942 cm−1 is associated with the aliphatic CH2. A first overtone of OH stretching mode given by phenol and water was at 6925 cm−1.
From the above analysis, NIR spectra contained abundant information of samples, and a multivariate calibration method based on PLS could be used to extract relevant analytical information and determine the quality indexes.

2.2 Quantitative analysis models

The statistical parameters of the calibration models for the sizing, the resin, the soluble resin and the volatiles content are shown in Table 1. The mean, standard deviation (SD), the range of chemical composition, the sample numbers of the calibration and prediction were also included.

2.2.1 Sizing content model

The sizing content model obtained using different pre-processing routines and different spectral regions are illustrated in Table 2. The 1stDER method (smoothing points = 17) gave the best values for R2, RMSEC and RMSEP. Full cross-validation was applied to optimize the calibration models. In the optimize process, the best spectral regions and number of PLS factors were given.
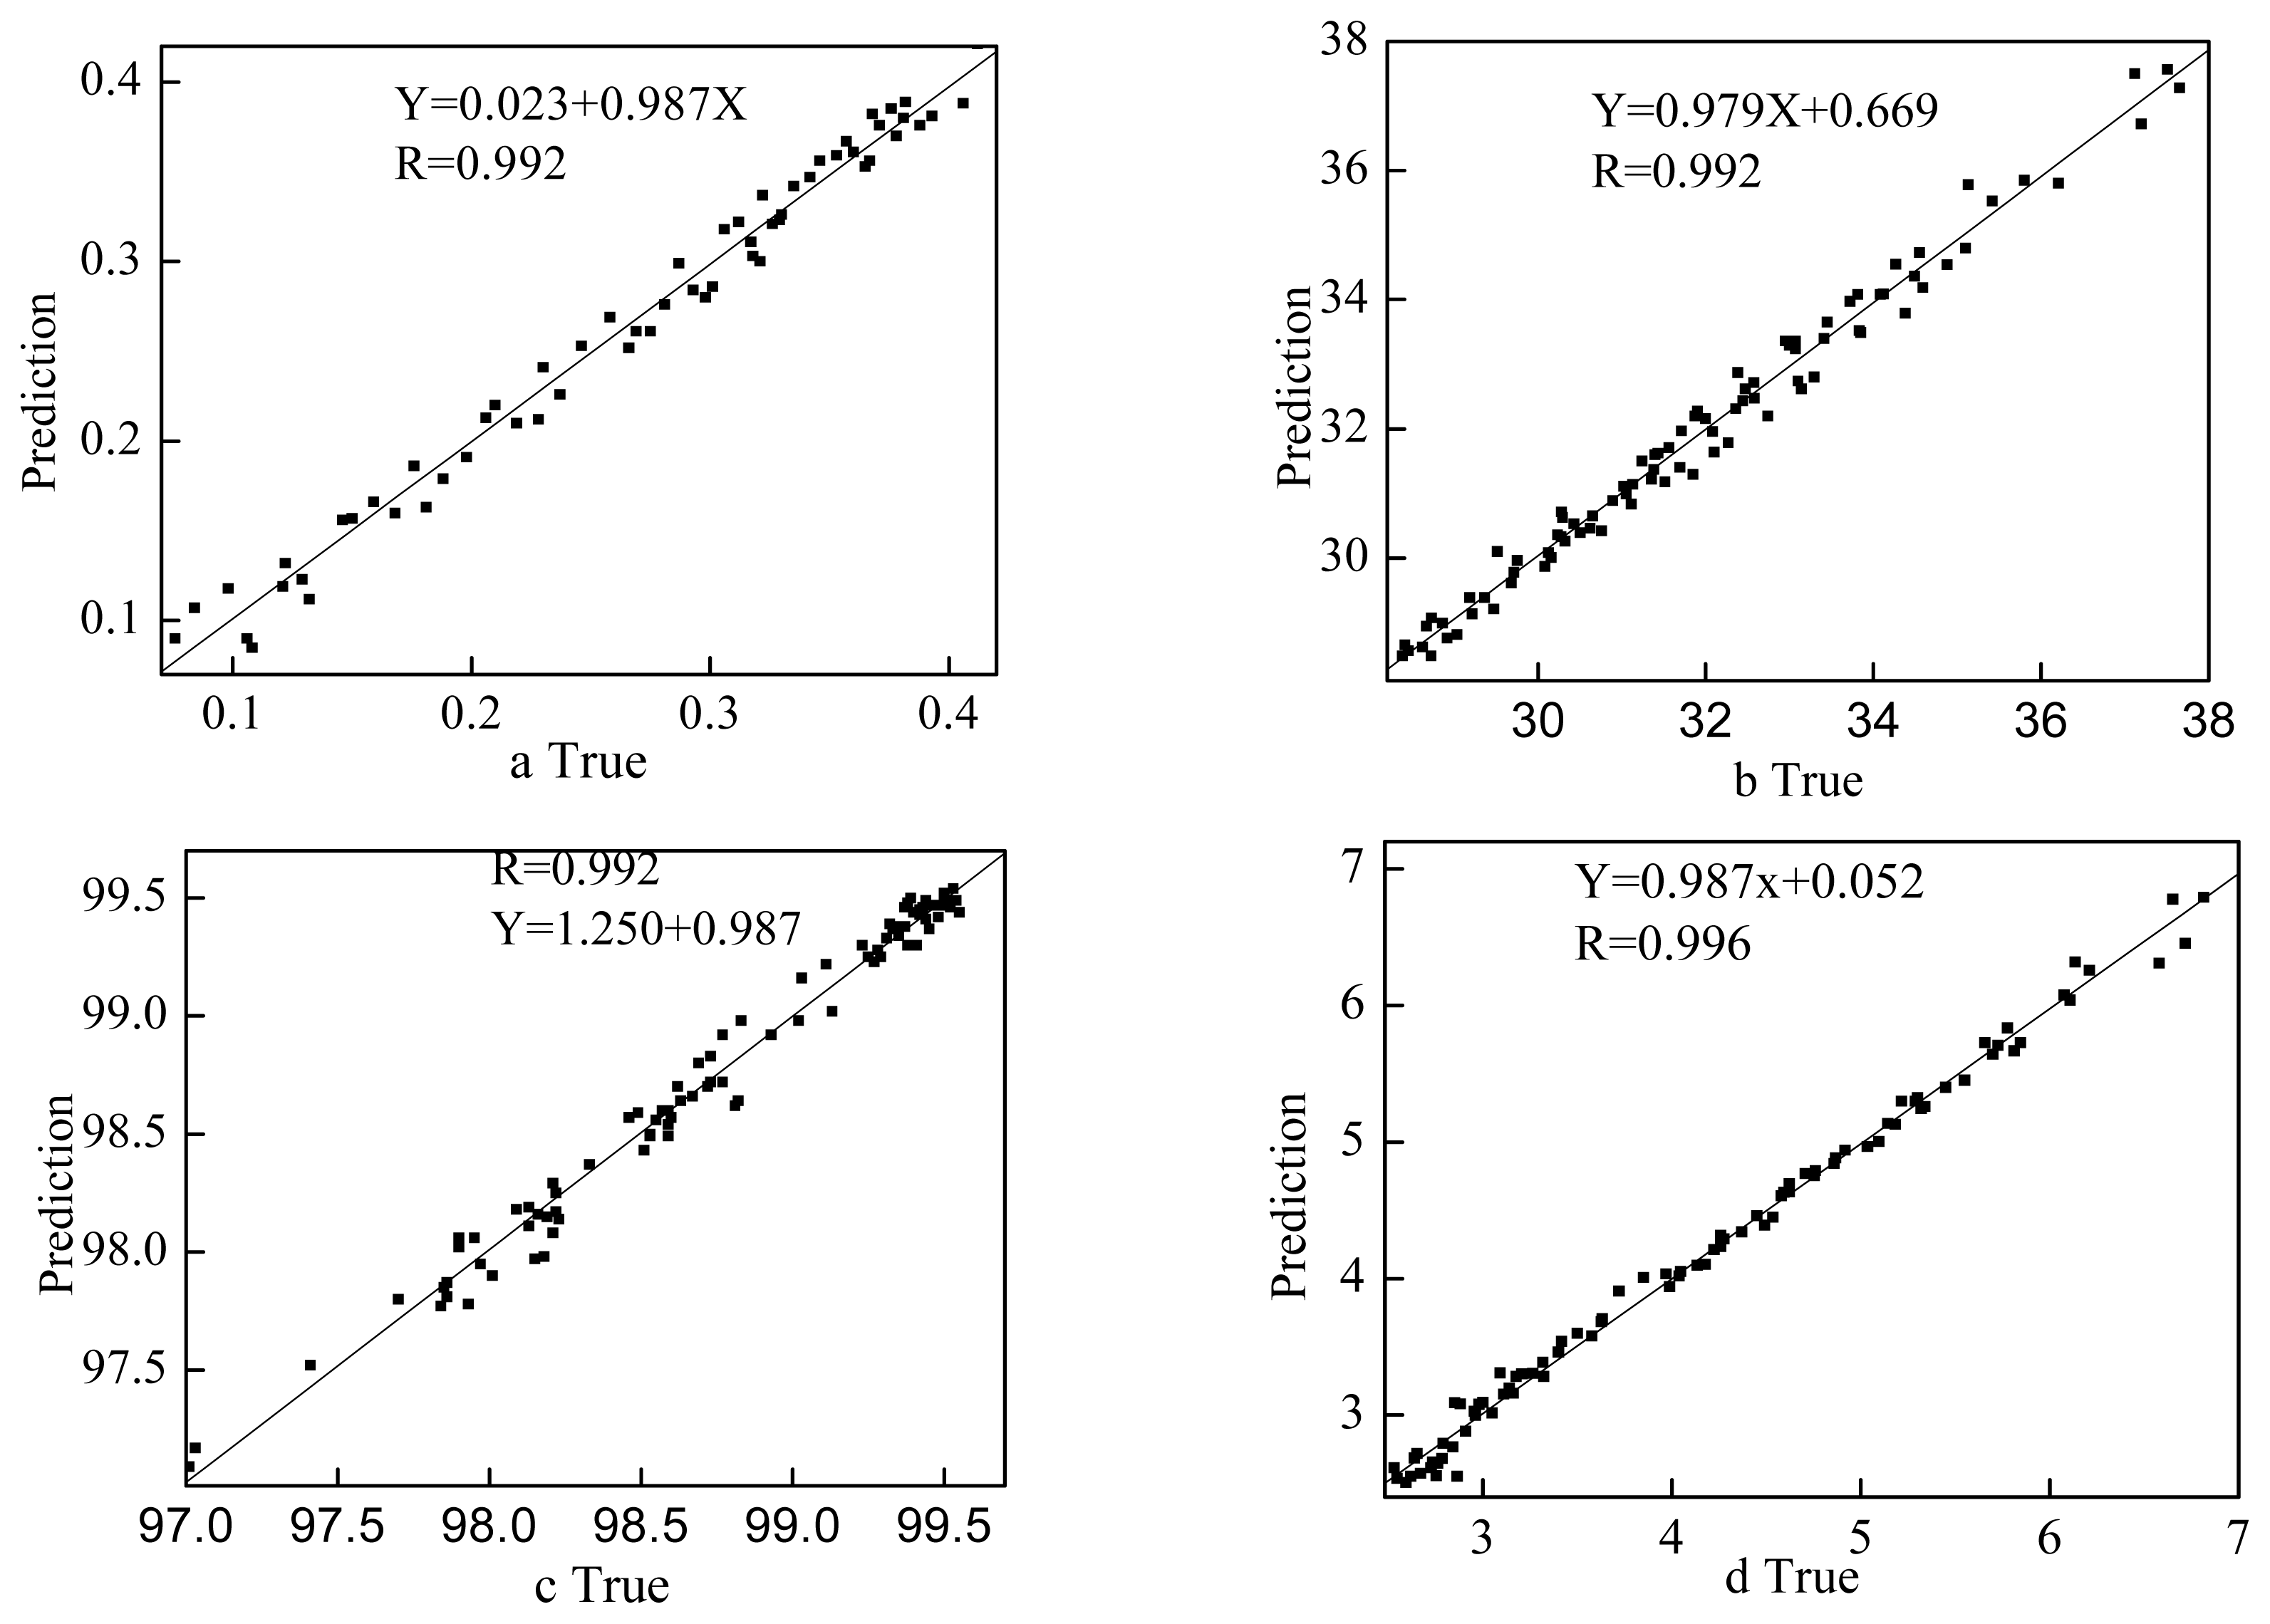
This model used 5 factors, achieving a R2 of 93.16, RMSECV of 0.608 % and a RMSEP of 0.732 %. The plots of the actual values against the NIR predicted values for calibration set are shown in Figure 5(a); it had a linear trend line with a slope of 0.987, a regression coefficient of 0.992 and an intercept of 0.023. Figure 5(a) shows a good correlation between the true concentration values, analyzed by standard method and the predicted concentrations, calculated from the NIR spectra using the PLS method.

2.2.2 Model of volatiles content, soluble resin content and resin content

In Table 3, the models using the spectral pretreatments and corresponding index of models evaluation (R2, RMSEC, RMSEP) can be observed. A linear relationship between the NIR predicted values and the actual values on the calibration set is shown in Figures 5(b,c,d). The results showed that there was no significant difference between the NIR method and the standard method.
To prove the repeatability of the NIR method, a sample was collected randomly and analyzed 10 times by NIR spectra. The standard deviation for the sizing content was 0.086 %, for the resin content was 0.065 %, for the soluble resin content was 0.039 % and for volatile content was 0.023 %. The result (Table 4) thus showed that there was good repeatability.
In order to further evaluate the reliability of the NIR method, the paired t-test (α = 0.05) was executed on the NIR prediction and actual values for the prediction set. The result (Table 5) showed that there was no significant difference between the NIR method and the standard method.
The above results indicated that the quantitative analysis models developed for the sizing content, resin content, soluble resin content and the volatiles content were accurate and reliable. It may be deduced that the NIR spectroscopy method is a very good alternative for the determination of these parameters.

2.3 On-line quality monitoring

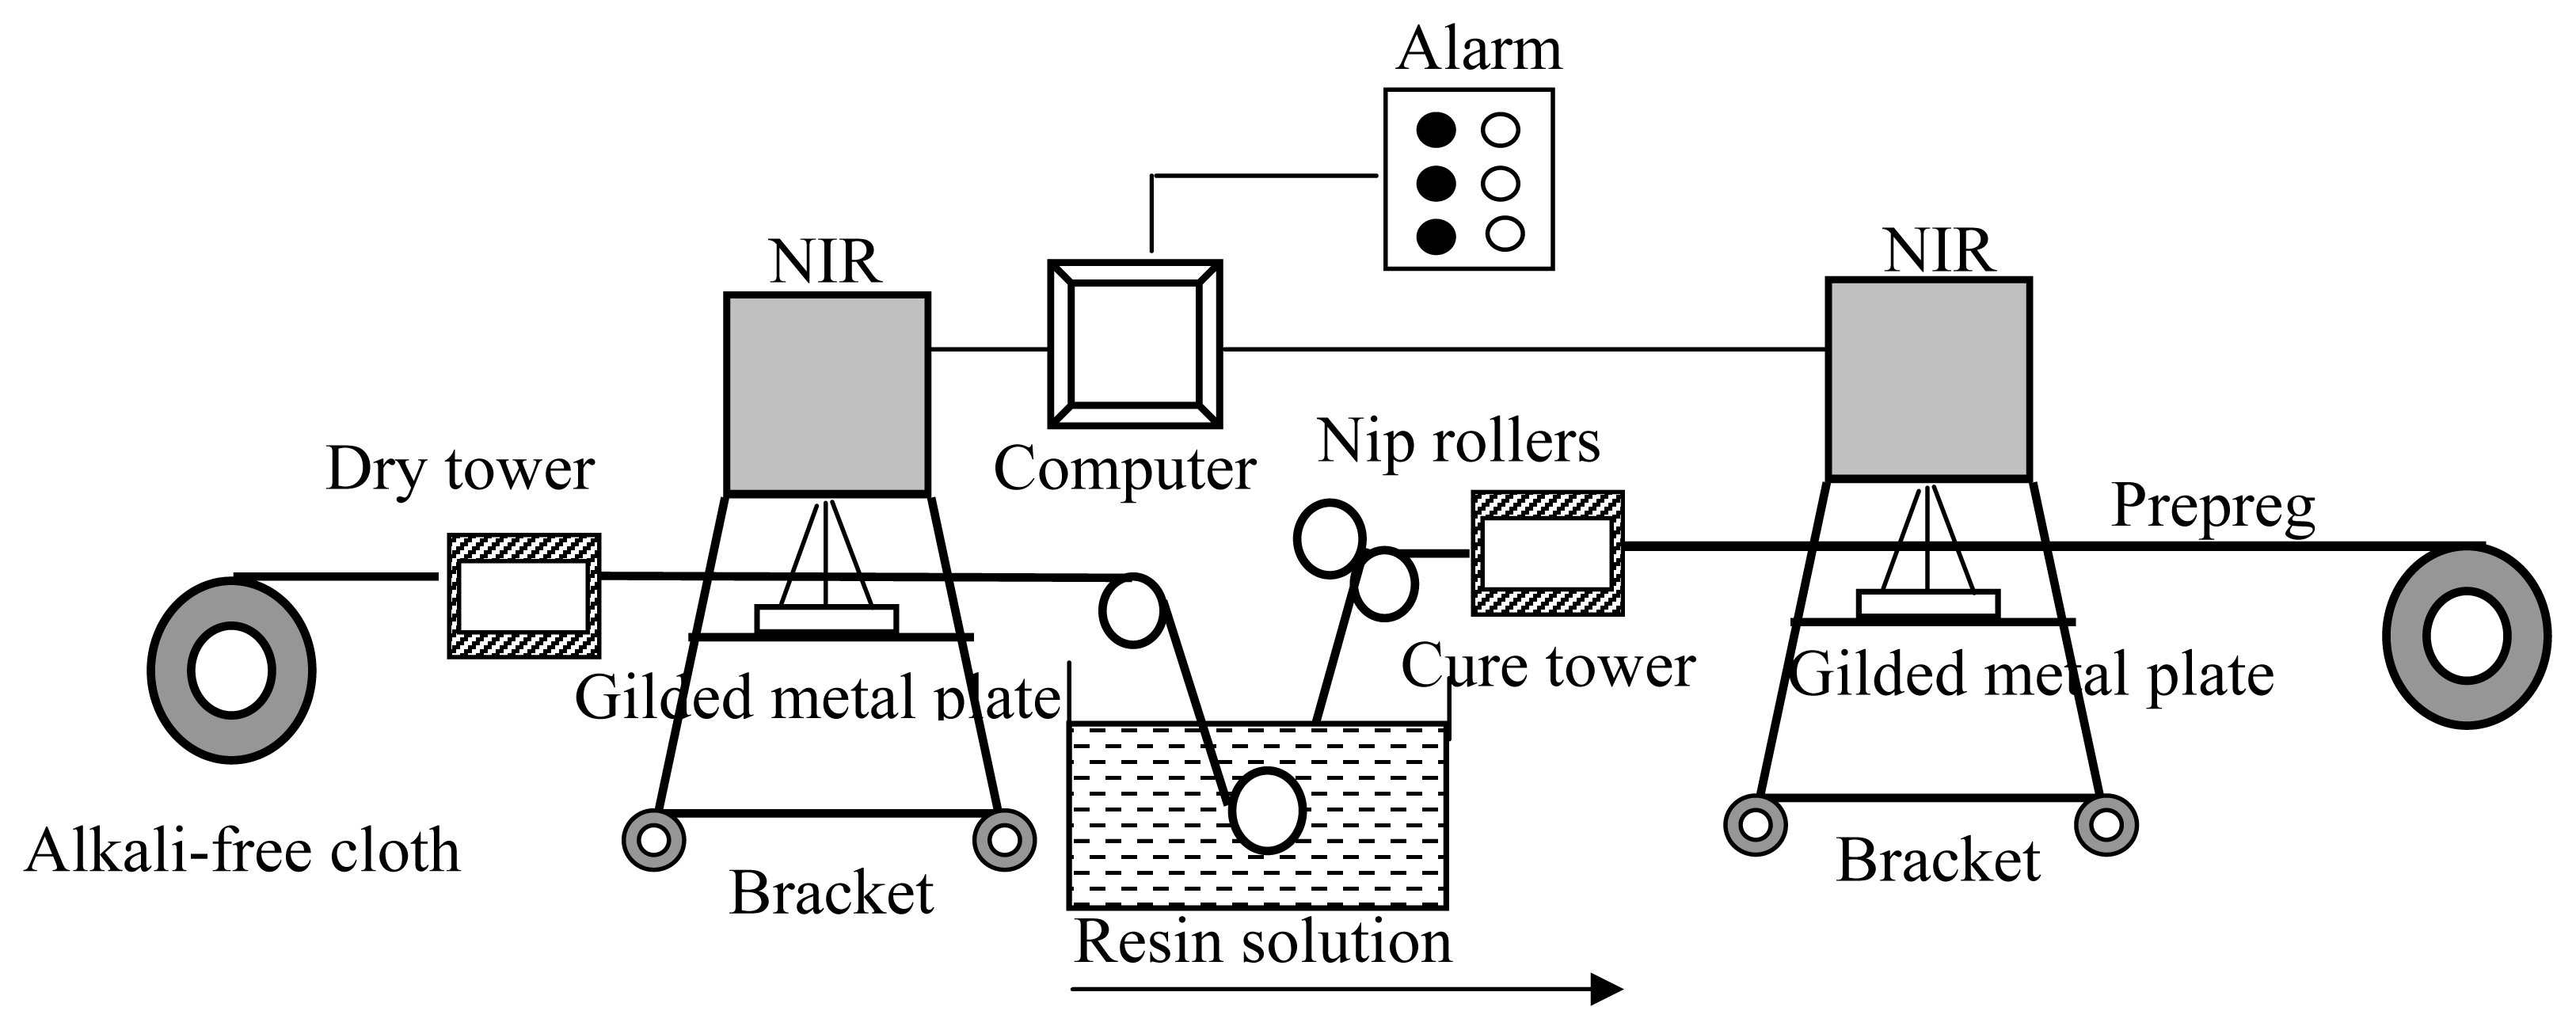
The developed models were implemented in the OPUS/PROCESS software (Bruker Co., Germany), and then the NIR spectroscopy method could be used to simultaneously predict the three quality indexes of the prepreg cloth and the sizing content of the alkali-free cloth during manufacture process. The spectra of the prepreg were collected once within 1min without sample destruction. The on-line quality control process is illustrated in Figure 6.
If the quality indexes of prediction measured high, the green alarm light would light up. If it was not within a pre-set scope according to the quality demand, the red alarm light would light up and the alarm sound. Based on NIR analysis system, the prepreg quality could be controlled properly by overall adjustment of the processing parameters. Changing the alkali-free cloth producing speed and temperature of dry tower could control the sizing content, while adjusting the concentration of phenolic resin solution and the distance of nip rollers could control the resin content. The modification of prepreg producing speed and temperature of the cure tower could control the soluble resin content and the volatile content. Therefore, a high quality prepreg cloth was obtained, at the same time the raw materials were saved.

Conclusions

It was successfully demonstrated that the NIR spectroscopy combined with the PLS method was feasible for the quality control analysis of the alkali-free cloth/phenolic resin prepreg. The results presented in this study showed that the NIR system could analyze the sizing content, the resin content, the soluble resin content and the volatiles content. Moreover, it was a reasonably accurate and effective method. Thus the NIR spectroscopy method would be a reliable substitute for the traditional chemical analysis method.

3. Experimental Section

3.1 Materials

Phenolic resin was provided by Beijing Research Institute of Material and Technology, China. Alkali-free glass cloth was obtained from Nanjing Research Institute of Glass Fibre, China.

3.2 The design of on-line analysis system

The on-line quality monitoring equipment of the prepreg cloth, which consisted of an FT-NIR spectrometer (Bruker Co., Germany), a bracket with a gilded metal plate, a computer and an alarm, is shown in Figure 7. The non-contact on-line spectrum instrument was assembled between the dry tower and the take up mechanism, a gilded metal plate was placed under the prepreg cloth in order to enhance the diffuse reflectance effect. With the help of the moving bracket, any part of the prepreg could be analyzed easily. The computer combined with the alarm could monitor the quality of the prepreg on-line.

3.3 Manufacture of prepreg cloth and analysis of NIR spectral data

First, the alkali-free cloth was preheated through dry tower (350 °C) in order to remove water and the great mass of surface sizing. The residual sizing content of the alkali-free cloth was analyzed through NIR method non-contact scanning method (Figure 7).
After preheating, the alkali-free cloth was pulled into the ethanol solution of phenolic resin, the impregnated cloth then went through the nip rollers to meter the cloth to solution ratio. It ran into another dry tower where the excessive solvent was driven off and the prepreg was formed. At this spot (Figure 1), the NIR spectrum instrument analyzed the resin content, soluble resin content and volatile content of the prepreg cloth by a non-contact scanning method.
In the test, the light from the sources was 17 cm far from prepreg cloth and the facular on it was 25 mm in diameter, the diffuse reflectance spectra from the cloth were recorded by the spectrometer. The NIR spectrometer was operated in the near infrared region from 4000 to 12,000 cm−1 using a tungsten light source and an indium gallium arsenide (InGaAs) detector, along with a CaF2 beamsplitter. The resolution of the spectra is 8 cm−1 and the average scanning times is 8, it is 1 seconds. The instrument was controlled via its bundled software. Multivariate calibration models were constructed and spectral pretreatments were applied using the OPUS/QUANT-2 software (Bruker Co., Germany).

3.4 Chemical analysis

When the spectrometer completed a collection of spectrum, the corresponding piece was cut from the cloth exactly and was regarded as one sample. When the production speed, the concentration of solution, the distance of nip rollers and the temperature of dry tower were changed, different samples were collected which could represent the character of the alkali-free cloth and prepreg cloth.
For the sizing content of the alkali-free cloth, the test specimen W was placed in the oven at 110 °C for 10 min and weighed to the nearest 0.0001 g to obtain the weight WB1, then was placed in a muffle furnace at 600 °C for 15 min and weighed to obtain the weight WB2. The sizing content (S %) was calculated as follows:
S % = W B 1 - W B 2 W B 1 × 100
For the prepreg sample, the test specimen was divided into two equal parts A and B, and weighed separately to the nearest 0.0001 g to obtain the initial weight WA and WB. Part A was placed in an oven at 160 °C for 10 min, cooled in a desiccator, and immediately weighed to obtain the weight WA1. Part B was dissolved in acetone for 10 min, placed in the oven at 160 °C for 10 min and weighed to obtain the weight WB1, then was placed in a muffle furnace at 600 °C for 10 min and weighed to obtain the weight WB2. The volatile content (V%), the resin content (R %) and the soluble resin content (S %)
were calculated as follows:
V % = ( W A - W A 1 ) / W A × 100
R % = ( W B × ( 1 - V ) - W B 2 ) / W B × ( 1 - V ) × 100
S % = ( W B × ( 1 - V ) - W B 1 ) / ( W B × ( 1 - V ) - W B 2 ) × 100

3.5 Statistical analysis

PLS regression was used to develop the calibration models. The determination coefficient (R2), root mean square error of calibration (RMSEC) and root mean square error of prediction (RMSEP) were calculated to evaluate the model and find the best model. The linearity correlation coefficients(R) were a measure of the consistency between the NIR prediction values and actual values for the calibration set. Full cross-validation (leave-one-out) was applied to optimize the calibration models. In the optimize process, the number of PLS factors was determined and the outliers were detected. Spectral outliers were detected through the Mahalanobis distance. A spectrum with a Mahalanobis distance larger than the limit was marked as a spectral outlier.
In order to eliminate variations in offset or different linear baselines and instrument noise, to ensure a good correlation between the spectral data and the concentration values, several spectral pretreatments were tested such as straight line subtraction (SLS), vector normalization (VN), min-max normalization (M-MN), multiplicative scattering correction (MSC), first derivative (1stDER), second derivative (2ndDer), 1stDER +SLS, 1stDER +MSC, 1stDER +VN, constant offset elimination (COE).
Figure 1. NIR spectra of the alkali-free cloth: (a ) original (b) preheated
Ijms 08 00541f1
Figure 2. First derivative near infrared spectra of the alkali-free cloth: (a ) original (b) preheated.
Ijms 08 00541f2
Figure 3. Synthesis scheme for phenolic resin.
Ijms 08 00541f3
Figure 4. On-line near infrared spectra of the prepreg with different contents during the manufacture.
Ijms 08 00541f4
Figure 5. Correlation between predicted values and actual values for: (a) sizing content (b) resin content, (c) soluble resin content,(d) volatile content.
Ijms 08 00541f5
Figure 6. On-line monitor of prepreg quality by NIR
Ijms 08 00541f6
Figure 7. Schematic diagram of NIR monitoring manufacture process of prepreg cloth
Ijms 08 00541f7
Table 1a. Statistical parameter of calibration set for quality indexes of the prepreg.
Calibration (N = 90)Prediction(N = 27)
Quality indexesMaxMinMeanSDMaxMinMeanSD
Volatile content (%)6.812.514.161.216.652.514.371.24
Resin content (%)37.6528.3831.962.2737.1228.3832.042.12
Soluble resin content (%)99.5597.0198.750.6499.5497.0198.930.66
Table 1b. Statistical parameter of calibration set for quality indexes of the alkali-free cloth.
Calibration (N = 60)Prediction(N = 20)
Quality indexesMaxMinMeanSDMaxMinMeanSD
Sizing content (%)0.410.0760.2670.0970.400.0850.290.091
Table 2. R2, RMSECV, RMSEP and number of factors for the sizing models using different preprocessing routines.
ModelPre-processing routineR2RMSECVRMSEPNumber of factors
Sizing1stDER (smoothing points:17) (7501–6098 and 5453–4246) cm−193.160.6080.7325
Table 3. R2, RMSECV, RMSEP and number of factors for the prepreg quality models using different pre-processing routines.
ModelPre-processing routineR2RMSECVRMSEPNumber of factors
Volatile1stDER +VN (smoothing points:17) (7501–6098 and 5453–4246) cm−198.590.1310.1713
ResinVN (7501–6098 and 4600–4246) cm−193.590.560.656
Soluble1stDER +MSC (smoothing points:17) (7501–5450 and 4600–4246) cm−198.410.0850.1499
Table 4. The repeatability of NIR methods.
Quality indexestruePredictionSD
Volatile content (%)3.123.050.023
Resin content (%)31.2631.570.065
Soluble resin content99.3199.190.039
Sizing content (%)0.350.390.086
Table 5. Results of the paired t-test on NIR prediction and actual values for the prediction set.
N = 27N = 20
Resin contentVolatile contentSoluble resin contentSizing content
SD (%)0.3930.1110.1530.012
t experiment1.0581.6850.4070.372
t critical2.0562.093

Acknowledgements

This work was financilly supported by Grant No.50333030 from the National Natural Science Foundation of China and Grant No.JC04-12 from the Outstanding Youth Foundation of Heilongjiang Province of China.

References and Notes

  1. Banks, R.; Mouritz, A.P.; John, S.; Coman, F.; Paton, R. Development of a new structural prepreg: characterization of handling, drape and tack properties. Compos. Struct 2004, 66, 169– 174. [Google Scholar]
  2. Mariatti, M.; Nasir, M.; Ismail, H. Effect of sample cutting direction on mechanical properties of woven thermoplastic prepreg. Polym. Test 2000, 19, 617–624. [Google Scholar]
  3. Hyoung, G.K.; Dai, G.L. Dielectric cure monitoring for glass/polyester prepreg composites of handling. drape and tack properties. Compos. Struct 2002, 57, 91–99. [Google Scholar]
  4. Hayes, B.S; Gilbert, E.N.; Seferis, J.C. Scaling complications of dual temperature cure resin prepreg systems in airplane part manufacture. Composites: Part A 2000, 31, 717–725. [Google Scholar]
  5. Teagle, P.R. The quality control and non-destructive evaluation of composite aerospace components. Composites 1983, 14, 115–128. [Google Scholar]
  6. Molyneux, M. Prepreg tape and fabric technology for advanced composites. Composites 1983, 14, 87–91. [Google Scholar]
  7. Huang, Y.D.; Liu, L.; Zhang, Z.Q.; Wang, Y. On-line monitoring of resin content for film impregnation process. Comp. Sci. Tech 1998, 58, 1531–1534. [Google Scholar]
  8. Huang, Y.D.; Liu, L.; Sun, Y.F.; Qiu, J.H.; Nakayama, N.; Kumazawa, T. Continouous monitoring of resin content in prepreg unidirectional tapes by beta-ray method. Adv. Comp. Letters 2002, 11, 28–32. [Google Scholar]
  9. Broughton, W.R.; Chester, R.J. The development of a portable ultrasonic facility for NDT of graphite/epoxy composites. Non-Destructive. Test 1986, 32(2), 38–40. [Google Scholar]
  10. Anderson, M.J.; Faull, J.A.; Menson, S.M. Evaluation of electrostatic air coupled ultrasonic technology for measuring changes in resin content in carbon prepreg tow materials. J. Adv. Mater. 1997, 28, 2–7. [Google Scholar]
  11. Miralbes, C. Quality control in the milling industry using near infrared transmittance spectroscopy. Food. Chem 2004, 88, 621–628. [Google Scholar]
  12. Dessipri, E.; Minopoulou, E.; Chryssikos, G.D.; Gionis, V.; Paipetis, A.; Panayiotou, C. Use of FT-NIR spectroscopy for on-line monitoring of formaldehyde-based resin synthesis. Eur. Polym. J 2003, 39, 1533–1540. [Google Scholar]
  13. Rohe, T.; Becker, W. Near infrared (NIR) spectroscopy for in-line monitoring of polymer extrusion processes. Talanta 1999, 50, 283–290. [Google Scholar]
  14. Marengoa, E.; Bobbaa, M.; Robotti, E. Hydroxyl and acid number prediction in polyester resins by near infrared spectroscopy and artificial neural networks. Anal Chim Acta 2004, 511, 313–322. [Google Scholar]
  15. Escola, M.A.; Moina, C.A. The determination of the degree of cure in epoxy paints by infrared spectroscopy. Polym. Test 2005, 24, 572–575. [Google Scholar]
  16. Garrido, M.; Lázaro, I.; Larrechi, M.S. Multivariate resolution of rank-deficient near-infrared spectroscopy data from the reaction of curing epoxy resins using the rank augmentation strategy and multivariate curve resolution alternating least squares approach. Anal. Chim. Acta 2004, 515, 65–73. [Google Scholar]
  17. Curda, L.; Kukackova, O. NIR spectroscopy: a useful tool for rapid monitoring of processed cheeses manufacture. J. Food. Eng 2004, 61, 557–560. [Google Scholar]
  18. Li, W.; Huang, Y.D.; Liu, L. The application of near infrared spectroscopy in the quality control analysis of glass/phenolic resin prepreg. J. Mater. Sci 2006, 41, 7183–7189. [Google Scholar]
  19. Li, W.; Huang, Y.D.; Liu, L. On-line monitoring of resin content and volatile content in carbon/phenolic resin prepreg cloth by near-infrared spectroscopy. Polym. Polym. Comp 2006, 14, 537–543. [Google Scholar]