1. Introduction
Transferrin receptor (TfR) [
1,
2,
3] is a glycoprotein mediating the entry of ferric transferrin (Tf) from the extracellular compartment into the cells. TfR are present on the surface of many cell types but they are most abundant on cells active in hemoglobin synthesis [
1,
2,
3]. Up-regulation of the expression of cellular TfR occurs as a result of an inadequate tissue supply of iron or increased cellular demand for iron, therefore, elevation of soluble form of TfR (sTfR) can be detected in the context of iron deficiency anemia, thalassemia and polycythemia. Presently, the determination of sTfR becomes a widely used tool for measuring erythropoiesis [
1,
2,
3], but most tests are mainly restricted to research laboratory settings. At present, plasma concentrations of the receptor reflect cellular receptor numbers and may be determined by enzyme immunoassay on automated analyzer [
4]. Recently, Bhokaisawan
et al studied the diagnostic value of sTfR and they found that sTfR could be used as an alternative test for monitoring of erythropoiesis [
5]. For present clinical application, sTfR can be used to study erythropoiesis in situations in which ferrokinetics is not acceptable such as pregnancy [
6]. Also, sTfR is particularly useful for serial studies such as for monitoring the recovery of erythropoiesis after stem cell transplantation or after treatment with erythropoietin [
6].
The structures of both Tf and TfR have been studied and documented for a few recent years. However, the knowledge on the complex, recombination, between Tf and sTfR is limited. Here, the author performs an analysis to study the molecular structure of human Tf - sTfR complex. To reach the target, a computer-based study for in silico protein recombination modeling is performed.
2. Results and Discussion
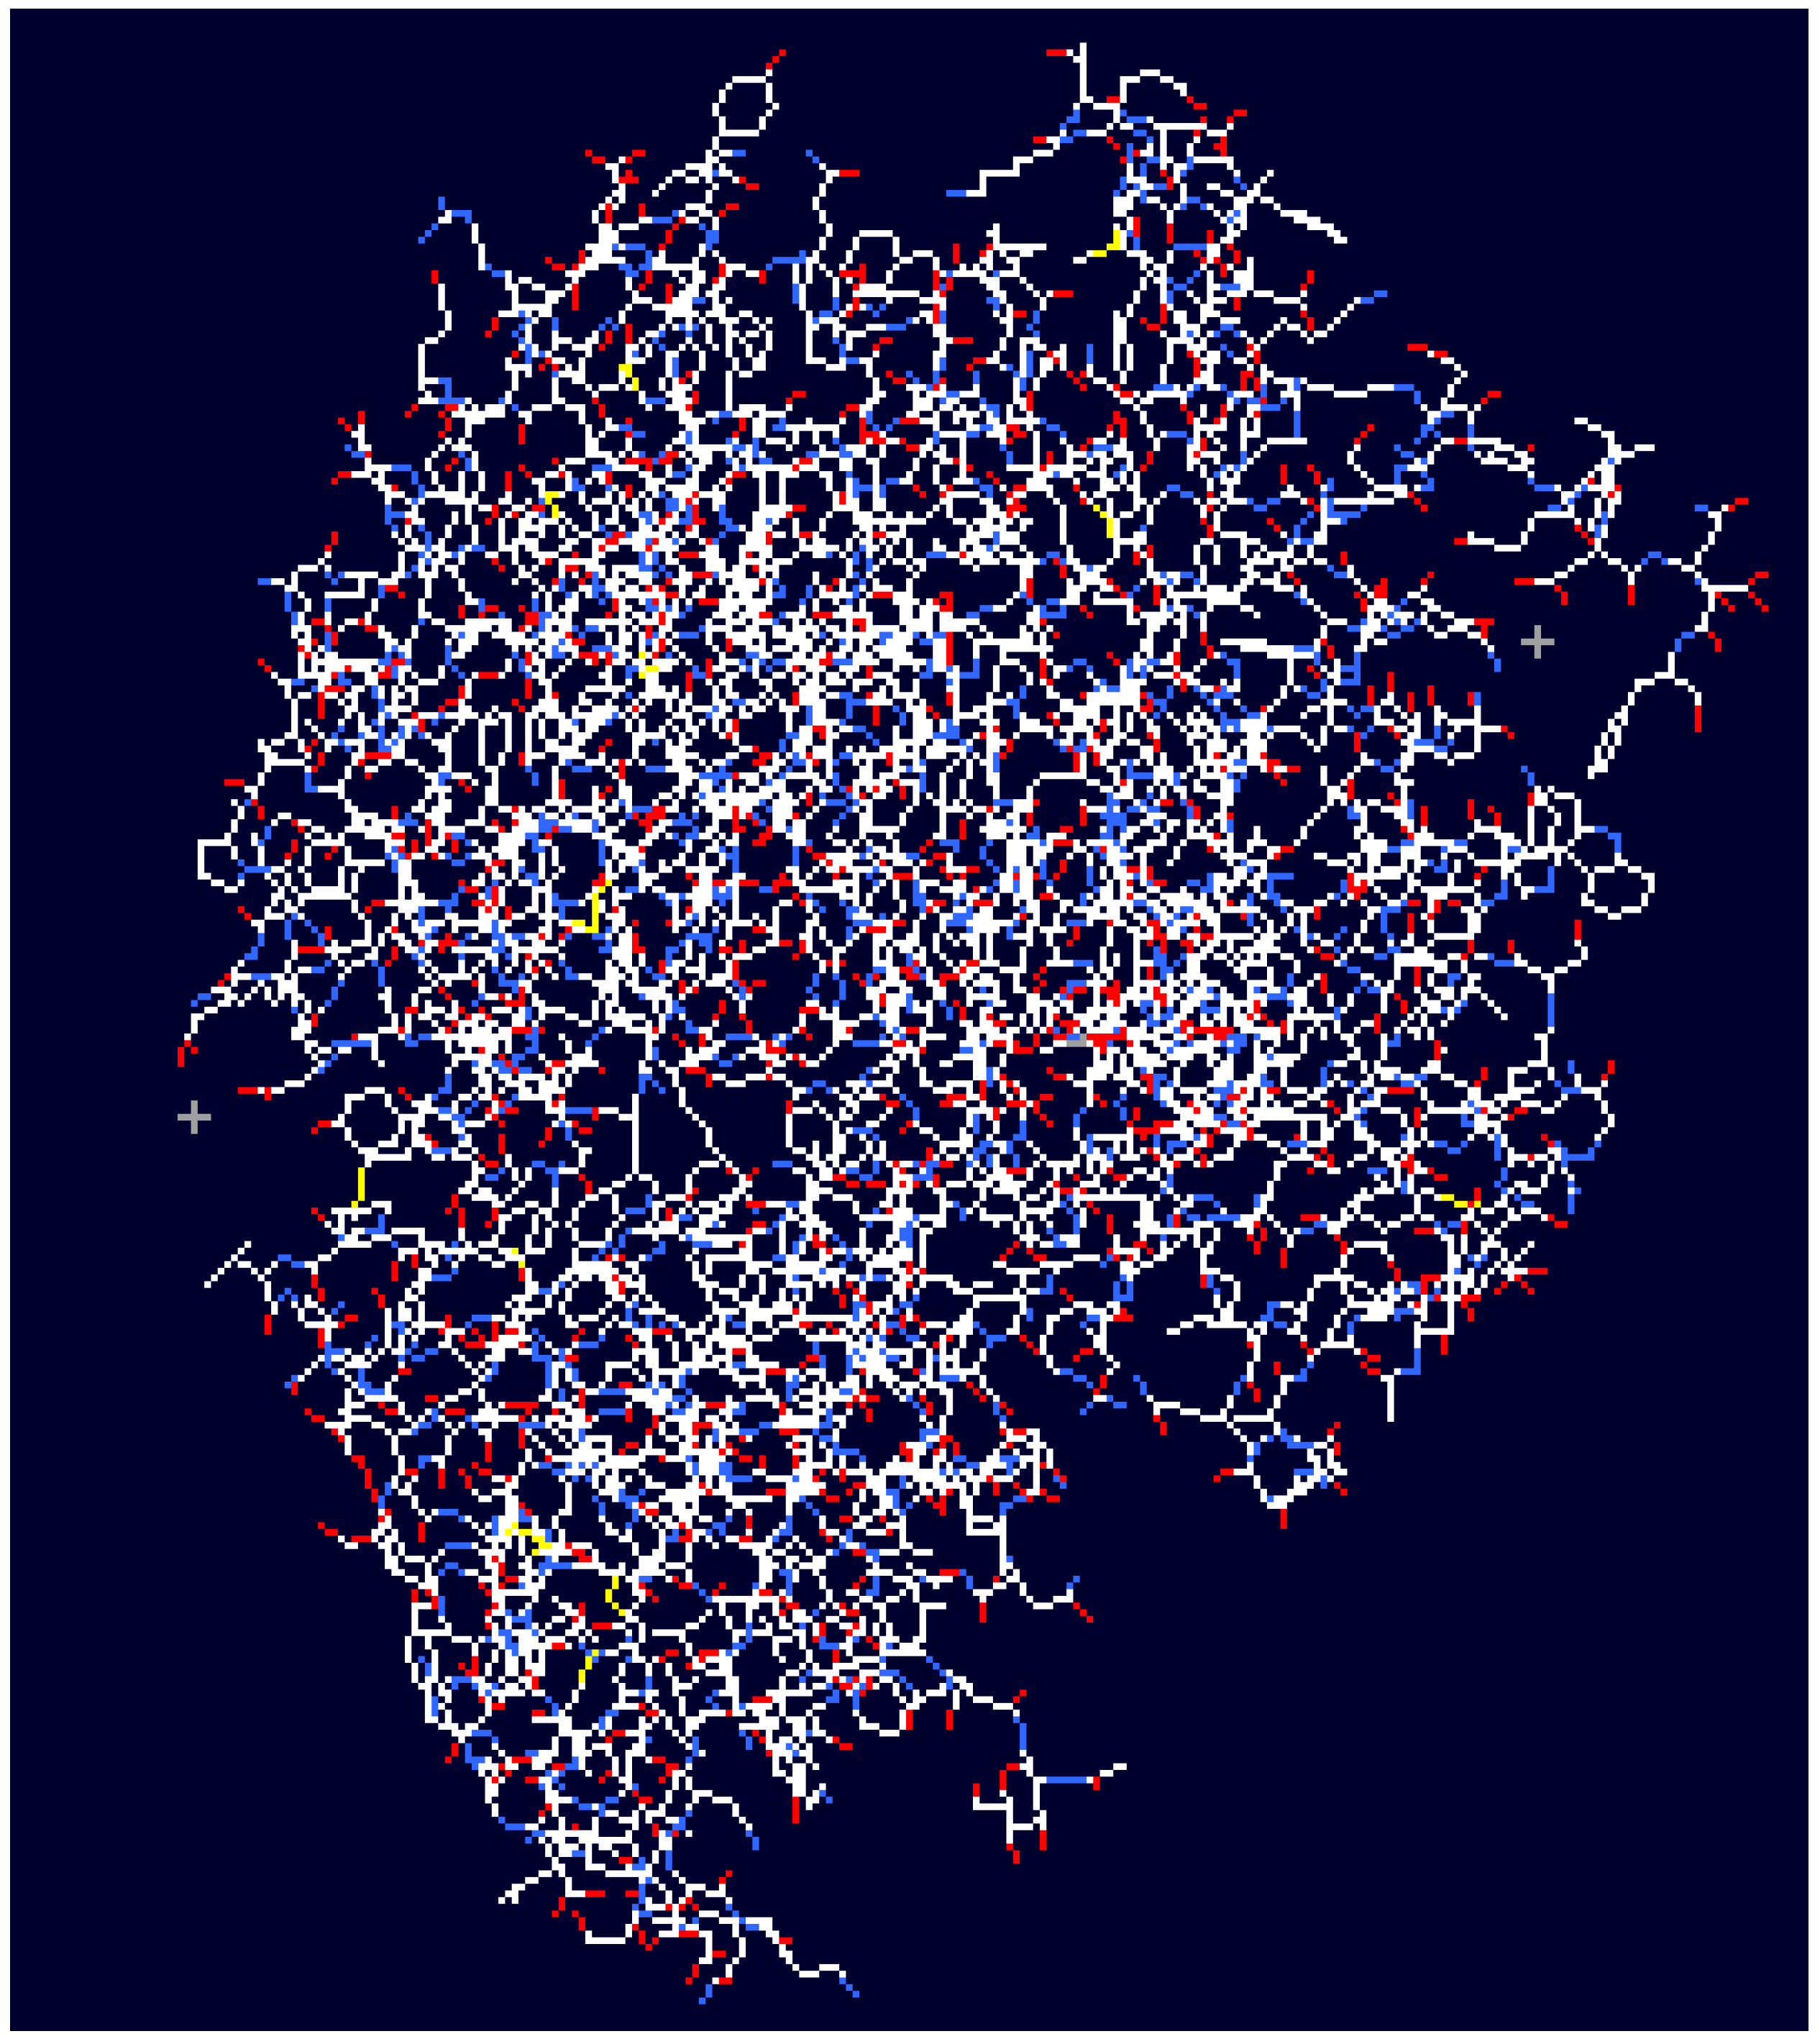
The output 3D molecular structure from the combination between Tf and TfR is derived (
Figure 1). Using Swiss-Pdb Viewer, the most appropriate modeling templates for this model is presented in
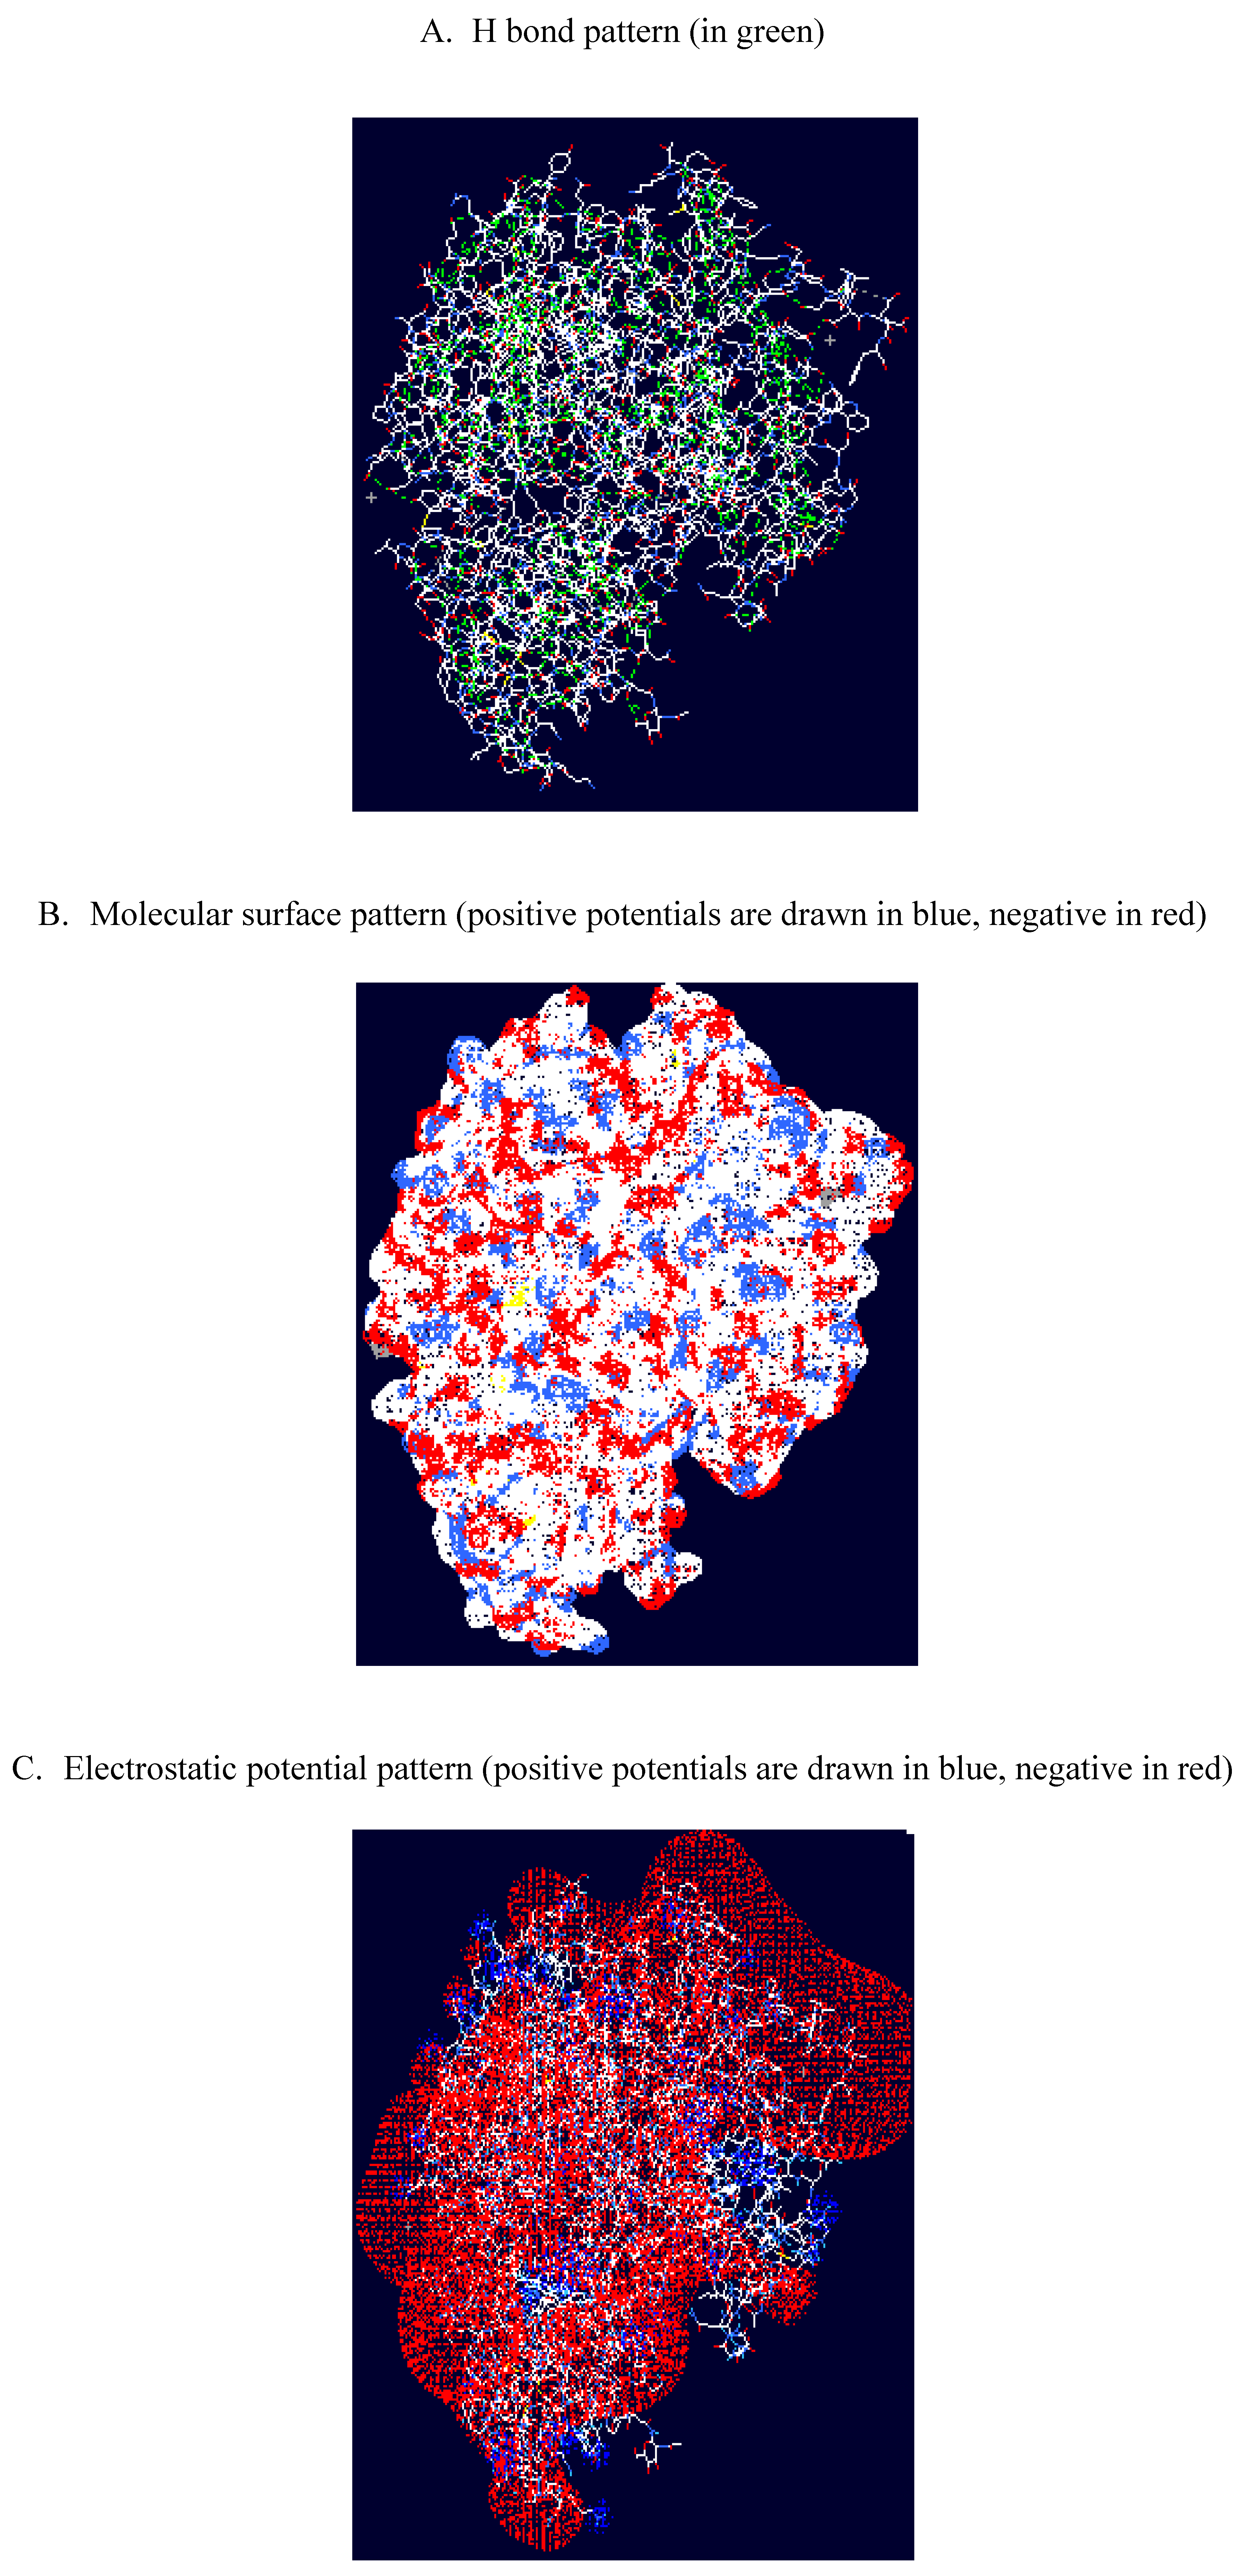
Figure 2. Concerning the properties of the derived complex, H bond, molecular surface, electrostatic potential patterns of the complex were shown in
Figure 3. Concerning the geometry of the derived complex, the shape-parameters as X-axis = 63.3 Angstrom, Y-axis = 83.3 Angstrom and Z-axis = 46.6 Angstrom can be derived.
Figure 1.
3D molecular structure from the combination between Tf and TfR.
Figure 1.
3D molecular structure from the combination between Tf and TfR.
*The default atoms colors are the following: C = white, O = red, N = blue, S = yellow, P = orange, H = cyan, other = gray
Figure 2.
The most appropriate modeling templates for the derived Tf-TfR complex model.
Figure 2.
The most appropriate modeling templates for the derived Tf-TfR complex model.
Figure 3.
Some properties of the derived Tf-TfR complex.
Figure 3.
Some properties of the derived Tf-TfR complex.
1 H-bonds are detected on the basis of distance, atom type and angle. H-bonds are detected if an H is in a 1.2 up to 2.76 A range of a "compatible" donor atom.
2.The electrostatic potential of proteins - caused by charged side chains and bound ions - plays a role e.g in protein folding and stability, enzyme catalysis or specific protein-protein recognition. In general, electrostatic potentials are visualized as molecular surface pattern (B) or electrostatic pattern (C).
Tf was discovered more than half a century ago, however, the discovery of TfR was just in the past two decades. Considering human iron metabolism, most cells acquire iron from plasma Tf and it is the TfR that is responsible for the internalization of transferrin-bound iron and its subsequent intracellular release [
4]. Not only the carrying of iron, TfRs have also shown potentials in delivery of therapeutic drugs or genes into the brain across blood-brain barrier [
7]. Due to the recent advance in molecular biology, the molecular structures of Tf and TfR have been widely studied. However, further structural and functional analyses on the recombination between the Tf and TfR are warranted for better understanding on the Tf-related mechanism [
8]. Although much is understood of the Tf endocytotic cycle, little has been uncovered of the molecular details underlying the formation of the Tf-TfR complex [
9]. Studying on the structures of TfR alone and complexed with Tf at subnanometer resolution provides a clue for the mechanism for communicating binding events between TfR chains and sheds light upon the function of Tf in regulating iron homeostasis [
8,
9].
Here, the author uses a computation protein-ligand technology to model the 3D structure of the Tf-TfR complex. The properties of the complex including H bond, molecular surface and electrostatic potential were analyzed. The geometry of the complex was also evaluated. The derived shape-parameters in this study are concordant with the previous cryoelectron microscopy findings by Cheng
et al [
9]. However, there is no analysis of the properties of the complex in that study. The derived model in this study can be applied for further study on local structural changing, which can be introduced by amino acid mutation. In addition, it can be served as the basis for other protein-recombinants production.
3. Experimental Section
The database namely RCSB PDB Protein Databank [
10] was used for data mining of the molecular structure for human Tf and sTfR. RCSB PDB Protein Databank is accepted as an information portal to biological macromolecular structures [
10]. Concerning the search strategy, the keyword “TRANSFERIN” was used. The human Tf and TfR were selected. Then a computational molecular technique, PatchDock [
11], was used for modeling of the recombination. Briefly, PatchDock is a computational molecular technique for molecular docking based on shape complementarity principle [
11]. The input is two molecules of any type: proteins, DNA, peptides, drugs [
6]. In this study, the two input molecules are Tf (PDB code, 1D4N chain A) and TfR (PDB code, 1CX8 chain A). The output is a potential complex sorted by shape complementarity criteria [
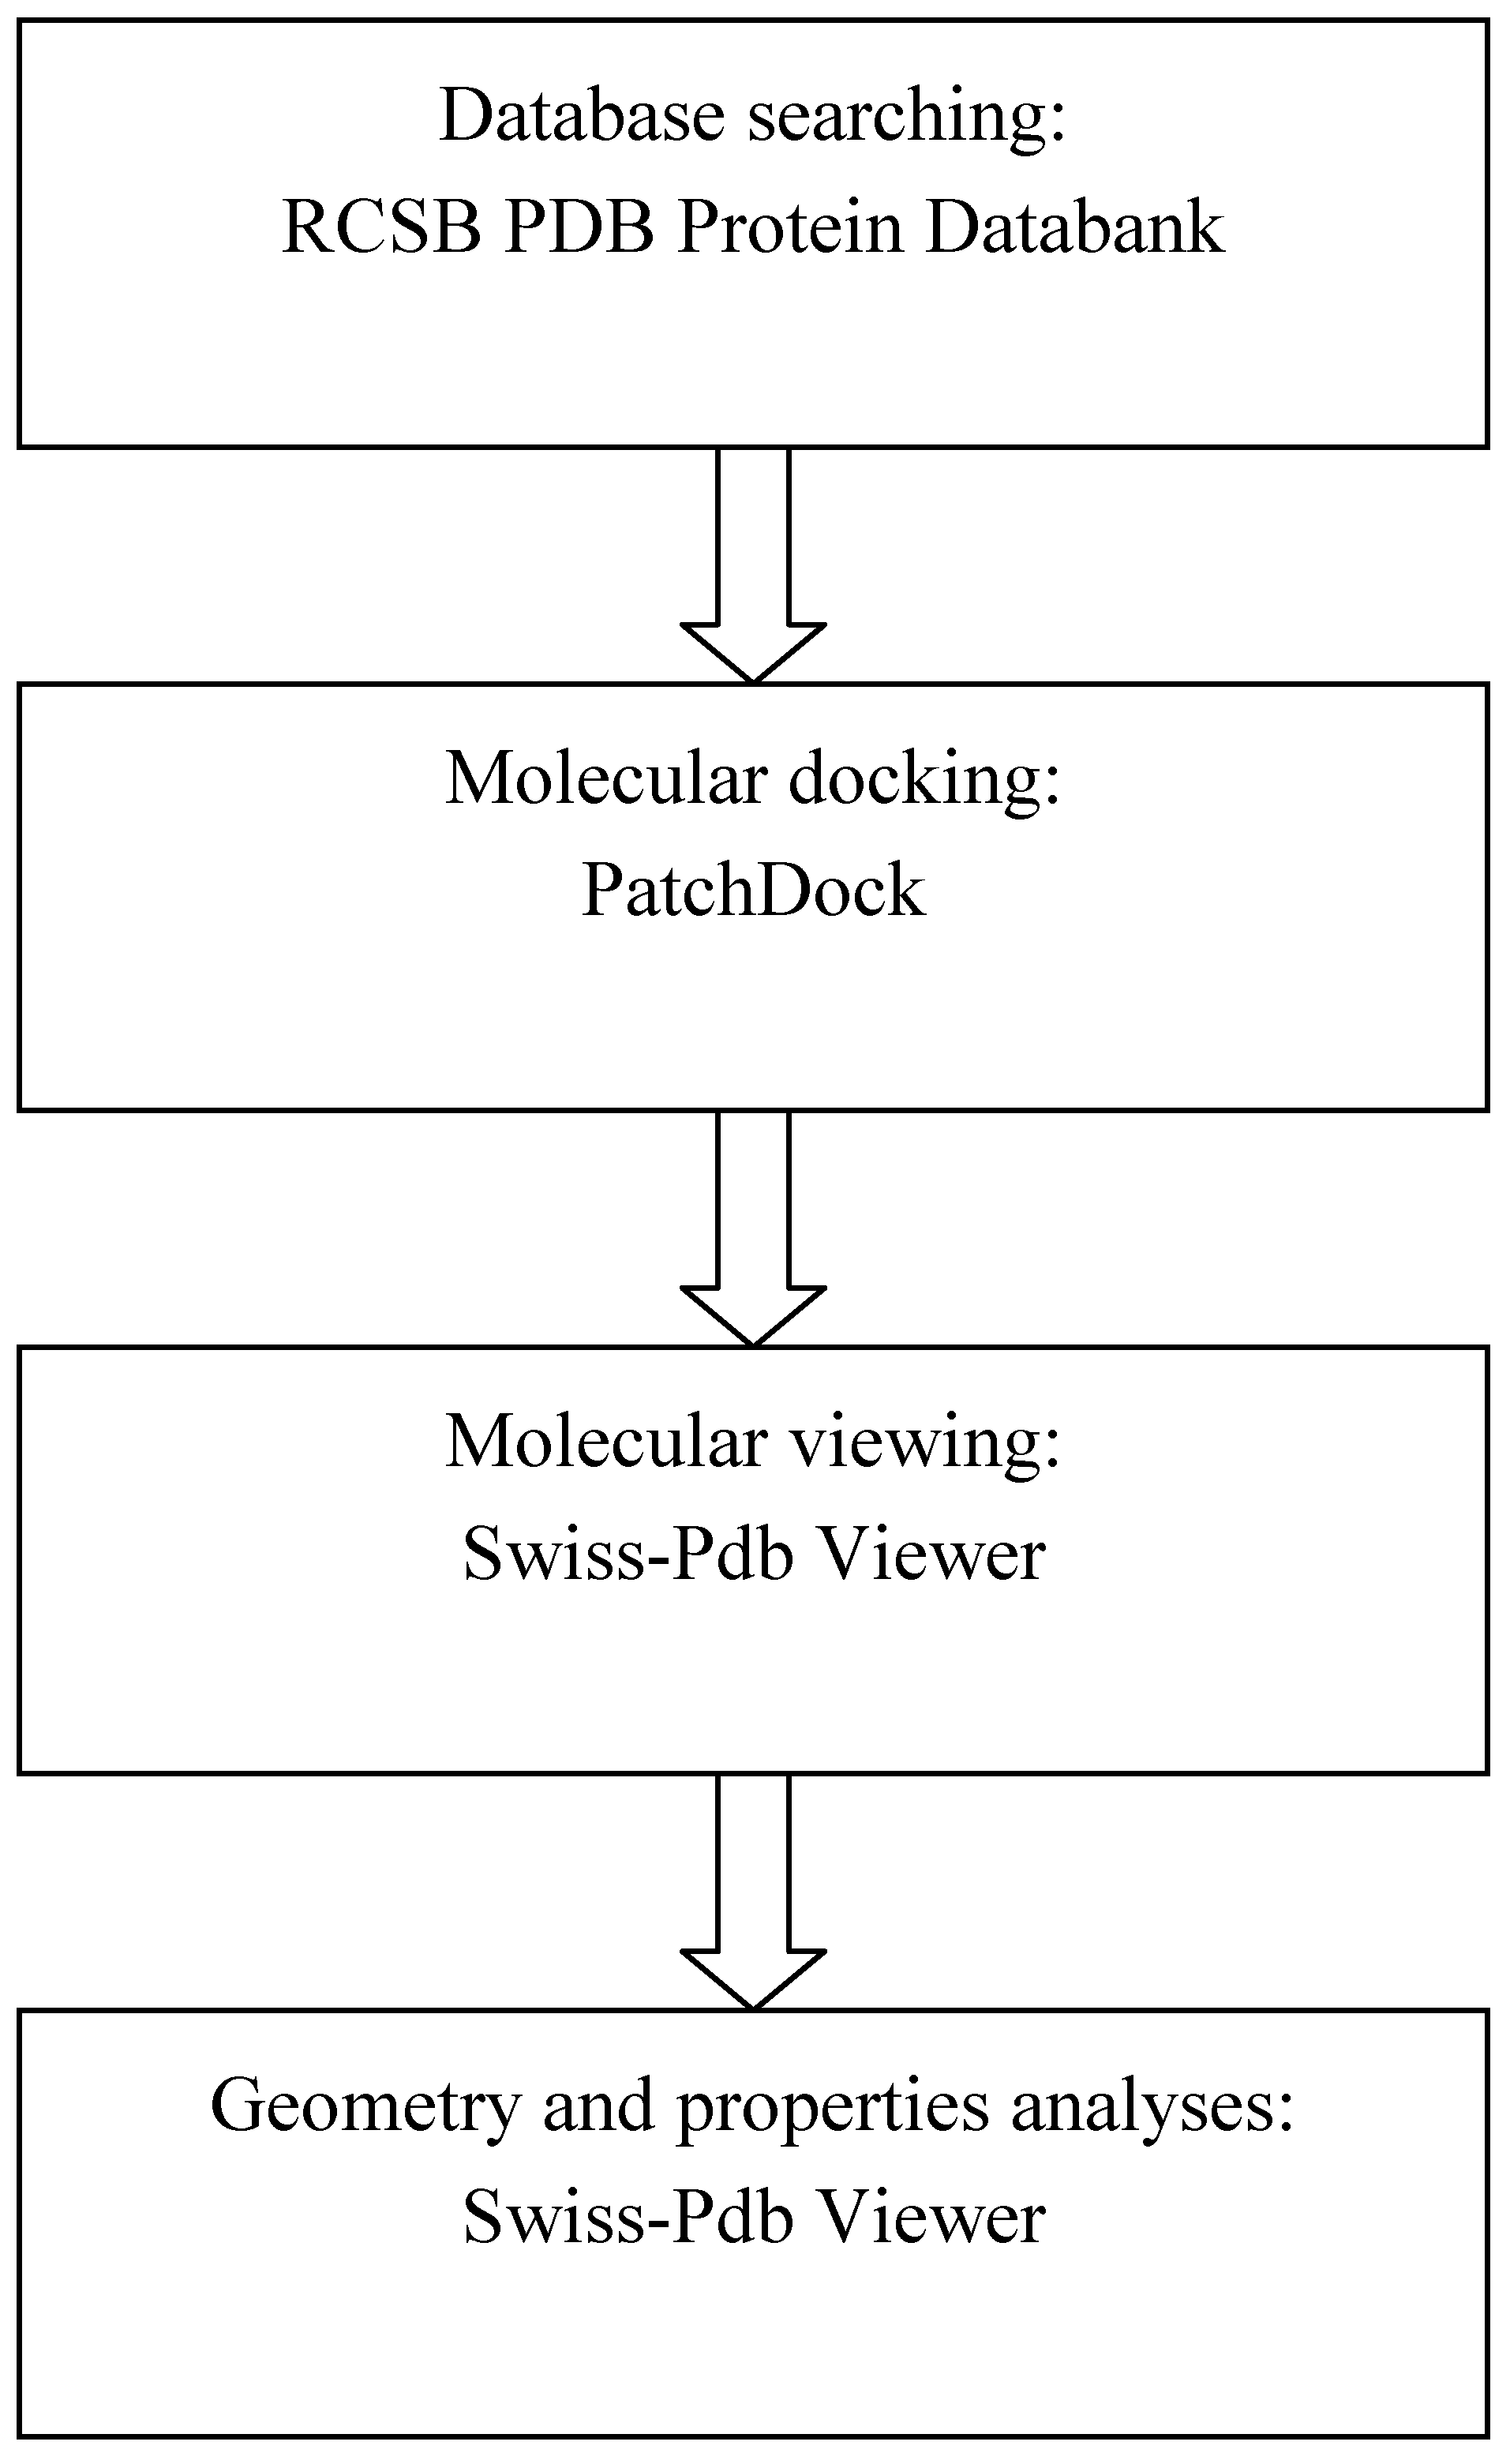
11]. The output or result was further process to be in the format of three - dimension (3D) molecular structure by Swiss-Pdb Viewer (GlaxoSmithKline R&D & the Swiss Institute of Bioinformatics). Then Swiss-Pdb Viewer was used for geometrical analysis of the derived Tf-TfR complex. Also Swiss-Pdb Viewer was used for analyses of other additional properties including H bond, molecular surface, electrostatic potential patterns of the complex. The simplified schematic diagram showing the experimental steps in this study is presented in
Figure 4.
Figure 4.
Simplified schematic diagram showing the experimental steps.
Figure 4.
Simplified schematic diagram showing the experimental steps.
