1. Introduction
Quantitative structure-activity relationship (QSAR) modeling is an area of research pioneered by Hansch and Fujita [
1,
2]. The QSAR study assumes that the difference of the molecules in the structural properties experimentally measured accounts for the difference in their observed biological or chemical properties [
1,
2,
3]. The result of QSAR usually reflects as a predictive formula and attempts to model the activity of a series of compounds using measured or computed properties of the compounds. More recently, QSAR has been extended by including the three-dimensional information. In drug discovery, it is common to have measured activity data for a set of compounds acting upon a particular protein but not to have knowledge of the three-dimensional structure of the active site. In the absence of such three-dimensional information, one may attempt to build a hypothetical model of the active site that can provide insight on the nature of the active site. Such a model is known as a Hypo. Catalyst/Hypo is useful in building 3D pharmacophore models from the activity data and conformational structure. It can be used as an alternative for QSAR methods because of easy visualization and high prediction.
In a previous application, we described the use of Catalyst/Hypo to derive a 4- and 5-feature hypothesis from a set of 17 octopamine (OA) antagonists [
4] and 43 agonists [
5], respectively. Three-dimensional pharmacophore hypotheses were built from a set of 9 OA agonists responsible for the inhibition of sex-pheromone production in
Helicoverpa armigera [
6]. These sets included a variety of types of molecules, covering 5 orders of magnitude in activity. For these type of training sets, the use of the hypothesis-generation tool was appropriate. This tool builds hypotheses (overlays of chemical features) for which the fit of individual molecules to a hypothesis can be correlated with the molecule's affinity. However, the high structural homology among the derivatives used in the current study combined with their smaller activity range makes this "quantitative" hypothesis generation method inappropriate. For this type of training set, the common-feature hypothesis generation, also called HipHop [
7], is more suitable. HipHop generates hypotheses consisting only of identification and overlay of common features (without the use of activity data). The aim of this work is to derive feature-based 3D models from a small set of 10 OA agonists using HipHop.
2. Materials and Methods
Chemicals. OA [2-amino-1-(4-hydroxyphenyl)ethanol], theophylline (1,3-dimethylxanthine), and ethylene glycol bis(β-aminoethyl ether)-N,N,N',N'-tetraacetic acid (EGTA) were purchased from Nacalai Tesque (Kyoto, Japan); GTP was from Sigma Chemical Co. (St. Louis, U.S.A.); ATP disodium salt was from Kohjin Co. (Tokyo, Japan); lithium aluminum hydride (LAH) was from Chemetall GmbH (Frankfurt, Germany).
Radiochemical. The cAMP radioimmunoassay (RIA) kit (cord RPA 509) was purchased from Amersham International (Buckinghamshire, England).
Synthesis of test compounds. All compounds were prepared using published methods. 1-Arylimidazole-2(3
H)-thiones (AIHTs) were prepared by the condensation of the corresponding arylisothiocyanates with aminoacetaldehyde dimethyl acetal followed by acid-catalized cyclization of the intermediate
N-arylthioureas [
8]. 1-Arylimidazolidine-2-thiones (AITs) were synthesized by the cyclization of monoethanolamine hydrogen sulfate with arylisothiocyanates in the presence of sodium hydroxide as described in the previous report [
9]. The structures of the compounds were confirmed by
1H and
13C NMR measured with a JEOL JNM-EX400 spectrometer at 400 MHz, tetramethyl silane (TMS) being used as an internal standard for
1H NMR, and elemental analysis.
Insects. Males and females of Periplaneta americana were used indiscriminately, as their nervous systems exhibited no gross structural or neurochemical differences. The insects were reared under crowded conditions in this laboratory at 28oC with a photoperiod of 12 h light:12 h dark and at a relative humidity of 65-70% for more than 7 years; they were provided with an artificial mouse diet (Oriental Yeast Co., Chiba, Japan) and water ad libitum.
Adenylate-cyclase assay. The adenylate-cyclase assay was conducted on adult American cockroaches (
P. americana L) as shown in previous report [
9,
10,
11,
12]. Thoracic nerve cords of
P. americana were homogenized (15 mg/ml) in a 6 mM Tris-maleate buffer (pH 7.4) by using a chilled microtube homogenizer (S-203, Ikeda Sci., Tokyo, Japan) as shown in previous report. The homogenate was diluted (1 mg/ml) in 6 mM Tris-maleate, and then centrifuged at 120,000 x g and 4
oC for 20 min. The supernatant was discarded, the pellet being resuspended by homogenizing (1 mg/ml) in the buffer, and again centrifuged at 120,000 x g and 4
oC for 20 min. The resulting pellet (P2) resuspended in the buffer was equivalent to the starting amount (15 mg/ml). The adenylate-cyclase activity was measured according to Nathanson's procedure under optimal conditions [
9,
10,
11,
12,
13] in a test tube containing 200 μl of 120 mM Tris-maleate (pH 7.4, including 15 mM theophylline, 12 mM MgCl
2 and 0.75 mM EGTA), 60 μl of the P2 fraction and 30 μl of each synthesized compound solution in polyethylene glycol. An appropriate solvent control was run in parallel. The enzyme reaction (5 min at 30
oC) was initiated by adding 10 μl of a mixture of 3 mM GTP and 60 mM ATP, stopped by heating at 90
oC for 2 min and then centrifuged at 1000 x g for 15 min to remove the insoluble material. The cAMP level in the supernatant was measured by RIA [
9,
10,
11,
12]. Protein concentration was determined by the Lowry method [
14], using bovine serum albumin (Sigma, St. Louis, U.S.A.) as the standard. Enzyme activity in each assay was corrected using OA as a reference. The maximal stimulatory activity (mostly at 0.1 mM) was calculated relative to OA (100%) and control (0%).
Hypothesis generation. All experiments were conducted on a Silicon Graphics O2, running under the IRIX 6.5 operating system. Hypotheses generation was applied against previously described data sets and their functionality is available as part of Molecular Simulations Incorporated's Catalyst/Hiphop (version 4.0) modeling environment (Burlington, U.S.A.). Molecules were edited using the Catalyst 2D/3D visualizer. Catalyst automatically generated conformational models for each compound using the Poling Algorithm [
15,
16,
17]. The number of conformations needed to produce a good representation of a compound's conformational space depends on the molecule. Conformation-generating algorithms were adjusted to produce a diverse set of conformations, avoiding repetitious groups of conformations all representing local minima. The conformations generated were used to align common molecular features and generate pharmacophoric hypotheses. HipHop used conformations generated to align chemically important functional groups common to the molecules in the study set. A pharmacophoric hypothesis then was generated from these aligned structures.
The models emphasized a conformational diversity under the constraint of 20 kcal/mol energy threshold above the estimated global minimum based on use of the CHARMm force field [
15,
16,
17,
18]. Molecular flexibility was taken into account by considering each compound as a collection of conformers representing a different area of conformational space accessible to the molecule within a given energy range. Catalyst provides two types of conformational analysis: fast and best quality. Best option was used, specifying 250 as the maximum number of conformers. The molecules associated with their conformational models was submitted to Catalyst hypothesis generation. Hypotheses approximating the pharmacophore were described as a set of features distributed within a 3D space. This process only considered surface accessible functions such as hydrogen-bond acceptor (HBA), hydrogen-bond acceptor lipid (HBAl), hydrogen-bond donor (HBD), hydrophobic (Hp), hydrophobic aromatic (HpAr), hydrophobic aliphatic (HpAl), negative ionizable (NI) and positive ionizable (PI).
HipHop provides feature-based alignment of a collection of compounds without considering activity. It matches the chemical features of a molecule, against drug candidate molecules. HipHop takes a collection of conformational models of molecules and a selection of chemical features, and produces a series of molecular alignments in a variety of standard file formats. HipHop begins by identifying configurations of features common to a set of molecules. A configuration consists of a set of relative locations in 3D space and associated feature types. A molecule matches the configurations if it possesses conformations and structural features that can be superimposed within a certain tolerance from the corresponding ideal locations. HipHop also maps partial features of molecules in the alignment set. This provision gives the option to use partial mapping during the alignment. Partial mapping allows to identify larger, more diverse, more significant hypotheses and alignment models without the risk of missing compounds that do not map to all of the pharmacophore features. Misses, the number of molecules which do not have to map to all features in generated hypotheses, FeatureMisses, the the number of maximal molecules which do not have to map to each feature in generated hypotheses and CompleteMisses, the number of molecules which do not have to map to any feature in a given hypothesis, were set as 3, 2 and 2, respectively.
3. Results and discussion
Assessment of 3D hypothesis for OA-agonist activity. OA-agonist activities of test compounds at several concentrations were examined using the adenylate-cyclase assay which was conducted on adult American cockroaches (
P. americana L). AIT
70 with 2,6-Et
2-Ph substituent showed the highest OA-agonist activity, followed by AIT
73 with 2,6-
iPr
2-Ph substituent. The activity as OA agonist was structure specific. AIT
70 was the only full agonist in this study and all other AITs and AIHTs were partial agonists. A slight modification of structure of
70 decreased the OA-agonist activity dramatically: substituents at 2,6 positions of the phenyl, the introduction of a substituent to the imidazolidine ring at position 4 and the introduction of a double bond to the imidazolidine ring at position 4 and 5, leading to an imidazole ring. Hypotheses were generated to explain the specificity of the OA agonists. A set of 10 molecules, including
70 and its derivatives, was selected randomly as the target training set. Their experimental biological activities are listed in
Table 1 and
Table 2. Among the 10 molecules of the training set,
70 and
73 were chosen as reference compounds, which were allowed to map all features, and other 8 molecules were allowed to map partially on the hypotheses (
Table 3). Except for this classification, the activities of the molecules were not used in the analysis. This tool builds hypotheses (overlays of common features) for which the fit of individual molecules to a hypothesis can be correlated with the molecule’s activity.
The 3D-hypothesis study was performed with the Catalyst (version 4.0) package. The geometry of each compound was built with a visualizer and optimized by using the generalized CHARMm-like force field implemented in the program. A preparative test was performed with HBA, HBAl, HBD, Hp, HpAr, HpAl, NI and PI [
19]. NI and PI were used rather than negative charge and positive charge in order to broaden the search for deprotonated and protonated atoms or groups at physiological pH. Using conformatinal poling [
15], a representative family of conformers was generated, within a 20 kcal/mol range of the computed minimum, for each molecule. Potential hypothesis models were produced with the minimum permitted interfeature spacing of 2.00 Å generating alignments of common features [
7], which included the projected point of HBA and Hp [
15].
It was found that hypotheses contain good correlation with HBA and/or Hp. The characteristics of ten hypotheses are listed in
Table 4. All the hypotheses contain 5 features with the ranking scores ranging from 95.812 to 102.317. Hypotheses 1 and 2 consist of the same common-feature functions of an HpAr, three HpAls and an HBAl. The second group composes of hypotheses 3, 4, 9 and 10 which are characterized by an HpAr, two HpAls, an Hp and an HBAl features. Other hypotheses 5 and 6 are characterized by an HpAr, three HpAls and an HBA features. Hypotheses 7 and 8 consist of an HpAr, two HpAls, an Hp and an HBA. The rank score range over the 10 generated hypotheses is 6.505. The small rank score range observed here may be due to two factors, namely molecules in the training set are fairly rigid and have a high degree of structural homology. Due to the relatively small range and owing, moreover, to the placement of the identified hypotheses within this range, special care was taken to test for chance correlation. The higher the ranking score, the less likely it is that the molecules in the training set fit the hypothesis by a chance correlation.
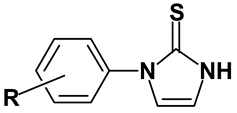
Table 1.
OA agonist AIHTs used in this study.
![Ijms 03 00056 i001]()
Table 1.
OA agonist AIHTs used in this study. ![Ijms 03 00056 i001]()
| Compounda | R | mp (oC) | Adenylate-cyclase activity (relative to OA, %)b |
| 1 | H | 186-187 | 3.0±2.9 |
| 2 | 2-Br | 280-281 | 2.5±2.2 |
| 3 | 2-Cl | 240-241 | 7.7±1.9 |
| 4 | 2-Me | 249-250 | 3.7±5.1 |
| 5 | 2-MeO | 238-239 | 3.5±1.3 |
| 6 | 2-Et | 204-205 | 8.5±2.2 |
| 7 | 2-iPr | 245-246 | 5.7±2.5 |
| 8 | 3-Cl | 163-164 | 4.5±3.6 |
| 9 | 3-NO2 | 225-226 | 5.4±2.0 |
| 10 | 3-MeO | 157-158 | 2.3±1.6 |
| 11 | 4-Cl | 222-223 | 2.6±0.5 |
| 12 | 4-I | 259-260 | 6.5±0.7 |
| 13 | 4-Me | 219-220 | 5.9±2.6 |
| 14 | 4-CF3 | 199-200 | 3.7±2.4 |
| 15 | 4-CN | 269-270 | 3.9±1.5 |
| 16 | 4-MeS | 196-197 | 4.0±4.3 |
| 17 | 4-MeO | 228-229 | 3.2±1.8 |
| 18 | 4-Et | 170-170 | 2.4±2.0 |
| 19 | 4-EtO | 209-210 | 2.9±1.6 |
| 20 | 4-Ac | 192-193 | 3.3±1.8 |
| 21 | 4-Et2N | 228-229 | 3.5±4.9 |
| 22 | 4-iPr | 171-172 | 2.5±3.5 |
| 23 | 4-EtOCO | 173-174 | 2.7±0.4 |
| 24 | 4-BzO | 256-257 | 3.0±4.2 |
| 25 | 2,3-Cl2 | 260-261 | 6.2+1.8 |
| 26 | 2-Cl,4-Br | 243-244 | 2.4±0.2 |
| 27 | 2-Br,4-Me | 234-235 | 6.9±2.9 |
| 28 | 2-Me,4-Cl | 237-238 | 3.2±3.1 |
| 29 | 2-NO2,4-Me | 229-230 | 5.8±2.5 |
| 30 | 2-NO2,4-MeO | 242-243 | 2.7±0.8 |
| 31 | 2-MeO,4-NO2 | 254-255 | 1.5±5.0 |
| 32 | 2,4-Me2 | 202-203 | 4.1±5.6 |
| 33 | 2,4-(MeO)2 | 248-249 | 4.1±4.1 |
| 34 | 2,5-Cl2 | 277-278 | 1.7±1.3 |
| 35 | 2-Me,5-Cl | 250-251 | 2.1±1.3 |
| 36 | 2-MeO,5-Cl | 261-262 | 0.9±0.1 |
| 37 | 2-Cl,5-CF3 | 209-210 | 6.1±2.7 |
| 38 | 2-MeO,5-Me | 211-212 | 9.5±7.8 |
| 39 | 2,5-(MeO)2 | 206-207 | 1.6±1.1 |
| 40 | 2,6-Cl2 | 300-301 | 1.8±1.8 |
| 41 | 2-Cl,6-Me | 300-301 | 4.3±5.3 |
| 42 | 2,6-Me2 | 290-291 | 4.1±5.5 |
| 43 | 2,6-Et2 | 204-205 | 3.4±3.3 |
| 44 | 2-Et,6-iPr | 225-226 | 2.9±3.0 |
| 45 | 3,4-Cl2 | 247-248 | 6.1±0.2 |
| 46 | 3-NO2,4-Cl | 239-240 | 5.5±0.7 |
| 47 | 3,4-(MeO)2 | 243-244 | 3.0±2.8 |
| 48 | 3,5-Cl2 | 237-238 | 6.4±3.7 |
| 49 | 3,5-Me2 | 202-203 | 2.4±2.0 |
| 50 | 3,5-(CF3)2 | 163-164 | 4.1±1.3 |
| 51 | 3,5-(MeO)2 | 158-159 | 4.5±3.4 |
| 52 | 2,3,4-Cl3 | 266-267 | 6.9±1.3 |
| 53 | 2,6-Me,4-Br | 300-301 | 11.8±1.8 |
| 54 | 2,4,6-Me3 | 277-278 | 2.7±0.2 |
| 55 | 2,3,4,5-Cl4 | 262-263 | 7.5±2.2 |
Table 2.
OA agonist AITs used in this study.
![Ijms 03 00056 i002]()
Table 2.
OA agonist AITs used in this study. ![Ijms 03 00056 i002]()
| Compounda | Ra | Rb | mp (oC) | Adenylate-cyclase activity (relative to OA, %)b |
| 56 | H | H | 118-119 | 0.6±0.8 |
| 57 | 2-Me | H | 122-124 | 4.5±3.3 |
| 58 | 3-Cl | H | 111-113 | 7.6±1.1 |
| 59 | 3-CF3 | H | 119-121 | 1.6±0.7 |
| 60 | 4-Ac | H | 123-125 | 3.0±0.8 |
| 61 | 4-iPr | H | 154-156 | 3.2±0.6 |
| 62 | 2-Cl,4-NO2 | H | 113-115 | 2.8±0.3 |
| 63 | 2-MeO,4-NO2 | H | 137-139 | 5.7±1.4 |
| 64 | 2,6-Cl2 | H | 121-122 | 2.4±0.1 |
| 65 | 2,6-F2 | H | 161-162 | 3.6±0.4 |
| 66 | 2-Cl,6-Me | H | 195-196 | 8.9±0.8 |
| 67 | 2,6-Me2 | H | 210-211 | 3.9±0.1 |
| 68 | 2-Me,6-Et | H | 106-108 | 2.6±1.1 |
| 69 | 2-Me,6-iPr | H | 145-147 | 1.3±0.1 |
| 70 | 2,6-Et2 | H | 71-72 | 104.0±1.6 |
| 71 | 2,6-Et2 | Me | 136-137 | 16.1±1.3 |
| 72 | 2-Et,6-iPr | H | 162-163 | 3.6±0.1 |
| 73 | 2,6-iPr2 | H | 115-116 | 23.8±0.3 |
Table 3.
Characteristics for the common feature hypothesis run.
Table 3.
Characteristics for the common feature hypothesis run.
| Compound | Confsa | Features/Confsa | Principalb | MaxOmitFeatc |
| 6 | 9 | 9.78 | 1 | 1 |
| 43 | 21 | 12.00 | 1 | 1 |
| 54 | 2 | 12.50 | 1 | 1 |
| 64 | 1 | 12.00 | 1 | 1 |
| 66 | 2 | 12.00 | 1 | 1 |
| 67 | 1 | 11.00 | 1 | 1 |
| 70 | 28 | 11.79 | 2 | 0 |
| 71 | 85 | 13.39 | 1 | 1 |
| 72 | 24 | 12.00 | 1 | 1 |
| 73 | 11 | 12.00 | 2 | 0 |
Table 4.
Results of the common feature hypothesis run.
Table 4.
Results of the common feature hypothesis run.
| Hypotheses | Featurea | Rank Score | Direct Hitb | Partial Hitb |
| 1 | HpAr | HpAl | HpAl | HpAl | HBAl | 102.317 | 1111010111 | 0000101000 |
| 2 | HpAr | HpAl | HpAl | HpAl | HBAl | 102.212 | 1111010111 | 0000101000 |
| 3 | HpAr | HpAl | HpAl | Hp | HBAl | 100.848 | 1111110111 | 0000001000 |
| 4 | HpAr | HpAl | HpAl | Hp | HBAl | 100.848 | 1111110111 | 0000001000 |
| 5 | HpAr | HpAl | HpAl | HpAl | HBA | 100.317 | 1111010111 | 0000101000 |
| 6 | HpAr | HpAl | HpAl | HpAl | HBA | 100.212 | 1111010111 | 0000101000 |
| 7 | HpAr | HpAl | HpAl | Hp | HBA | 98.848 | 1111110111 | 0000001000 |
| 8 | HpAr | HpAl | HpAl | Hp | HBA | 98.848 | 1111110111 | 0000001000 |
| 9 | HpAr | HpAl | HpAl | Hp | HBAl | 95.917 | 1111010111 | 0000101000 |
| 10 | HpAr | HpAl | HpAl | Hp | HBAl | 95.812 | 1111010111 | 0000101000 |
OA agonists-receptor interaction. Comparison of the procedure and regression studies shows that hypotheses 1, 3, 5 and 7 are the best models among the four groups and are selected for further evaluation.
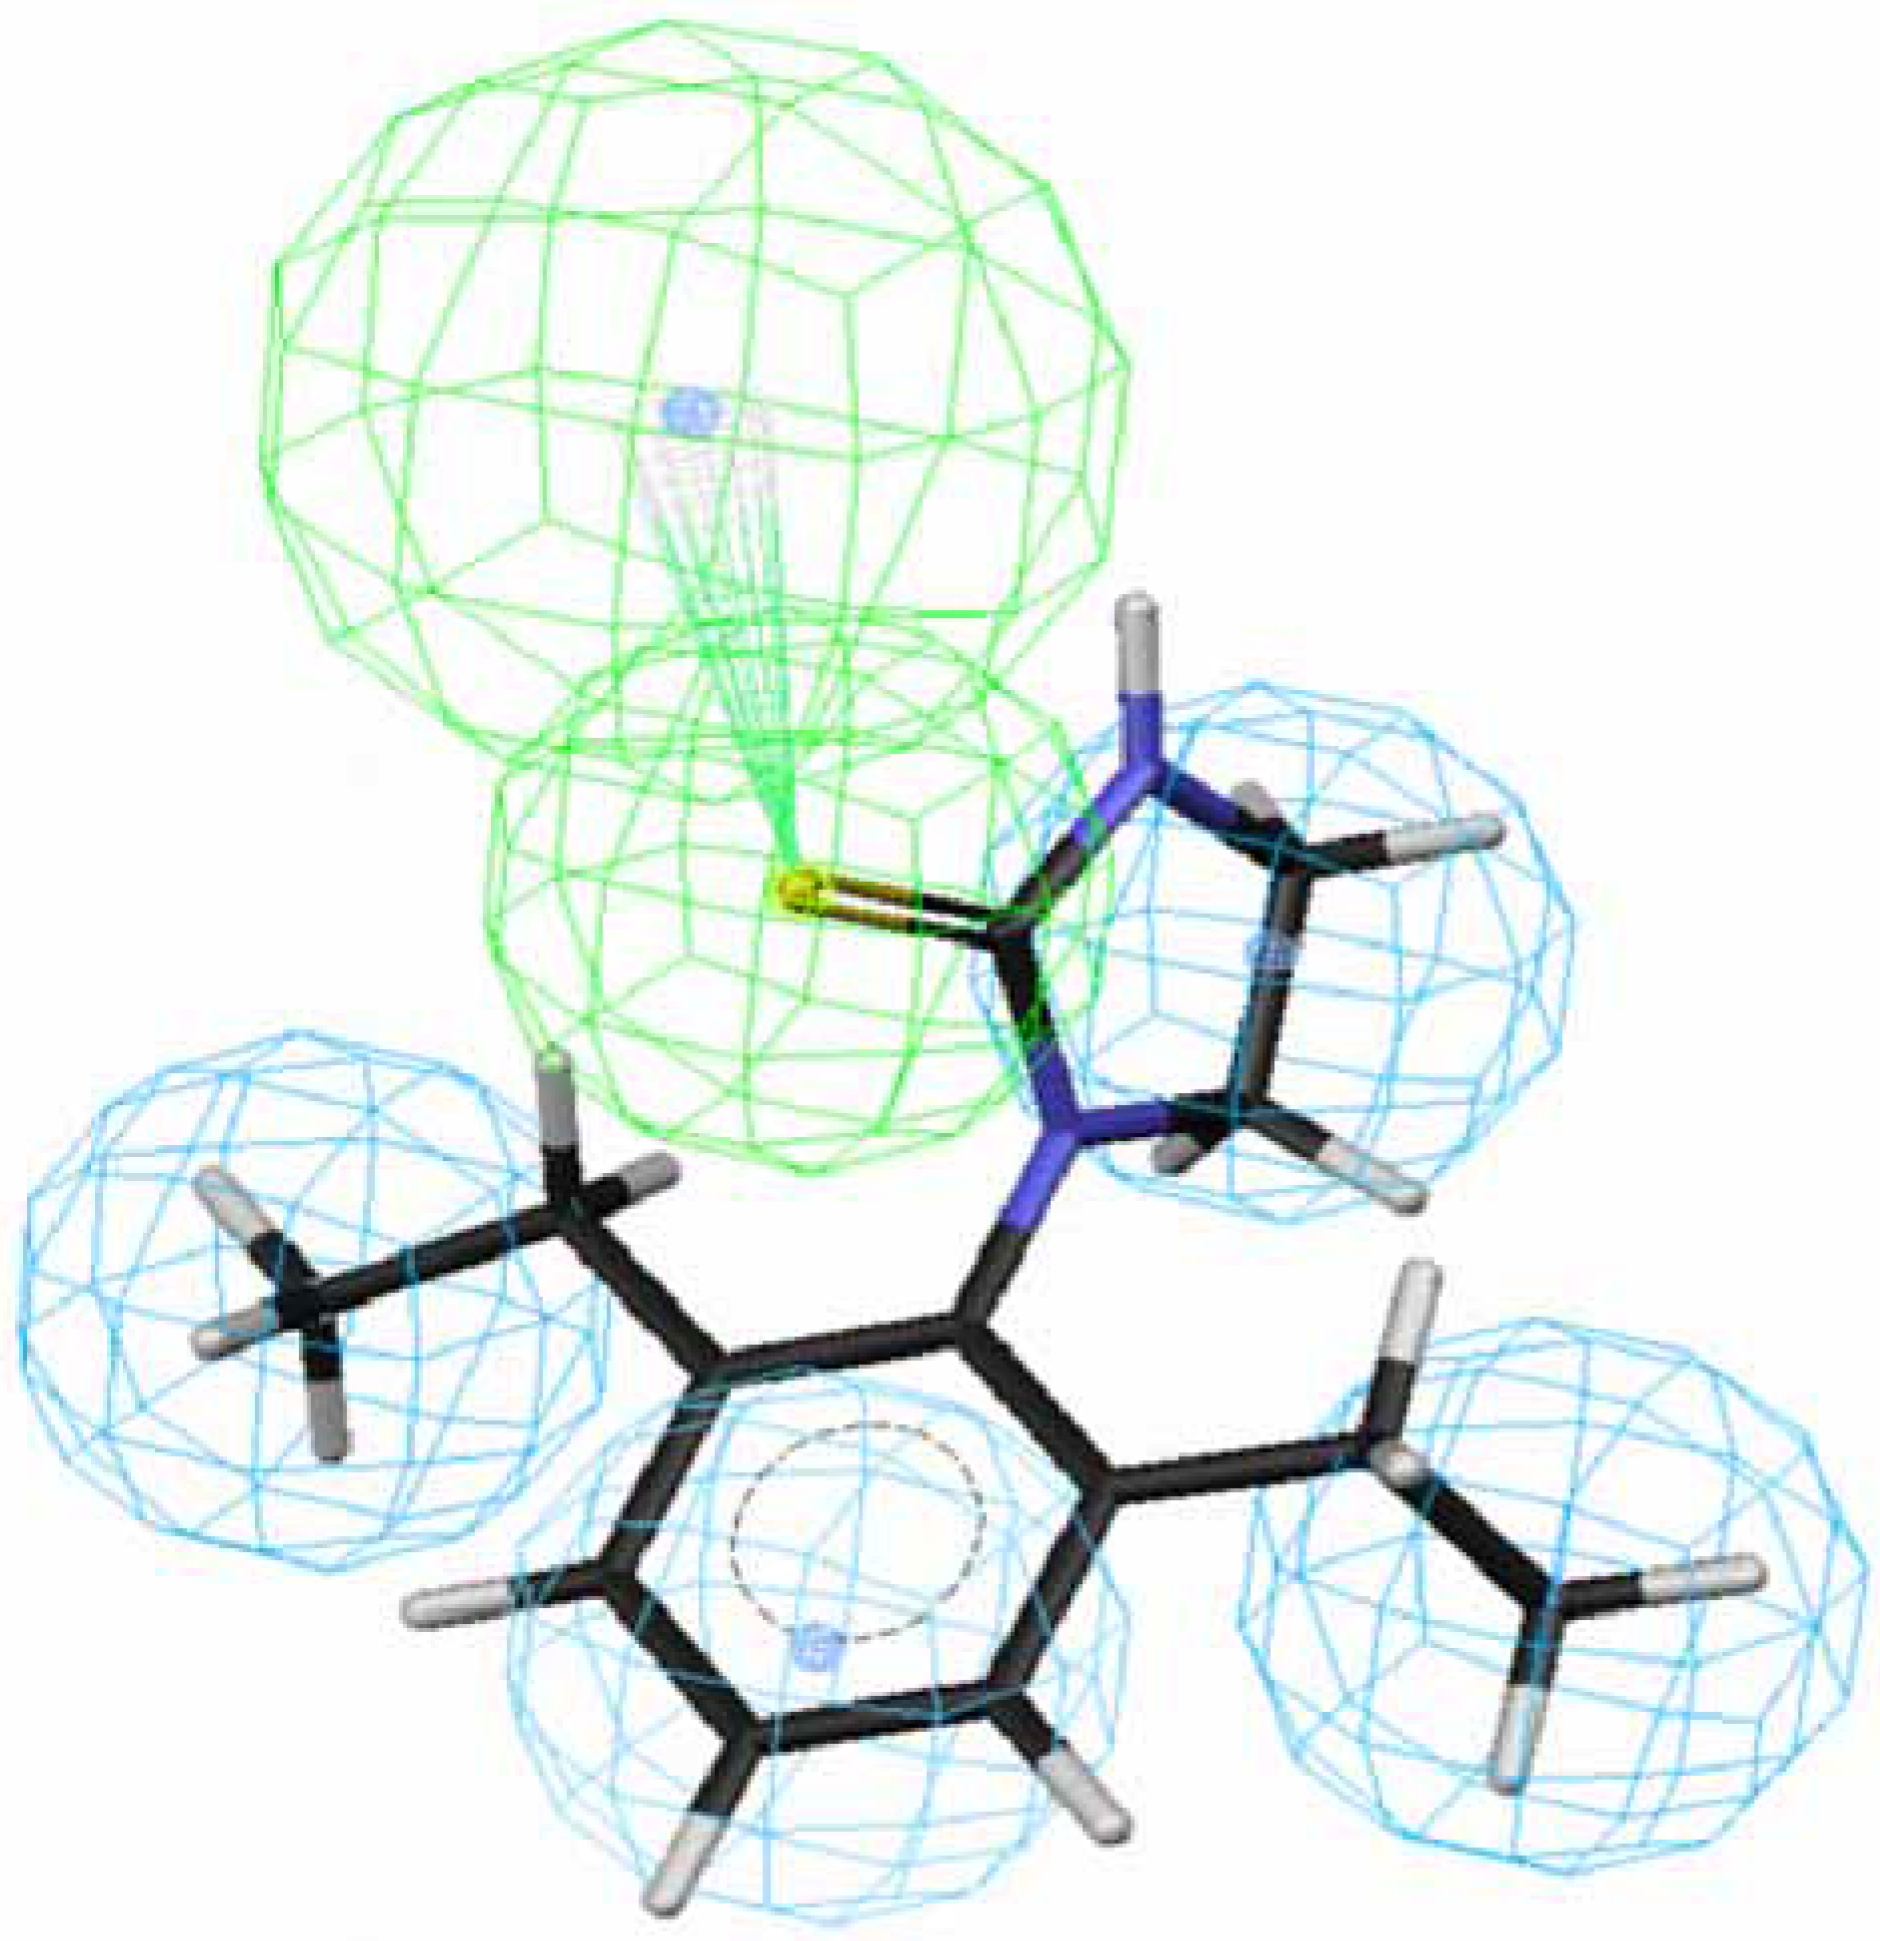
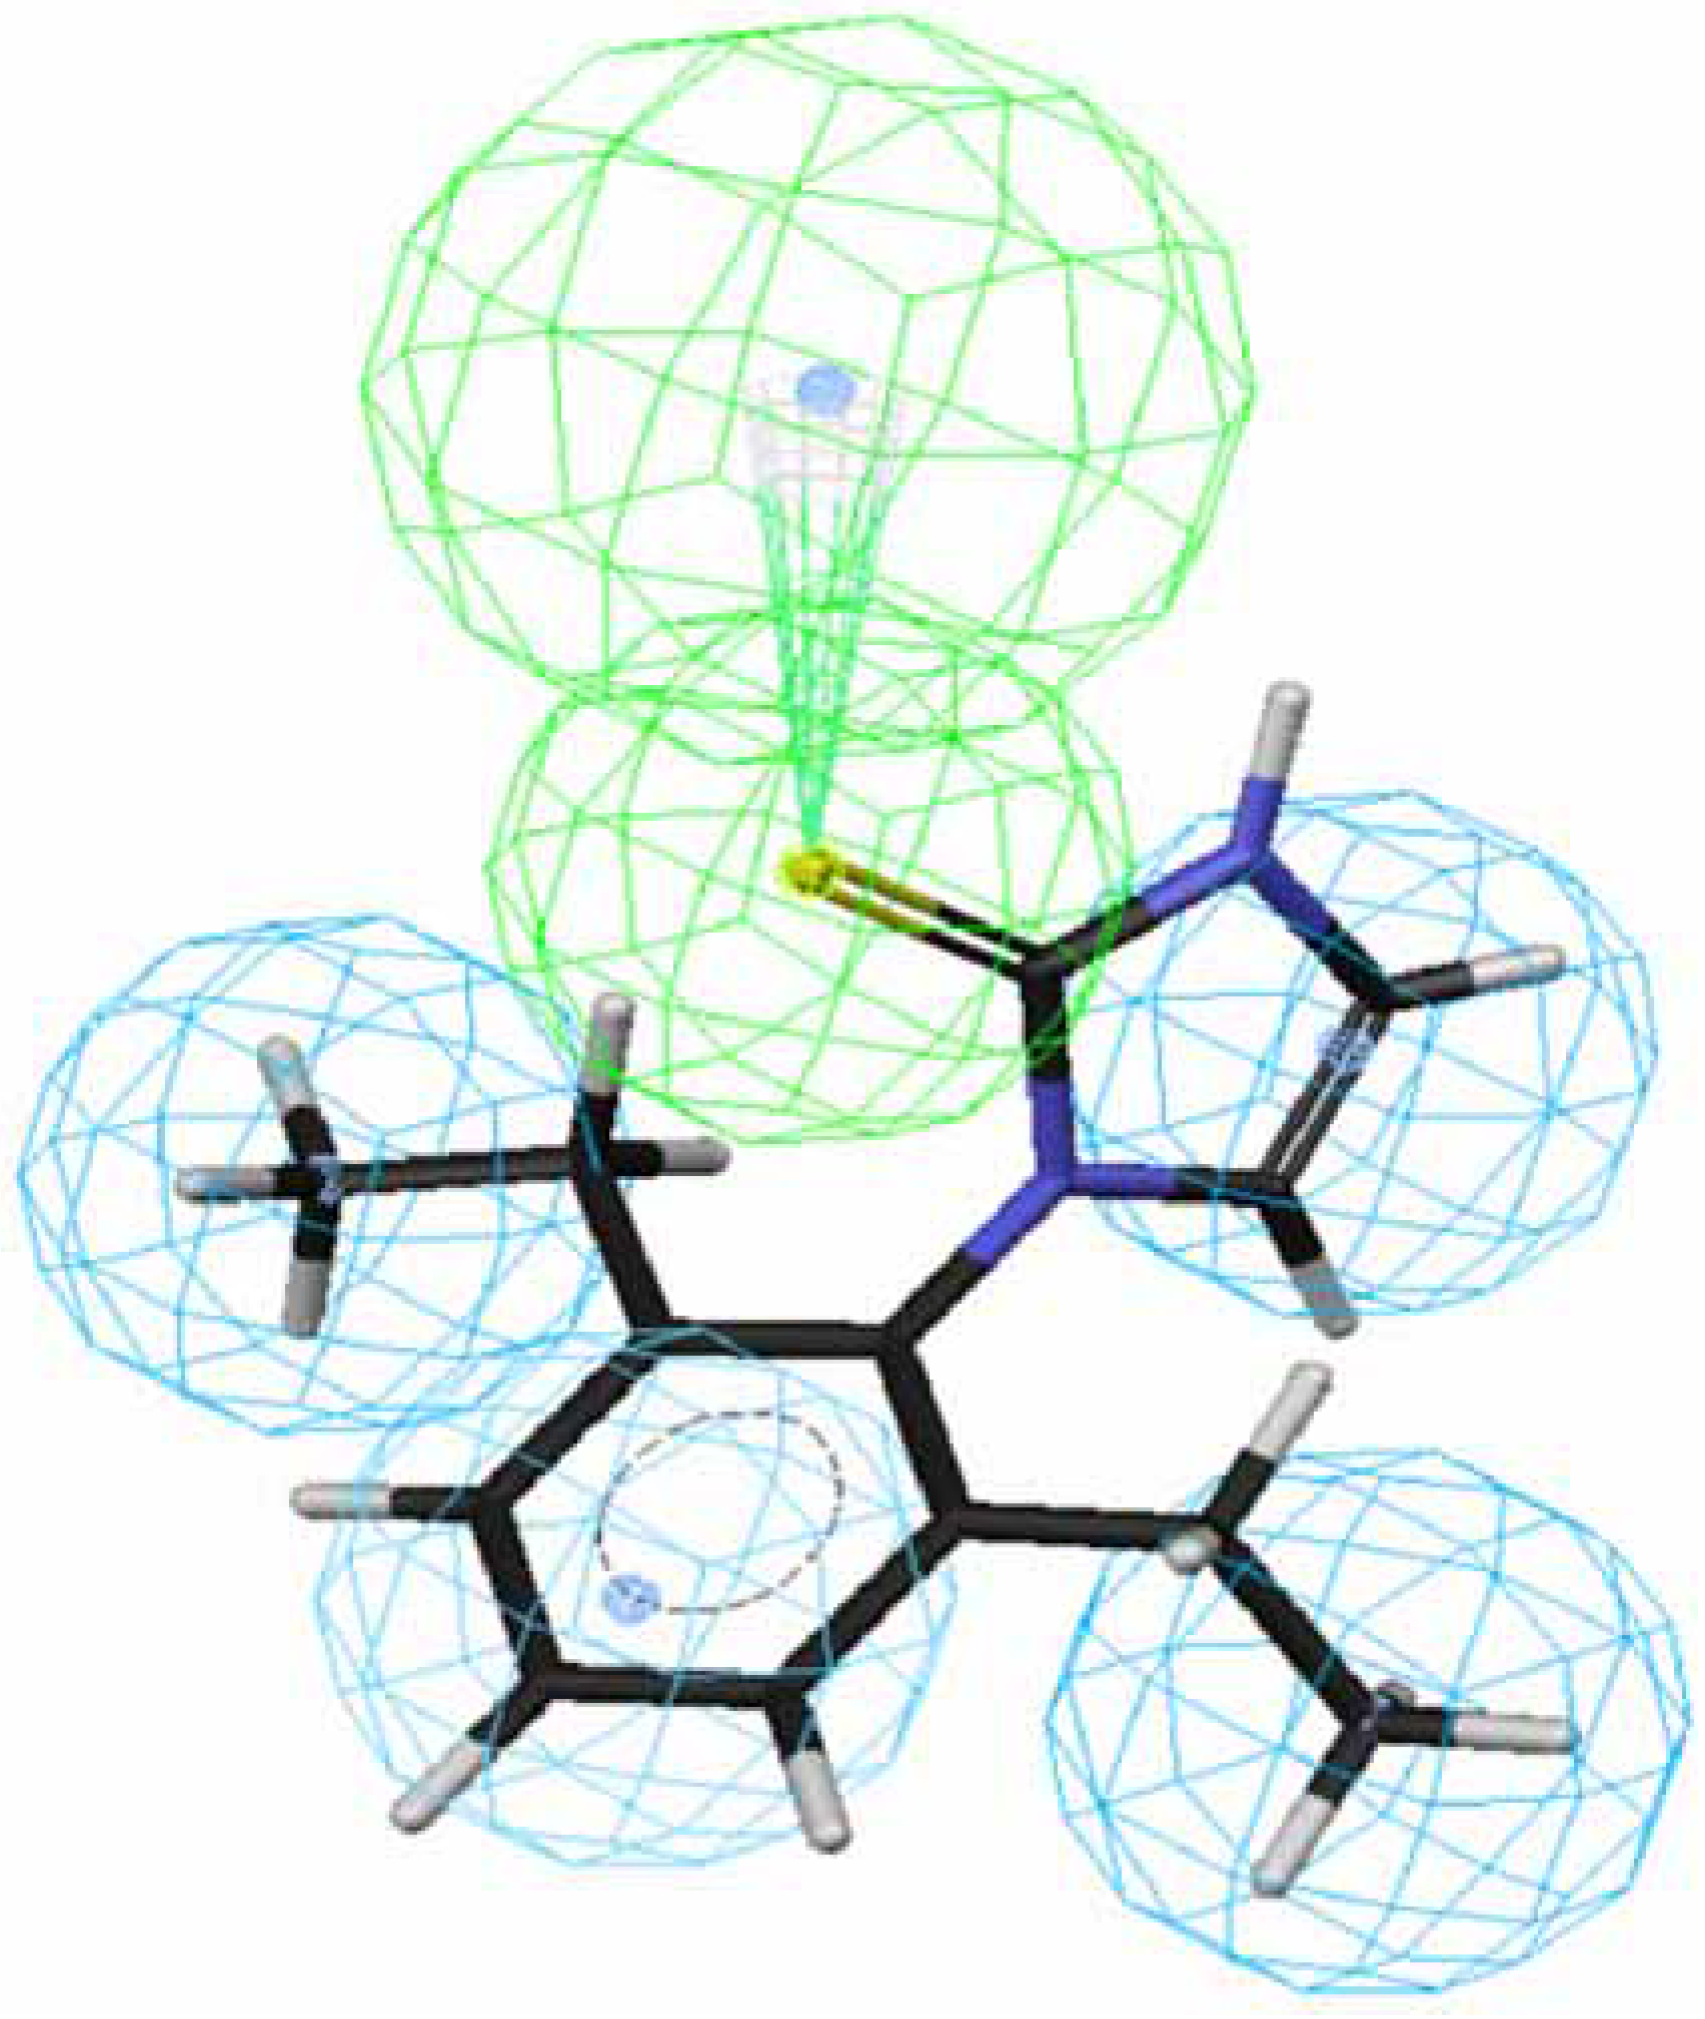
Figure 1 and
Figure 2 depict the most active compound AIT
70 and its AIHT analog
43, which has a low OA-agonist activity, mapped to hypothesis 1, respectively. The molecule
70 maps well to the five features of hypothesis 1, whereas an HpAl is supposed to map to double bond in
43. The partition coefficients measured using octanol-water solvent system and substituted benzen solutes for ethyl and ethlenyl are 1.02 and 0.82 [
20], respectively. Thus, the double bond in
43 is less hydrophobic than a saturated bond in
70 and
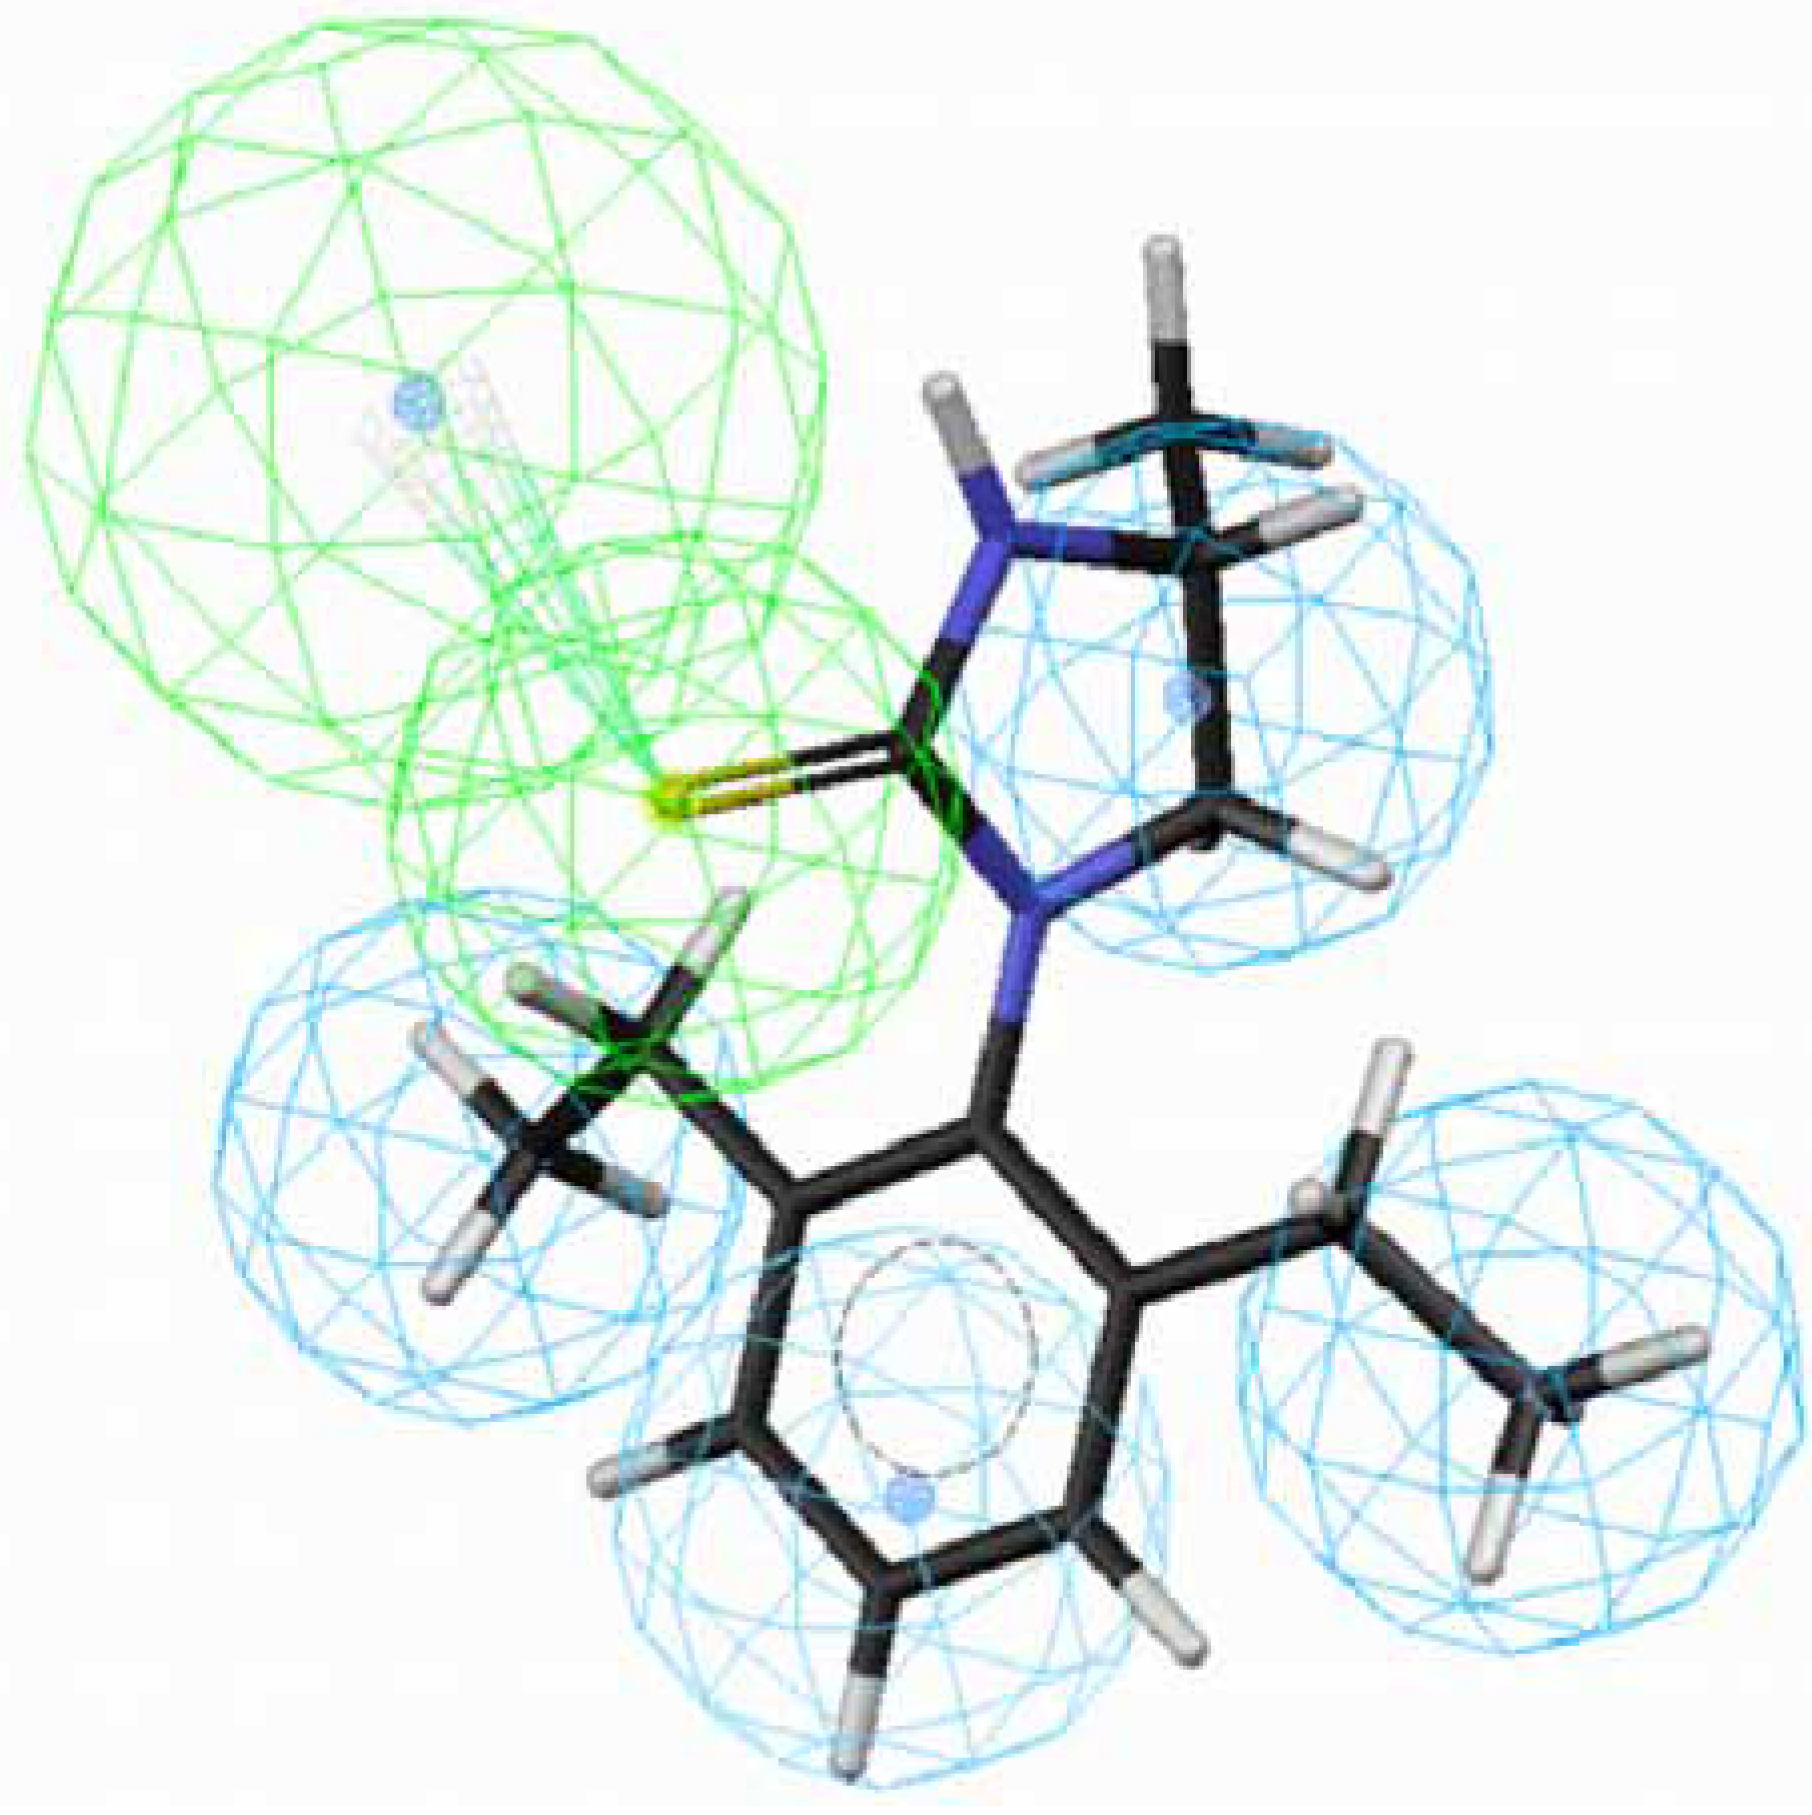
43 does not suit to the hypothesis 1. Besides, the introduction of a methyl group at position 4 of the imidazolidine ring of
70 lowered the activity dramatically, leading to
71 (
Fig. 3). The methyl group sticks out of an HpAl. Taken together, 2,6-Et
2-Ph and the imidazolidine ring without any substituents are important for OA-agonist activity. An imidazole ring and the introduction of substituents to the imidazolidine ring are not favorable. Generally, more active molecules map well to all the features of the hypothesis (
Fig. 1) and compounds that have low activity map poorly to the hypothesis (
Fig. 2 and
Fig. 3). Other compounds in
Table 1 with low activity also do not fit to these features.
Figure 1.
Mapping of 70 to hypothesis 1, which contains an HpAr (blue), three HpAls (blue) and an HBAl (green).
Figure 1.
Mapping of 70 to hypothesis 1, which contains an HpAr (blue), three HpAls (blue) and an HBAl (green).
Figure 2.
Mapping of 43 to hypothesis 1, which contains an HpAr (blue), three HpAls (blue) and an HBAl (green).
Figure 2.
Mapping of 43 to hypothesis 1, which contains an HpAr (blue), three HpAls (blue) and an HBAl (green).
Figure 3.
Mapping of 71 with (S)-configuration to hypothesis 1, which contains an HpAr (blue), three HpAls (blue) and an HBAl (green).
Figure 3.
Mapping of 71 with (S)-configuration to hypothesis 1, which contains an HpAr (blue), three HpAls (blue) and an HBAl (green).
An HpAl of hypothesis 3 is replaced by an Hp, leading to hypothesis 1 and an HBAl of hypothesis 3 is replaced by an HBA, leading to hypothesis 5. An HpAl of hypothesis 5 is replaced by an Hp, leading to hypothesis 7. The small range of rank score suggests that these hypotheses were homogenous. Roughly speaking, hypotheses 1, 3, 5 and 7 have the good similarity in 3D spatial shape and therefore these hypotheses are considered to be equivalent.


