Article

Comparative Chloroplast Genomics of Actinidia deliciosa Cultivars: Insights into Positive Selection and Population Evolution

Key Laboratory of Resource Biology and Biotechnology in Western China, Ministry of Education, College of Life Sciences, Northwest University, Xi’an 710069, China
*
Authors to whom correspondence should be addressed.
These authors contributed equally to this work.
Int. J. Mol. Sci. 2025, 26(9), 4387; https://doi.org/10.3390/ijms26094387
Submission received: 14 February 2025 / Revised: 3 May 2025 / Accepted: 4 May 2025 / Published: 5 May 2025
(This article belongs to the Section Molecular Plant Sciences)

Abstract

:
The chloroplast genome, as an important evolutionary marker, can provide a new breakthrough direction for the population evolution of plant species. Actinidia deliciosa represents one of the most economically significant and widely cultivated fruit species in the genus Actinidia. In this study, we sequenced and analyzed the complete chloroplast genomes of seven cultivars of Actinidia. deliciosa to detect the structural variation and population evolutionary characteristics. The total genome size ranged from 156,404 bp (A. deliciosa cv. Hayward) to 156,495 bp (A. deliciosa cv. Yate). A total of 321 simple sequence repeats (SSRs) and 1335 repetitive sequences were identified. Large-scale repeat sequences may facilitate indels and substitutions, molecular variations in A. deliciosa varieties' chloroplast genomes. Additionally, four polymorphic chloroplast DNA loci (atpF-atpH, atpH-atpI, atpB, and accD) were detected, which could potentially provide useful molecular genetic markers for further population genetics studies within A. deliciosa varieties. Site-specific selection analysis revealed that six genes (atpA, rps3, rps7, rpl22, rbcL, and ycf2) underwent protein sequence evolution. These genes may have played key roles in the adaptation of A. deliciosa to various environments. The population evolutionary analysis suggested that A. deliciosa cultivars were clustered into an individual evolutionary branch with moderate-to-high support values. These results provided a foundational genomic resource that will be a major contribution to future studies of population genetics, adaptive evolution, and genetic improvement in Actinidia.

1. Introduction

Actinidiaceae is considered one of the most economically and ecologically important fruit families, which generally includes the genus Actinidia, Clematoclethra, Sladenia, and Saurauia species [1]. Molecular phylogenetic studies have revealed that Actinidiaceae and Ericaceae formed sister groups within the asterid clade, having differentiated at 90.5 myr, and the differentiation of Actinidia and Clematoclethra occurred in the Middle Eocene [2].
Actinidia deliciosa is a perennial dioecious deciduous vine, belonging to Actinidiaceae [3]. It is known for its unique flavor, high vitamin C content, dietary fiber, and various minerals, which make it highly nutritious [4]. Due to its superior ecological environment, favorable climatic conditions, and suitable soil pH value, China is the main production area of A. delicious [5]. The A. deliciosa varieties Xuxiang, Miliang, and Qinmei account for over 80% of the total cultivated area in China [6]. Therefore, A. deliciosa is an important germplasm resource for breeding kiwifruit varieties [5].
Due to the species of Actinidia having great morphological similarity and the variation often overlapping over species boundaries, the genetic relationship and species limits of Actinidia have long been controversial. Actinidia was established by British botanist John Lindley in 1836 [7]. According to the morphological characteristics, Dunn divided Actinidia into sect. Vestitae, sect. Maculate, sect. Ampulliferae, and sect. Leiocacarpae for the first time. Subsequent revisions reorganized these into Actinidia, which was divided into sect. Leiocarpae, sect. Maculate, sect. Stellatae, and sect. Strigosae [8]. Recent molecular phylogenetic studies have led to the adoption of various methods to explore the species classification of Actinidia, yet their results have only partially supported the traditional taxonomic system [9,10].
The plant chloroplast genome, due to its uniparental inheritance, conserved structure, and small size, is particularly suitable for deciphering complicated population evolutionary relationships. Some significant progress has been made in the study of Actinidia chloroplast genomes, with their complete sequences now available for multiple species (e.g., Actinidia eriantha, Actinidia hemsleyana, and Actinidia chinensis) [11,12,13]. For instance, studies have demonstrated that the length of the chloroplast genome sequence increased with the chromosome ploidy level in conspecific taxa of A. chinensis and A. deliciosa [14]. The long repeat sequences, rather than simple sequence repeats(SSRs) in Actinidia, were revealed to be the causal agent leading to chloroplast genome size expansion [15]. Genetic evolutionary analysis based on complete chloroplast genomes demonstrated that A. deliciosa was clustered closely with A. chinensis, Actinidia melanandra, and Actinidia callosa [16]. However, population genetics studies on different cultivars within a single Actinidia species remain entirely unexplored. Several critical questions demand urgent investigation: (1) Do cultivars of the same kiwifruit species exhibit distinctive chloroplast genome evolutionary patterns? (2) Can population evolutionary analyses based on the complete chloroplast genome provide novel insights into the genetic relationships among these cultivated varieties? (3) What is the extent of chloroplast DNA polymorphism and differentiation among cultivars of the same species? Through these investigations, we hope to elucidate the genetic characteristics and evolutionary background of A. deliciosa cultivars while enriching molecular datasets for the Actinidia genus.

2. Results

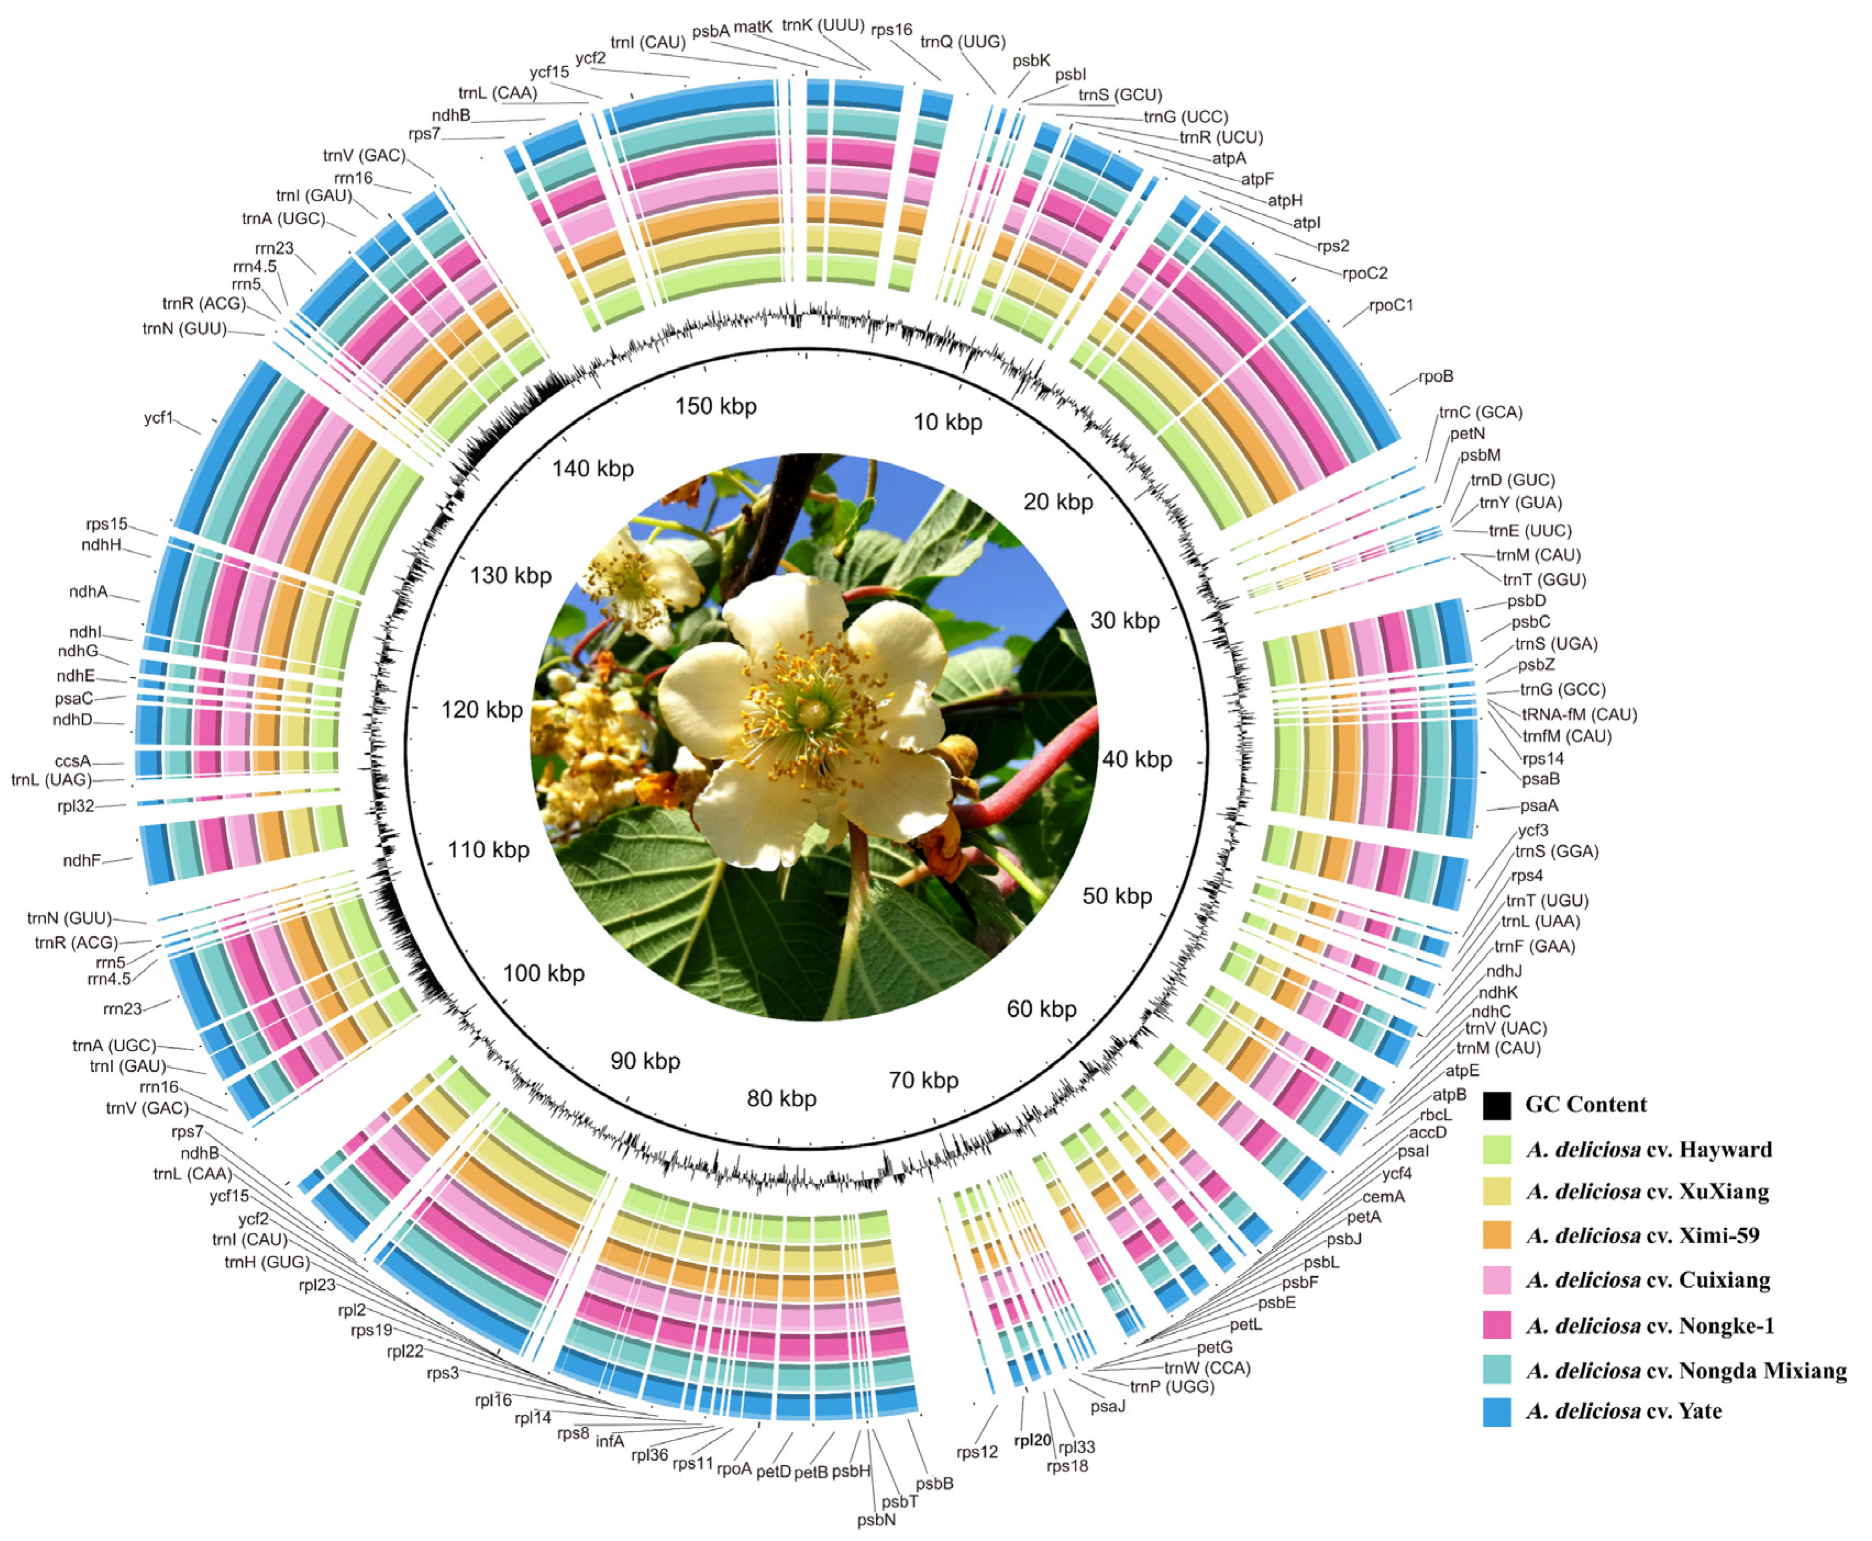
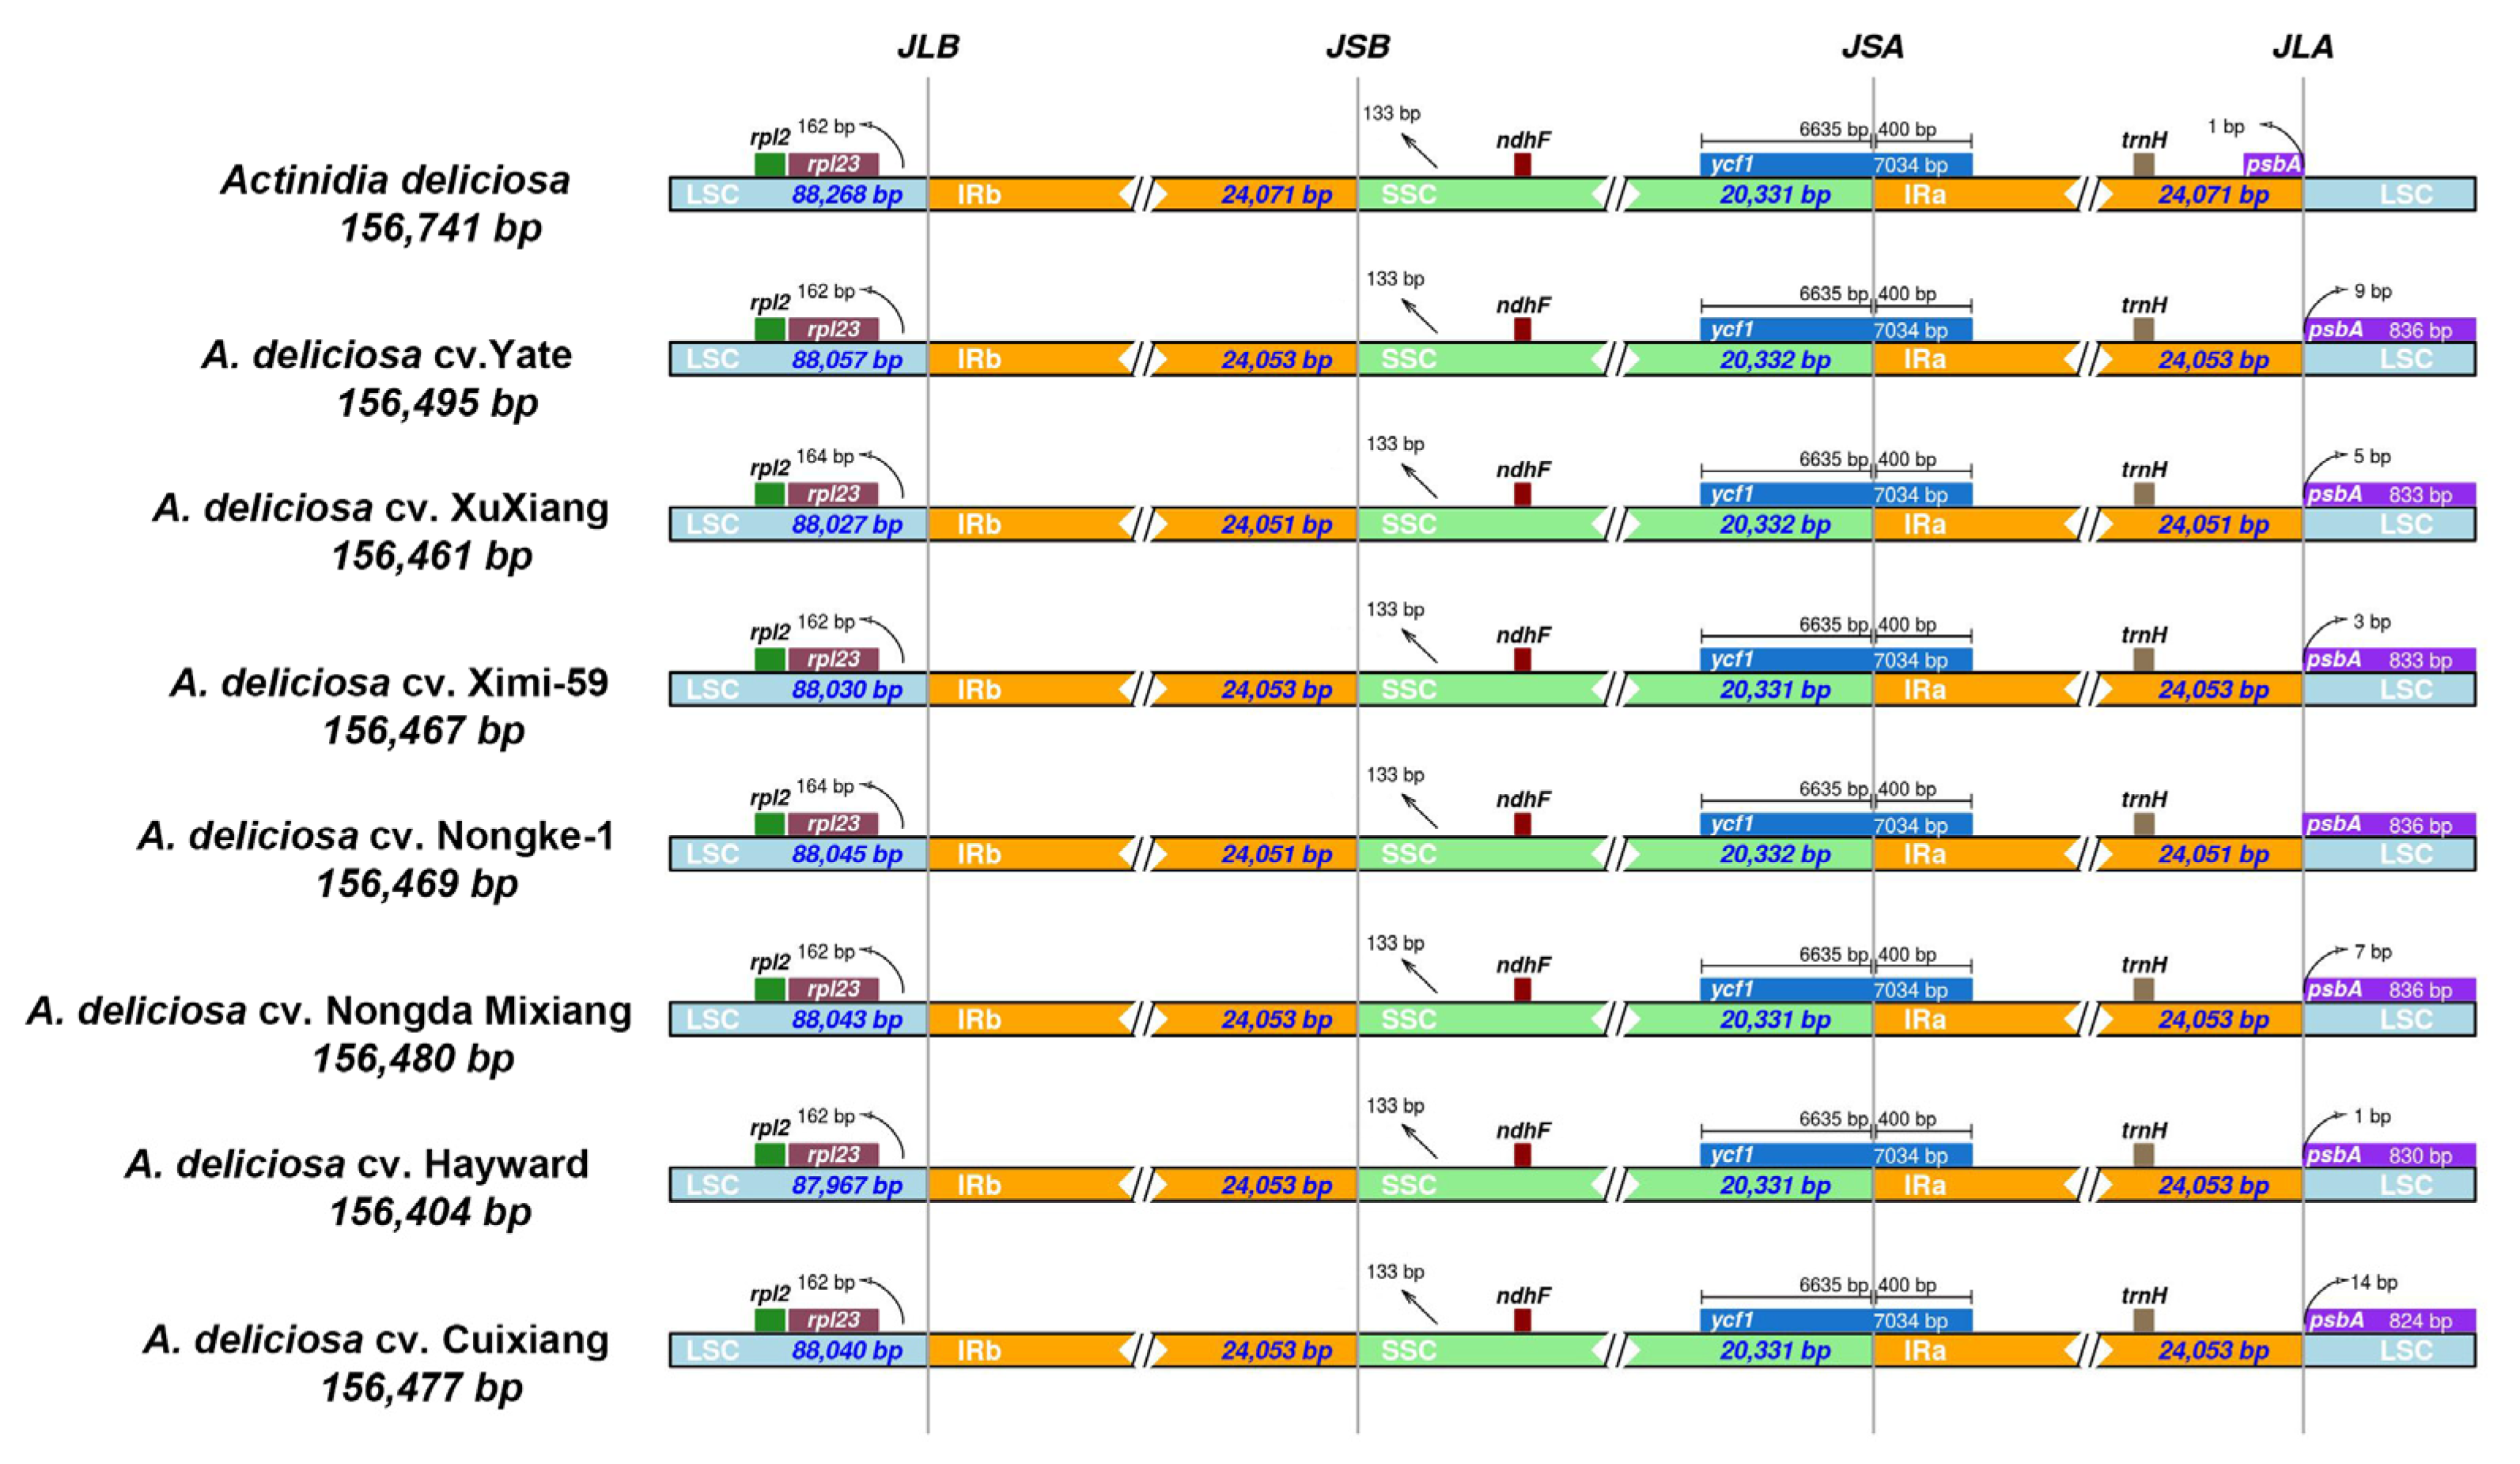
2.1. Chloroplast Genome Features of A. deliciosa Cultivars

The chloroplast genome of A. deliciosa is a closed circular double-stranded DNA molecule. The seven newly sequenced A. deliciosa varieties' chloroplast genomes ranged from 156,404 bp for A. deliciosa cv. Hayward to 156,495 bp for A. deliciosa cv. Yate (Figure 1). The structure of these chloroplast genomes was analogous to most chloroplast genomes of plants with a typical quadripartite structure, with two IRs (24,051–24,053 bp) separated by the LSC (87,967–88,057 bp) and SSC (20,331–20,332 bp) regions (Table 1). All seven varieties shared identical GC contents (37.20%), with the LSC (35.50%) and SSC regions (31.10%) showing a lower GC content than the IR regions (42.90%) (Table 1). The high GC percentage in the IR regions was possibly due to the presence of four rRNA genes in these regions. A total of 131 genes (including 18 duplicated genes) were annotated on these chloroplast genomes, comprising 83 protein-coding genes, 40 transfer RNA genes (tRNA), and 8 ribosomal RNA genes (rRNA) (Table S2). Eighteen genes were duplicated in the IR region, including four protein-coding genes (rps7, ndhB, ycf2, and ycf15), ten tRNA genes (trnA-UGC, trnR-ACG, trnN-GUU, trnH-GUG, trnI-CAU, trnI-GAU, trnL-CAA, trnfM-CAU, trnM-CAU, and trnV-GAC), and four rRNA genes (rrn4.5, rrn5, rrn16, and rrn23). A total of 14 protein-coding genes and 8 tRNA genes contained one or more introns. Seventeen genes contained one or two introns, of which 11 were protein-coding genes (rps12, rps16, rp12, rp116, rpoC1, ycf3, ndhA, ndhB, petB, petD, and atpF), and 6 were responsible for tRNA genes (trnA-UGC, trnG-UCC, trnI-GAU, trnL-UAA, trnK-UUU, and trnV-UAC) (Table S2). In general, the structure of chloroplast genomes, such as gene content and gene order, was highly conserved between the seven A. deliciosa varieties.

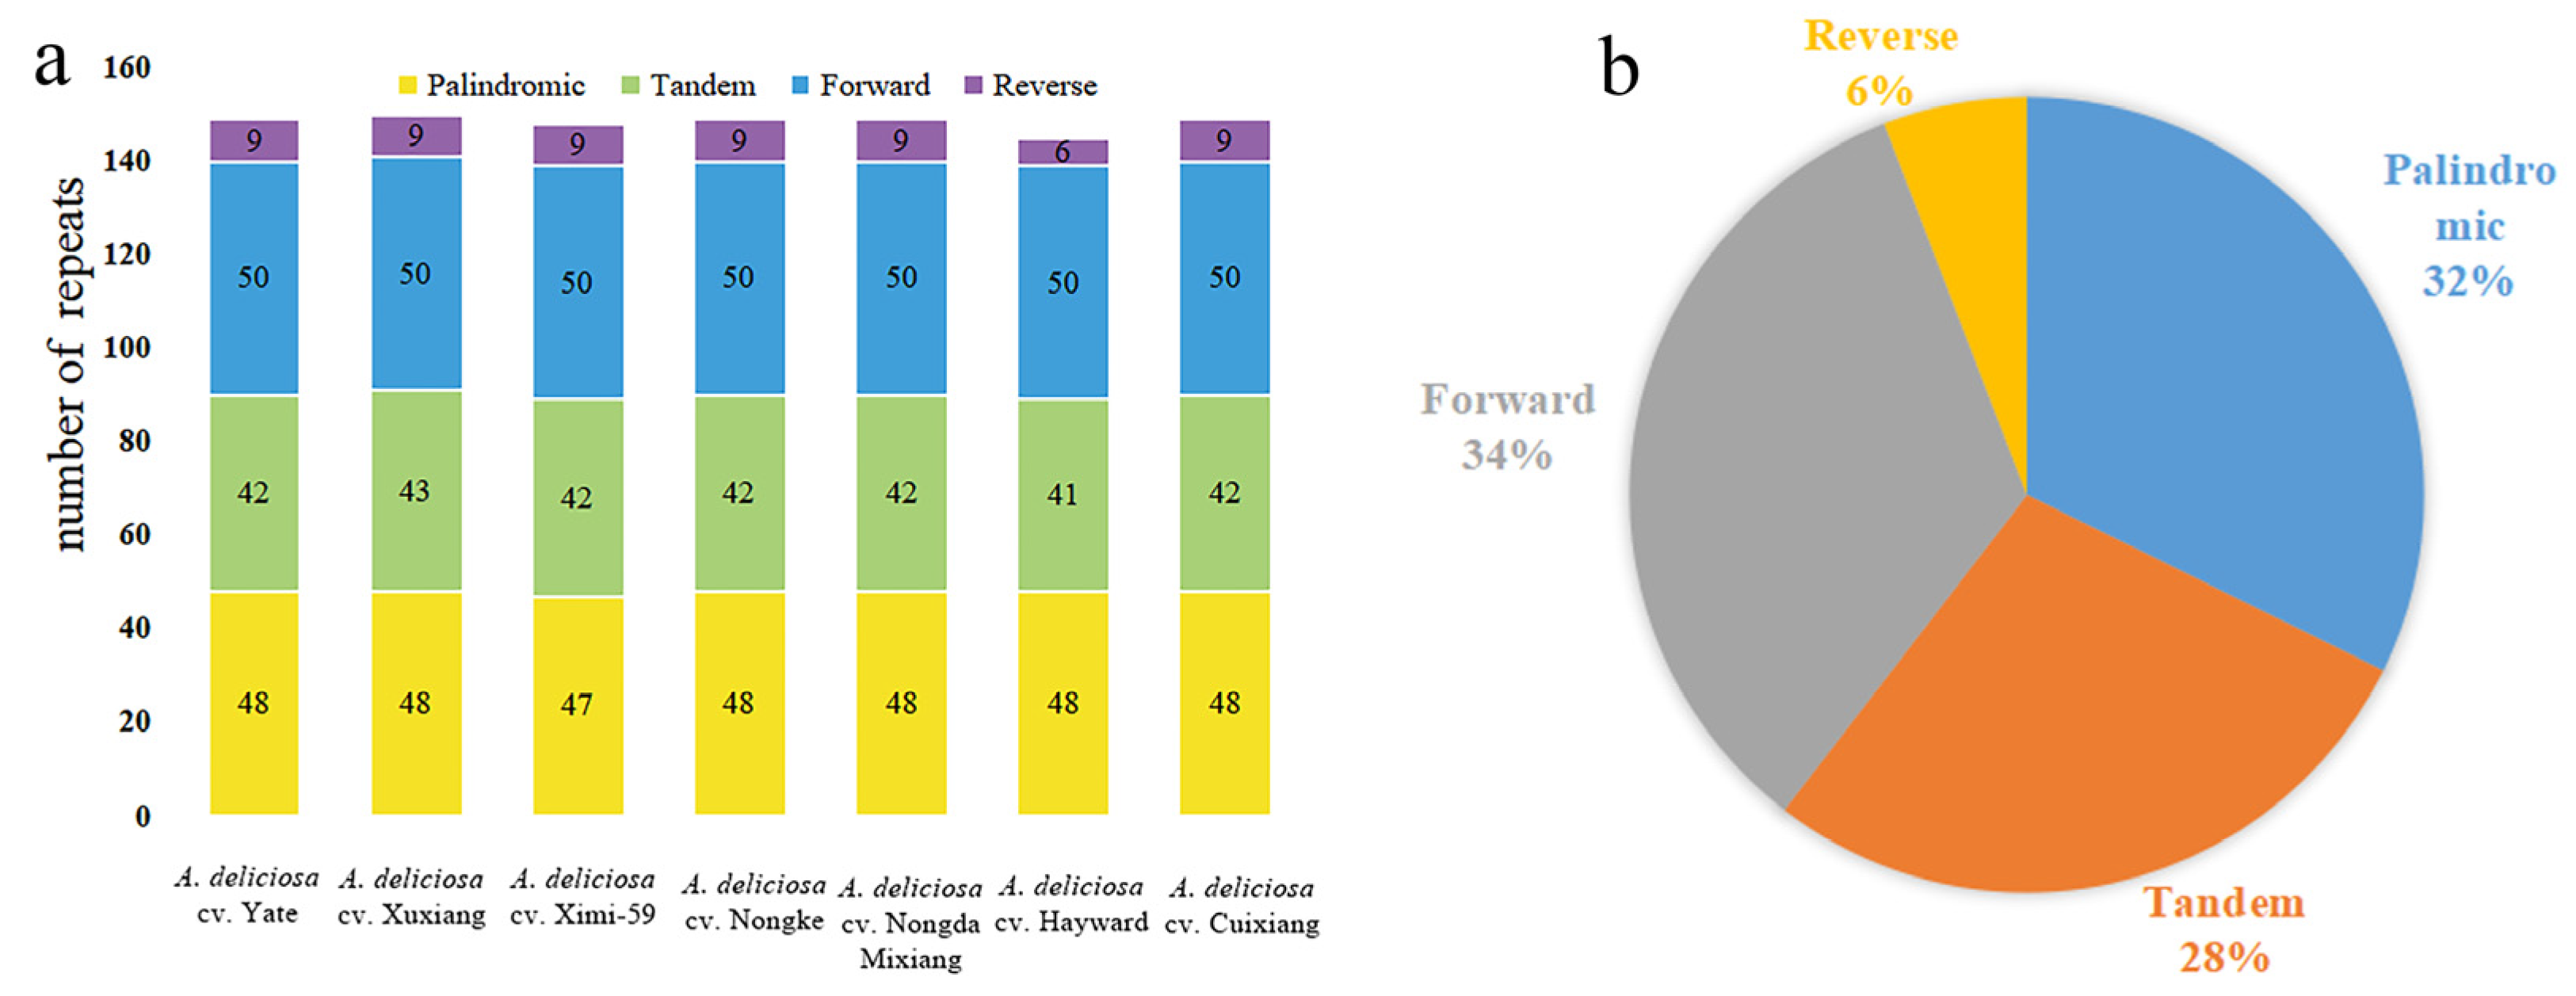
2.2. Distribution and Characterization of Repeat Elements

The chloroplast genomes in seven A. deliciosa varieties contain numerous palindromic repeats, dispersed repeats (including both forward and reverse repeats), and tandem repeats (Figure 2a and Table S3). In this study, 1335 repeats were identified, where 528 were dispersed repeats, as the most common of the three types, which accounted for 40% of the total repeats; there were 431 tandem repeats, which accounted for 32%; and there were 346 palindromic repeats, which accounted for 28% (Figure 2b). Notably, the distribution of these three types of repeats in the chloroplast genome of different varieties is highly similar, and they are usually located in the same gene. This large number of repeats may maintain the stability of the chloroplast genome.
Simple repeat sequences (SSRs) exhibit high polymorphism, making them valuable molecular markers that have been widely applied in population genetics and species biodiversity research. Using the MISA-web tool ((MIcroSAtellite identification tool), we analyzed the distribution of various SSR types across seven A. deliciosa varieties (Figure 3a). In total, we identified 321 SSRs (including mono-, di-, tri-, tetra-, penta-, hexa-, and polynucleotides), where 237 were found in the LSC region, and 70 and 14 in the SSC and IRb regions, respectively (Table S4). The mononucleotide repeats were most frequent, comprising 54% of the total, and 13% were tetranucleotide repeats (Figure 3b). The number of trinucleotide repeats was higher than that of dinucleotide repeats, and there were very few pentanucleotide or hexanucleotide repeats in seven A. deliciosa varieties. Most of the simple repeat sequences were distributed in the non-coding region, which accounted for 76.00% (intergenic spacer regions = 63% and intron regions = 13%) (Figure 3c). And SSRs located in the coding regions were mainly located in atpF, atpH, rpoC2, accD, atpF, psbI, rpoA, rpoB, and rpoC1 genes. The SSRs identified in the chloroplast genome sequences contained a large number of AT bases, and all mononucleotide and dinucleotide repeats were A/T (Table S5).
While the total number and distribution of SSRs were largely conserved across the seven A. deliciosa varieties (Figure 3a), we identified some SSRs exhibiting length variation or motif alteration across varieties. These variable SSRs were primarily located in the LSC region and the SSC region. For instance, in the intron of the atpF within the SSC region, a compound SSR was detected, with its sequence characteristics showing significant differences among different varieties: A. deliciosa cv. Nongke-1 possesses a unique compound sequence (T)10ctatatctttcta(T)11 (34 bp), while all other varieties only exhibited simple (T)11 repeats without any intervening sequences. In the atpF-atpH spacer within the LSC region, the SSR sequence in most varieties is (T)10atatat(TA)5 (26 bp), but this SSR locus was completely absent in A. deliciosa cv. Hayward. Regarding the trinucleotide SSR in the intron of atpF within the SSC region, most varieties (including A. deliciosa cv. Hayward) had (TTA)7 repeats, but the position of A. deliciosa cv. Hayward’s SSR was significantly shifted compared to the other varieties, possibly reflecting genomic structural variation. The compound SSR in the ycf4-cemA spacer exhibited high discriminative power among varieties: A. deliciosa cv. Cuixiang, A. deliciosa cv. Yate, A. deliciosa cv. Nongda, A. deliciosa cv. Mihong: ending with (T)14, A. deliciosa cv. Xuxiang, and A. deliciosa cv. Ximi-59: ending with (T)12, with A. deliciosa cv. Hayward having a different intermediate sequence compared to other varieties.

2.3. Sequence Divergence Patterns of Chloroplast Genomes

We used mVISTA to perform a sequence divergence analysis, with A. deliciosa cv. Yate as a reference. Sequence divergence analysis revealed high sequence similarity across the seven A. deliciosa varieties' chloroplast genomes (Figure S1), which suggested that the chloroplast genomes were relatively well conserved. In general, the non-coding and single-copy regions exhibited higher levels of divergence than the coding and IR regions, respectively. However, the levels of divergence in hotspot regions were relatively low due to limited intraspecific variation.
The percentage of variation in non-coding regions ranged from 0% to 3.00%, with an average of 0.74%, which was seven times higher than that in the protein-coding regions (0.1% on average) (Figure S2). And two intergenic spacer regions with percentages exceeding 0.80% were trnG(UCC)-trnR(UCU) and atpH-atpI. In the non-coding regions, the mean percentages of variations in the LSC, SSC, and IR regions were 0.87%, 0.065%, and 0.00%, respectively, which revealed that the IR region was highly conserved. However, there were only two variation points in the coding region, respectively located in the atpB and accD gene, and the percentage of variation was 0.1% (Table S6).
In addition, we compared the expansion and contraction of the LSC/IRs and IRs/SSC borders and their adjacent genes in the chloroplast genomes of seven A. deliciosa varieties’ chloroplast genomes (Figure 4). The gene arrangement of all A. deliciosa varieties was highly conserved, where rpl23, ndhF, ycf1, trnH, and psbA were present at the junction of LSC/IRb, IRb/SSC, SSC/IRa, and IRa/LSC. The ycf1 gene was situated at the junction of IRb/SSC, extending 6635 bp into the IRb region. The psbA gene has different positions in these chloroplast genome sequences. In the seven A. deliciosa varieties' chloroplast genome sequences in this study, the psbA gene was completely localized in the LSC region, and the length to the IRa/LSC boundary was between eight and 14 bp. Notably, the NCBI reference sequence (NC_026690) anomalously places psbA entirely within the IRa region, which was a configuration discordant with our data. From the perspective of functional evidence, the plastid gene psaA encodes the P700 chlorophyll ɑ apoproteins of PSI and D1 subunits of the core complex of PSII [17]. The plastid-encoded genes for proteins and cofactors associated with the PSI and PSII supercomplexes, such as psbA, psbB, psbC, psbD, etc., were scattered across the LSC region [18]. Overall, the structure and gene content of the eight chloroplast genomes were consistent, and no significant expansion or contraction of IR regions was found in the seven A. deliciosa varieties.

2.4. Positive Selection Genes

We identified six genes with sites under positive selection in the 27 Actinidia chloroplast genomes (Table S7). Interestingly, these genes included one ATP subunit gene (atpA), two small subunits of ribosome genes (rps3 and rps7), one large subunit of the ribosome gene (rpl22), one large subunit of the Rubisco gene (rbcL), and the ycf2 gene (Table S8). In addition, according to the M2 and M8 models, the ycf2 gene had nine sites under positive selection, while rbcL had seven sites, and each of the other four genes had only one active site. Both likelihood ratio tests (M0 vs. M3, M1 vs. M2, and M7 vs. M8) supported the presence of positively selected codon sites (p < 0.01).
In order to detect such positive selection sites, we selected the branch-site model for further analysis. The results showed that no positive selection sites were identified when branches other than eight A. deliciosa chloroplast genomes were used as foreground branches.

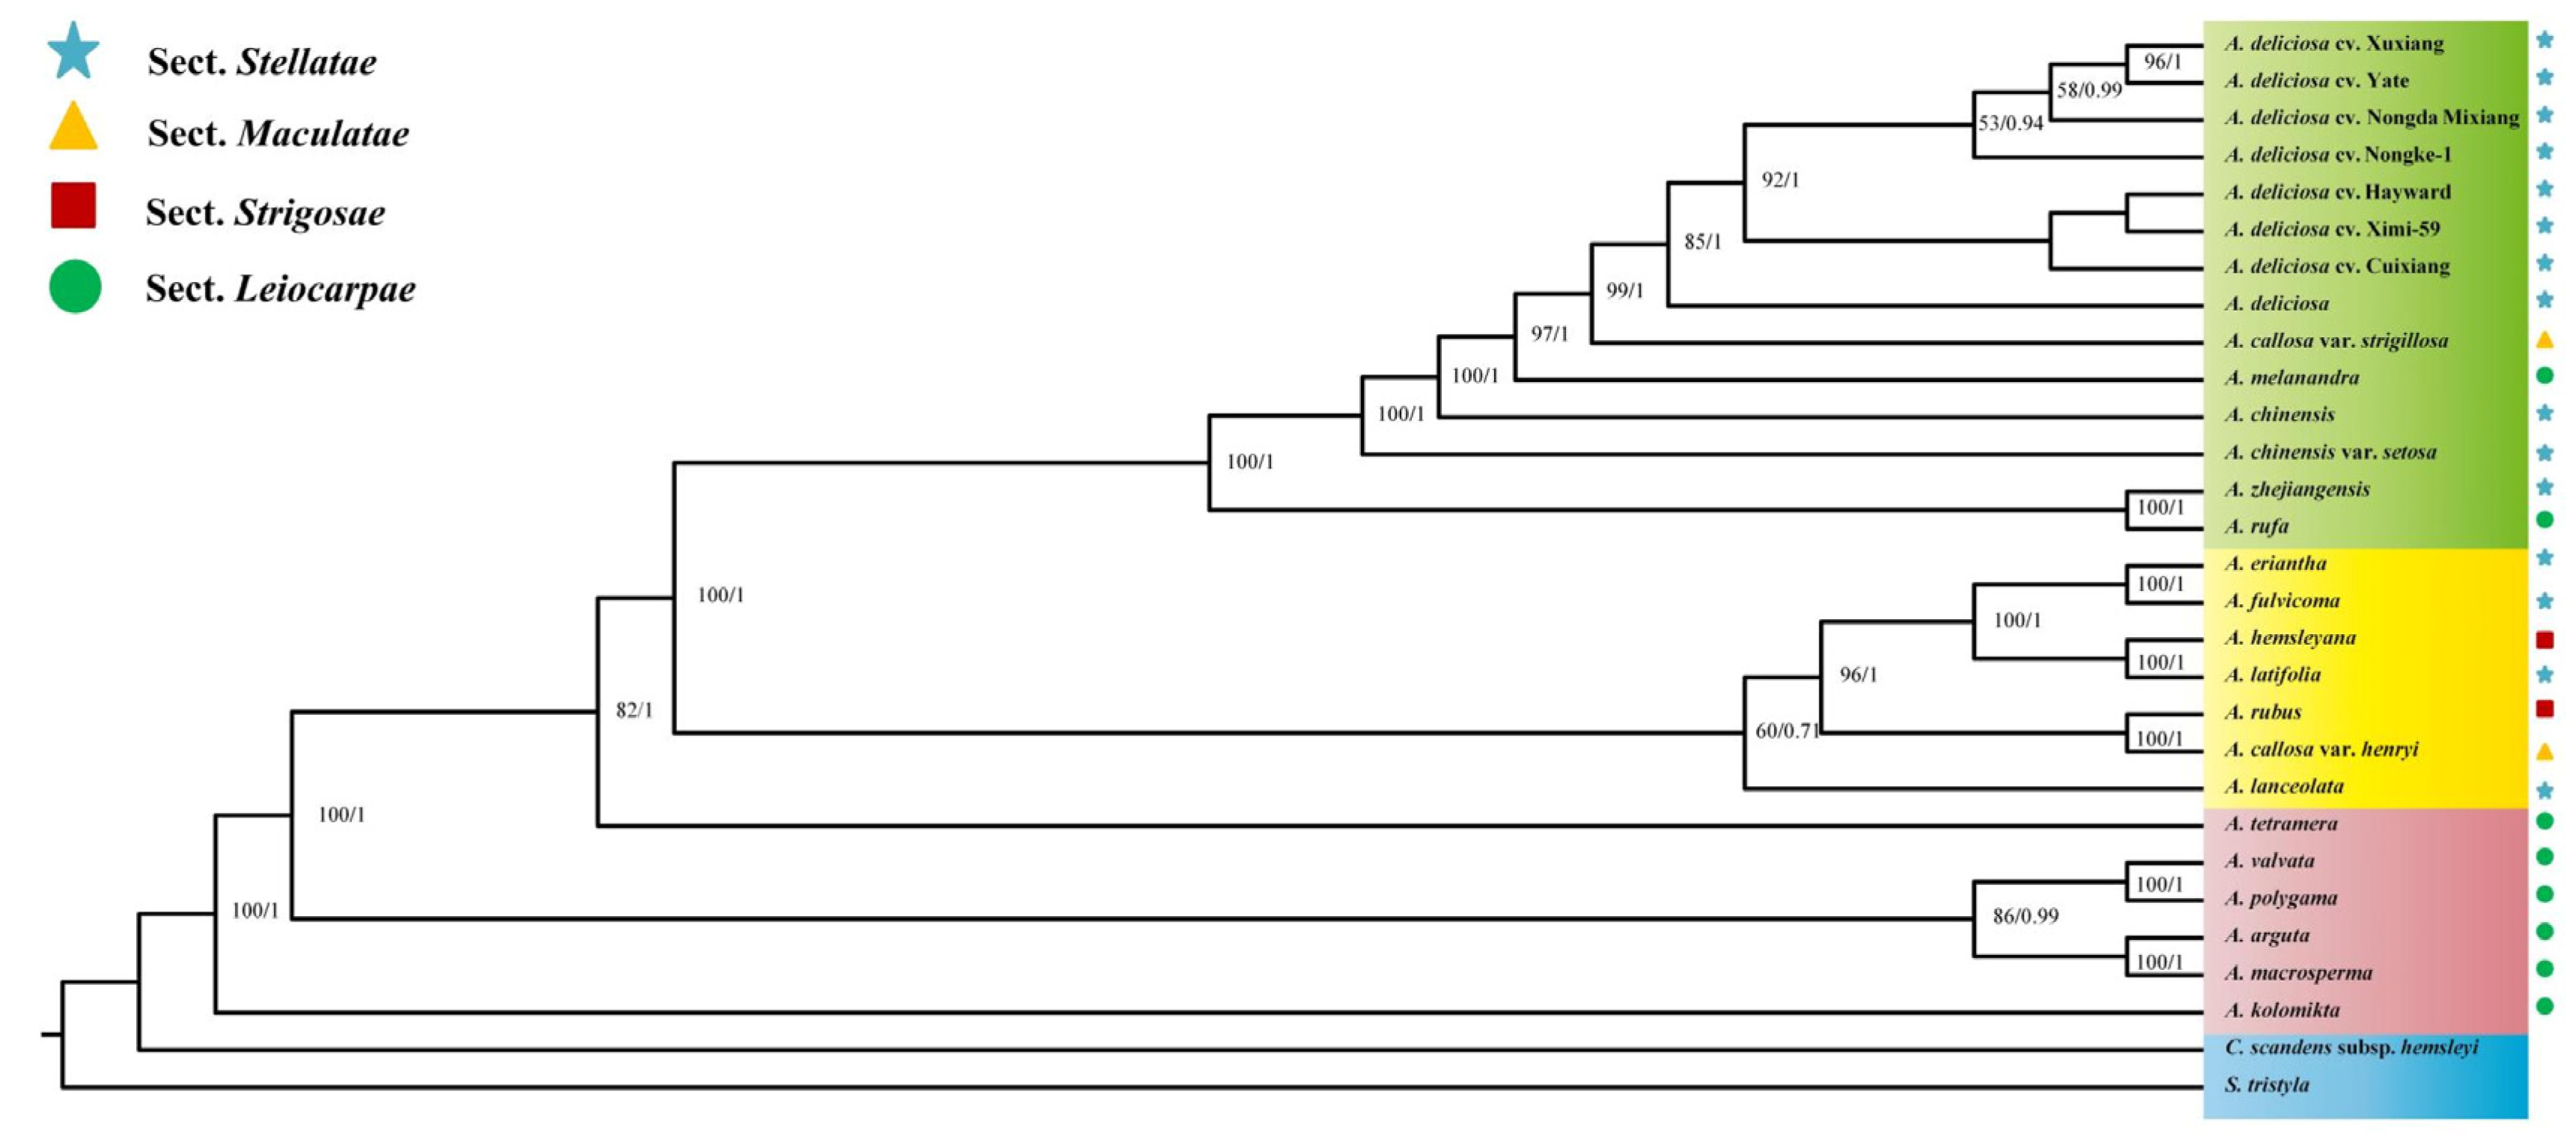
2.5. Genetic Evolutionary Analysis

The maximum likelihood (ML) evolutionary tree and Bayesian (BI) evolutionary relationships were constructed based on 27 whole-chloroplast genomes from the Actinidiaceae family using C. scandens subsp. hemsleyi and S. tristyla as outgroups (Figure 5). All nodes in the ML tree had moderate to high bootstrap support values, and these 27 Actinidia chloroplast genome sequences were clustered into three major genetic clades. According to the leaf characteristics, Actinidia was divided into sect. Leiocarpae, sect. Maculate, sect. Stellatae, and sect. Strigosae. Most of the species in the sect. Leiocarpae clustered as a paraphyletic group at the bottom of the phylogenetic evolutionary tree. The species of the other three sections were distributed in the other two genetic clades, and the species of these three sections overlap with each other without obvious demarcation. In addition, the results show that the seven A. deliciosa varieties in this study and the A. deliciosa published on NCBI formed a clade with a high bootstrap support value. This further shows that the seven A. deliciosa varieties in this study were stable genetic A. deliciosa varieties.

3. Discussion

In this study, we sequenced and assembled the complete chloroplast genomes of seven individuals from seven varieties of A. deliciosa (Figure 1). The genome size, gene order, and composition in the seven chloroplast genomes analyzed in this study were found to be similar to those previously reported for A. deliciosa plastid genomes [19]. The total GC content in the chloroplast genome of different varieties of A. deliciosa was 37.2% (Table 1), which was similar to that in most land plants. In addition, the GC content in IR regions was 42.9%, which had the largest difference from that in SSC and LSC regions (31.10% and 35.50%, respectively) (Table 1). This may be due to the existence of four rRNA genes in the IR regions. The highly conserved IR region may be related to the high GC content [20]. Moreover, by comparing the sequence length of each region, it was found that the chloroplast genome length of different varieties of A. deliciosa was mainly reflected in the LSC regions.
Repetitive sequences play a vital role in chloroplast genome evolution [21]. The distributions of three repeating types were highly similar in seven A. deliciosa chloroplast genomes, and they were usually located in the same regions. Meanwhile, most of the repetitive sequences are distributed in IGS regions. This large number of repeats might contribute to maintaining the stability of chloroplast genomes, and similar results were also obtained in other plant studies [22]. It is very important to detect the correlations between repetitive sequences and single-nucleotide polymorphisms (SNPs), as well as insertions–deletions (InDels) in plant chloroplast genomes. For instance, 88–96% oligonucleotide repeats showed co-occurrence with SNPs at the family and subfamily level, and the extent of correlation ranged from 0.182 to 0.513 between InDels and repetitive sequences in Malvaceae chloroplast genomes [23]. In addition, the narrow correlation between the localization of repetitive sequences and InDels has been reported in complete chloroplast genomes of gymnosperms and angiosperms [24,25,26]. The association between repeats and InDels suggests that repeat sequences can serve as markers for detecting mutational loci.
Building upon the pivotal role of repetitive sequences in shaping chloroplast genome architecture, SSRs represent another class of dynamic elements that contribute to genetic diversity. SSRs are widely distributed in plant chloroplast genomes, which have been widely applied as molecular markers for determining genetic variations across species in evolutionary studies because of their faster evolutionary rates [27,28]. It is noteworthy that a large number of SSRs are distributed in non-coding regions, which may be one of the reasons why the mutation rate in these regions is higher than that in protein-coding regions. Therefore, these SSR units could be used as important molecular markers in populations for addressing genetic diversity among closely related taxa. Some previous studies have demonstrated that polymorphism of SSR might have quantitatively regulated gene transcription [29]. In our study, a total of 322 SSRs were identified across seven A. deliciosa varieties, with 44 SSRs being conserved among all cultivars (Table S4). Overall, the SSRs exhibited low polymorphism levels. The high conservation of these SSRs makes them suitable for cultivar purity testing. We propose the polymorphic SSRs as “negative markers” to exclude non-target species. For instance, A. deliciosa cv. Hayward lacked one SSR that was present in all other varieties. Additionally, all types of SSRs were found to be AT-rich (Table S4), which was consistent with the previous report that poly A and T were the most abundant repeats in most angiosperm chloroplast genomes [30]. AT-rich motifs provide the structural basis for DNA replication slippage [31]. The prevalence of AT-rich sequences in chloroplast genomes likely reflects conserved genetic characteristics inherited from their prokaryotic endosymbiotic ancestor [32]. Interestingly, hexanucleotide SSRs were consistently detected in all seven A. deliciosa varieties (Table S4), while previous reports suggested their exclusive presence in A. tetramera and A. chinensis chloroplast genomes [13,15,33].
In order to determine the polymorphic loci, we compared the whole cp genome sequences of seven A. deliciosa varieties and calculated the percentages of variable characters in coding and non-coding regions (Figure S2). Our results indicated that the chloroplast genomes of seven A. deliciosa varieties showed low levels of genetic divergence. Furthermore, the proportion of variable sites was higher in the non-coding regions than the coding regions, which is generally consistent with most previous studies of the plastid genomes of angiosperms [34]. Additionally, four polymorphic loci (atpF-atpH, atpH-atpI, atpB, and accD) were identified in the seven A. deliciosa varieties’ chloroplast genome, which could be used in phylogenetic analyses or as potential DNA molecular barcodes in future population genetics studies [35].
In the process of genome evolution, the expansion or contraction of the IR regions is an important evolutionary force, which often affects the size variation of different chloroplast genomes [36,37]. In our study, the IR regions showed similar lengths among the seven A. deliciosa varieties, ranging from 24,051 bp to 24,053 bp (Figure 4). The results showed that the IR/LSC and IR/SSC boundaries of the chloroplast genome among different varieties might be conserved. Notably, rpl23 was 162–164 bp to the left of the LSC/IRb boundary, the distance between rpl23 and the IRb boundary correlated with the length of IRb, and IRb expansion shortened the rpl23-IRb boundary distance. In addition, IRa extended into the ycf1 genes, which was also observed in Cardiocrinum, Hamamelidaceae, and numerous other plant species [38,39]. Interestingly, many previous reports have shown that there are also some differences among relatively distantly related species, such as gene overlap length and duplication of the ycf1 and rps3 genes, suggesting that the expansion and contraction of IR regions lead to changes in the length and structure of the chloroplast genome [40,41].
In this study, we detected six chloroplast protein-coding genes in the 20 Actinidia species that were under positive selection (atpA, rps3, rps7, rpl22, rbcL, and ycf2) (Table S7). ATP synthase is a ubiquitous enzyme in eukaryotic organelles that is essential for both photosynthesis and respiration [42]. The atpA encodes the α subunit of the CF1 complex [43]. Additionally, we detected rps3 and rps7 genes, which play an important role in plant chloroplast ribosome synthesis [44]. The rpl22 gene is a ribosomal protein gene and is one of the common adaptive evolution genes in plant cells, which is mainly involved in the synthesis of ribosomal L22 protein [45]. Furthermore, the rbcL gene encodes the large subunit of Rubisco and plays an important role as a modulator of photosynthetic electron transport [46]. Previous studies have indicated that the rbcL gene is often under positive selection in land plants [47]. In particular, the rbcL gene experienced strong positive selection after the C3–C4 photosynthetic transition [48]. The ycf2 gene is one of the largest genes in the chloroplast genome, which is a large open reading frame. The role of the ycf2 gene remains unclear, but the more than 2000 amino acids encoded by ycf2 in most terrestrial plants are essential for cell survival [49,50]. These positively selected genes may have played important roles in the adaptation of Actinidia species to various environments. But the branch-site model did not detect positive selection sites. The result of this may be that, in the long-term evolution process, adaptive evolution occurred in the early stage and has been fixed, or the positive selection sites are covered by a large number of accumulated neutral substitution sites, so the positive selection sites will be difficult to detect [51]. While our analyses employed the widely used PAML with both site-specific models and branch sites, integrating additional approaches and models could provide deeper insights, such as HyPhy [52,53]. Notably, the potential discrepancies between PAML and HyPhy results would not necessarily indicate methodological limitations but might reflect genuine biological complexity.
Actinidia presents great obstacles to classification because of the extensive interspecific hybridization and gene introgression [54]. The phylogenetic tree constructed according to the whole-chloroplast genome sequences showed that the four sections divided according to morphology could not be clearly distinguished (Figure 5). The sect. Leiocarpae clustered as a paraphyletic group, which was located at the bottom of the phylogenetic tree, and the other three sections of species partially overlapped. Our result is consistent with the classification of Actinidia based on the micromorphological characters of foliar trichomes [55]. Li (1952) divided Actinidia. rufa into the sect. Leiocarpae [8]. However, subsequent studies utilizing chemical composition, genetics, and molecular biology approaches consistently demonstrated that A. rufa had not clustered with other species in sect. Leiocarpae [9,56]. A study based on isozymes and flavonoids showed that A. rufa did not belong to sect. Leiocarpae, and it was more reasonable to classify it into sect. Maculatae [57]. In conclusion, based on the research results of this paper, we support the hypothesis that Actinidia should be divided into sect. Leiocarpae and sect. Maculatae [5]. This hypothesis needs to be comprehensively analyzed in combination with morphology and phylogeography in the future.

4. Conclusions

Through a comparative analysis of the complete chloroplast genomes of seven A. deliciosa varieties, this study revealed the population genetics and evolutionary characteristics among cultivated varieties of A. deliciosa. The chloroplast genome sequences exhibited extremely high similarity among varieties, with the variations in non-coding regions being significantly higher than those in coding regions. Six positively selected genes were identified, with their selected sites potentially reflecting differential adaptation responses among different cultivated varieties. Trinucleotide, pentanucleotide, and hexanucleotide repeats were rare in Actinidia chloroplast genomes. In addition, the precise population relationships of all seven cultivated varieties were determined from A. deliciosa for the first time. The seven varieties exhibited certain degrees of genetic differentiation and were primarily clustered into one major evolutionary clade. This study not only enriched the complete chloroplast genome resources of A. deliciosa but also provided useful information for further studies of the population evolutionary history of Actinidia species. Future research should expand the scope to include additional Actinidia species, integrating both chloroplast and nuclear genomics data. Combining genomic information with phenotypic data to explore the origin and population evolution of the Actinidia should become a key focus for subsequent evolutionary investigations.

5. Materials and Methods

5.1. Plant Material and DNA Extraction

Fresh seeds were collected from seven A. deliciosa varieties (Cuixiang, XuXiang, Hayward, Nongda Mixiang, Yate, Nongke-1, Ximi-59) in Zhouzhi County, Shaanxi Province, China (Table S1). Voucher specimens of each sample were deposited in the Key Laboratory of Resource Biology and Biotechnology in Western China (Xi’an, China). The total genomic DNA was extracted using the modified CTAB method [58]. DNA was visualized by 1% agarose gel electrophoresis for quality checks. Subsequently, the complete genomic DNA was subjected to sequencing analysis using the Illumina NovaSeq 6000 sequencing platform, employing paired-end (PE) 150 bp sequencing strategies, which were executed by Novogene Bioinformatics Technology Co., Ltd., Beijing, China. The DNA library was constructed with an estimated mean insert size of 350 bp, and sequencing was carried out to achieve a coverage depth of roughly 50× for each chloroplast genome.

5.2. Chloroplast Genomes Assembly and Annotation

The NGSQC Toolkit v2.3.3 program [59] was utilized to filter the original Illumina raw reads, remove low-quality sequences (Phred score < Q20) and adapters, and obtain clean reads for subsequent assembly. We used the reference-guided assembly method to construct the chloroplast genomes with Bowtie v2.4.2 [60]. The chloroplast genome of the closely related species Actinidia chinensis (NC_026690) was selected as a reference. Chloroplast genomes were annotated using CPGAVAS2 (http://47.96.249.172:16019/analyzer/home (accessed on 21 April 2023)) to identify genes by using BLAST to search against the custom database [61]. The main various BLAST parameters were as follows: gapped alignment” was set to “yes”, “Genetic Code for Blastx “ was set to “11 plant plasit”, “Percent identity cutoff for protein coding” was set to “60”, “Percent identity cutoff for RNAs” was set to “90”, and “E-value” was set to “1 × 10⁻⁵”. The preliminary prediction results from DOGMA were aligned with the reference genome (NC_026690) (identity ≥ 95%) to confirm conservation. Based on the DOGMA predictions and the reference genome alignment, we manually adjusted the gene and CDS regions (e.g., correcting start/stop codons and exon–intron boundaries) with Geneious v8.0.2 [62]. Finally, the circular map for seven Actinidia deliciosa chloroplast genomes comparison was generated using BLAST Ring Image Generator (BRIG) v 0.95 software [63].

5.3. Repeat Elements Analysis

In this study, we examined three repeating types of chloroplast genome sequences, including palindromic, dispersed (forward and reverse repeats), and tandem repeats. The online program REPuter [64] was used to find the dispersed and palindromic repeats based on the following criteria: (1) Hamming distance = 3; (2) sequence identity ≥ 90%; and (3) minimum repeat size = 30 bp. In addition, the tandem repeat sequences were detected using the online program Tandem Repeats Finder (https://tandem.bu.edu/trf/trf.html (accessed on 5 April 2023)) [65], where the alignment parameters match, mismatch, and indel were set to 2, 7, and 7, respectively. The minimum alignment score and maximum period size were 80 and 500, respectively. The simple sequence repeats (SSRs) in chloroplast genomes were identified using the Perl script MISA web (http://pgrc.ipk-gatersleben.de/misa/ (accessed on 14 March 2023)) [66]. The minimum numbers of repeats were 10, 5, 4, 3, 3, and 3 for mono-, di-, tri-, tetra-, penta-, and hexanucleotides, respectively.

5.4. Comparative Chloroplast Genome Analysis

To visually assess sequence divergence between chloroplast genome sequences, seven A. deliciosa varieties were compared using mVISTA (https://genome.lbl.gov/vista/mvista/instructions.shtml (accessed on 25 March 2023)) [67], with A. deliciosa cv. Yate serving as a reference. The percentages of nucleotide variation for coding and non-coding regions were calculated according to the methods of Zhang et al. (2011) [38].
In addition to the seven A. deliciosa varieties sequenced in this study, we downloaded a chloroplast genome sequence of A. deliciosa (NC_026690) from NCBI. The online program IRscope (https://irscope.shinyapps.io/IRapp/ (accessed on 10 June 2023)) was used to compare expansion and contraction at the IR boundary of 8 A. deliciosa chloroplast genomes [68] and draw the SC/IR boundary map among the sequences.

5.5. Positive Selection Analysis

In order to detect the sites under selection in the protein-coding genes in Actinidia chloroplast genomes, the non-synonymous (dN) and synonymous (dS) nucleotide substitution rates and their ratio (ω = dN/dS) were calculated with Codeml program in PAML v4.7 (seqtype = 1, model = 2, NSsites = 2) [69,70]. Positive selection analysis was conducted based on 27 taxa, including 7 A. deliciosa varieties in the current study and 20 other Actinidia species downloaded in Genbank format from the National Center for Biotechnology Information database (NCBI, https://www.ncbi.nlm.nih.gov/ (accessed on 11 August 2023)) [71,72] (Table S1). The protein-coding genes were extracted using Geneious v8.0.2 and aligned using MAFFT v7.0. Maximum likelihood phylogenetic trees were reconstructed based on the complete cp genomes using RAxML v7.2.8 [73].
We employed the site-specific model and branch-site model to analyze the selection pressure based on 74 protein-coding genes shared by 27 Actinidia plastomes. The site-specific model allowed the ω ratio to vary among sites, with a fixed ω ratio in all the evolutionary branches. We compared the site-specific models to analyze the existence of selected sites: M0 (one ratio) vs. M3 (discrete); M1 (neutral) vs. M2 (positive selection); and M7 (beta) vs. M8 (beta and ω). The branch-site model A aims to detect positive selection that affects only a few sites on prespecified lineages. The branches being tested for positive selection are called the foreground branches, while all other branches on the tree are the background branches. The log-likelihood ratio test (LRT) [74] was used to estimate the quality of model A. The BEB method is implemented to calculate posterior probabilities for site classes under model A if the LRT suggests presence of codons under positive selection on the foreground branch.

5.6. Phylogenetic Analysis

Phylogenetic relationships were reconstructed based on 29 taxa, including 7 A. deliciosa varieties in the current study, 20 other Actinidia species, and 2 Actinidiaceae species (Clematoclethra scandens subsp. hemsleyi and Saurauia tristyla) that were used as outgroups (Table S1). The phylogenetic trees were reconstructed based on the complete chloroplast genomes. First, all the chloroplast genome sequences were aligned with MAFFT v7.0 [75].
jModelTest v2.1.10 [76] was used to determine the best-fitting model. Finally, maximum likelihood analysis was conducted using the program RAxML v7.2.8 with the GTR+G model for 1000 replications [73]. Bayesian inference was conducted using the program MrBayes v3.2.2 [77]. Markov chain Monte Carlo simulations were independently run twice for 1 million generations, and sampling trees every 1000 generations. Convergence was determined by examining the average standard deviation of split frequencies. During the operation of the algorithm, the first 25% of trees were discarded as burn-in.

Supplementary Materials

The following supporting information can be downloaded at: https://www.mdpi.com/article/10.3390/ijms26094387/s1.

Author Contributions

Conceptualization, X.W.; methodology, X.H. and Y.Y.; software, X.H., Y.Y. and X.Z.; validation, X.W.; formal analysis, X.H., Y.Y. and X.Z.; investigation, X.Z. and W.Z.; resources, Z.L.; data curation, X.H., Y.Y., X.Z., W.Z., Q.Z., C.L., Y.X. and X.W.; writing—original draft preparation, X.H., Y.Y. and X.W.; writing—review and editing, X.W.; visualization, Z.L. and X.W.; supervision, X.W. and Z.L.; project administration, X.W.; funding acquisition, X.W. and Z.L. All authors have read and agreed to the published version of the manuscript.

Funding

This research was funded by the National Natural Science Foundation of China (31970359, 32371694 and 31901232) and the Key Program of Research and Development of Shaanxi Province (2022ZDLSF06–02).

Institutional Review Board Statement

Not applicable.

Informed Consent Statement

Not applicable.

Data Availability Statement

Chloroplast genomes of A. deliciosa are being prepared for submission to NCBI.

Conflicts of Interest

The authors declare no conflicts of interest.

References

  1. Liang, C.F.; Chen, Y.C.; Wang, Y.S. Actinidiaceae. Flora Reipublicae Pop. Sin. 1984, 49, 2. [Google Scholar]
  2. Li, W.C.; Wang, K.L.; Peng, Y.J.; Zhou, Y.; Liu, Y.B. Distribution patterns and driving factors of mixed-ploidy Actinidia species in China. Sci. Hortic. 2024, 331, 113149. [Google Scholar] [CrossRef]
  3. Huang, S.X.; Ding, J.; Deng, D.J.; Tang, W.; Sun, H.; Liu, D.Y.; Zhang, L.; Niu, X.L.; Zhang, X.; Meng, M.; et al. Draft genome of the kiwifruit Actinidia chinensis. Nat. Commun. 2013, 4, 2640. [Google Scholar] [CrossRef] [PubMed]
  4. Perez-Burillo, S.; Oliveras, M.J.; Quesada, J.; Rufian-Henares, J.A.; Pastoriza, S. Relationship between composition and bioactivity of persimmon and kiwifruit. Food Res. Int. 2018, 105, 461–472. [Google Scholar] [CrossRef]
  5. Ferguson, A.R.; Huang, H. Genetic resources of kiwifruit: Domestication and breeding. Hortic. Rev. 2007, 33, 1–121. [Google Scholar]
  6. Huang, H.; Ferguson, A.R. Review: Kiwifruit in China. N. Z. J. Crop Hortic. Sci. 2001, 29, 1–14. [Google Scholar] [CrossRef]
  7. Dunn, S.T. A revision of the genus Actinidia, Lindl. Bot. J. Linn. Soc. 1911, 39, 394–410. [Google Scholar] [CrossRef]
  8. Li, H.L. A taxonomic review of the genus Actinidia. J. Arnold Arbor. 1952, 33, 1–61. [Google Scholar] [CrossRef]
  9. Cipriani, G.; Testolin, R.; Gardner, R. Restriction-site variation of PCR-amplified chloroplast DNA regions and its implication for the evolution and taxonomy of Actinidia. Theor. Appl. Genet. 1998, 96, 389–396. [Google Scholar] [CrossRef]
  10. Chat, J.; Jáuregui, B.; Petit, R.J.; Nadot, S. Reticulate evolution in kiwifruit (Actinidia, Actinidiaceae) identified by comparing their maternal and paternal phylogenies. Am. J. Bot. 2004, 91, 736–747. [Google Scholar] [CrossRef]
  11. Yao, X.H.; Wang, S.B.; Wang, Z.P.; Li, D.W.; Jiang, Q.; Zhang, Q.; Zhong, C.H.; Huang, H.W.; Liu, Y.F. The genome sequencing and comparative analysis of a wild kiwifruit Actinidia eriantha. Mol. Hortic. 2022, 2, 13. [Google Scholar] [CrossRef] [PubMed]
  12. Qi, X.Q.; Xie, X.D.; Yang, M.J.; Atak, A.; Zhong, C.H.; Dawei, L. Characterization of the complete chloroplast genome of Actinidia hemsleyana. Mitochondrial DNA Part B 2021, 6, 3259–3260. [Google Scholar]
  13. Liu, H.; Liu, X.; Sun, C.; Li, H.L.; Li, Z.X.; Guo, Y.; Fu, X.Q.; Liao, Q.H.; Zhang, W.L.; Liu, Y.Q. Chloroplast genome comparison and phylogenetic analysis of the commercial variety Actinidia chinensis ‘Hongyang’. Genes 2023, 14, 2136. [Google Scholar] [CrossRef]
  14. Lin, Q.H.; Hu, S.Q.; Wu, Z.H.; Huang, Y.H.; Wang, S.; Shi, W.B.; Zhu, B.Y. Comparative chloroplast genomics provides insights into the phylogenetic relationships and evolutionary history for Actinidia species. Sci. Rep. 2025, 15, 13291. [Google Scholar] [CrossRef]
  15. Wang, L.C.; Liu, B.; Yang, Y.R.; Zhuang, Q.G.; Chen, S.J.; Liu, Y.S.; Huang, S.X. The comparative studies of complete chloroplast genomes in Actinidia (Actinidiaceae): Novel insights into heterogenous variation, clpP gene annotation and phylogenetic relationships. Mol. Genet. Genom. 2022, 297, 535–551. [Google Scholar] [CrossRef]
  16. Liu, X.; Sun, C.; Li, M.Z.; Liu, J.; Zhang, W.L.; Liu, R.; Liu, Y.Q.; Le, Y.Z.; Lan, J.B. The complete chloroplast genome sequence of Actinidia chinensis Planch.‘Hongyang’, a typical red core pulp in China. Mitochondrial DNA Part B 2022, 7, 593–595. [Google Scholar] [CrossRef]
  17. Azarin, K.; Usatov, A.; Makarenko, M.; Kozel, N.; Kovalevich, A.; Dremuk, I.; Yemelyanova, A.; Logacheva, M.; Fedorenko, A.; Averina, N. A point mutation in the photosystem I P700 chlorophyll a apoprotein A1 gene confers variegation in Helianthus annuus L. Plant Mol. Biol. 2020, 103, 373–389. [Google Scholar] [CrossRef]
  18. Wicke, S.; Schneeweiss, G.M.; Depamphilis, C.W.; Müller, K.F.; Quandt, D. The evolution of the plastid chromosome in land plants: Gene content, gene order, gene function. Plant Mol. Biol. 2011, 76, 273–297. [Google Scholar] [CrossRef]
  19. Yao, X.H.; Tang, P.; Li, Z.Z.; Li, D.W.; Liu, Y.F.; Huang, H.W. The first complete chloroplast genome sequences in Actinidiaceae: Genome structure and comparative analysis. Public Libr. Sci. ONE 2015, 10, e0129347. [Google Scholar] [CrossRef]
  20. Bock, R. Structure, function, and inheritance of plastid genomes. In Cell and Molecular Biology of Plastids; Springer: Berlin/Heidelberg, Germany, 2007; pp. 29–63. [Google Scholar]
  21. Weng, M.L.; Blazier, J.C.; Govindu, M.; Jansen, R.K. Reconstruction of the ancestral plastid genome in Geraniaceae reveals a correlation between genome rearrangements, repeats and nucleotide substitution rates. Mol. Biol. Evol. 2013, 31, 645–659. [Google Scholar] [CrossRef]
  22. Maréchal, A.; Brisson, N. Recombination and the maintenance of plant organelle genome stability. New Phytol. 2010, 186, 299–317. [Google Scholar] [CrossRef]
  23. Abdullah; Mehmood, F.; Shahzadi, I.; Ali, Z.; Islam, M.; Naeem, M.; Mirza, B.; Lockhart, P.J.; Ahmed, I.; Waheed, M.T. Correlations among oligonucleotide repeats, nucleotide substitutions, and insertion-deletion mutations in chloroplast genomes of plant family Malvaceae. J. Syst. Evol. 2021, 59, 388–402. [Google Scholar] [CrossRef]
  24. Lopes, A.d.S.; Pacheco, T.G.; Silva, O.N.d.; Vieira, L.d.N.; Guerra, M.P.; Mattar, E.P.L.; Baura, V.A.d.; Balsanelli, E.; Souza, E.M.d.; Pedrosa, F.d.O.; et al. Plastid genome evolution in Amazonian açaí palm (Euterpe oleracea Mart.) and Atlantic forest açaí palm (Euterpe edulis Mart.). Plant Mol. Biol. 2021, 105, 559–574. [Google Scholar] [CrossRef]
  25. Ahmed, I.; Biggs, P.J.; Matthews, P.J.; Collins, L.J.; Hendy, M.D.; Lockhart, P.J. Mutational dynamics of aroid chloroplast genomes. Genome Biol. Evol. 2012, 4, 1316–1323. [Google Scholar] [CrossRef] [PubMed]
  26. Yi, X.; Gao, L.; Wang, B.; Su, Y.J.; Wang, T. The complete chloroplast genome sequence of Cephalotaxus oliveri (Cephalotaxaceae): Evolutionary comparison of Cephalotaxus chloroplast DNAs and insights into the loss of inverted repeat copies in gymnosperms. Genome Biol. Evol. 2013, 5, 688–698. [Google Scholar] [CrossRef] [PubMed]
  27. Yang, A.H.; Zhang, J.J.; Tian, H.; Yao, X.H. Characterization of 39 novel EST-SSR markers for Liriodendron tulipifera and cross-species amplification in L. chinense (Magnoliaceae). Am. J. Bot. 2012, 99, e460–e464. [Google Scholar] [CrossRef]
  28. Li, B.; Lin, F.R.; Huang, P.; Guo, W.Y.; Zheng, Y. Development of nuclear SSR and chloroplast genome markers in diverse Liriodendron chinense germplasm based on low-coverage whole genome sequencing. Biol. Res. 2020, 53, 21. [Google Scholar] [CrossRef]
  29. Flickinger, R. Polymorphism of simple sequence repeats may quantitatively regulate gene transcription. Exp. Cell Res. 2020, 390, 111969. [Google Scholar] [CrossRef]
  30. Nie, X.J.; Lv, S.Z.; Zhang, Y.X.; Du, X.H.; Wang, L.; Biradar, S.S.; Tan, X.F.; Wan, F.H.; Song, W.N. Complete chloroplast genome sequence of a major invasive species, crofton weed (Ageratina adenophora). Public Libr. Sci. ONE 2012, 7, e36869. [Google Scholar] [CrossRef]
  31. Wolfson, R.; Higgins, K.G.; Sears, B.B. Evidence for replication slippage in the evolution of Oenothera chloroplast DNA. Mol. Biol. Evol. 1991, 8, 709–720. [Google Scholar]
  32. Brázda, V.; Lýsek, J.; Bartas, M.; Fojta, M. Complex analyses of short inverted repeats in all sequenced chloroplast DNAs. BioMed Res. Int. 2018, 2018, 1097018. [Google Scholar] [CrossRef]
  33. Korkovelos, A.E.; Mavromatis, A.G.; Huang, W.G.; Hagidimitriou, M.; Giakoundis, A.; Goulas, C.K. Effectiveness of SSR molecular markers in evaluating the phylogenetic relationships among eight Actinidia species. Sci. Hortic. 2008, 116, 305–310. [Google Scholar] [CrossRef]
  34. Huang, H.; Shi, C.; Liu, Y.; Mao, S.Y.; Gao, L.Z. Thirteen Camellia chloroplast genome sequences determined by high-throughput sequencing: Genome structure and phylogenetic relationships. BMC Evol. Biol. 2014, 14, 4302–4315. [Google Scholar] [CrossRef] [PubMed]
  35. Zhang, Y.J.; Ma, P.F.; Li, D.Z. High-throughput sequencing of six bamboo chloroplast genomes: Phylogenetic implications for temperate woody bamboos (poaceae: Bambusoideae). Public Libr. Sci. ONE 2011, 6, e20596. [Google Scholar] [CrossRef]
  36. Dugas, D.V.; Hernandez, D.; Koenen, E.J.; Schwarz, E.; Straub, S.; Hughes, C.E.; Jansen, R.K.; Nageswara-Rao, M.; Staats, M. Mimosoid legume plastome evolution: IR expansion, tandem repeat expansions, and accelerated rate of evolution in clpP. Sci. Rep. 2015, 5, 16958. [Google Scholar] [CrossRef]
  37. Oldenburg, D.J.; Bendich, A.J. Most chloroplast DNA of maize seedlings in linear molecules with defined ends and branched forms. J. Mol. Biol. 2004, 335, 953–970. [Google Scholar] [CrossRef]
  38. Lu, R.S.; Li, P.; Qiu, Y.X. The complete chloroplast genomes of three Cardiocrinum (Liliaceae) species: Comparative genomic and phylogenetic analyses. Front. Plant Sci. 2017, 7, 2054. [Google Scholar] [CrossRef]
  39. Wang, N.; Chen, S.F.; Xie, L.; Wang, L.; Feng, Y.Y.; Lv, T.; Fang, Y.M.; Ding, H. The complete chloroplast genomes of three Hamamelidaceae species: Comparative and phylogenetic analyses. Ecol. Evol. 2022, 12, e8637. [Google Scholar] [CrossRef]
  40. Zhao, X.Q.; Yan, M.; Ding, Y.; Huo, Y.; Yuan, Z.H. Characterization and comparative analysis of the complete chloroplast genome sequence from Prunus avium ‘Summit’. Plant Biol. 2019, 7, e8210. [Google Scholar] [CrossRef]
  41. Qian, J.; Song, J.Y.; Gao, H.H.; Zhu, Y.J.; Xu, J.; Pang, X.H.; Yao, H.; Sun, C.; Li, X.E.; Li, C.Y.; et al. The complete chloroplast genome sequence of the medicinal plant Salvia miltiorrhiza. Public Libr. Sci. ONE 2013, 8, e57607. [Google Scholar] [CrossRef]
  42. Ghulam, M.M.; Zghidi-Abouzid, O.; Lambert, E.; Lerbs-Mache, S.; Merendino, L. Transcriptional organization of the large and the small ATP synthase operons, atpI/H/F/A and atpB/E, in Arabidopsis thaliana chloroplasts. Plant Mol. Biol. 2012, 79, 259–272. [Google Scholar] [CrossRef] [PubMed]
  43. Mao, J.; Chi, W.; Ouyang, M.; He, B.Y.; Chen, F.; Zhang, L.X. PAB is an assembly chaperone that functions downstream of chaperonin 60 in the assembly of chloroplast ATP synthase coupling factor 1. Proc. Natl. Acad. Sci. USA 2015, 112, 4152–4157. [Google Scholar] [CrossRef]
  44. Tiller, N.; Bock, R. The translational apparatus of plastids and its role in plant development. Mol. Plant 2014, 7, 1105–1120. [Google Scholar] [CrossRef]
  45. Rosado, A.; Li, R.; van de Ven, W.; Hsu, E.; Raikhel, N.V. Arabidopsis ribosomal proteins control developmental programs through translational regulation of auxin response factors. Proc. Natl. Acad. Sci. USA 2012, 109, 19537–19544. [Google Scholar] [CrossRef]
  46. Allahverdiyeva, Y.; Mamedov, F.; Mäenpää, P.; Vass, I.; Aro, E.M. Modulation of photosynthetic electron transport in the absence of terminal electron acceptors: Characterization of the rbcL deletion mutant of tobacco. Biochim. Biophys. Acta (BBA) Bioenerg. 2005, 1709, 69–83. [Google Scholar] [CrossRef] [PubMed]
  47. Kapralov, M.V.; Filatov, D.A. Widespread positive selection in the photosynthetic Rubisco enzyme. BMC Evol. Biol. 2007, 7, 73–82. [Google Scholar] [CrossRef]
  48. Piot, A.; Hackel, J.; Christin, P.A.; Besnard, G. One-third of the plastid genes evolved under positive selection in PACMAD grasses. Planta 2018, 247, 255–266. [Google Scholar] [CrossRef]
  49. Drescher, A.; Ruf, S.; Calsa, T.J.; Carrer, H.; Bock, R. The two largest chloroplast genome-encoded open reading frames of higher plants are essential genes. Plant J. 2000, 22, 97–104. [Google Scholar] [CrossRef] [PubMed]
  50. Huang, J.L.; Sun, G.L.; Zhang, D.M. Molecular evolution and phylogeny of the angiosperm ycf2 gene. J. Mol. Biol. 2010, 48, 240–248. [Google Scholar] [CrossRef]
  51. Golding, G.B.; Dean, A.M. The structural basis of molecular adaptation. Mol. Biol. Evol. 1998, 15, 355–369. [Google Scholar] [CrossRef]
  52. Abdullah; Henriquez, C.L.; Mehmood, F.; Carlsen, M.M.; Islam, M.; Waheed, M.T.; Pocza, P.; Croat, T.B.; Ahmed, I. Complete chloroplast genomes of Anthurium huixtlense and Pothos scandens (Pothoideae, Araceae): Unique inverted repeat expansion and contraction affect rate of evolution. J. Mol. Evol. 2020, 88, 562–574. [Google Scholar] [CrossRef] [PubMed]
  53. Kosakovsky Pond, S.L.; Poon, A.F.; Velazquez, R.; Weaver, S.; Hepler, N.L.; Murrell, B.; Shank, S.D.; Rife, M.B.; Dave, B.; Anto, N.; et al. HyPhy 2.5—A customizable platform for evolutionary hypothesis testing using phylogenies. Mol. Biol. Evol. 2020, 37, 295–299. [Google Scholar] [CrossRef] [PubMed]
  54. Yao, X.H.; Liu, L.; Yan, M.K.; Li, D.W.; Zhong, C.H.; Huang, H.W. Exon primed intron-crossing (EPIC) markers reveal natural hybridization and introgression in Actinidia (Actinidiaceae) with sympatric distribution. Syst. Ecol. 2015, 59, 246–255. [Google Scholar] [CrossRef]
  55. He, Z.C.; Zhang, X.Y.; Zhong, Y.; Ye, L. Phylogenetic relationships of Actinidia and related genera based on micromorphological characters of foliar trichomes. Genet. Resour. Crop Evol. 2000, 47, 12. [Google Scholar] [CrossRef]
  56. Li, J.Q.; Huang, H.W.; Sang, T. Molecular phylogeny and infrageneric classification of Actinidia (Actinidiaceae). Syst. Bot. 2002, 27, 408–415. [Google Scholar]
  57. Testolin, R.; Ferguson, A.R. Isozyme polymorphism in the genus Actinidia and the origin of the kiwifruit genome. Syst. Bot. 1997, 22, 685–700. [Google Scholar] [CrossRef]
  58. Li, J.L.; Wang, S.; Yu, J.; Wang, L.; Zhou, S.L. A modified CTAB protocol for plant DNA extraction. Chin. Bull. Bot. 2013, 48, 72–78. [Google Scholar]
  59. Patel, R.K.; Jain, M. NGS QC Toolkit: A toolkit for quality control of next generation sequencing data. Public Libr. Sci. 2012, 7, e30619. [Google Scholar] [CrossRef]
  60. Langmead, B.; Salzberg, S.L. Fast gapped-read alignment with Bowtie 2. Nat. Methods 2012, 9, 357–359. [Google Scholar] [CrossRef]
  61. Shi, L.C.; Chen, H.M.; Jiang, M.; Wang, L.Q.; Wu, X.; Huang, L.F.; Liu, C. CPGAVAS2, an integrated plastome sequence annotator and analyzer. Nucleic Acids Res. 2019, 47, W65–W73. [Google Scholar]
  62. Kearse, M.; Moir, R.; Wilson, A.; Stones-Havas, S.; Cheung, M.; Sturrock, S.; Buxton, S.; Cooper, A.; Markowitz, S.; Duran, C.; et al. Geneious Basic: An integrated and extendable desktop software platform for the organization and analysis of sequence data. Bioinformatics 2012, 28, 1647–1649. [Google Scholar] [CrossRef]
  63. Alikhan, N.F.; Petty, N.K.; Ben Zakour, N.L.; Beatson, S.A. BLAST Ring Image Generator (BRIG): Simple prokaryote genome comparisons. BMC Genom. 2011, 12, 402. [Google Scholar] [CrossRef] [PubMed]
  64. Kurtz, S.; Choudhuri, J.V.; Ohlebusch, E.; Schleiermacher, C.; Stoye, J.; Giegerich, R. REPuter: The manifold applications of repeat analysis on a genomic scale. Nucleic Acids Res. 2001, 29, 4633–4642. [Google Scholar] [CrossRef]
  65. Benson, G. Tandem repeats finder: A program to analyze DNA sequences. Nucleic Acids Res. 1999, 27, 573–580. [Google Scholar] [CrossRef] [PubMed]
  66. Thiel, T.; Michalek, W.; Varshney, R.K.; Graner, A. Exploiting EST databases for the development and characterization of gene-derived SSR-markers in barley (Hordeum vulgare L.). Theor. Appl. Genet. 2003, 106, 411–422. [Google Scholar] [CrossRef]
  67. Frazer, K.A.; Lior, P.; Alexander, P.; Rubin, E.M.; Inna, D. Vista: Computational tools for comparative genomics. Nucleic Acids Res. 2004, 32, W273–W279. [Google Scholar] [CrossRef]
  68. Amiryousefi, A.; Hyvönen, J.; Poczai, P. Irscope: An online program to visualize the junction sites of chloroplast genomes. Bioinformatics 2018, 34, 3030–3031. [Google Scholar] [CrossRef] [PubMed]
  69. Yang, Z.; Nielsen, R. Codon-substitution models for detecting molecular adaptation at individual sites along specific lineages. Mol. Biol. Evol. 2002, 19, 908–917. [Google Scholar] [CrossRef]
  70. Yang, Z.; Wong, W.S.W.; Nielsen, R. Bayes empirical Bayes inference of amino acid sites under positive selection. Mol. Biol. Evol. 2005, 22, 1107–1118. [Google Scholar] [CrossRef]
  71. Hiratsuka, J.; Shimada, H.; Whittier, R.; Ishibashi, T.; Sakamoto, M.; Mori, M.; Kondo, C.; Honji, Y.; Sun, C.R.; Meng, B.Y.; et al. The complete sequence of the rice (Oryza sativa) chloroplast genome: Intermolecular recombination between distinct tRNA genes accounts for a major plastid DNA inversion during the evolution of the cereals. Mol. Gen. Genet. 1989, 217, 185–194. [Google Scholar] [CrossRef] [PubMed]
  72. Shahid Masood, M.; Nishikawa, T.; Fukuoka, S.; Njenga, P.K.; Tsudzuki, T.; Kadowaki, K. The complete nucleotide sequence of wild rice (Oryza nivara) chloroplast genome: First genome wide comparative sequence analysis of wild and cultivated rice. Gene 2004, 340, 133–139. [Google Scholar] [CrossRef] [PubMed]
  73. Stamatakis, A. RAxML-VI-HPC: Maximum likelihood-based phylogenetic analyses with thousands of taxa and mixed models. Bioinformatics 2006, 22, 2688–2690. [Google Scholar] [CrossRef] [PubMed]
  74. Yang, Z. PAML 4: Phylogenetic analysis by maximum likelihood. Mol. Biol. Evol. 2007, 24, 1586–1591. [Google Scholar] [CrossRef] [PubMed]
  75. Katoh, K.; Standley, D.M. MAFFT multiple sequence alignment software version 7: Improvements in performance and usability. Mol. Biol. Evol. 2013, 30, 772–780. [Google Scholar] [CrossRef]
  76. Darriba, D.; Taboada, G.; Doallo, R.; Posada, D. jModelTest 2: More models, new heuristics and parallel computing. Nat. Methods 2012, 9, 772. [Google Scholar] [CrossRef]
  77. Ronquist, F.; Teslenko, M.; Van Der Mark, P.; Ayres, D.L.; Darling, A.; Höhna, S.; Larget, B.; Liu, L.; Suchard, M.A.; Huelsenbeck, J.P. Mrbayes 3.2: Efficient bayesian phylogenetic inference and model choice across a large model space. Syst. Biol. 2012, 61, 539–542. [Google Scholar] [CrossRef]
Figure 1. Comparison of chloroplast genomes of seven A. deliciosa varieties using BRIG. The sequence of Actinidia chinensis (NC_026690) is selected as reference, and the innermost ring shows GC content.
Ijms 26 04387 g001
Figure 2. Analysis of repeated sequences in seven A. deliciosa varieties' chloroplast genomes. (a) Bar graph indicating the numbers of four repeat types (palindromic repeats, tandem repeats, forward repeats, and reverse repeats) in each individual. (b) Pie chart revealing the proportion of different repeated sequence types in seven A. deliciosa chloroplast genomes.
Ijms 26 04387 g002
Figure 3. Analysis of simple sequence repeats (SSRs) in seven A. deliciosa varieties’ chloroplast genomes. (a) Bar graph indicating the number of different SSR types detected in each individual, including mononucleotide repeats (mono-), dinucleotide repeats (di-), trinucleotide repeats (tri), tetranucleotide reapts (tetra-), pentanucleotide repeats (penta), hexanucleotide repeats (hexa-), and polynucleotide repeats (poly-). (b) Pie chart revealing the proportion of different SSR types in seven A. deliciosa chloroplast genomes. (c) Pie chart revealing the frequency of SSRs in the intergenic spacer regions (IGS), protein-coding genes (CDS), and introns.
Ijms 26 04387 g003
Figure 4. Comparison of the borders of the LSC, SSC, and IR regions among A. deliciosa chloroplast genomes. For each variety, genes transcribed in positive strand are depicted on the top of their corresponding track from right to left, while the genes on the negative strand are depicted below from left to right. The numbers at arrows refer to the distance of the start or end position of a given gene from the corresponding junction site. The T bars above or below the genes indicate the extent of their parts, with their corresponding values in the base pairs. The plotted genes and distances in the vicinity of the junction sites are the scaled projection of the genome. JLB (IRb/LSC), JSB (IRb/SSC), JSA (SSC/IRa), and JLA (IRa/LSC) denote the junction sites between each corresponding two regions of the genome.
Ijms 26 04387 g004
Figure 5. Phylogenetic tree of the Actinidia species constructed via maximum likelihood (ML) and Bayesian inference (BI) by using whole-chloroplast genomes. The numbers to the left of the slashes on the branches represent the bootstrap values obtained from ML analysis with the GTR+G model for 1000 replications, while those to the right represent the posterior probabilities derived from BI with MCMC algorithm, with 1,000,000 generations, sampling every 1k, and 25% burn-in.
Ijms 26 04387 g005
Table 1. Summary of chloroplast genome characteristics of A. deliciosa varieties.
Genome FeaturesA. deliciosa
cv. Cuixiang
A. deliciosa
cv. XuXiang
A. deliciosa
cv. Hayward
A. deliciosa
cv. Nongda Mixiang
A. deliciosa
cv. Yate
A. deliciosa
cv. Nongke-1
A. deliciosa
cv. Ximi-59
Size (bp)156,477156,461156,404156,480156,495156,479156,467
LSC length (bp)88,04088,02787,96788,04388,05788,04588,030
SSC length (bp)20,33120,33220,33120,33120,33220,33220,331
IR length (bp)48,10648,10248,10648,10648,10648,10248,106
Coding regions (bp)76,94176,93976,39576,94176,94176,93979,941
Non-coding regions (bp)79,53679,52280,00979,53979,55479,54076,526
Number of genes131131131131131131131
Protein-coding genes83838383838383
tRNA genes40404040404040
rRNA genes8888888
GC content (%)37.2037.2037.2037.2037.2037.2037.20
GC content of LSC (%)35.5035.5035.5035.5035.5035.5035.50
GC content of SSC (%)31.1031.1031.1031.1031.1031.1031.10
GC content of IR (%)42.9042.9042.9042.9042.9042.9042.90
Disclaimer/Publisher’s Note: The statements, opinions and data contained in all publications are solely those of the individual author(s) and contributor(s) and not of MDPI and/or the editor(s). MDPI and/or the editor(s) disclaim responsibility for any injury to people or property resulting from any ideas, methods, instructions or products referred to in the content.

