
Analysis of the Expression and Activity of Cyclooxygenases COX-1 and COX-2 in THP-1 Monocytes and Macrophages Cultured with Xenogenic Collagen Matrices Biofunctionalized with the Injectable Platelet-Rich Fibrin

 , ,
, , 
 , ,
, ,  and
and
Abstract
1. Introduction
2. Results
2.1. Collagen Matrices Induced Activation of THP-1 Monocytes
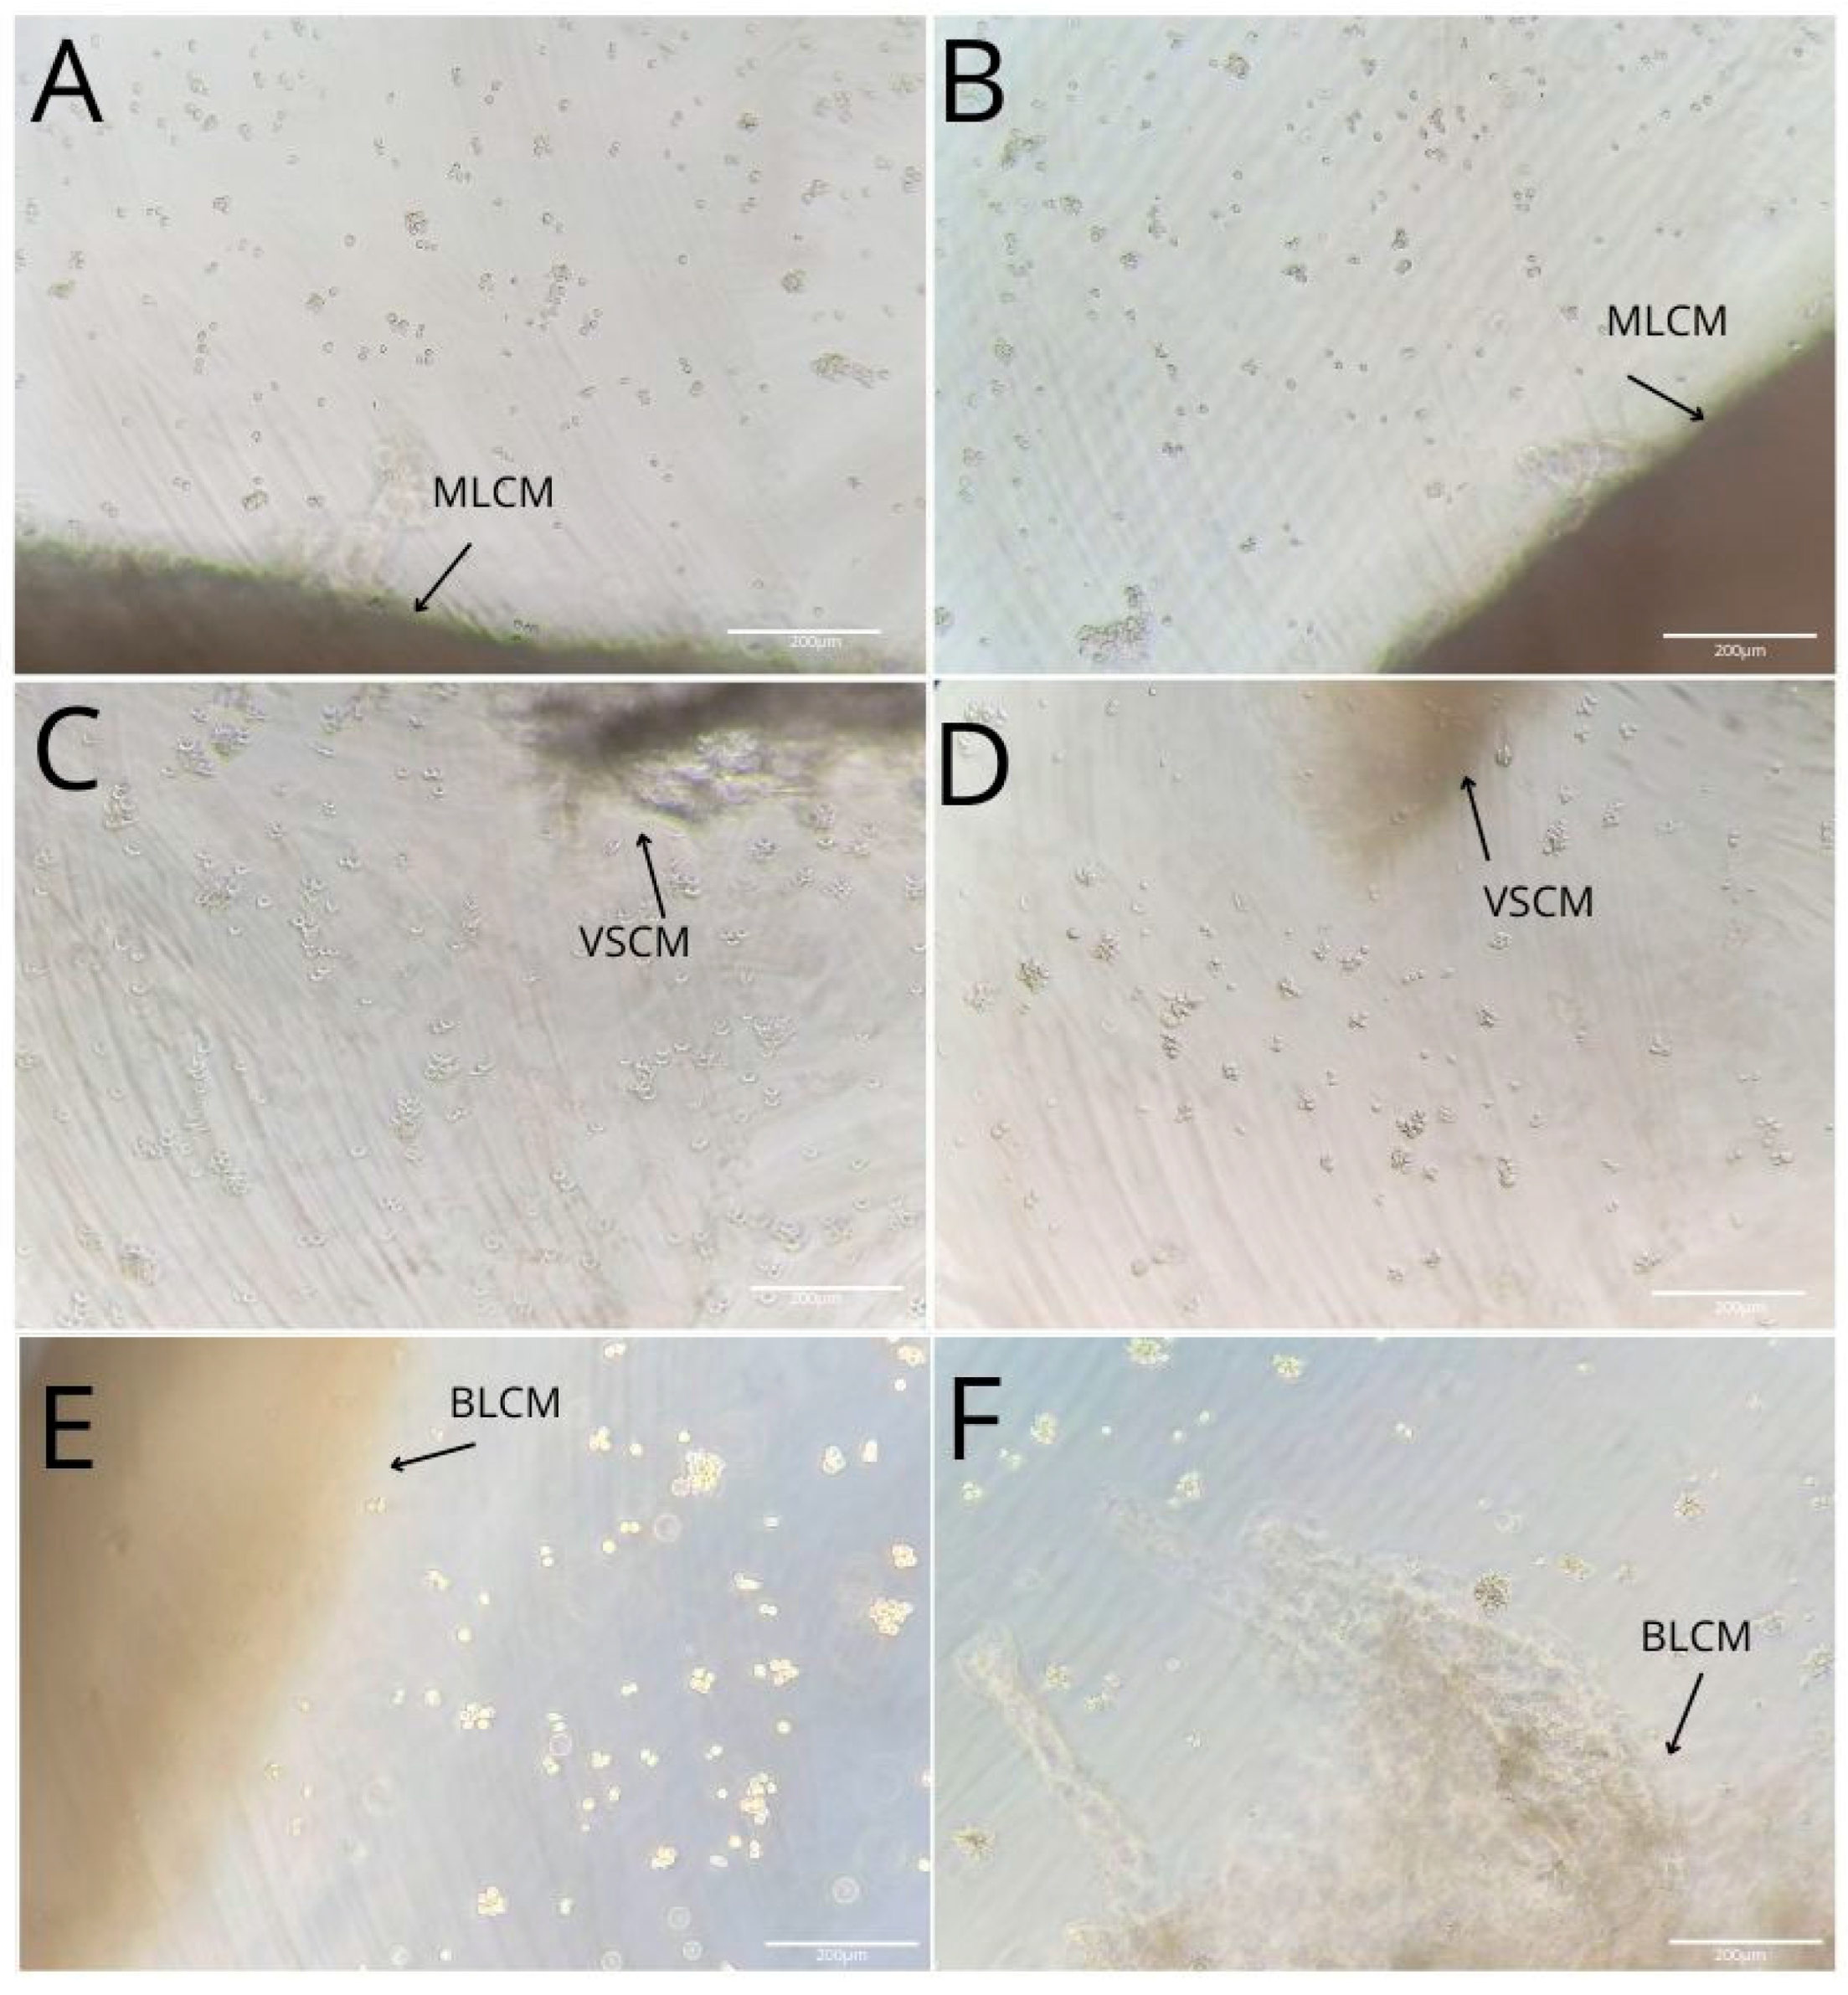
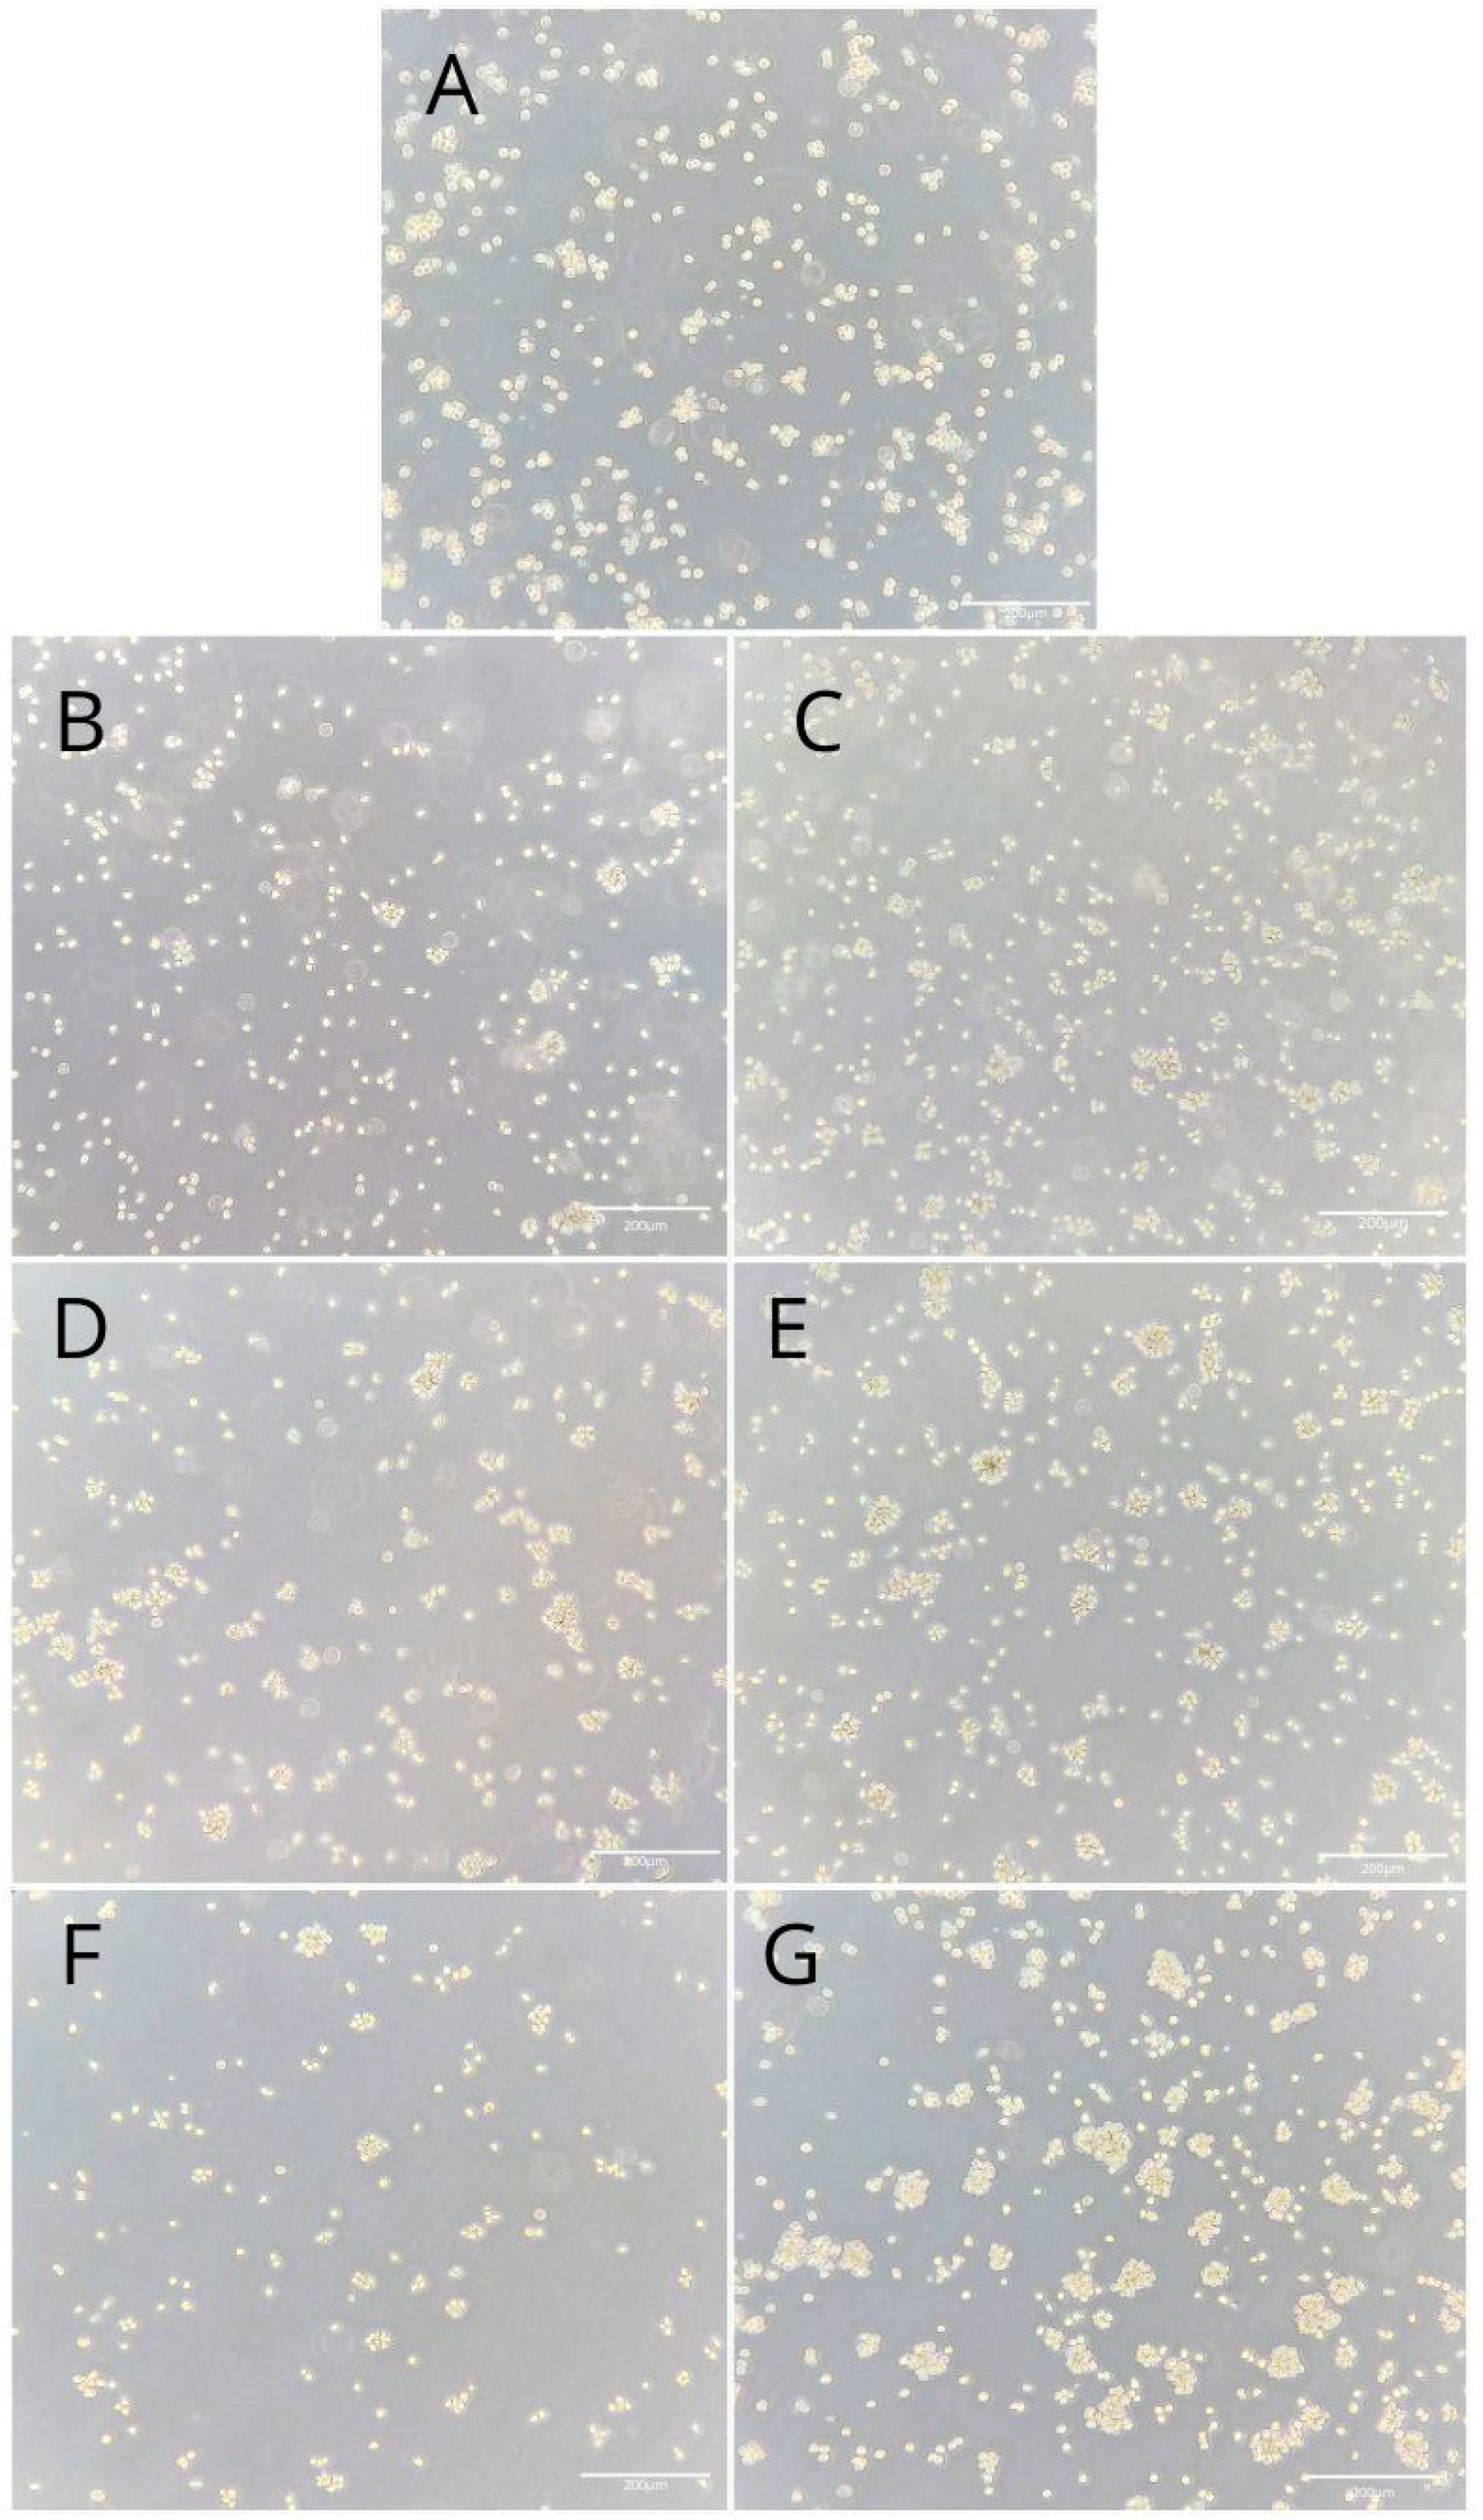
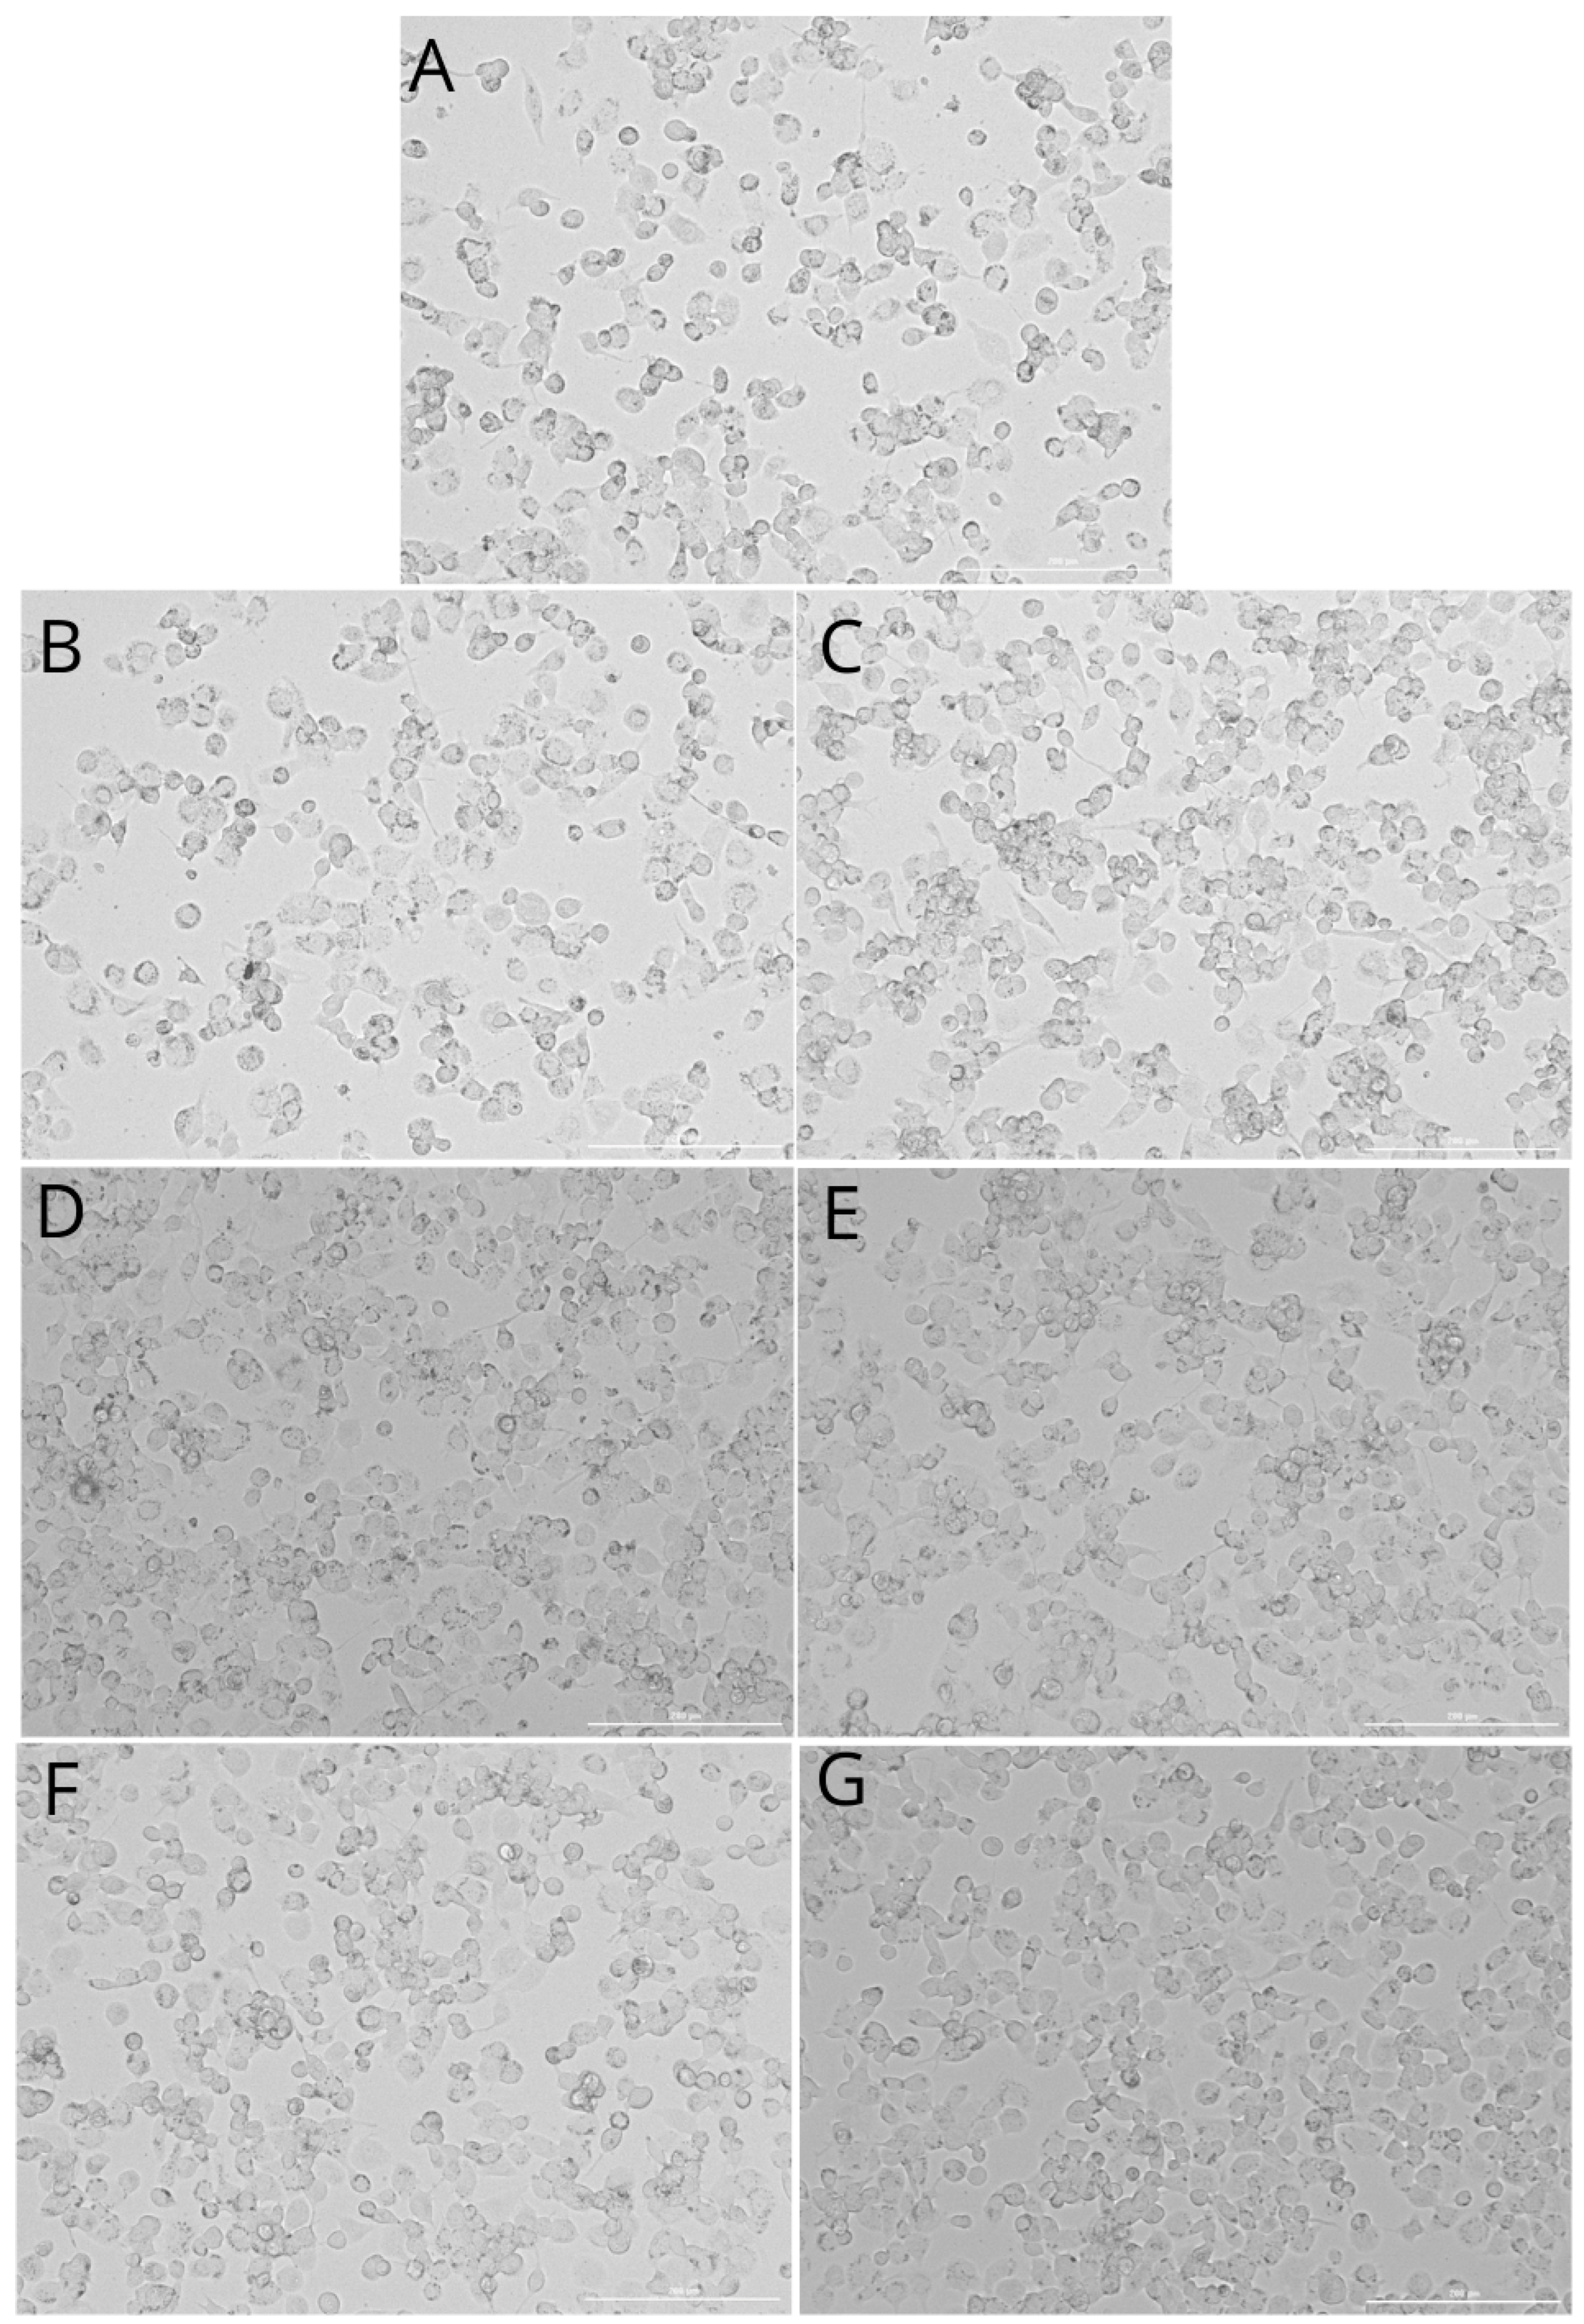
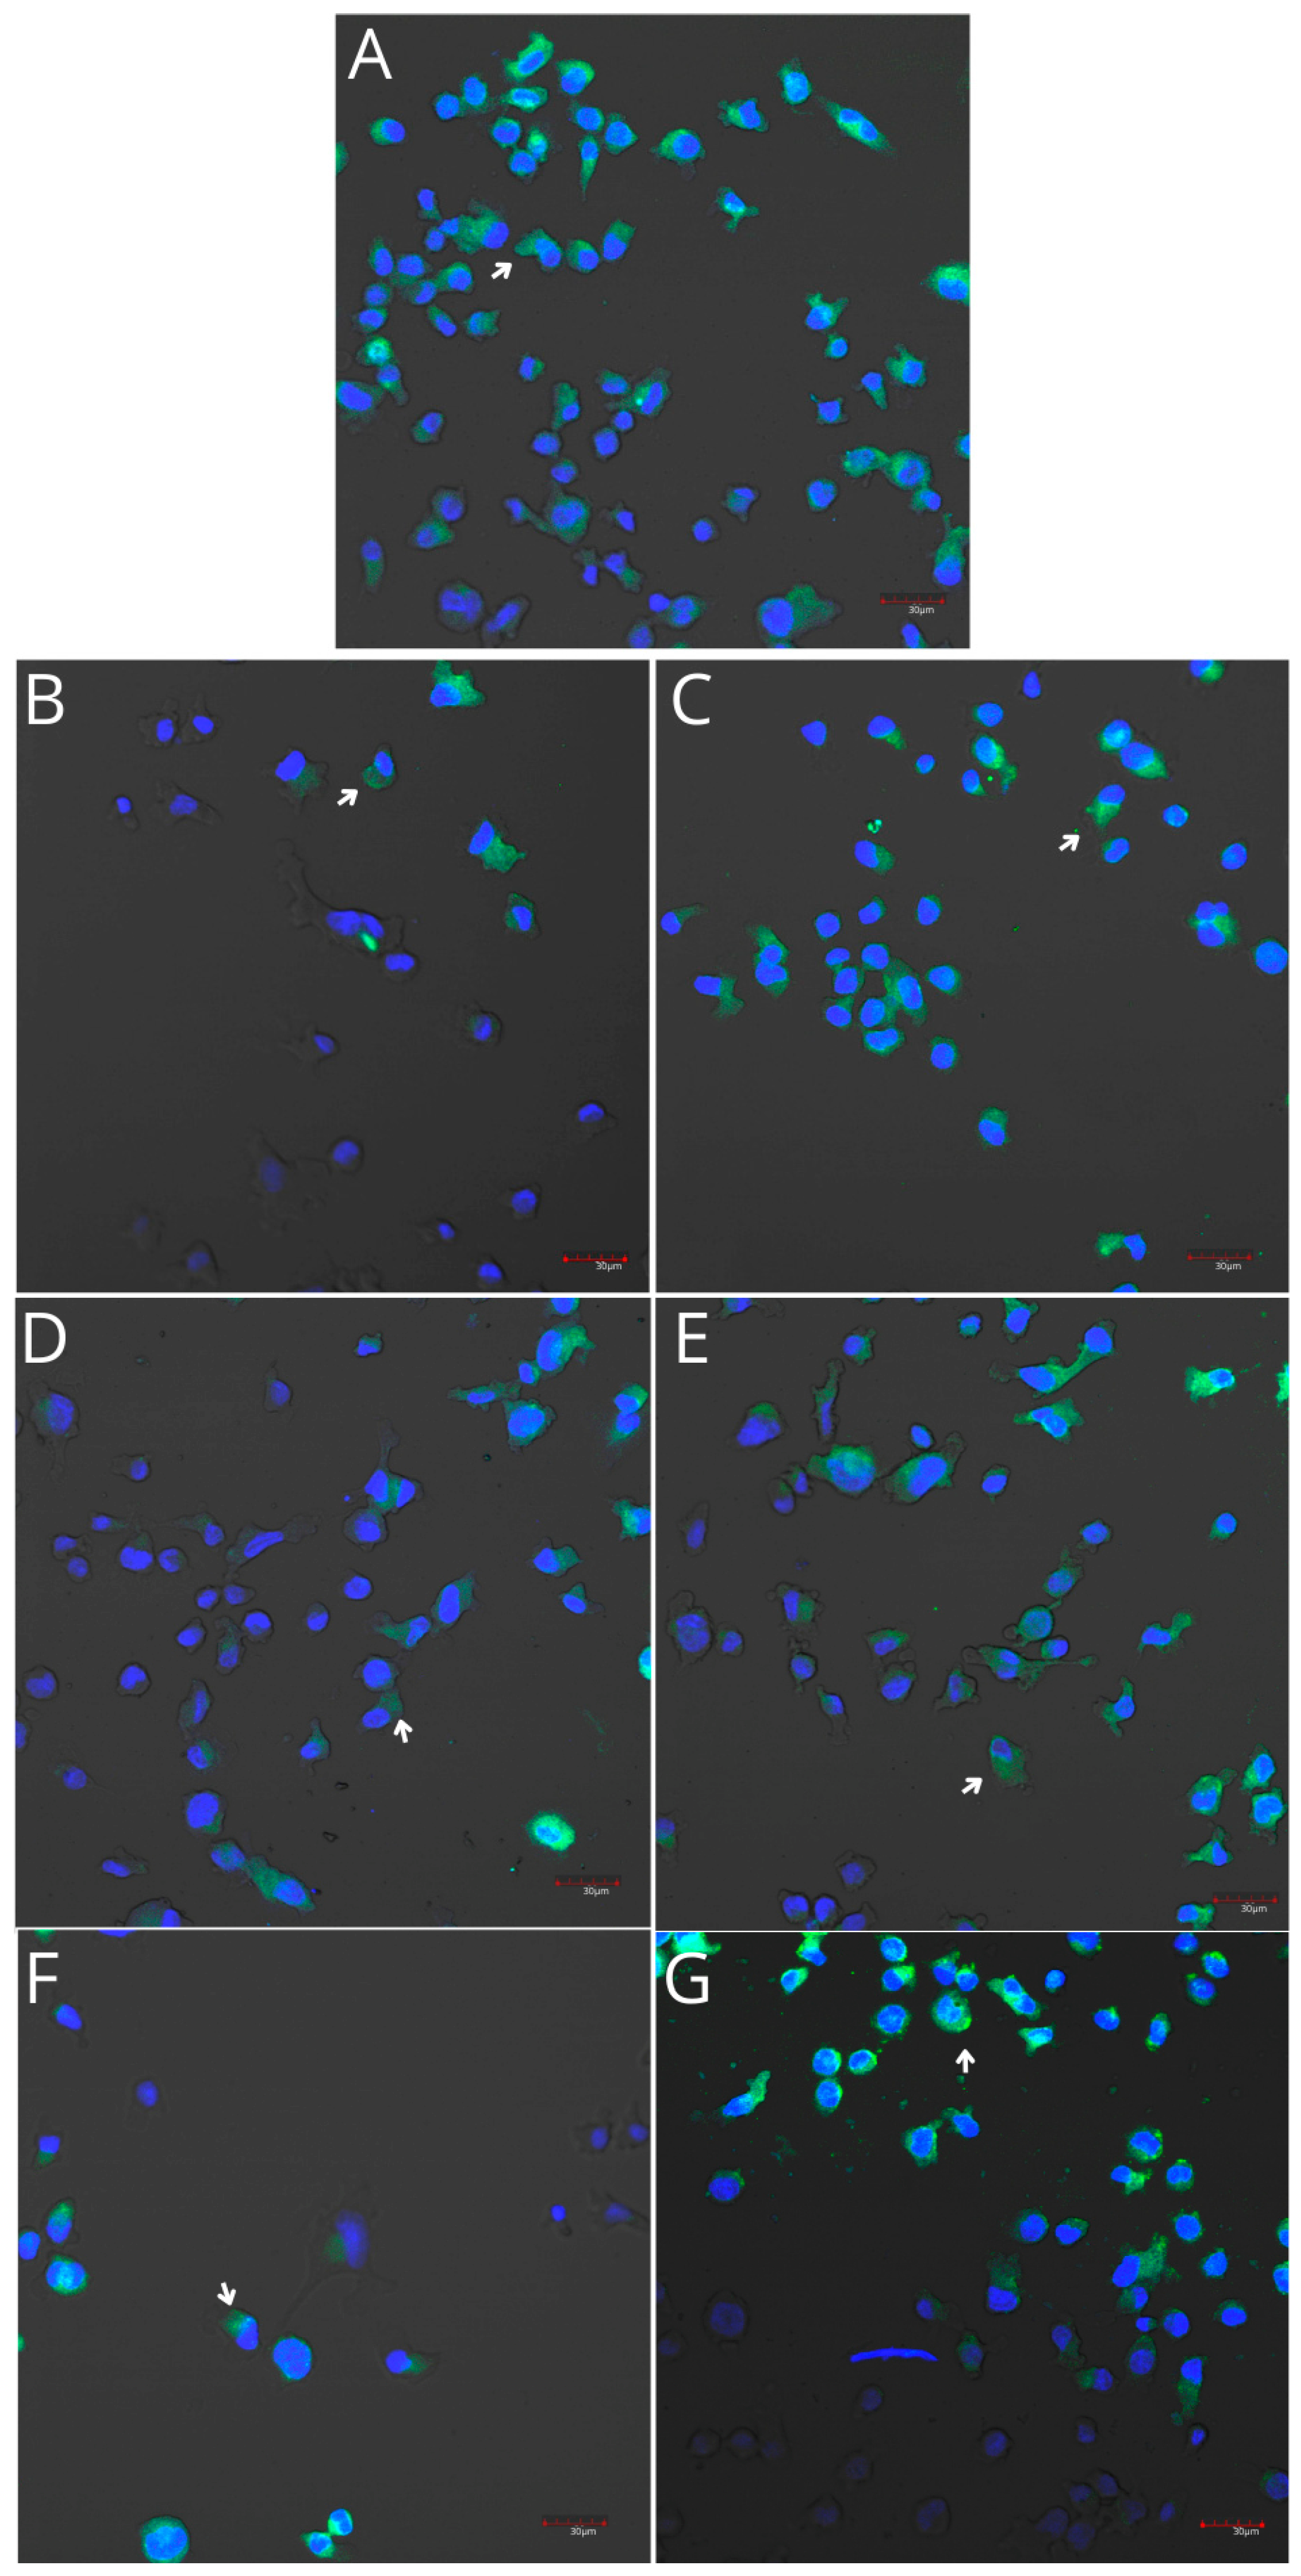
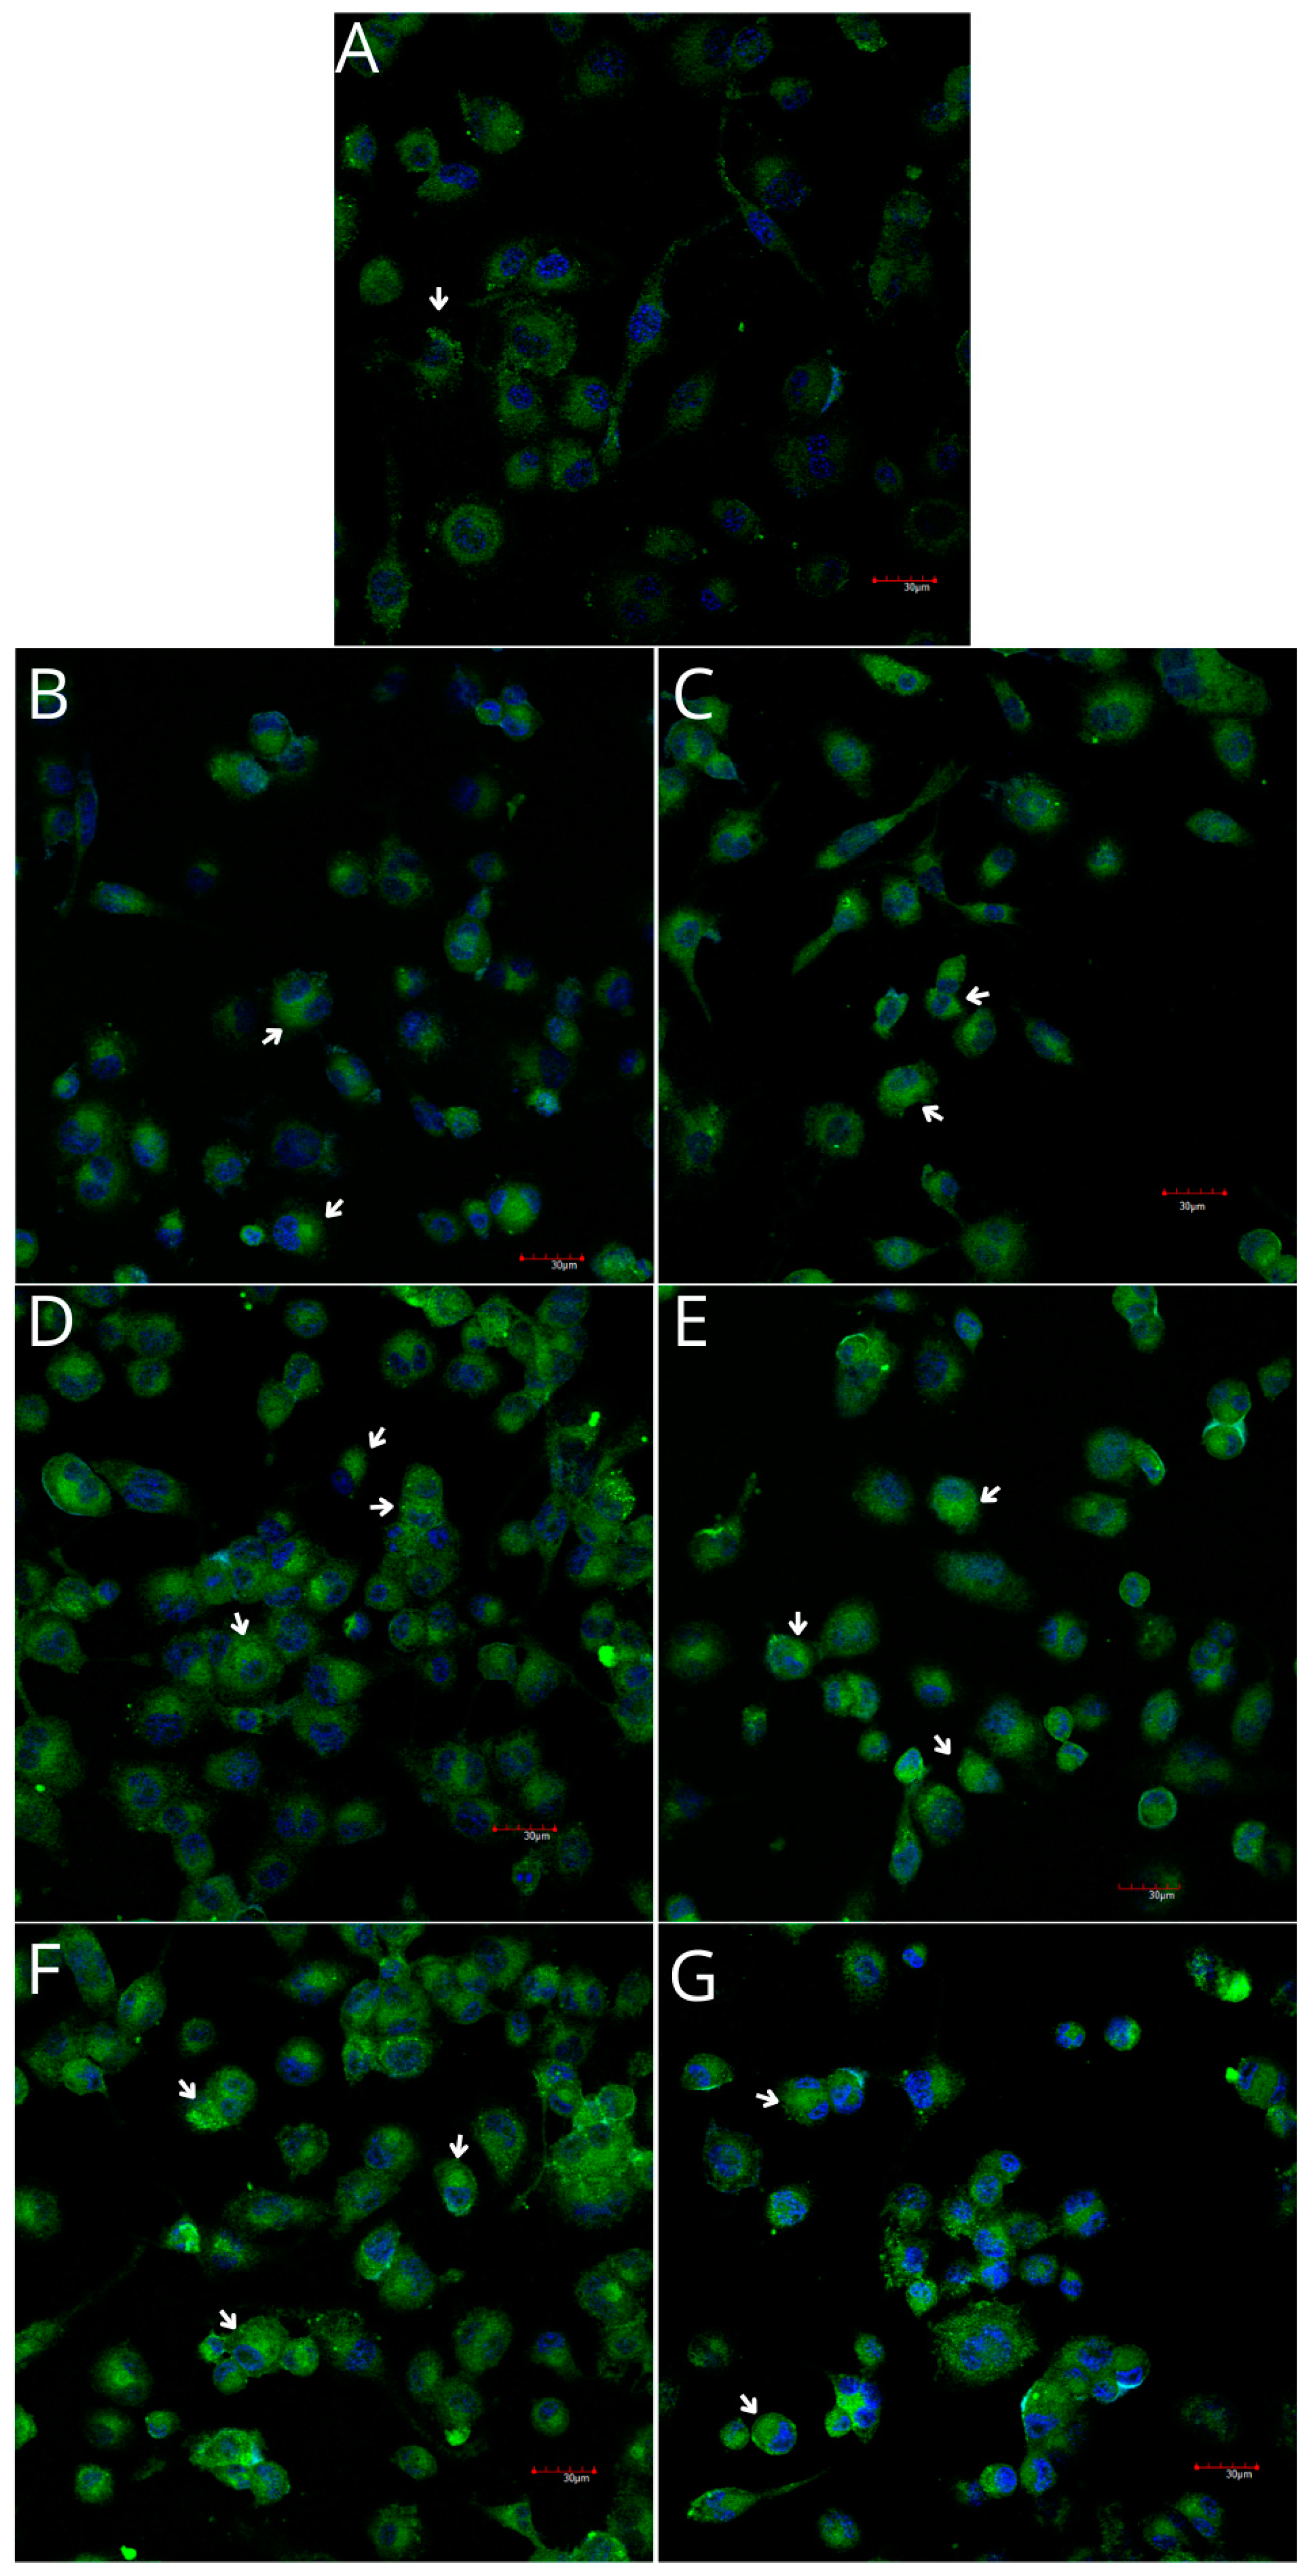
2.2. THP-1 Monocyte and Macrophage Culture Visualization
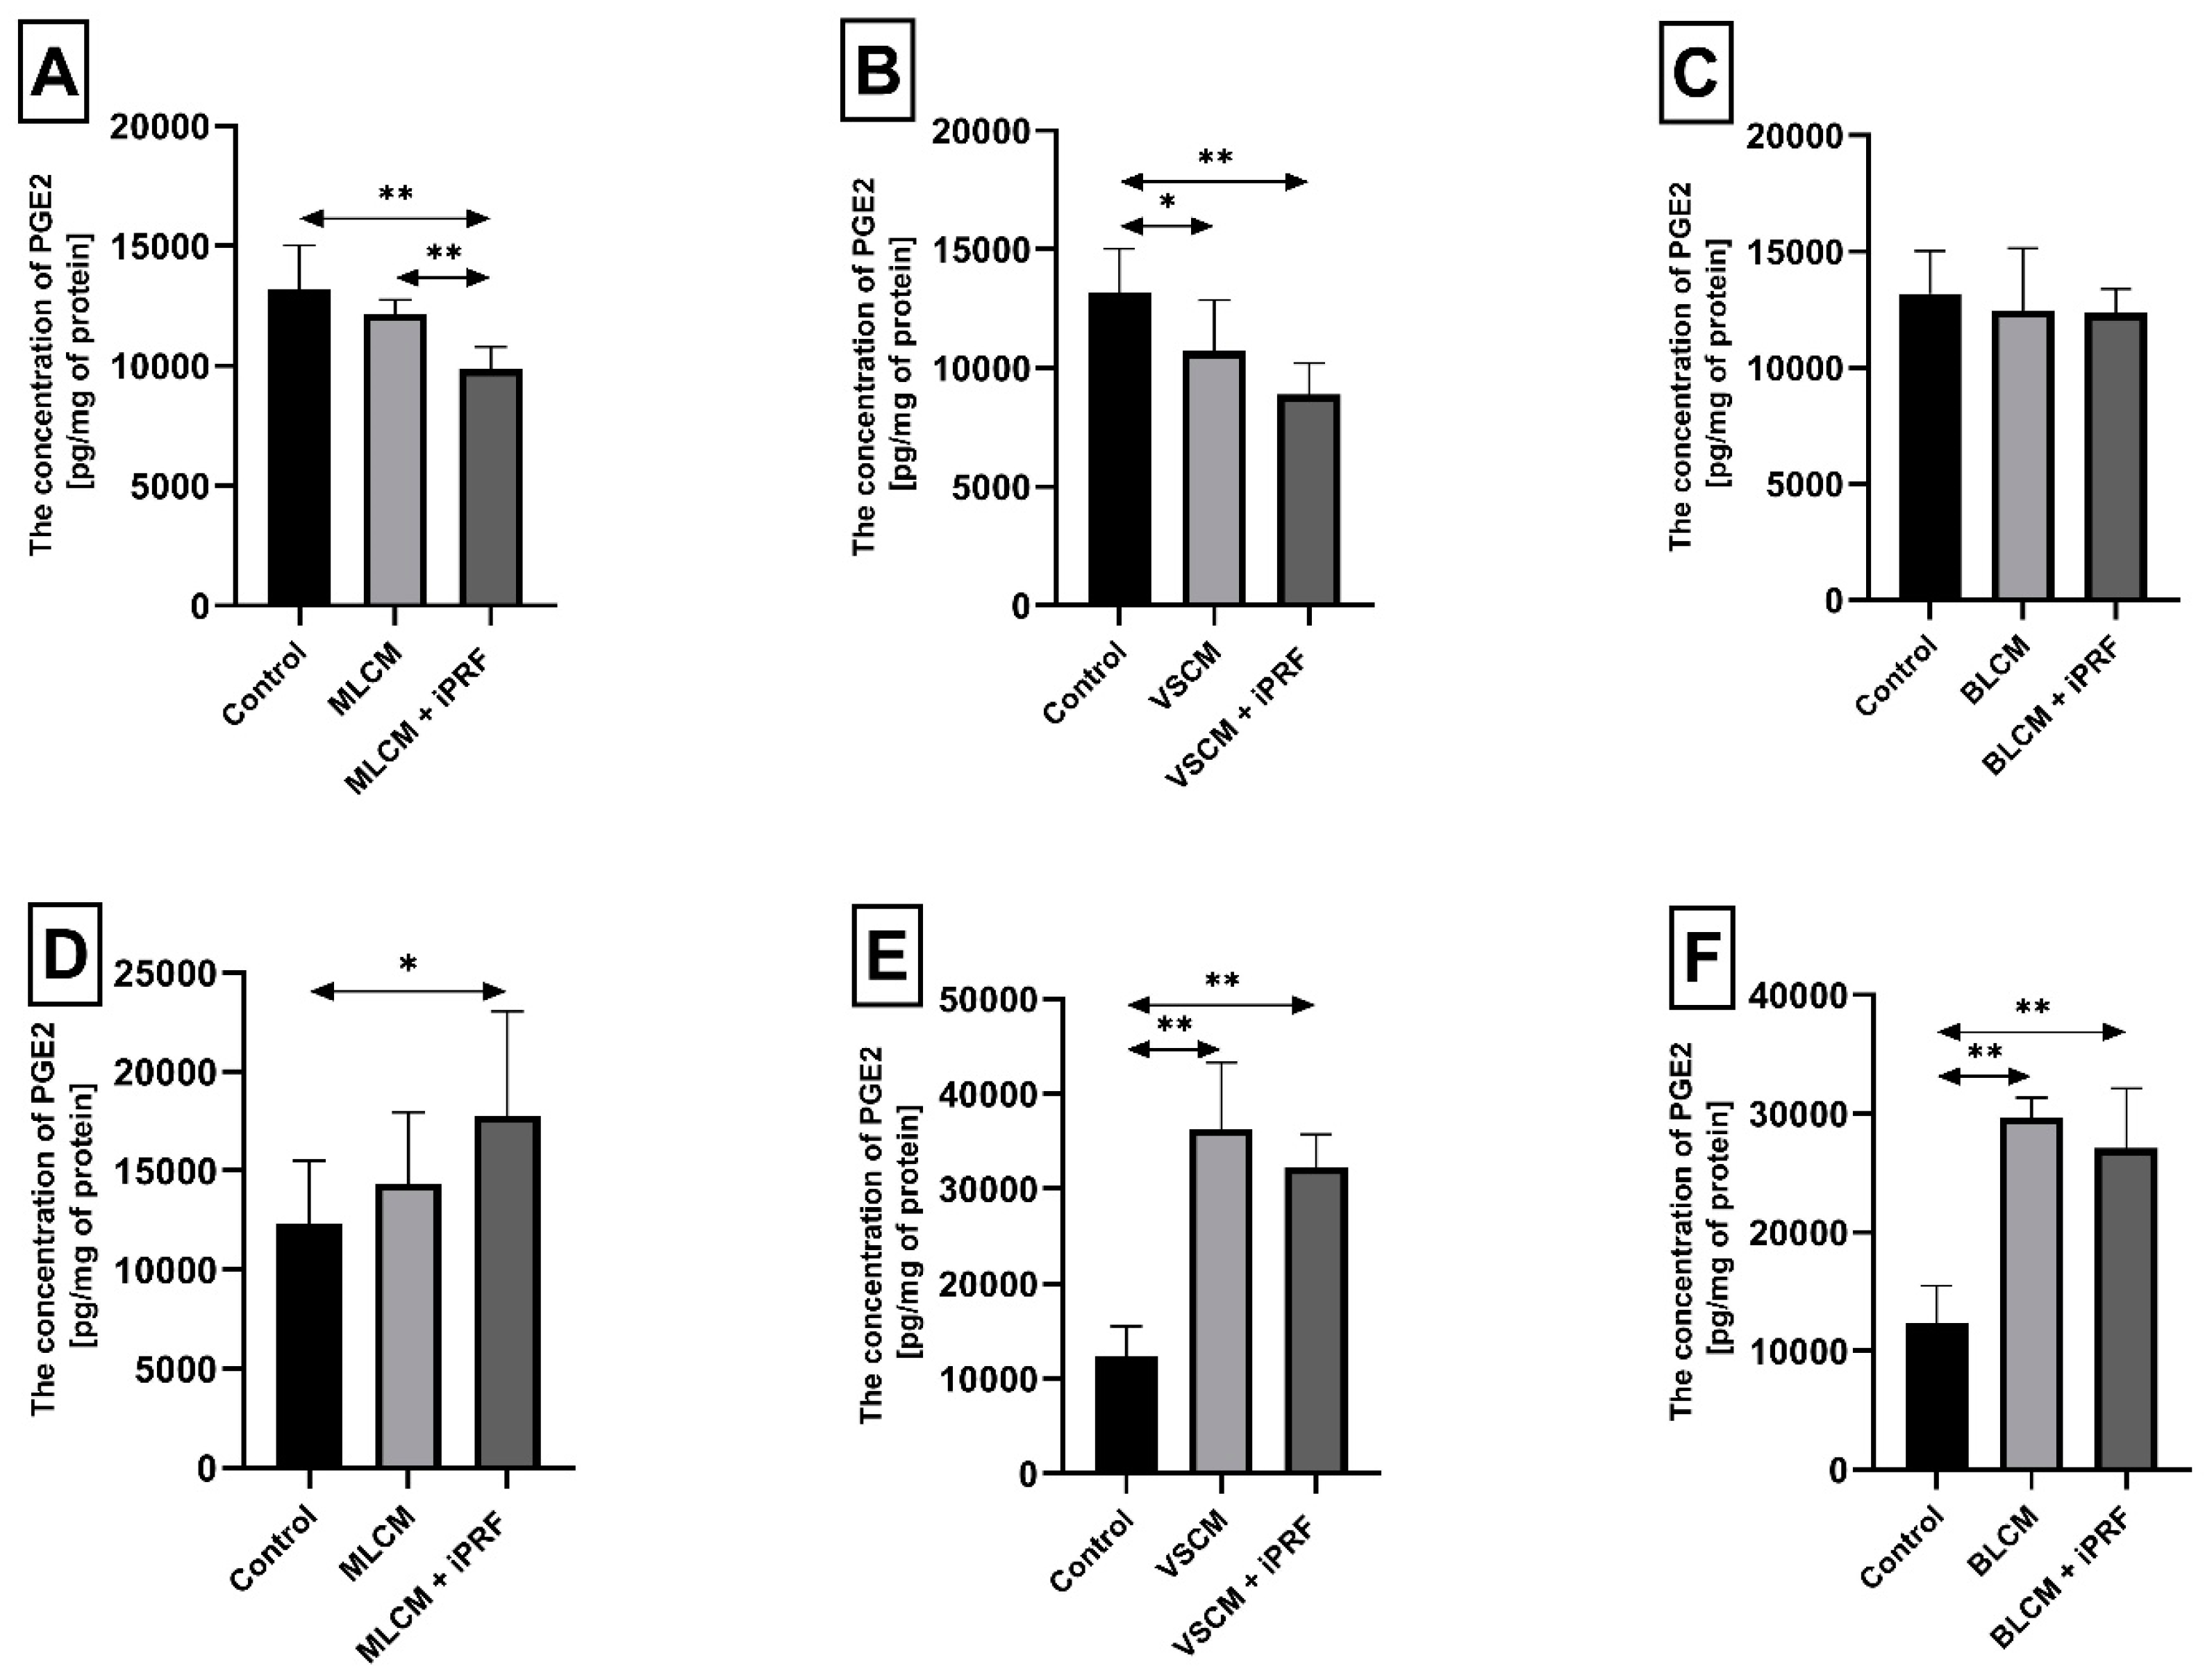
2.3. Prostaglandin E2 (PGE2) in THP-1 Monocytes and Macrophages
2.4. Thromboxane TXB2 in THP-1 Monocytes and Macrophages
2.5. Cyclooxygenase-1 and Cyclooxygenase-2 Expression in Monocytes and Macrophages
3. Discussion
4. Materials and Methods
4.1. Matrices Examined
4.2. Cell Culture and Treatment
4.3. Protein Concentration
4.4. Differentiation of THP-1 Cells into Macrophages: Flow Cytometry Analysis
4.5. Verification of Collagen-Matrix-Induced Initiation of the Inflammatory Response in Macrophages
4.5.1. COX-1/2-Mediated Production of PGE2 and TXB2
4.5.2. Imaging of Cyclooxygenase-1 and Cyclooxygenase-2 Expression
4.5.3. Western Blot Analysis of Cyclooxygenase-1 and Cyclooxygenase-2 Expression
4.6. Statistical Analysis
Author Contributions
Funding
Institutional Review Board Statement
Informed Consent Statement
Data Availability Statement
Conflicts of Interest
References
- Toledano, M.; Toledano-Osorio, M.; Carrasco-Carmona, Á.; Vallecillo, C.; Lynch, C.D.; Osorio, M.T.; Osorio, R. State of the art on biomaterials for soft tissue augmentation in the oral cavity. Part I: Natural polymers-based biomaterials. Polymers 2020, 12, 1850. [Google Scholar] [CrossRef] [PubMed]
- Thoma, D.S.; Buranawat, B.; Hämmerle, C.H.; Held, U.; Jung, R.E. Efficacy of soft tissue augmentation around dental implants and in partially edentulous areas: A systematic review. J. Clin. Periodontol. 2014, 41 (Suppl. S15), S77–S91. [Google Scholar] [CrossRef] [PubMed]
- Rothamel, D.; Benner, M.; Fienitz, T.; Happe, A.; Kreppel, M.; Nickenig, H.J.; Zöller, J.E. Biodegradation pattern and tissue integration of native and cross-linked porcine collagen soft tissue augmentation matrices—An experimental study in the rat. Head Face Med. 2014, 27, 10. [Google Scholar] [CrossRef]
- Tommasato, G.; Del Fabbro, M.; Oliva, N.; Khijmatgar, S.; Grusovin, M.G.; Sculean, A.; Canullo, L. Autogenous graft versus collagen matrices for peri-implant soft tissue augmentation. A systematic review and network meta-analysis. Clin. Oral. Investig. 2024, 28, 300. [Google Scholar] [CrossRef]
- Griffin, T.J.; Cheung, W.S.; Zavras, A.I.; Damoulis, P.D. Postoperative complications following gingival augmentation procedures. J. Periodontol. 2006, 77, 2070–2079. [Google Scholar] [CrossRef]
- Ramanauskaite, A.; Schwarz, F.; Sader, R. Influence of width of keratinized tissue on the prevalence of peri-implant diseases: A systematic review and meta-analysis. Clin. Oral. Implant. Res. 2022, 33 (Suppl. S23), 8–31. [Google Scholar] [CrossRef]
- Stefanini, M.; Mounssif, I.; Barootchi, S.; Tavelli, L.; Wang, H.L.; Zucchelli, G. An exploratory clinical study evaluating safety and performance of a volume-stable collagen matrix with coronally advanced flap for single gingival recession treatment. Clin. Oral. Investig. 2020, 24, 3181–3191. [Google Scholar] [CrossRef]
- Naenni, N.; Walter, P.; Hämmerle, C.H.F.; Jung, R.E.; Thoma, D.S. Augmentation of soft tissue volume at pontic sites: A comparison between a cross-linked and a non-cross-linked collagen matrix. Clin. Oral. Investig. 2021, 25, 1535–1545. [Google Scholar] [CrossRef]
- Dhandayuthapani, B.; Yoshida, Y.; Maekawa, T.; Kumar, D.S. Polymeric Scaffolds in Tissue Engineering Application: A Review. Int. J. Polym. Sci. 2011, 2011, 290602. [Google Scholar] [CrossRef]
- Barbeck, M.; Lorenz, J.; Holthaus, M.G.; Raetscho, N.; Kubesch, A.; Booms, P.; Sader, R.; Kirkpatrick, C.J.; Ghanaati, S. Porcine dermis and pericardium-based, non-cross-linked materials induce multinucleated giant cells after their in vivo implantation: A physiological reaction? J. Oral. Implantol. 2015, 41, e267–e281. [Google Scholar] [CrossRef]
- Ghanaati, S.; Schlee, M.; Webber, M.J.; Willershausen, I.; Barbeck, M.; Balic, E.; Görlach, C.; Stupp, S.I.; Sader, R.A.; Kirkpatrick, C.J. Evaluation of the tissue reaction to a new bilayered collagen matrix in vivo and its translation to the clinic. Biomed. Mater. 2011, 6, 015010. [Google Scholar] [CrossRef] [PubMed]
- Thoma, D.S.; Villar, C.C.; Cochran, D.L.; Hämmerle, C.H.; Jung, R.E. Tissue integration of collagen-based matrices: An experimental study in mice. Clin. Oral. Implants Res. 2012, 23, 1333–1339. [Google Scholar] [CrossRef] [PubMed]
- Park, J.S.; Pabst, A.M.; Ackermann, M.; Moergel, M.; Jung, J.; Kasaj, A. Biofunctionalization of porcine-derived collagen matrix using enamel matrix derivative and platelet-rich fibrin: Influence on mature endothelial cell characteristics in vitro. Clin. Oral. Investig. 2018, 22, 909–917. [Google Scholar] [CrossRef]
- Choukroun, J.; Ghanaati, S. Reduction of relative centrifugation force within injectable platelet-rich-fibrin (PRF) concentrates advances patients’ own inflammatory cells, platelets and growth factors: The first introduction to the low speed centrifugation concept. Eur. J. Trauma. Emerg. Surg. 2018, 44, 87–95. [Google Scholar] [CrossRef]
- Varela, H.A.; Souza, J.C.M.; Nascimento, R.M.; Araújo, R.F., Jr.; Vasconcelos, R.C.; Cavalcante, R.S.; Guedes, P.M.; Araújo, A.A. Injectable platelet rich fibrin: Cell content, morphological, and protein characterization. Clin. Oral. Investig. 2019, 23, 1309–1318. [Google Scholar] [CrossRef]
- Ghadge, K.K.; Shetty, S.K.; Kharat, A.; Kheur, S.; Kulloli, A.; Gopalakrishnan, D.; Bhonde, R. Translational implications of a novel combination of iPRF and collagen scaffold for proliferation of gingival mesenchymal stem cells. Sci. Rep. 2024, 13, 27789. [Google Scholar] [CrossRef]
- Patra, L.; Raj, S.C.; Katti, N.; Mohanty, D.; Pradhan, S.S.; Tabassum, S.; Mahapatra, A. Comparative evaluation of effect of injectable platelet-rich fibrin with collagen mem-brane compared with collagen membrane alone for gingival recession coverage. World J. Exp. Med. 2022, 12, 68. [Google Scholar] [CrossRef]
- Skurska, A.; Dymicka-Piekarska, V.; Milewski, R.; Pietruska, M. Dynamics of Matrix Metalloproteinase-1 and -8 Secretion in Gingival Crevicular Fluid after Gingival Recession Therapy via MCAT with Either Subepithelial Connective Tissue Graft or Collagen Matrix. Biomolecules. 2021, 14, 731. [Google Scholar] [CrossRef]
- Cucci, L.M.; Satriano, C.; Marzo, T.; La Mendola, D. Angiogenin and Copper Crossing in Wound Healing. Int. J. Mol. Sci. 2021, 22, 10704. [Google Scholar] [CrossRef]
- Becker, J.; Al-Nawas, B.; Klein, M.O.; Schliephake, H.; Terheyden, H.; Schwarz, F. Use of a new cross-linked collagen membrane for the treatment of dehiscence-type defects at titanium implants: A prospective, randomized-controlled double-blinded clinical multicenter study. Clin. Oral. Implants Res. 2009, 20, 742–749. [Google Scholar] [CrossRef]
- Zeltner, M.; Jung, R.E.; Hämmerle, C.H.; Hüsler, J.; Thoma, D.S. Randomized controlled clinical study comparing a volume-stable collagen matrix to autogenous connective tissue grafts for soft tissue augmentation at implant sites: Linear volumetric soft tissue changes up to 3 months. J. Clin. Periodontol. 2017, 44, 446–453. [Google Scholar] [CrossRef]
- Tavelli, L.; McGuire, M.K.; Zucchelli, G.; Rasperini, G.; Feinberg, S.E.; Wang, H.L.; Giannobile, W.V. Extracellular matrix-based scaffolding technologies for periodontal and peri-implant soft tissue regeneration. J. Periodontol. 2020, 91, 17–25. [Google Scholar] [CrossRef] [PubMed]
- Ashurko, I.; Tarasenko, S.; Magdalyanova, M.; Bokareva, S.; Balyasin, M.; Galyas, A.; Khamidova, M.; Zhornik, M.; Unkovskiy, A. Comparative analysis of xenogeneic collagen matrix and autogenous subepithelial connective tissue graft to increase soft tissue volume around dental implants: A systematic review and meta-analysis. BMC Oral. Health 2023, 23, 741. [Google Scholar] [CrossRef]
- Ghanaati, S. Non-cross-linked porcine-based collagen I-III membranes do not require high vascularization rates for their integration within the implantation bed: A paradigm shift. Acta Biomater. 2012, 8, 3061–3072. [Google Scholar] [CrossRef]
- Chanput, W.; Mes, J.; Vreeburg, R.A.; Savelkoul, H.F.; Wichers, H.J. Transcription profiles of LPS-stimulated THP-1 monocytes and macrophages: A tool to study inflammation modulating effects of food-derived compounds. Food Funct. 2010, 1, 254–261. [Google Scholar] [CrossRef]
- Tatakis, D.N.; Promsudthi, A.; Wikesjö, U.M. Devices for periodontal regeneration. Periodontol 2000 1999, 19, 59–73. [Google Scholar] [CrossRef]
- Refai, A.K.; Textor, M.; Brunette, D.M.; Waterfield, J.D. Effect of titanium surface topography on macrophage activation and secretion of proinflammatory cytokines and chemokines. J. Biomed. Mater. Res. A 2004, 70, 194–205. [Google Scholar] [CrossRef]
- Rodrigues, E.M.; Gomes-Cornélio, A.L.; Soares-Costa, A.; Salles, L.P.; Velayutham, M.; Rossa-Junior, C.; Guerreiro-Tanomaru, J.M.; Tanomaru-Filho, M. An assessment of the overexpression of BMP-2 in transfected human osteoblast cells stimulated by mineral trioxide aggregate and Biodentine. Int. Endod. J. 2017, 50 (Suppl. S2), e9–e18. [Google Scholar] [CrossRef]
- Brown, B.N.; Ratner, B.D.; Goodman, S.B.; Amar, S.; Badylak, S.F. Macrophage polarization: An opportunity for improved outcomes in biomaterials and regenerative medicine. Biomaterials. 2012, 33, 3792–3802. [Google Scholar] [CrossRef]
- Shirakura, M.; Fujii, N.; Ohnishi, H.; Taguchi, Y.; Ohshima, H.; Nomura, S.; Maeda, T. Tissue response to titanium implantation in the rat maxilla, with special reference to the effects of surface conditions on bone formation. Clin. Oral. Implant. Res. 2003, 14, 687–696. [Google Scholar] [CrossRef]
- Moura, C.C.; Soares, P.B.; Carneiro, K.F.; Souza, M.A.; Magalhães, D. Cytotoxicity of bovine and porcine collagen membranes in mononuclear cells. Braz. Dent. J. 2012, 23, 39–44. [Google Scholar] [CrossRef] [PubMed]
- Auger, M.J.; Ross, J.A. The biology of the macrophage. In The Macrophage; IRL Press: New York, NY, USA, 1992; pp. 3–74. [Google Scholar]
- van Furth, R. Human monocytes and cytokines. Res. Immunol. 1998, 149, 719–720. [Google Scholar] [CrossRef]
- DeWitt, D.L. Prostaglandin endoperoxide synthase: Regulation of enzyme expression. Biochim. Biophys. Acta. 1991, 1083, 121–134. [Google Scholar] [CrossRef]
- Korbecki, J.; Baranowska-Bosiacka, I.; Gutowska, I.; Piotrowska, K.; Chlubek, D. Cyclooxygenase-1 as the main source of proinflammatory factors after sodium orthovanadate treatment. Biol. Trace Elem. Res. 2015, 163, 103–111. [Google Scholar] [CrossRef]
- Morita, I. Distinct functions of COX-1 and COX-2. Prostaglandins Other Lipid Mediat. 2002, 68–69, 165–175. [Google Scholar] [CrossRef]
- Penglis, P.S.; Cleland, L.G.; Demasi, M.; Caughey, G.E.; James, M.J. Differential regulation of prostaglandin E2 and thromboxane A2 production in human monocytes: Implications for the use of cyclooxygenase inhibitors. J. Immunol. 2000, 165, 1605–1611. [Google Scholar] [CrossRef]
- Liu, Q.; Humpe, A.; Kletsas, D.; Warnke, F.; Becker, S.T.; Douglas, T.; Sivananthan, S.; Warnke, P.H. Proliferation assessment of primary human mesenchymal stem cells on collagen membranes for guided bone regeneration. Int. J. Oral. Maxillofac. Implants. 2011, 26, 1004–1010. [Google Scholar]
- Chanput, W.; Mes, J.J.; Wichers, H.J. THP-1 cell line: An in vitro cell model for immune modulation approach. Int. Immunopharmacol. 2014, 23, 37–45. [Google Scholar] [CrossRef]
- Reinke, J.M.; Sorg, H. Wound repair and regeneration. Eur. Surg. Res. 2012, 49, 35–43. [Google Scholar] [CrossRef]
- Sikora, M.; Goschorska, M.; Baranowska-Bosiacka, I.; Chlubek, D. In Vitro Effect of 3D Plates Used for Surgical Treatment of Condylar Fractures on Prostaglandin E2 (PGE2) and Thromboxane B2 (TXB2) Concentration in THP-1 Macrophages. Int. J. Mol. Sci. 2017, 18, 2638. [Google Scholar] [CrossRef]
- Barczak, K.; Palczewska-Komsa, M.; Nowicka, A.; Chlubek, D.; Buczkowska-Radlińska, J. Analysis of the Activity and Expression of Cyclooxygenases COX1 and COX2 in THP-1 Monocytes and Macrophages Cultured with BiodentineTM Silicate Cement. Int. J. Mol. Sci. 2020, 21, 2237. [Google Scholar] [CrossRef] [PubMed]
- Ferrante, C.J.; Leibovich, S.J. Regulation of Macrophage Polarization and Wound Healing. Adv. Wound care 2012, 1, 10–16. [Google Scholar] [CrossRef]
- Kotwal, G.J.; Chien, S. Macrophage Differentiation in Normal and Accelerated Wound Healing. In Results and Problems in Cell Differentiation; Springer: Cham, Switzerland, 2017; Volume 62, pp. 353–364. [Google Scholar]
- Dubois, R.N.; Abramson, S.B.; Crofford, L.; Gupta, R.A.; Simon, L.S.; Van De Putte, L.B.; Lipsky, P.E. Cyclooxygenase in biology and disease. FASEB J. 1998, 12, 1063–1073. [Google Scholar] [CrossRef]
- Klein, T.; Shephard, P.; Kleinert, H.; Kömhoff, M. Regulation of cyclooxygenase-2 expression by cyclic AMP. Biochim. Biophys. Acta. 2007, 1773, 1605–1618. [Google Scholar] [CrossRef]
- Aid, S.; Langenbach, R.; Bosetti, F. Neuroinflammatory response to lipopolysaccharide is exacerbated in mice genetically deficient in cyclooxygenase-2. J. Neuroinflamm. 2008, 5, 17. [Google Scholar] [CrossRef]
- McAdam, B.; Mardini, I.; Habib, A.; Burke, A.; Lawson, J.; Kapoor, S.; FitzGerald, G.A. Effect of regulated expression of human cyclooxygenase isoforms on eicosanoid and isoeicosanoid production in inflammation. J. Clin. Investig. 2000, 105, 1473–1482. [Google Scholar] [CrossRef]
- Brock, T.G.; McNish, R.W.; Peters-Golden, M. Arachidonic acid is preferentially metabolized by cyclooxygenase-2 to prostacyclin and prostaglandin E2. J. Biol. Chem. 1999, 274, 11660–11666. [Google Scholar] [CrossRef]
- Patrono, C.; Rocca, B. Measurement of Thromboxane Biosynthesis in Health and Disease. Front. Pharmacol. 2019, 10, 1244. [Google Scholar] [CrossRef]
- Angele, P.; Abke, J.; Kujat, R.; Faltermeier, H.; Schumann, D.; Nerlich, M.; Kinner, B.; Englert, C.; Ruszczak, Z.; Mehrl, R.; et al. Influence of different collagen species on physi-co-chemical properties of crosslinked collagen matrices. Biomaterials 2004, 25, 2831–2841. [Google Scholar] [CrossRef]
- Stout, R.; Jiang, C.; Matta, B.; Tietzel, I.; Watkins, S.K.; Suttles, J. Macrophages sequentially change their functional phenotype in response to changes in microenvironmental influences. J. Immunol. 2005, 175, 342–349. [Google Scholar] [CrossRef]
- Ghanaati, S.; Booms, P.; Orlowska, A.; Kubesch, A.; Lorenz, J.; Rutkowski, J.; Landes, C.; Sader, R.; Kirkpatrick, C.; Choukroun, J. Advanced platelet-rich fibrin: A new concept for cell-based tissue engineering by means of inflammatory cells. J. Oral. Implantol. 2014, 40, 679–689. [Google Scholar] [CrossRef] [PubMed]
- James, M.; Penglis, P.; Caughey, G.; Demasi, M.; Cleland, L. Eicosanoid production by human monocytes: Does COX-2 contribute to a self-limiting inflammatory response? Inflamm. Res. 2001, 50, 249–253. [Google Scholar] [CrossRef]
- Anitua, E.; Troya, M.; Alkhraisat, M.H. Immunoregulatory role of platelet derivatives in the macrophage-mediated immune response. Front. Immunol. 2024, 15, 1399130. [Google Scholar] [CrossRef]
- DiPietro, L.A. Wound healing: The role of the macrophage and other immune cells. Shock 1995, 4, 233–240. [Google Scholar] [CrossRef]
- Galli, S.J.; Borregaard, N.; Wynn, T.A. Phenotypic and functional plasticity of cells of innate immunity: Macrophages, mast cells and neutrophils. Nat. Immunol. 2011, 12, 1035–1044. [Google Scholar] [CrossRef]
- Brancato, S.K.; Albina, J.E. Wound macrophages as key regulators of repair: Origin, phenotype, and function. Am. J. Pathol. 2011, 178, 19–25. [Google Scholar] [CrossRef]
- Stein, M.; Keshav, S.; Harris, N.; Gordon, S. Interleukin 4 potently enhances murine macrophage mannose receptor activity: A marker of alternative immunologic macrophage activation. J. Exp. Med. 1992, 176, 287–292. [Google Scholar] [CrossRef]
- Mosser, D.M.; Edwards, J.P. Exploring the full spectrum of macrophage activation. Nat. Rev. Immunol. 2008, 8, 958–969. [Google Scholar] [CrossRef]
- Cheng, H.; Huang, H.; Guo, Z.; Chang, Y.; Li, Z. Role of prostaglandin E2 in tissue repair and regeneration. Theranostics. 2021, 13, 8836–8854. [Google Scholar] [CrossRef]
- Zhao, J.; Shu, B.; Chen, L.; Tang, J.; Zhang, L.; Xie, J.; Liu, X.; Xu, Y.; Qi, S. Prostaglandin E2 inhibits collagen synthesis in dermal fibroblasts and prevents hypertrophic scar for-mation in vivo. Exp. Dermatol. 2016, 25, 604–610. [Google Scholar] [CrossRef]
- Humes, J.L.; Bonney, R.J.; Pelus, L.; Dahlgren, M.E.; Sadowski, S.J.; Kuehl, F.A.; Davies, P. Macrophages synthesis and release prostaglandins in response to inflammatory stimuli. Nature 1977, 269, 149–151. [Google Scholar] [CrossRef] [PubMed]
- Endo, Y.; Blinova, K.; Romantseva, T.; Golding, H.; Zaitseva, M. Differences in PGE2 production between primary human monocytes and differentiated macrophages: Role of IL-1β and TRIF/IRF3. PLoS ONE 2014, 9, e98517. [Google Scholar] [CrossRef] [PubMed]
- Arakawa, T.; Laneuville, O.; Miller, C.A.; Lakkides, K.M.; Wingerd, B.A.; DeWitt, D.L.; Smith, W.L. Prostanoid receptors of murine NIH 3T3 and RAW 264.7 cells. Structure and expression of the murine prostaglandin EP4 receptor gene. J. Biol. Chem. 1996, 271, 29569–29575. [Google Scholar] [CrossRef]
- Williams, J.A.; Shacter, E. Regulation of macrophage cytokine production by prostaglandin E2. Distinct roles of cyclooxygenase-1 and -2. J. Biol. Chem. 1997, 272, 25693–25699. [Google Scholar] [CrossRef]
- Nishikai-Yan Shen, T.; Kanazawa, S.; Kado, M.; Okada, K.; Luo, L.; Hayashi, A.; Mizuno, H.; Tanaka, R. Interleukin-6 stimulates Akt and p38 MAPK phosphorylation and fibroblast migration in non-diabetic but not diabetic mice. PLoS ONE. 2017, 12, e0178232. [Google Scholar] [CrossRef]
- Roytblat, L.; Rachinsky, M.; Fisher, A.; Greemberg, L.; Shapira, Y.; Douvdevani, A.; Gelman, S. Raised Interleukin-6 Levels in Obese Patients. Obes. Res. 2000, 8, 673–675. [Google Scholar] [CrossRef]
- Rucker, D.; Dhamoon, A.S. Physiology, Thromboxane A2. In StatPearls [Internet]; StatPearls Publishing: Treasure Island, FL, USA, 2022; Volume 12. [Google Scholar]
- Yamane, S.; Amano, H.; Ito, Y.; Betto, T.; Matsui, Y.; Koizumi, W.; Narumiya, S.; Majima, M. The role of thromboxane prostanoid receptor signaling in gastric ulcer healing. Int. J. Exp. Pathol. 2022, 103, 4–12. [Google Scholar] [CrossRef]
- Pierre, S.; Linke, B.; Suo, J.; Tarighi, N.; Del Turco, D.; Thomas, D.; Ferreiros, N.; Stegner, D.; Frolich, S.; Sisignano, M.; et al. GPVI and thromboxane receptor on platelets promote proinflammatory macrophage phenotypes during cutaneous inflammation. J. Investig. Dermatol. 2017, 137, 686–695. [Google Scholar] [CrossRef]
- Shah, M.; Deshpande, N.; Bharwani, A.; Nadig, P.; Doshi, V.; Dave, D. Effectiveness of autologous platelet-rich fibrin in the treatment of intra-bony defects: A systematic review and meta-analysis. J. Indian. Soc. Periodontol. 2014, 18, 698–704. [Google Scholar]
- Pabst, A.; Kämmerer, P.W. Collagen matrices: Opportunities and perspectives in oral hard and soft tissue regeneration. Quintessence Int. 2020, 51, 318–327. [Google Scholar]
- Thoma, D.S.; Zeltner, M.; Hilbe, M.; Hämmerle, C.H.; Hüsler, J.; Jung, R.E. Randomized controlled clinical study evaluating effectiveness and safety of a volume-stable collagen matrix compared to autogenous connective tissue grafts for soft tissue augmentation at implant sites. J. Clin. Periodontol. 2016, 43, 874–885. [Google Scholar] [CrossRef] [PubMed]
- Nevins, M.; Nevins, M.L.; Kim, S.W.; Schupbach, P.; Kim, D.M. The use of mucograft collagen matrix to augment the zone of keratinized tissue around teeth: A pilot study. Int. J. Periodontics Restor. Dent. 2011, 31, 367–373. [Google Scholar]


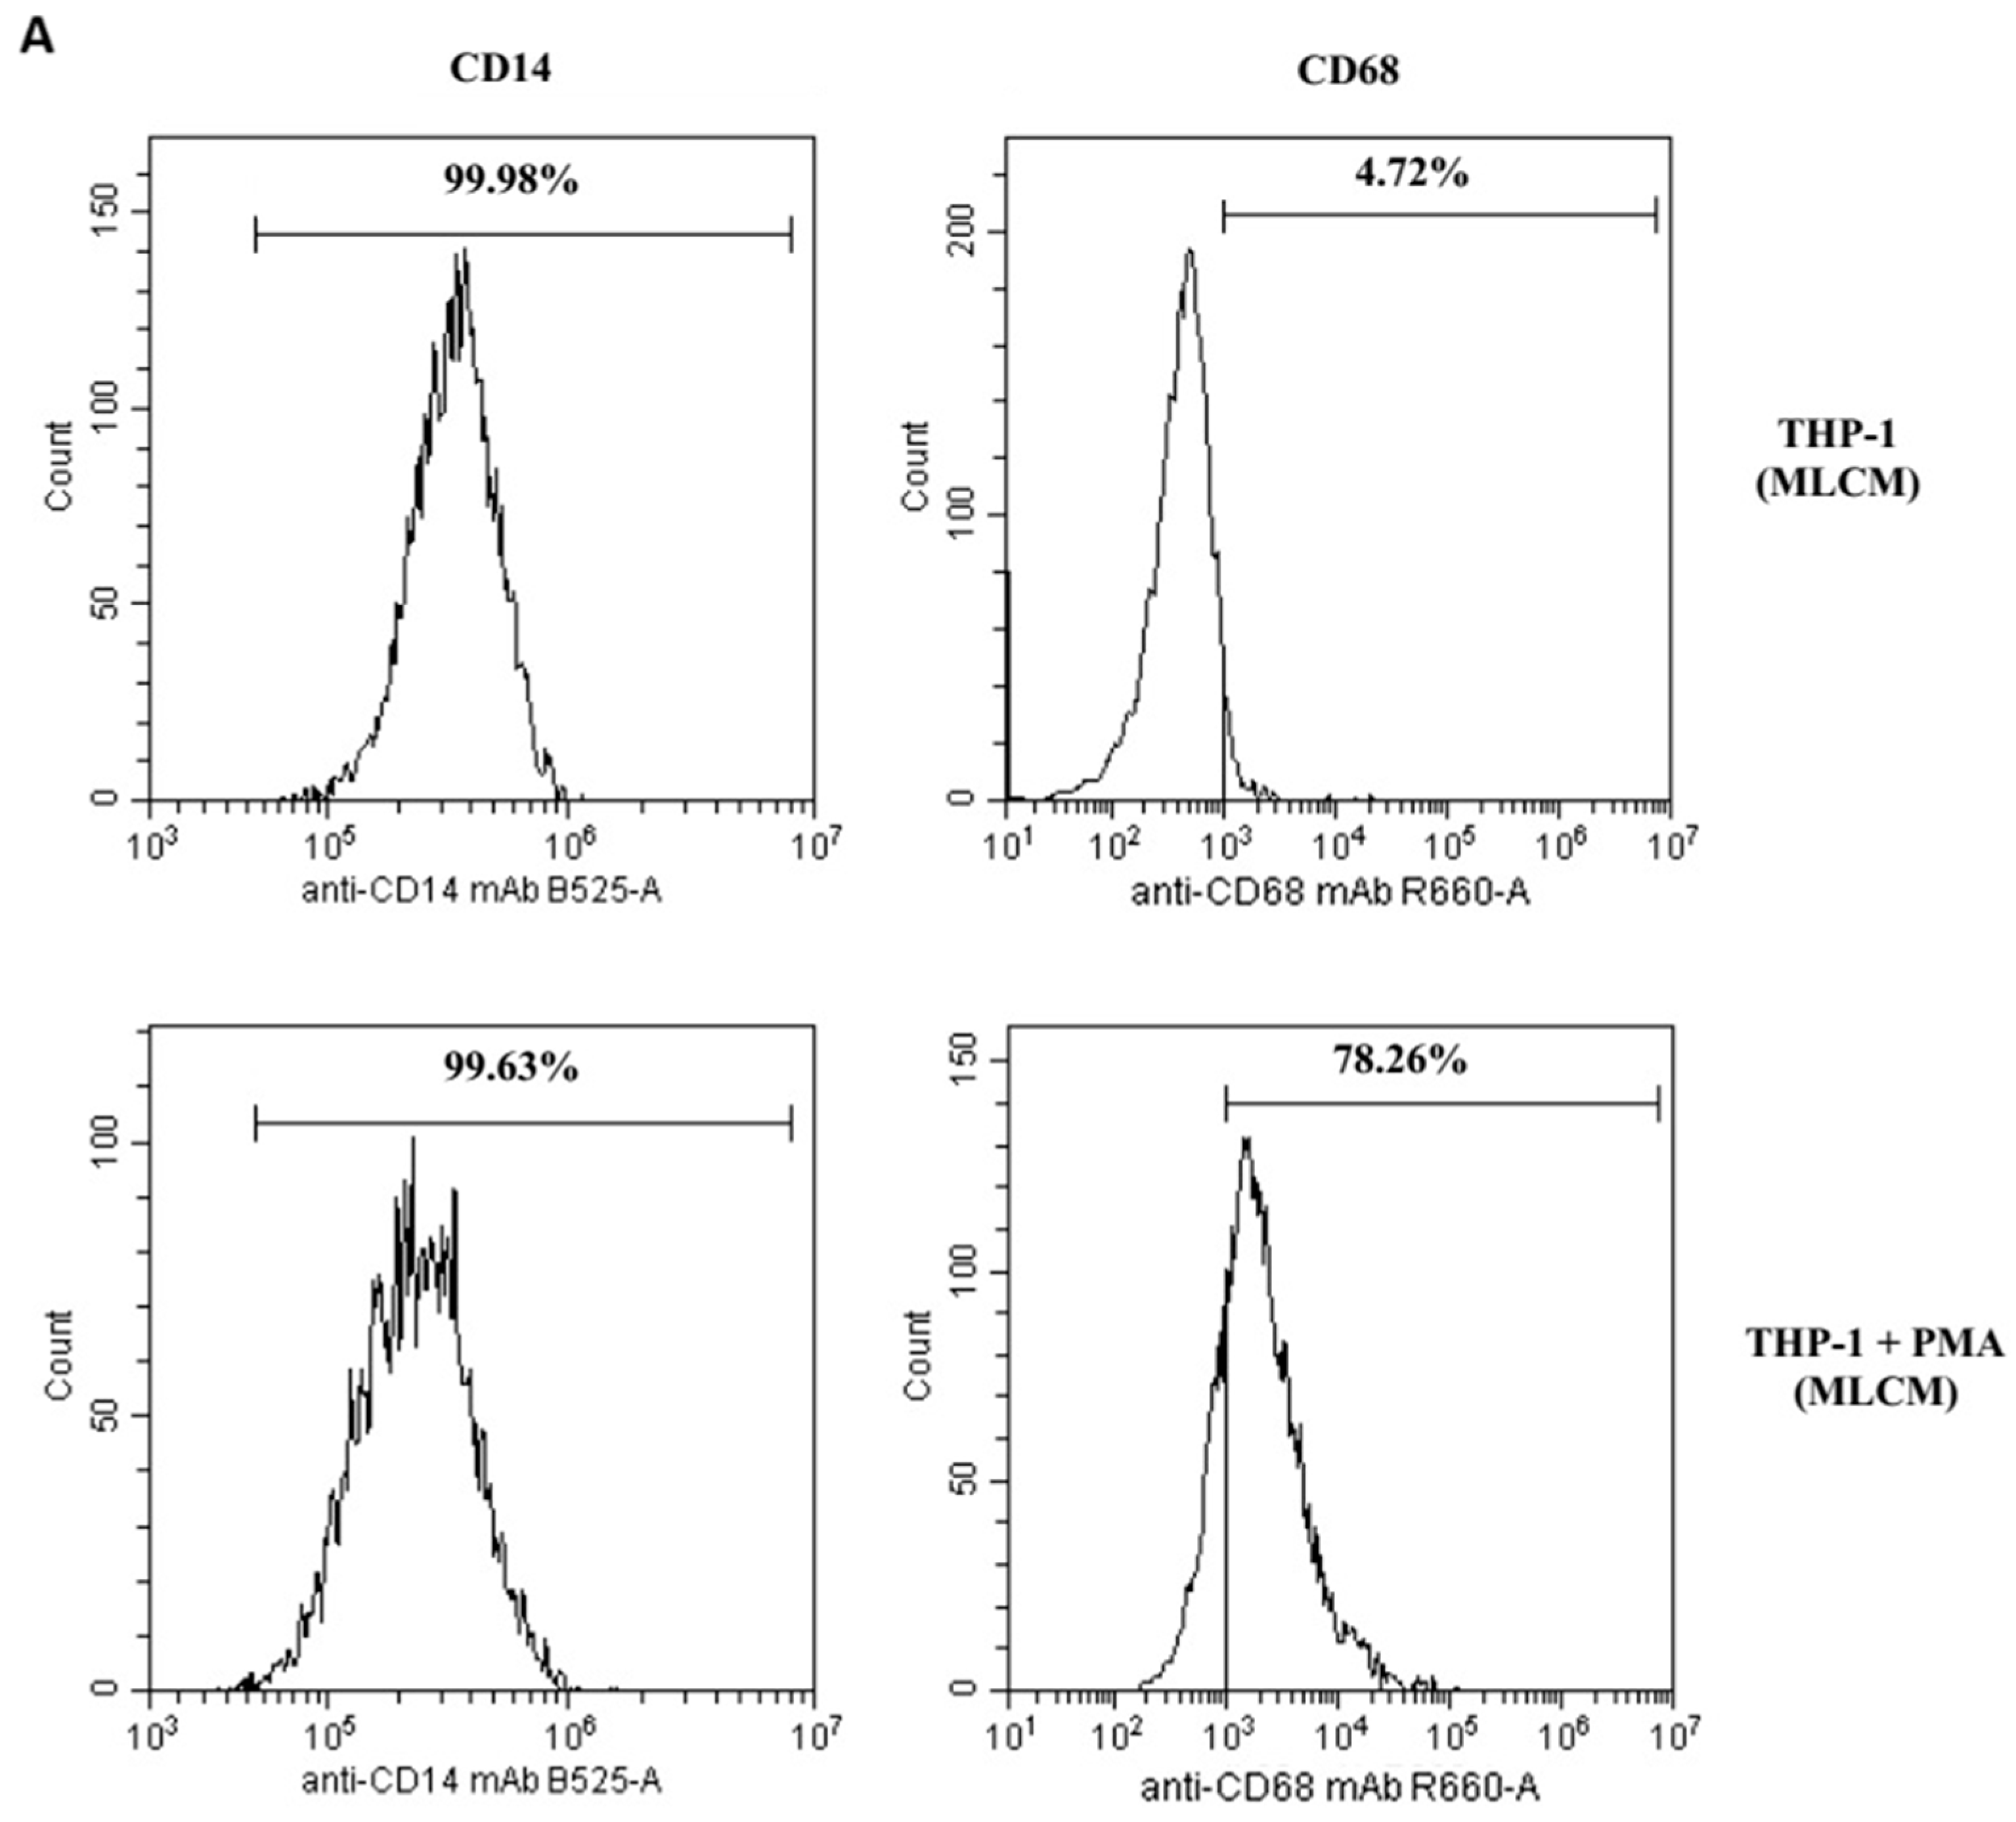
| Fluorescence Intensity | |||
|---|---|---|---|
| CD14 (% of Positive Cells) | CD68 (% of Positive Cells) | ||
| 99.96% | 2.8% | THP-1 | MLCM |
| 98.37% | 79.94% | THP-1 + PMA | |
| 99.92% | 2.5% | THP-1 | VSCM |
| 99.72% | 78.26% | THP-1 + PMA | |
| 99.98% | 2.3% | THP-1 | BLCM |
| 98.41% | 80.43% | THP-1 + PMA | |
| Fluorescence Intensity | |||
|---|---|---|---|
| COX-1 (Positive Cells) Monocytes/ Macrophages | COX-2 (Positive Cells) Monocytes/ Macrophages | ||
| +/+ | +/++ | THP-1 | Control |
| +/+ | +/++ | THP-1 | MLCM |
| +/+ | +/++ | THP-1 + PMA | |
| +/+ | +/++ | THP-1 | VSCM |
| +/+ | +/++ | THP-1 + PMA | |
| +/+ | +/++ | THP-1 | BLCM |
| +/+ | +/++ | THP-1 + PMA | |
| Collagen Matrix | Origin | Scaffolding Characteristics | Effects | Reference |
|---|---|---|---|---|
| Mucoderm® (Botiss medical GmbH, Berlin, Germany) monolayer collagen matrix (MLCM) | Porcine dermis | Monolayer scaffold collagen types I and III elastin non-cross-linked | Promotes the proliferation of fibroblasts and endothelial cells and supports rapid revascularization | [3,73] |
| Fibro-Gide® (Geistlich Pharma AG, Wolhusen, Switzerland) volume-stable collagen matrix (VSCM) | Porcine dermis | Monolayer scaffold collagen types I and III elastin volume-stable cross-linked | Promotes the ingrowth of fibroblasts, matrix biosynthesis, tissue integration, and angiogenesis | [12,74] |
| Mucograft® (Geistlich Pharma AG, Wolhusen, Switzerland) bilayer collagen matrix (BLCM) | Porcine peritoneum (compact layer) Porcine dermis (porous layer) | Bilayer scaffold (compact and porous layers) collagen types I and III non-cross-linked | Compact layer acts as a barrier and provides stability Porous layer stabilizes the blood clot and promotes cell ingrowth, tissue integration, and angiogenesis | [11,75] |
Disclaimer/Publisher’s Note: The statements, opinions and data contained in all publications are solely those of the individual author(s) and contributor(s) and not of MDPI and/or the editor(s). MDPI and/or the editor(s) disclaim responsibility for any injury to people or property resulting from any ideas, methods, instructions or products referred to in the content. |
© 2025 by the authors. Licensee MDPI, Basel, Switzerland. This article is an open access article distributed under the terms and conditions of the Creative Commons Attribution (CC BY) license (https://creativecommons.org/licenses/by/4.0/).
Share and Cite
Droździk, A.; Barczak, K.; Bosiacki, M.; Kupnicka, P.; Cenariu, D.; Uriciuc, W.A.; Chlubek, D.; Lipski, M.; Droździk, M.; Baranowska-Bosiacka, I. Analysis of the Expression and Activity of Cyclooxygenases COX-1 and COX-2 in THP-1 Monocytes and Macrophages Cultured with Xenogenic Collagen Matrices Biofunctionalized with the Injectable Platelet-Rich Fibrin. Int. J. Mol. Sci. 2025, 26, 4386. https://doi.org/10.3390/ijms26094386
Droździk A, Barczak K, Bosiacki M, Kupnicka P, Cenariu D, Uriciuc WA, Chlubek D, Lipski M, Droździk M, Baranowska-Bosiacka I. Analysis of the Expression and Activity of Cyclooxygenases COX-1 and COX-2 in THP-1 Monocytes and Macrophages Cultured with Xenogenic Collagen Matrices Biofunctionalized with the Injectable Platelet-Rich Fibrin. International Journal of Molecular Sciences. 2025; 26(9):4386. https://doi.org/10.3390/ijms26094386
Chicago/Turabian StyleDroździk, Agnieszka, Katarzyna Barczak, Mateusz Bosiacki, Patrycja Kupnicka, Diana Cenariu, Willi Andrei Uriciuc, Dariusz Chlubek, Mariusz Lipski, Marek Droździk, and Irena Baranowska-Bosiacka. 2025. "Analysis of the Expression and Activity of Cyclooxygenases COX-1 and COX-2 in THP-1 Monocytes and Macrophages Cultured with Xenogenic Collagen Matrices Biofunctionalized with the Injectable Platelet-Rich Fibrin" International Journal of Molecular Sciences 26, no. 9: 4386. https://doi.org/10.3390/ijms26094386
APA StyleDroździk, A., Barczak, K., Bosiacki, M., Kupnicka, P., Cenariu, D., Uriciuc, W. A., Chlubek, D., Lipski, M., Droździk, M., & Baranowska-Bosiacka, I. (2025). Analysis of the Expression and Activity of Cyclooxygenases COX-1 and COX-2 in THP-1 Monocytes and Macrophages Cultured with Xenogenic Collagen Matrices Biofunctionalized with the Injectable Platelet-Rich Fibrin. International Journal of Molecular Sciences, 26(9), 4386. https://doi.org/10.3390/ijms26094386