Article

A Transfer Learning Framework for Predicting and Interpreting Drug Responses via Single-Cell RNA-Seq Data

1
College of Chemistry, Sichuan University, Chengdu 610064, China
2
Medical Big Data Center, Sichuan University, Chengdu 610064, China
*
Author to whom correspondence should be addressed.
Int. J. Mol. Sci. 2025, 26(9), 4365; https://doi.org/10.3390/ijms26094365
Submission received: 14 April 2025 / Revised: 29 April 2025 / Accepted: 2 May 2025 / Published: 4 May 2025
(This article belongs to the Special Issue Machine Learning in Disease Diagnosis and Treatment)

Abstract

Chemotherapy is a fundamental therapy in cancer treatment, yet its effectiveness is often undermined by drug resistance. Understanding the molecular mechanisms underlying drug response remains a major challenge due to tumor heterogeneity, complex cellular interactions, and limited access to clinical samples, which also hinder the performance and interpretability of existing predictive models. Meanwhile, single-cell RNA sequencing (scRNA-seq) has emerged as a powerful tool for uncovering resistance mechanisms, but the systematic collection and utilization of scRNA-seq drug response data remain limited. In this study, we collected scRNA-seq drug response datasets from publicly available web sources and proposed a transfer learning–based framework to align bulk and single cell sequencing data. A shared encoder was designed to project both bulk and single-cell sequencing data into a unified latent space for drug response prediction, while a sparse decoder guided by prior biological knowledge enhanced interpretability by mapping latent features to predefined pathways. The proposed model achieved superior performance across five curated scRNA-seq datasets and yielded biologically meaningful insights through integrated gradient analysis. This work demonstrates the potential of deep learning to advance drug response prediction and underscores the value of scRNA-seq data in supporting related research.

1. Introduction

Chemotherapy remains one of the core therapeutic strategies in modern medicine and is widely applied across a range of diseases, from common infections to complex conditions. Among these, cancer is one of the most prominent diseases for which chemotherapy plays a central role in treatment. Although chemotherapy is widely regarded as an effective approach for cancer management and often produces substantial initial responses, therapeutic failure frequently occurs due to tumor cell adaptation to pharmacological agents, ultimately leading to the development of drug resistance [1,2]. The mechanisms of chemoresistance are complex, involving tumor cell heterogeneity, interactions within the tumor microenvironment, and dysregulation of signaling pathways [3,4,5,6]. For instance, activation of the NF-κB, STAT3, and PI3K pathways has been widely implicated in causing chemoresistance during cancer therapy [7,8,9]. Consequently, elucidating the molecular basis of drug resistance holds critical importance for developing novel anticancer therapeutics and optimizing clinical treatment strategies [10,11]. However, research on drug response faces challenges. Investigating the biological mechanisms of drug responses at the molecular and cellular levels is inherently difficult. Drug resistance is highly complex and varies significantly across individuals, tissue types, and drugs. Furthermore, the limited availability to obtain samples from clinical trials constrains drug response studies [12,13,14].
To address these issues, early computational approaches incorporated genomic features, such as somatic mutations and copy number variations, along with pharmacochemical properties like molecular fingerprints, to develop machine learning (ML) models, including random forests (RFs) and shallow neural networks. While these models achieved promising results, they often struggled with high-dimensional omics data and lacked interpretability, limiting their ability to reveal the biological basis of predictions [15].
Recent advances in deep learning (DL) and high-throughput screening technologies have catalyzed developments in drug response prediction [16]. DL models can automatically extract complex features from large-scale biological datasets, enabling more accurate prediction. The increasing availability of data resources has further driven the systematic integration of DL into pharmacogenomic modeling, resulting in a shift from simplistic statistical frameworks to sophisticated deep learning architectures.
MOLI [17] utilized independent encoders to separately extract features from somatic mutations, copy number variations, and gene expression profiles, which were subsequently concatenated and input into a neural network for drug response prediction. DeepDRK [18] employed kernel functions to extract features from cellular omics and drug data, which are fused as inputs. CODE-AE-ADV [19] adopted a deconfounding adversarial autoencoder to learn robust latent representations that align in vitro with in vivo data. In addition to performance improvements, several DL models aim to enhance interpretability. DrugCell [20] integrated a visible neural network (VNN), aligning model architectures with tumor cellular organizations to simulate therapeutic mechanisms. ParsVNN [21] enhanced performance and interpretability through pruning VNN, streamlining biological hierarchies to focus on critical features. Moreover, advanced neural architectures such as convolutional neural networks, graph neural networks, and transformer-based models have also been explored for modeling cellular omics and drug response, yielding promising results [22,23,24].
Meanwhile, single-cell RNA sequencing (scRNA-seq) has emerged as a transformative approach for dissecting tumor heterogeneity and elucidating mechanisms of drug response [25]. Compared with bulk RNA sequencing (bulk RNA-seq), scRNA-seq enables the identification of differences among distinct cellular subpopulations and capture subtle molecular changes, making it more sensitive for predicting drug responses [25,26]. As a result, it can provide a more precise understanding of the mechanisms driving drug responses. Despite these advantages, the majority of drug response models still rely on bulk RNA-seq data, such as Genomics of Drug Sensitivity in Cancer (GDSC) [27] and L1000 [28]. Although several scRNA-seq datasets, such as MIX-seq [29] and sci-Plex [30], have recently been introduced, systematic collection and analysis of scRNA-seq drug response data remain limited. This is largely due to the relatively high cost of scRNA-seq experiments, as well as the time-consuming and labor-intensive process of manual data annotation [31,32]. The limited data hinders accurate prediction and in-depth understanding of mechanisms driving drug response. In contrast, large-scale bulk RNA-seq drug response datasets are already available. Leveraging these abundant datasets to train DL models, which is a data-driven method, and applying transfer learning to adapt the models to single-cell RNA-seq data for accurate prediction and mechanistic investigation, offers a promising strategy to partially overcome the current limitations caused by the scarcity of high-quality scRNA-seq drug response data.
This study systematically processed scRNA-seq drug response data and proposed a transfer learning–based framework to align drug response representations between bulk RNA-seq and scRNA-seq data (Figure 1). Specifically, we leveraged the GDSC dataset, which is a bulk RNA-seq dataset, to train a predictive model for scRNA-seq drug response. This model employed a shared encoder to project both data into a unified latent space, and the projected embeddings were utilized to predict drug responses. A sparse decoder guided by prior biological knowledge was integrated to align features with predefined biological pathways for enhancing performance and interpretability. The proposed model was evaluated across five curated scRNA-seq drug response datasets and demonstrated superior predictive performance compared to ML models. Meanwhile, we applied integrated gradients (IG) to interpret the relationship between pathways and drug response predictions. Also, we validated interpretability based on the biological information introduced via the sparse decoder. This study contributes to expanding the utility of scRNA-seq in drug response prediction and the application of DL techniques in drug response prediction.

2. Results

2.1. Data Analysis and Clustering Analysis

Details of data collection and labeling were described in Figure 1a. The five collected scRNA-seq datasets involved three cancers, including oral squamous cell carcinoma (GSE117872), melanoma (GSE108394), and breast cancer (GSE131984, GSE156246_BT474, and GSE156246_HCC1419). These datasets involved four drugs (cisplatin, paclitaxel, PLX-4720, and lapatinib) including two chemotherapeutic agents and two targeted therapies, as shown in Table 1. More datasets that do not have corresponding entries in the GDSC database can be found in Supplementary Material S1.
We retrieved corresponding drug response data for these four drugs from the GDSC database (bulk RNA-seq) to construct training sets for predicting drug response. In the drug response dataset of GDSC, the number of cell lines tested for each drug varies, typically ranging from 735 to 903. Datasets include half maximal inhibitory concentration (IC50) (lower values indicate stronger drug efficacy and higher sensitivity) and the area under the dose–response curve (AUC) (lower values indicate higher drug sensitivity). In this study, we used the AUC value as the indicator of drug response. It was employed to define positive and negative samples in the training sets and to train four corresponding binary classifiers of drug response for four drugs, respectively.
We then performed clustering analysis on the collected five collected scRNA-seq drug response datasets with AttentionAE-sc [33], which is our previously proposed method. The clustering results were used to distinguish drug-sensitive and drug-resistant cell subpopulations, serving as a basis for data filtering. To quantitatively evaluate the clustering performance, we computed the average silhouette width (ASW) as an internal validation metric. A higher ASW score indicates better clustering quality, characterized by greater separation between clusters and higher compactness within clusters. Additionally, we visualized the clustering results via Uniform Manifold Approximation and Projection (UMAP).
The results are shown in Figure 2. Across all datasets, the model achieved ASW scores above 0.75. Specifically, four datasets had ASW scores greater than 0.8, reflecting well-separated and internally coherent clusters. These results suggest that the model effectively captures meaningful transcriptional differences between drug-sensitive and drug-resistant subpopulations. This provides a strong foundation for subsequent drug response labeling and downstream prediction tasks. A comparison with other clustering methods is provided in Supplementary Material S2.

2.2. Performance Evaluation

To evaluate the performance of our model on scRNA-deq test sets, we compared it with several widely used ML algorithms. These included logistic regression (LR), support vector machine (SVM), decision tree (DT), RF, and gradient boosting (GB) and eXtreme Gradient Boosting (XGBoost.)
As shown in Figure 3, our model achieved the best performance across the four scRNA-seq drug response prediction tasks. It reached an average accuracy of 0.668 and an average F1 score of 0.676, outperformed LR (0.463 and 0.550), SVM (0.604 and 0.302), DT (0.519 and 0.322), RF (0.448 and 0.335), GB (0.578 and 0.448), and XGBoost (0.491 and 0.236). Although the SVM model slightly outperformed our method in predicting drug response for Cisplatin, the performance gap was marginal (accuracy of 0.730 vs. 0.726, F1 score of 0.844 vs. 0.841) and our model outperformed all other ML models on predicting drug response for Cisplatin. Moreover, our model achieved superior results on the remaining three drugs compared to all ML models. Notably, five ML models yielded an F1 score of 0 in at least one task, particularly on the Lapatinib_BT474 and Paclitaxel datasets. In contrast, our model maintained consistently high performance across all tasks. This further demonstrates the robustness of our model, especially in handling complex scRNA-seq data and imbalanced datasets.

2.3. Impact of Key Hyperparameters on Model Performance

To optimize the predictive performance of our model, we tuned several key hyperparameters that had a significant impact on model performance. Notably, since both the Lapatinib_BT474 and Lapatinib_HCC1419 datasets involve the same drug, they were merged to investigate how individual hyperparameters affect the model’s performance in predicting drug responses for Lapatinib.
For a given pathway, only a specific subset of genes is typically expressed. As a result, the corresponding row in the mask matrix of the sparse decoder is dominated by 0. To prevent the decoder from becoming excessively sparse, which may impair its ability to learn meaningful representations and to capture pathway-level prior biological knowledge, we applied a threshold to exclude pathways with an insufficient number of associated genes. Figure 4a presents the model’s validation performance across multiple datasets using Gene Ontology (GO) [34] pathway data under various pathways thresholds.
Given the limited size of each classification training dataset, we only randomly selected 10% of the samples as a validation set for hyperparameter tuning. Each experiment was repeated five times with different random seeds, and the average results were calculated.
The results show that for the Cisplatin and Paclitaxel datasets, the best predictive performance was achieved when the threshold was set to 10. In contrast, the PLX-4720 dataset performed better with a threshold of 2. For the Lapatinib dataset, although thresholds of 2 and 4 both yielded accuracy values above 0.7, the model achieved a higher F1 score when the threshold was set to 4.
Other hyperparameters that influenced model performance included the number of highly variable genes (HVGs), and the dropout ratio used in the neural network. The effects of these two hyperparameters on model performance are shown in Figure 4a,b.
For the number of HVG, we tested several values and observed that the optimal setting varied slightly across datasets. Specifically, for the Paclitaxel dataset, the model achieved better accuracy and F1 score when HVG was set to 3000. For the other three drugs (Cisplatin, PLX-4720, and Lapatinib), the best validation performance was consistently observed when the number of HVG was set to 2500. This setting provided a favorable trade-off between retaining informative gene expression signals and avoiding overfitting due to noise or redundant features.
As for the dropout rate, we evaluated values ranging from 0.1 to 0.9. The model demonstrated robust performance when the dropout rate was set between 0.1 and 0.4. These results suggest that moderate dropout regularization was beneficial for enhancing the generalization ability of the models.
In addition, we also compared the different pathway information in constructing the sparse decoder. Commonly used biological pathway resources include GO [34], Reactome [35], and Hallmark [36]. GO encompasses all levels of biological systems, from molecular activities to complex cellular and organismal-level networks, offering reliable information of pathways. Reactome is a manually curated database of metabolic and pathways, while Hallmark contains 50 curated, non-redundant gene sets specifically designed for gene set enrichment analysis.
We evaluated the predictive performance of our model with sparse decoders constructed from this three different pathway information on the test set GSE117872. For all pathway information, the minimum gene count threshold was fixed at 10. As shown in Table 2, the results indicated that the decoder based on the pathways information from GO achieved the best predictive performance among the three, demonstrating its suitability for modeling scRNA-seq drug response in this context.

2.4. Analysis of Modeling Strategies

To evaluate the importance of each module in the proposed model and its contribution to predictive performance, we conducted an ablation study and compared the effects of different strategies for aligning data across sequencing platforms on model performance.
The comparison includes a baseline model consisting of a naive autoencoder without transfer learning (base AE) followed by a multilayer perceptron classifier. To explore the impact of transfer learning, we further examined a previously proposed approach based on autoencoder integrated with generative adversarial networks (adv AE), which was originally proposed to align transcriptomic data between in vitro cell lines and in vivo clinical samples. Beyond these basic components, we further examined the performance of base AE and adv AE when combined with a shared encoder module (share AE). Finally, we assessed the full model (ours), which integrates the shared encoder with a pathway guidance (share AE + pathways).
The experimental results on the test set GSE117872 are summarized in Table 3. We observed that the incorporation of generative adversarial networks and a shared encoder significantly improved model performance. Our model, which integrated a sparse decoder to introduce pathway-level prior biological knowledge, outperformed other methods and achieved substantial improvements over the base AE. These results demonstrate that incorporating transfer learning strategies notably enhances performance. Furthermore, the addition of pathway-level guidance not only improves model interpretability but also contributes to improved accuracy.
As shown in Figure 5, we also observed that introducing a generative adversarial strategy into the model made training more difficult and increased the risk of overfitting. This observation contrasts with the findings reported in CODE-AE-ADV, where a generative adversarial strategy is effectively applied to align in vitro and in vivo data.

2.5. Pathways Attribution

Using the test set Lapatinib_BT474 as an example, we visualized the prediction results and conducted an in-depth interpretability analysis with an external interpretability algorithm to analyze the latent embeddings generated by autoencoder, which is incorporated with pathway information.
Specifically, we employed IG [37] to quantify the contribution of each pathway to the drug response prediction. IG is an interpretability technique that aims to attribute model’s predictions to its input features and is widely used to assess feature importance in DL models [38,39,40]. In our implementation, we calculated the mean absolute of IG values for each pathway to evaluate the influences of pathways on the prediction. A value close to 0 indicates less influence on the final prediction, while a higher absolute value reflects a stronger contribution. The results of IG were shown in Figure 6a. Based on this analysis, we identified the top 12 most influential features (i.e., those with the largest absolute IG values), which correspond to the pathways most relevant to the drug-response prediction, as illustrated in Figure 6b. Among these 12 pathways, 10 were predefined pathways based on prior biological knowledge, while the remaining 2 were additional dimensions specifically introduced in model to capture auxiliary pathway information. Of the 12 selected pathways, 7 exhibited positive contributions, aligning with predictions of sensitive cells, while 5 showed negative contributions across most samples, potentially indicating association with drug resistance mechanisms. Also, as shown in Figure 6c, UMAP visualization based on the top 12 pathways demonstrated that both of scRNA-seq and bulk RNA-seq were projected into the same low-dimensional space with similar distributions, indicating a high degree of consistency. This further supports the effectiveness of the selected top 12 pathways.
The contributions of these 12 pathways to individual samples were visualized in Figure 6b. It can be observed that each pathway exhibits relatively consistent attribution values across all samples. Notably, pathways 96, 75, 329, and 185 showed attribution patterns that aligned with the ground truth drug response labels. These pathways contributed positively to the predictions of sensitive cells, while their contributions to resistant cells remained close to 0. In contrast, pathways 244, 67, 428, and 426 exhibited predominantly negative contributions across nearly all samples, regardless of their actual response labels, suggesting a potential suppressive role in the prediction process.
To further interpret the learned features, we analyzed 10 predefined pathways by examining their associated GO terms. Notably, the 96th dimension (ranked first by IG) and the 185th dimension (ranked eleventh by IG) were associated with GOCC CASPASE COMPLEX and GOCC CULLIN RING UBIQUITIN LIGASE COMPLEX, respectively. These pathways are related to drug sensitivity mechanisms. The former is a protein complex that contains one or more cysteine-type endopeptidases, which may be involved in apoptotic processes. The latter is part of a protein degradation pathway mediated by the Cullin-RING ubiquitin ligase complex [41,42]. The high attribution scores of these pathways suggest that the model captured the potential association between drug sensitivity and GO pathways information during training.
We also identified four dimensions associated with pathways involved in drug resistance mechanisms. The 237th dimension (ranked second by IG) and the 55th dimension (ranked tenth) correspond to GOCC CALCIUM CHANNEL COMPLEX and GOCC ENDOPLASMIC RETICULUM LUMEN, respectively, both of which are linked to metabolic stress and cellular stress responses. The former is an ion channel complex through calcium ions pass, while the latter is the volume enclosed by the membranes of the endoplasmic reticulum. In addition, the 75th dimension (ranked third) and the 67th dimension (ranked sixth) are associated with GOCC MICROTUBULE and GOCC MICROTUBULE ORGANIZING CENTER, respectively, which are related to cytoskeletal dynamics and cell cycle arrest. The former is the microtubule, while the latter is the microtubule-organizing center, both of which are part of the cytoskeleton of eukaryotic cells [41,42]. These pathway associations further support the model’s ability to learn potential features and knowledge of drug resistance through GO pathways information.

3. Discussion

In this study, we collected and curated scRNA-seq drug response datasets. Five datasets were selected for testing, which cover three cancers and four cancer-related drugs. The DL clustering model, AttentionAE-sc, was applied to process the collected data. The clustering results were utilized to exclude normal cells and cells in the control group that exhibit genetic resistance. In addition, high-quality labeling was achieved by incorporating prior biological knowledge derived from published literature. To validate the effectiveness of AttentionAE-sc, we analyzed its clustering results, which yielded ASW scores above 0.75 across all datasets, indicating highly reliable clustering performance.
We utilized these five scRNA-seq datasets as testing data and their corresponding bulk RNA-seq data from the GDSC as training data to construct a drug response predictive model. Compared with ML models, the proposed DL model demonstrated superior performance across five drug response datasets. Our model attained an average accuracy of 0.668 and an average F1 score of 0.676. In comparison, the worst-performing ML model in accuracy was LR, which achieved 0.463 for accuracy and 0.550 for F1 score. Our model outperformed it by 0.205 and 0.126, respectively. The best-performing ML model in accuracy was SVM, which achieved 0.604 and 0.302 in accuracy and F1 score, our model showed improvements of 0.064 and 0.374. Regarding F1 score, the worst-performing ML model was XGBoost, with 0.491 for accuracy and 0.236 for F1 score. Our model surpassed it by 0.177 and 0.440, respectively. Compared to the best-performing model in F1 score, LR (0.463 and 0.550), our model achieved notable gains of 0.205 in accuracy and 0.126 in F1 score. The SVM model slightly outperformed our method in predicting drug response for Cisplatin, which may be attributed to the relative simplicity of this dataset (the feature differences between positive and negative samples are pronounced). As a result, all models achieved strong performance on this dataset. Since SVMs are designed to separate samples using an optimal hyperplane, they tend to excel on binary classification tasks with clear class boundaries and their slight advantage is unsurprising.
Our model exhibited relatively consistent accuracy and F1 scores across all datasets, suggesting improved stability and a stronger ability to capture latent patterns in gene expression related to drug response that are not well detected by ML models. Meanwhile, we observed that several ML models yielded an F1 score of 0 on some datasets. Subsequent analysis revealed that this was caused by a recall value of 0, suggesting that these models classified all samples as negative (resistant). This outcome reflects a failure to learn the underlying associations between transcriptomic features and drug response. The recurrence of such issues across multiple ML models further highlights the advantages of DL in accurately predicting drug response and its ability to interpret latent biological features and relationships.
We developed a shared autoencoder framework incorporating biological pathway information to explore the potential of transfer learning between bulk RNA-seq and scRNA-seq drug response datasets. We found that introducing pathway-level prior biological knowledge and employing a transfer learning strategy significantly enhanced model performance. Notably, Gene Ontology (GO) pathways provided the most reliable source of biological knowledge in our experiments. Moreover, ablation experiments revealed that the inclusion of generative adversarial strategies made the model more challenging to optimize and increase the risk of overfitting. This observation contrasts with previous findings using adversarial strategies on in vitro and in vivo bulk RNA-seq data. We hypothesize that this discrepancy may arise from the larger distributional differences between scRNA-seq and bulk RNA-seq data. Specifically, scRNA-seq data typically exhibit lower total gene expression counts and higher sparsity than bulk RNA-seq data, which may demand larger training sample sizes to ensure effective adversarial optimization.
To assess the interpretability of our model, we employed IG to interpret and visualize the association between the pathway knowledge and the predicted drug response outcomes. The results indicated that integrating biological knowledge improved both the reliability and interpretability of the model. Based on IG values, we identified the top 12 pathways that had a significant impact on the predictions. Among them, we conducted detailed analysis on 10 predefined pathways of these identified pathways. The literature review revealed that two of them were associated with drug sensitivity mechanisms, while four were related to drug resistance mechanisms.
The two pathways associated with drug sensitivity were the caspase complex-mediated apoptotic pathway and the Cullin-RING ubiquitin ligase complex-mediated protein degradation pathway. Lapatinib, as a dual HER2/EGFR tyrosinase inhibitor, may competitively bind the intracellular kinase domain and selectively block HER2 downstream pathways including PI3K/AKT and MAPK, while simultaneously triggering caspase-3/9 cascade activation to induce mitochondrial-dependent apoptosis. Therefore, in HER2-overexpressing BT474 cell lines, Lapatinib may disrupt the balance between proliferation and apoptosis, shifting cells toward a drug-sensitive state. The Cullin-RING complex may also contribute to Lapatinib sensitivity by mediating degradation of prosurvival proteins [43,44].
Among the drug resistance-related pathways, two were associated with metabolic stress and cellular stress responses (calcium channel complex and endoplasmic reticulum lumen), while the other two were related to cytoskeletal dynamics and cell cycle arrest (microtubule and microtubule organizing center). Lapatinib may inhibit downstream signaling of HER2, including the PI3K/AKT pathway, resulting in decreased endoplasmic reticulum calcium pump activity. This may trigger endoplasmic reticulum stress and activate the unfolded protein response. Resistant cells may counteract this by upregulating CD36-mediated lipid uptake, which alleviates oxidative stress in endoplasmic reticulum membrane lipid. Additionally, enhanced endoplasmic reticulum associated degradation of misfolded proteins may contribute to the maintenance of proteostasis, enabling cells to withstand drug-induced stress [45,46]. Regarding the cytoskeletal-related mechanisms, HER2 signaling regulates microtubule dynamics and cell division. Lapatinib interferes with the interaction between HER2/EGFR and microtubule-associated proteins, disrupting the assembly of γ-tubulin ring complexes and leading to abnormal mitotic spindle formation. In treated cells, metabolic plasticity may enhance ATP production to maintain the activity of microtubule, thereby mitigating cytoskeletal damage induced by Lapatinib. This may potentially contribute to drug resistance [47,48].
However, our model was limited to using only gene expression data without integrating drug-specific features or biological context information (such as cancer type). This constraint limits the model’s capacity for pan-drug and pan-cancer generalization. In future work, we plan to incorporate more information, such as drug molecular structures, cancer types, and tissue-specific characteristics, with multimodal learning to enhance prediction performance across diverse drugs and cancer types. Moreover, the continued expansion of available scRNA-seq drug response datasets will support the development of a more generalized and robust predictive framework.

4. Materials and Methods

4.1. Data Collection and Processing

4.1.1. Collection

The Gene Expression Omnibus (GEO, https://www.ncbi.nlm.nih.gov/geo/, accessed on 1 November 2024) [49], a public functional genomics data repository maintained by National Center for Biotechnology Information (NCBI), contains high-throughput transcriptomic data submitted by institutions worldwide. In this study, we conducted retrieval and filter based on the following keywords and criteria: based on scRNA-seq platforms; inclusion of control group; exclusion of radiotherapy; exclusion of combination therapy; and drug-treated experimental groups receiving doses and treatment durations sufficient to induce drug resistance.
We retrieved corresponding drug response data for these datasets from the GDSC database (bulk RNA-seq) based on matched drugs and cell lines. Both bulk RNA-seq and scRNA-seq data were used during the pretraining phase to train the autoencoder, aiming to obtain a shared encoder to map both data types into a unified latent space. Subsequently, during the classifier training phase for drug response prediction, bulk RNA-seq data were used as the training and validation sets, while scRNA-seq datasets served as the test set. The classifier trained on bulk RNA-seq was directly transferred to predict on single-cell data to fully leverage the abundance of bulk data and compensate for the current scarcity of scRNA-seq drug response data.

4.1.2. Labeling Strategy for Drug Response

Previous studies on scRNA-seq drug response have typically labeled drug-treated groups as resistant and control group as sensitive. However, due to the presence of genetic resistance to drugs, the control group may contain subpopulations that are intrinsically insensitive to the drug. These cells need to be identified and excluded. Moreover, most in vivo experimental datasets include highly differentiated normal cells, which should also be filtered out.
To address these issues, we proposed an improved labeling strategy. Firstly, we collected individual scRNA-seq drug response datasets. Then, we performed clustering analysis using AttentionAE-sc model to identify cell clusters corresponding to resistant or sensitive states. Based on the clustering results, cells in the control group that were likely to be drug-insensitive were excluded. Subsequently, we incorporated prior biological knowledge from public resources, such as marker gene sets, to filter out highly differentiated normal cells. Furthermore, the literature was used to assign accurate drug response labels to tumor cells.
We applied AttentionAE-sc model for clustering analysis with following parameters: 2500 highly variable genes selected, eight attention heads, cell embedding dimension of 16, Leiden resolution of 0.1, and a Gaussian kernel for graph construction. The number of cells used for the model was limited to 4000. Data preprocessing followed the original pipeline, implemented using the Scanpy toolkit. In our implementation, this parameter set achieved consistently high ASW scores and yielded optimal clustering performance. However, if significantly different parameters were used, especially those resulting in a substantial decrease in clustering quality, the robustness of the exclusion step could be compromised, and downstream predictions might be adversely affected. Therefore, careful parameter tuning remains a critical consideration when applying AttentionAE-sc in similar tasks.
The detailed labeling procedure involved the following steps. First, cells in the control group that exhibited transcriptional profiles similar to those of the drug-treated group were considered having genetic resistance. Subsequently, they were excluded from the sensitive (positive) sample set. Second, subpopulations corresponding to normal cells were identified based on known marker genes and then excluded. Finally, for certain targeted therapies, drug response labels were then assigned based on literature-reported differences in drug sensitivity among the identified tumor subpopulations.

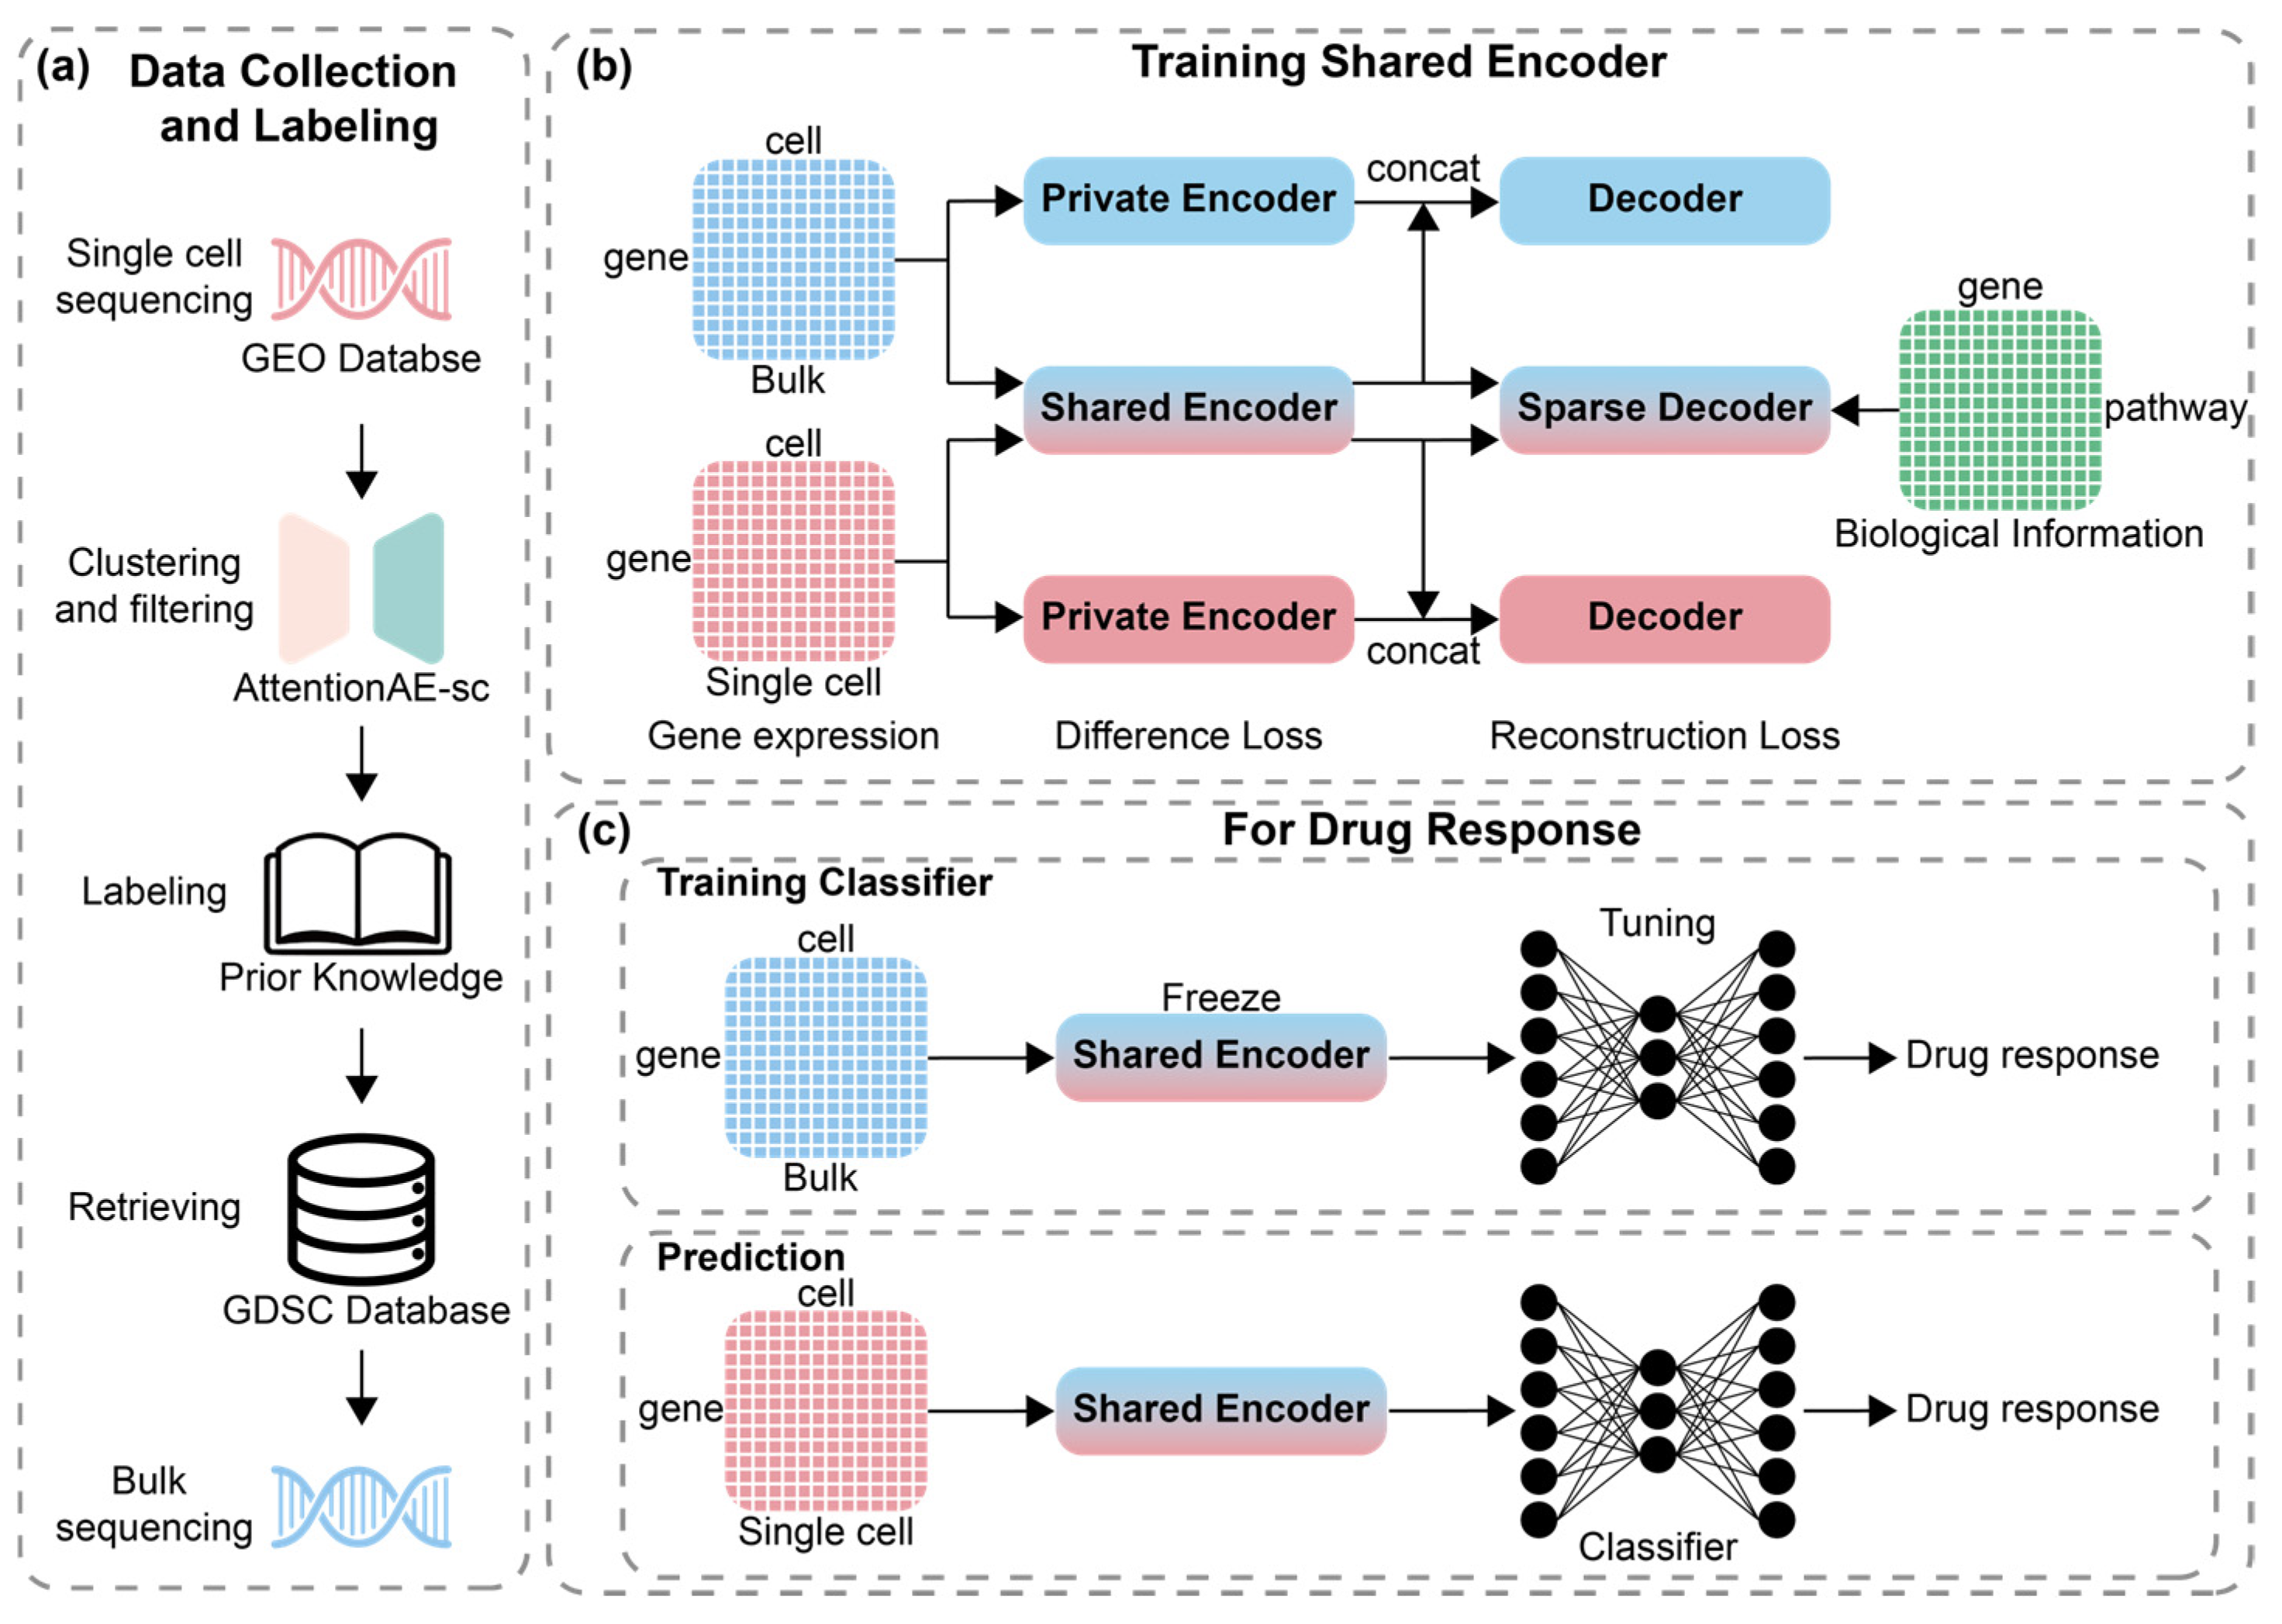
4.2. Shared Encoder for Different Sequencing Data

CODE-AE [19] was trained simultaneously on both in vitro and in vivo data, yielding a deconfounding shared encoder that aligns these two data in the latent space. Inspired by this method, we aim to leverage a shared encoder to align bulk RNA-seq and scRNA-seq data. Therefore, we adapted the architectural design and training strategies of CODE-AE. The autoencoder is composed of two encoders and a decoder. The two encoders are designed to separately process bulk and single-cell RNA-seq data, and can be described as follows:
Z s c p = R e L U ( X s c · W s c p 1 + b 1 ) · W s c p 2 + b 2 Z b u l k p = R e L U X b u l k · W b u l k p 1 + b 1 · W b u l k p 2 + b 2
Z s c s = R e L U ( X s c · W s 1 + b 1 ) · W s 2 + b 2 Z b u l k s = R e L U ( X b u l k · W s 1 + b 1 ) · W s 2 + b 2  
where Z represents the output tensors of the encoder. All the sequencing data have two output tensors: Z s of the shared encoder and Z p of the private encoder, X b u l k and X s c refer to the bulk RNA-seq and scRNA-seq data. W and b are learnable parameters, where W represents weights and b represents biases. W s refer to the shared weight of the shared encoder and is shared across both sequencing data, while W p represent the weights of the encoders separately applied to bulk and single-cell RNA-seq data. The two layers of W indicate that the encoders consist of two fully connected layers. The activation function used in the encoder is ReLU, which is defined as follows:
x = x ,   i f   x > 0 0 ,   i f   x   0
In the decoder, the two output tensors for each dataset are concatenated and passed through a decoding layer with the same structure as the encoder to reconstruct the gene expression matrices:
X s c ¯ = R e L U ( c o n c a t Z s c p ,   Z s c s · W d e c 1 + b 1 ) · W d e c 2 + b 2 X b u l k ¯ = R e L U ( c o n c a t Z b u l k p ,   Z b u l k s · W d e c 1 + b 1 ) · W d e c 2 + b 2
The reconstruction loss of the autoencoder is computed as the sum of the reconstruction losses for both datasets, using the mean squared error (MSE) with the L2 norm:
L r e c o n = X s c X s c ¯ 2 + X b u l k X b u l k ¯ 2
To guide two encoders to learn distinct features (shared and private features), we introduce an orthogonality constraint to minimize redundancy between the two embeddings:
L d i f f = Z s c p · Z s c s 2 + Z b u l k p · Z b u l k s 2
Thus, the final autoencoder loss function is defined as follows:
L A E = L r e c o n + r 1   L d i f f
where r 1 is a balancing factor for multi-objective optimization, with a default value of 0.1.

4.3. Incorporating Biological Information with Sparse Decoder

To enhance the interpretability of the autoencoder, a sparse decoder was introduced to constrain the shared encoder. Similarly to VNNs, which incorporate prior biological knowledge through sparsely connected decoding structures [50,51], the sparse decoder in our model introduce prior biological knowledge based on predefined pathway–gene associations. And the sparse decoder can be defined as follows:
X s c s p a r s e ¯ = R e L U ( Z s c s · W s p a r s e + b )
X b u l k s p a r s e ¯ = R e L U ( Z b u l k s · W s p a r s e + b )
L s p a r s e = X s c X s c s p a r s e ¯ 2 + X b u l k X b u l k s p a r s e ¯ 2
where W s p a r s e represents the sparse weight matrix with a mask, defined as W s p a r s e = W · M m a s k . The mask matrix M m a s k is constructed based on prior biological pathway information, where each row represents a biological pathway, and each column represents a gene. M m a s k consists of 1 and 0, where 1 indicates that the gene is a regulatory gene of the pathway, and 0 indicates that the gene is not associated with the pathway. To allow the model to capture information beyond the predefined biological pathways, five additional rows consisting entirely of 1 are concatenated to the mask matrix. This enables the encoder to learn latent biological patterns that are not constrained by existing predefined pathways. The output tensor Z of the encoder has a dimension equal to the number of rows in the mask matrix M m a s k . Apart from the five additional dimensions, each dimension in the latent space corresponds to a gene associated with a specific pathway.
The optimization objective for training is defined as follows:
L t r a i n = L A E + r 2   L s p a r s e
where r 2 is a balancing factor for multi-objective optimization, with a default value of 0.1.
After the autoencoder is trained, the shared encoder is used to project data from the two different sequencing platforms into a unified latent space. The resulting embeddings then serve as inputs for the drug response prediction model in both the training and inference stages.

4.4. Labels of Dataset and Training for Classifier

Label information for drug response of cell lines is required for training a predictive model of drug response. The drug response information in GDSC database includes two labels: IC50, where a lower value indicates stronger drug efficacy and higher sensitivity and AUC, where a lower value indicates greater sensitivity to treatment). Both of them are continuous, which need to be converted to discrete for training a classification model. To achieve this, we adopted an extreme value selection strategy to discretize the labels. Specifically, for each drug, cell lines were ranked based on AUC values, and a threshold parameter k (0 < k < 0.5) was defined. The top k fraction of cell lines with the lowest AUC values was labeled as sensitive (y = 1), while the top k fraction with the highest AUC values was labeled as resistant (y = 0). The drug response prediction model is constructed with a three-layer neural network classifier, as follows:
H = R e L U ( R e L U ( Z · W 1 + b 1 ) · W 2 + b 2 )
y p r e d = S i g m o i d ( H · W + b )
where the first two layers use the ReLU as the activation function, and H represents the output tensor of the second layer. The final layer employs the Sigmoid activation function to map the output to the range [0, 1], which is defined as follows:
S i g m o i d x = 1 1 + e x
The cross-entropy loss was used for training:
L = 1 N i = 1 N y i l o g y p r e d i + 1 y i log 1 y p r e d i
where y i represents the label of the i-th sample, y p r e d i represents the predicted probability for the i-th sample, and N is the total number of samples.

4.5. Model Performance Evaluation Metrics

We adopted accuracy and F1 scores to evaluate the predictive performance of the classification model. Accuracy measures the overall correctness of predictions and serves as a general indicator of model performance. However, in imbalanced datasets (the number of positive and negative samples differs significantly) accuracy alone may not adequately reflect the model’s ability to correctly identify the minority class. To address this limitation, we utilized the F1 score, which considers both precision and recall. Precision is defined as the proportion of true positive predictions among all samples predicted as positive, while recall represents the proportion of true positives that are correctly identified among all actual positive samples. The F1 score is the harmonic mean of precision and recall; it penalizes models heavily when either precision or recall is low, making it particularly suitable for evaluating models on imbalanced datasets. These metrics are defined as follows:
Accuracy = TP + TN TP + TN + FP + FN
precision = TP TP + FP
recall   rate = TP TP + FN
F 1   score = 2 × precision × recall   rate precision + recall   rate = 2 TP 2 TP + FP + FN
TP (true positives) refers to the number of samples that are correctly predicted as positive and are indeed positive. TN (true negatives) refers to the number of samples that are correctly predicted as negative and are indeed negative. In contrast, FP (false positives) denotes the number of samples whose true label is negative but are incorrectly predicted as positive, and FN (false negatives) denotes the number of samples whose true label is positive but are incorrectly predicted as negative.

5. Conclusions

In conclusion, this study systematically collected and curated scRNA-seq drug response datasets and proposed a robust and interpretable DL model for predicting drug responses in scRNA-seq by leveraging transfer learning from bulk RNA-seq. These advances may contribute to the development of precision medicine and enhance understanding of mechanisms in cancer. However, our model is limited to single-drug prediction, primarily due to the scarcity of available data. Future work will aim to expand the diversity and scale of annotated datasets and explore multimodal learning approaches by incorporating additional features, such as drug structures. These efforts may further enable the development of predicting responses to multiple drugs and drug combinations using scRNA-seq data.

Supplementary Materials

The following supporting information can be downloaded at: https://www.mdpi.com/article/10.3390/ijms26094365/s1. References [52,53] are cited in the Supplementary Materials.

Author Contributions

Conceptualization, Z.W.; methodology, Y.H. and S.L.; validation, Y.H., S.L. and H.L.; investigation, Z.W. and Y.H.; data curation, H.L., W.L. and S.Z.; writing—original draft preparation, Y.H.; writing—review and editing, Z.W. and M.L.; supervision, Z.W. and M.L. All authors have read and agreed to the published version of the manuscript.

Funding

This research was funded by National Natural Science Foundation of China (Grant No. 22173065).

Institutional Review Board Statement

Not applicable.

Informed Consent Statement

Not applicable.

Data Availability Statement

All data used in this study were originally obtained from Gene Expression Omnibus (GEO, https://www.ncbi.nlm.nih.gov/geo/, accessed on 1 November 2024) and Genomics of Drug Sensitivity in Cancer (GDSC, https://www.cancerrxgene.org/, accessed on 1 December 2024). The collected and curated datasets are available on Figshare (10.6084/m9.figshare.28888880). The model code is available on GitHub (https://github.com/FEIFEIEIAr/bulk2single-cell, accessed on 1 November 2024).

Conflicts of Interest

The authors declare no conflicts of interest.

Abbreviations

The following abbreviations are used in this manuscript:
scRNA-seqSingle-cell RNA sequencing
DLDeep learning
MLMachine learning
RFRandom forest
VNNVisible neural network
bulk RNA-seqBulk RNA sequencing
GDSCGenomics of Drug Sensitivity in Cancer
IGIntegrated gradients
IC50Half maximal inhibitory concentration
AUCThe area under the dose–response curve
ASWAverage silhouette width
UMAPUniform Manifold Approximation and Projection
LRLogistic regression
SVMSupport vector machine
DTDecision tree
RFRandom forest
GBGradient boosting
XGBoosteXtreme Gradient Boosting
GOGene ontology
HVGHighly variable gene
GEOGene Expression Omnibus

References

  1. Shen, S.; Vagner, S.; Robert, C. Persistent Cancer Cells: The Deadly Survivors. Cell 2020, 183, 860–874. [Google Scholar] [CrossRef] [PubMed]
  2. Pu, Y.; Li, L.; Peng, H.; Liu, L.; Heymann, D.; Robert, C.; Vallette, F.; Shen, S. Drug-Tolerant Persister Cells in Cancer: The Cutting Edges and Future Directions. Nat. Rev. Clin. Oncol. 2023, 20, 799–813. [Google Scholar] [CrossRef]
  3. Zheng, H.-C. The Molecular Mechanisms of Chemoresistance in Cancers. Oncotarget 2017, 8, 59950–59964. [Google Scholar] [CrossRef]
  4. Dagogo-Jack, I.; Shaw, A.T. Tumour Heterogeneity and Resistance to Cancer Therapies. Nat. Rev. Clin. Oncol. 2018, 15, 81–94. [Google Scholar] [CrossRef] [PubMed]
  5. Rocha, C.R.R.; Silva, M.M.; Quinet, A.; Cabral-Neto, J.B.; Menck, C.F.M. DNA Repair Pathways and Cisplatin Resistance: An Intimate Relationship. Clinics 2018, 73, e478s. [Google Scholar] [CrossRef]
  6. Bailey, C.; Shoura, M.J.; Mischel, P.S.; Swanton, C. Extrachromosomal DNA—Relieving Heredity Constraints, Accelerating Tumour Evolution. Ann. Oncol. 2020, 31, 884–893. [Google Scholar] [CrossRef] [PubMed]
  7. Guo, Q.; Jin, Y.; Chen, X.; Ye, X.; Shen, X.; Lin, M.; Zeng, C.; Zhou, T.; Zhang, J. NF-κB in Biology and Targeted Therapy: New Insights and Translational Implications. Signal Transduct. Target. Ther. 2024, 9, 53. [Google Scholar] [CrossRef]
  8. Yang, P.-L.; Liu, L.-X.; Li, E.-M.; Xu, L.-Y. STAT3, the Challenge for Chemotherapeutic and Radiotherapeutic Efficacy. Cancers 2020, 12, 2459. [Google Scholar] [CrossRef]
  9. Liu, R.; Chen, Y.; Liu, G.; Li, C.; Song, Y.; Cao, Z.; Li, W.; Hu, J.; Lu, C.; Liu, Y. PI3K/AKT Pathway as a Key Link Modulates the Multidrug Resistance of Cancers. Cell Death Dis. 2020, 11, 797. [Google Scholar] [CrossRef]
  10. Zhong, C.; Jiang, W.-J.; Yao, Y.; Li, Z.; Li, Y.; Wang, S.; Wang, X.; Zhu, W.; Wu, S.; Wang, J.; et al. CRISPR Screens Reveal Convergent Targeting Strategies against Evolutionarily Distinct Chemoresistance in Cancer. Nat. Commun. 2024, 15, 5502. [Google Scholar] [CrossRef]
  11. Gómez Tejeda Zañudo, J.; Barroso-Sousa, R.; Jain, E.; Jin, Q.; Li, T.; Buendia-Buendia, J.E.; Pereslete, A.; Abravanel, D.L.; Ferreira, A.R.; Wrabel, E.; et al. Exemestane plus Everolimus and Palbociclib in Metastatic Breast Cancer: Clinical Response and Genomic/Transcriptomic Determinants of Resistance in a Phase I/II Trial. Nat. Commun. 2024, 15, 2446. [Google Scholar] [CrossRef] [PubMed]
  12. Backes, C.; Sedaghat-Hamedani, F.; Frese, K.; Hart, M.; Ludwig, N.; Meder, B.; Meese, E.; Keller, A. Bias in High-Throughput Analysis of miRNAs and Implications for Biomarker Studies. Anal. Chem. 2016, 88, 2088–2095. [Google Scholar] [CrossRef]
  13. Zhou, J.; Cipriani, A.; Liu, Y.; Fang, G.; Li, Q.; Cao, Y. Mapping Lesion-Specific Response and Progression Dynamics and Inter-Organ Variability in Metastatic Colorectal Cancer. Nat. Commun. 2023, 14, 417. [Google Scholar] [CrossRef]
  14. Gao, X.; Shen, W.; Ning, J.; Feng, Z.; Hu, J. Addressing Patient Heterogeneity in Disease Predictive Model Development. Biometrics 2022, 78, 1045–1055. [Google Scholar] [CrossRef] [PubMed]
  15. Menden, M.P.; Iorio, F.; Garnett, M.; McDermott, U.; Benes, C.H.; Ballester, P.J.; Saez-Rodriguez, J. Machine Learning Prediction of Cancer Cell Sensitivity to Drugs Based on Genomic and Chemical Properties. PLoS ONE 2013, 8, e61318. [Google Scholar] [CrossRef] [PubMed]
  16. Carli, F.; Di Chiaro, P.; Morelli, M.; Arora, C.; Bisceglia, L.; De Oliveira Rosa, N.; Cortesi, A.; Franceschi, S.; Lessi, F.; Di Stefano, A.L.; et al. Learning and Actioning General Principles of Cancer Cell Drug Sensitivity. Nat. Commun. 2025, 16, 1654. [Google Scholar] [CrossRef]
  17. Sharifi-Noghabi, H.; Zolotareva, O.; Collins, C.C.; Ester, M. MOLI: Multi-Omics Late Integration with Deep Neural Networks for Drug Response Prediction. Bioinformatics 2019, 35, i501–i509. [Google Scholar] [CrossRef]
  18. Wang, Y.; Yang, Y.; Chen, S.; Wang, J. DeepDRK: A Deep Learning Framework for Drug Repurposing through Kernel-Based Multi-Omics Integration. Brief. Bioinform. 2021, 22, bbab048. [Google Scholar] [CrossRef]
  19. He, D.; Liu, Q.; Wu, Y.; Xie, L. A Context-Aware Deconfounding Autoencoder for Robust Prediction of Personalized Clinical Drug Response from Cell-Line Compound Screening. Nat. Mach. Intell. 2022, 4, 879–892. [Google Scholar] [CrossRef]
  20. Kuenzi, B.M.; Park, J.; Fong, S.H.; Sanchez, K.S.; Lee, J.; Kreisberg, J.F.; Ma, J.; Ideker, T. Predicting Drug Response and Synergy Using a Deep Learning Model of Human Cancer Cells. Cancer Cell 2020, 38, 672–684.e6. [Google Scholar] [CrossRef]
  21. Huang, X.; Huang, K.; Johnson, T.; Radovich, M.; Zhang, J.; Ma, J.; Wang, Y. ParsVNN: Parsimony Visible Neural Networks for Uncovering Cancer-Specific and Drug-Sensitive Genes and Pathways. NAR Genom. Bioinform. 2021, 3, lqab097. [Google Scholar] [CrossRef] [PubMed]
  22. Liu, P.; Li, H.; Li, S.; Leung, K.-S. Improving Prediction of Phenotypic Drug Response on Cancer Cell Lines Using Deep Convolutional Network. BMC Bioinform. 2019, 20, 408. [Google Scholar] [CrossRef]
  23. Liu, Q.; Hu, Z.; Jiang, R.; Zhou, M. DeepCDR: A Hybrid Graph Convolutional Network for Predicting Cancer Drug Response. Bioinform. Oxf. Engl. 2020, 36, i911–i918. [Google Scholar] [CrossRef] [PubMed]
  24. Jiang, L.; Jiang, C.; Yu, X.; Fu, R.; Jin, S.; Liu, X. DeepTTA: A Transformer-Based Model for Predicting Cancer Drug Response. Brief. Bioinform. 2022, 23, bbac100. [Google Scholar] [CrossRef]
  25. Wu, Z.; Lawrence, P.J.; Ma, A.; Zhu, J.; Xu, D.; Ma, Q. Single-Cell Techniques and Deep Learning in Predicting Drug Response. Trends Pharmacol. Sci. 2020, 41, 1050–1065. [Google Scholar] [CrossRef] [PubMed]
  26. Chang, M.T.; Shanahan, F.; Nguyen, T.T.T.; Staben, S.T.; Gazzard, L.; Yamazoe, S.; Wertz, I.E.; Piskol, R.; Yang, Y.A.; Modrusan, Z.; et al. Identifying Transcriptional Programs Underlying Cancer Drug Response with TraCe-Seq. Nat. Biotechnol. 2022, 40, 86–93. [Google Scholar] [CrossRef]
  27. Yang, W.; Soares, J.; Greninger, P.; Edelman, E.J.; Lightfoot, H.; Forbes, S.; Bindal, N.; Beare, D.; Smith, J.A.; Thompson, I.R.; et al. Genomics of Drug Sensitivity in Cancer (GDSC): A Resource for Therapeutic Biomarker Discovery in Cancer Cells. Nucleic Acids Res. 2012, 41, D955–D961. [Google Scholar] [CrossRef]
  28. Subramanian, A.; Narayan, R.; Corsello, S.M.; Peck, D.D.; Natoli, T.E.; Lu, X.; Gould, J.; Davis, J.F.; Tubelli, A.A.; Asiedu, J.K.; et al. A Next Generation Connectivity Map: L1000 Platform and the First 1,000,000 Profiles. Cell 2017, 171, 1437–1452.e17. [Google Scholar] [CrossRef]
  29. McFarland, J.M.; Paolella, B.R.; Warren, A.; Geiger-Schuller, K.; Shibue, T.; Rothberg, M.; Kuksenko, O.; Colgan, W.N.; Jones, A.; Chambers, E.; et al. Multiplexed Single-Cell Transcriptional Response Profiling to Define Cancer Vulnerabilities and Therapeutic Mechanism of Action. Nat. Commun. 2020, 11, 4296. [Google Scholar] [CrossRef]
  30. Srivatsan, S.R.; McFaline-Figueroa, J.L.; Ramani, V.; Saunders, L.; Cao, J.; Packer, J.; Pliner, H.A.; Jackson, D.L.; Daza, R.M.; Christiansen, L.; et al. Massively Multiplex Chemical Transcriptomics at Single-Cell Resolution. Science 2020, 367, 45–51. [Google Scholar] [CrossRef]
  31. Abdelaal, T.; Michielsen, L.; Cats, D.; Hoogduin, D.; Mei, H.; Reinders, M.J.T.; Mahfouz, A. A Comparison of Automatic Cell Identification Methods for Single-Cell RNA Sequencing Data. Genome Biol. 2019, 20, 194. [Google Scholar] [CrossRef] [PubMed]
  32. Lähnemann, D.; Köster, J.; Szczurek, E.; McCarthy, D.J.; Hicks, S.C.; Robinson, M.D.; Vallejos, C.A.; Campbell, K.R.; Beerenwinkel, N.; Mahfouz, A.; et al. Eleven Grand Challenges in Single-Cell Data Science. Genome Biol. 2020, 21, 31. [Google Scholar] [CrossRef] [PubMed]
  33. Li, S.; Guo, H.; Zhang, S.; Li, Y.; Li, M. Attention-Based Deep Clustering Method for scRNA-Seq Cell Type Identification. PLOS Comput. Biol. 2023, 19, e1011641. [Google Scholar] [CrossRef]
  34. The Gene Ontology Consortium; Aleksander, S.A.; Balhoff, J.; Carbon, S.; Cherry, J.M.; Drabkin, H.J.; Ebert, D.; Feuermann, M.; Gaudet, P.; Harris, N.L.; et al. The Gene Ontology Knowledgebase in 2023. Genetics 2023, 224, iyad031. [Google Scholar] [CrossRef] [PubMed]
  35. Milacic, M.; Beavers, D.; Conley, P.; Gong, C.; Gillespie, M.; Griss, J.; Haw, R.; Jassal, B.; Matthews, L.; May, B.; et al. The Reactome Pathway Knowledgebase 2024. Nucleic Acids Res. 2024, 52, D672–D678. [Google Scholar] [CrossRef]
  36. Liberzon, A.; Birger, C.; Thorvaldsdóttir, H.; Ghandi, M.; Mesirov, J.P.; Tamayo, P. The Molecular Signatures Database (MSigDB) Hallmark Gene Set Collection. Cell Syst. 2015, 1, 417–425. [Google Scholar] [CrossRef]
  37. Sundararajan, M.; Taly, A.; Yan, Q. Axiomatic Attribution for Deep Networks. In Proceedings of the 34th International Conference on Machine Learning 2017, ICML’17, Sydney, NSW, Australia, 6–11 August 2017. [Google Scholar]
  38. Sayres, R.; Taly, A.; Rahimy, E.; Blumer, K.; Coz, D.; Hammel, N.; Krause, J.; Narayanaswamy, A.; Rastegar, Z.; Wu, D.; et al. Using a Deep Learning Algorithm and Integrated Gradients Explanation to Assist Grading for Diabetic Retinopathy. Ophthalmology 2019, 126, 552–564. [Google Scholar] [CrossRef]
  39. Qi, Z.; Khorram, S.; Fuxin, L. Visualizing Deep Networks by Optimizing with Integrated Gradients. Proc. AAAI Conf. Artif. Intell. 2020, 34, 11890–11898. [Google Scholar] [CrossRef]
  40. Zhuo, Y.; Ge, Z. IG2: Integrated Gradient on Iterative Gradient Path for Feature Attribution. IEEE Trans. Pattern Anal. Mach. Intell. 2024, 46, 7173–7190. [Google Scholar] [CrossRef]
  41. Mootha, V.K.; Lindgren, C.M.; Eriksson, K.-F.; Subramanian, A.; Sihag, S.; Lehar, J.; Puigserver, P.; Carlsson, E.; Ridderstråle, M.; Laurila, E.; et al. PGC-1α-Responsive Genes Involved in Oxidative Phosphorylation Are Coordinately Downregulated in Human Diabetes. Nat. Genet. 2003, 34, 267–273. [Google Scholar] [CrossRef]
  42. Subramanian, A.; Tamayo, P.; Mootha, V.K.; Mukherjee, S.; Ebert, B.L.; Gillette, M.A.; Paulovich, A.; Pomeroy, S.L.; Golub, T.R.; Lander, E.S.; et al. Gene Set Enrichment Analysis: A Knowledge-Based Approach for Interpreting Genome-Wide Expression Profiles. Proc. Natl. Acad. Sci. USA 2005, 102, 15545–15550. [Google Scholar] [CrossRef] [PubMed]
  43. Zhou, Q.; Jin, P.; Liu, J.; Li, S.; Liu, W.; Xi, S. Arsenic-Induced HER2 Promotes Proliferation, Migration and Angiogenesis of Bladder Epithelial Cells via Activation of Multiple Signaling Pathways in Vitro and in Vivo. Sci. Total Environ. 2021, 753, 141962. [Google Scholar] [CrossRef]
  44. Wang, X.; Wang, L.; Zhou, Z.; Jiang, C.; Bao, Z.; Wang, Y.; Zhang, Y.; Song, L.; Zhao, Y.; Li, X.; et al. The ATAC Complex Represses the Transcriptional Program of the Autophagy-Lysosome Pathway via Its E3 Ubiquitin Ligase Activity. Cell Rep. 2024, 43, 115033. [Google Scholar] [CrossRef] [PubMed]
  45. Feng, W.W.; Wilkins, O.; Bang, S.; Ung, M.; Li, J.; An, J.; Del Genio, C.; Canfield, K.; DiRenzo, J.; Wells, W.; et al. CD36-Mediated Metabolic Rewiring of Breast Cancer Cells Promotes Resistance to HER2-Targeted Therapies. Cell Rep. 2019, 29, 3405–3420.e5. [Google Scholar] [CrossRef] [PubMed]
  46. Guo, J.; Zhong, X.; Tan, Q.; Yang, S.; Liao, J.; Zhuge, J.; Hong, Z.; Deng, Q.; Zuo, Q. miR-301a-3p Induced by Endoplasmic Reticulum Stress Mediates the Occurrence and Transmission of Trastuzumab Resistance in HER2-Positive Gastric Cancer. Cell Death Dis. 2021, 12, 696. [Google Scholar] [CrossRef]
  47. Zhang, K.-R.; Zhang, Y.-F.; Lei, H.-M.; Tang, Y.-B.; Ma, C.-S.; Lv, Q.-M.; Wang, S.-Y.; Lu, L.-M.; Shen, Y.; Chen, H.-Z.; et al. Targeting AKR1B1 Inhibits Glutathione de Novo Synthesis to Overcome Acquired Resistance to EGFR-Targeted Therapy in Lung Cancer. Sci. Transl. Med. 2021, 13, eabg6428. [Google Scholar] [CrossRef]
  48. Figarol, S.; Delahaye, C.; Gence, R.; Doussine, A.; Cerapio, J.P.; Brachais, M.; Tardy, C.; Béry, N.; Asslan, R.; Colinge, J.; et al. Farnesyltransferase Inhibition Overcomes Oncogene-Addicted Non-Small Cell Lung Cancer Adaptive Resistance to Targeted Therapies. Nat. Commun. 2024, 15, 5345. [Google Scholar] [CrossRef]
  49. Edgar, R.; Domrachev, M.; Lash, A.E. Gene Expression Omnibus: NCBI Gene Expression and Hybridization Array Data Repository. Nucleic Acids Res. 2002, 30, 207–210. [Google Scholar] [CrossRef]
  50. Ma, J.; Yu, M.K.; Fong, S.; Ono, K.; Sage, E.; Demchak, B.; Sharan, R.; Ideker, T. Using Deep Learning to Model the Hierarchical Structure and Function of a Cell. Nat. Methods 2018, 15, 290–298. [Google Scholar] [CrossRef]
  51. Seninge, L.; Anastopoulos, I.; Ding, H.; Stuart, J. VEGA Is an Interpretable Generative Model for Inferring Biological Network Activity in Single-Cell Transcriptomics. Nat. Commun. 2021, 12, 5684. [Google Scholar] [CrossRef]
  52. Tian, T.; Wan, J.; Song, Q.; Wei, Z. Clustering Single-Cell RNA-Seq Data with a Model-Based Deep Learning Approach. Nat. Mach. Intell. 2019, 1, 191–198. [Google Scholar] [CrossRef]
  53. Wang, J.; Ma, A.; Chang, Y.; Gong, J.; Jiang, Y.; Qi, R.; Wang, C.; Fu, H.; Ma, Q.; Xu, D. scGNN Is a Novel Graph Neural Network Framework for Single-Cell RNA-Seq Analyses. Nat. Commun. 2021, 12, 1882. [Google Scholar] [CrossRef]
Figure 1. Overview of data processing and model construction. (a) Pipeline of data collection and labeling; (b) pretraining for autoencoder with both sequencing data; (c) training classifier and prediction for drug response with pretrained shared encoder.
Ijms 26 04365 g001
Figure 2. UMAP visualization of clustering results for scRNA-seq drug response datasets. UMAP: Uniform Manifold Approximation and Projection; ASW: Average silhouette width.
Ijms 26 04365 g002
Figure 3. Comparison of prediction performance in five scRNA-seq drug response datasets.
Ijms 26 04365 g003
Figure 4. The effect of three hyperparameters on model performance. (a) The effect of pathways threshold; (b) the effect of the number of highly variable genes; (c) the effect of dropout ratio.
Ijms 26 04365 g004
Figure 5. Comparison of loss between models integrating adversarial strategy and pathway into shared encoder.
Ijms 26 04365 g005
Figure 6. Presents three aspects of the interpretability analysis. (a) Results of integrated gradients for pathways; (b) heatmap of 12 most contributing pathways; (c) UMAP for both of scRNA-seq and bulk RNA-seq.
Ijms 26 04365 g006
Table 1. Summary of scRNA-seq drug response datasets and corresponding data in GDSC.
DatasetDrugNumber of Sensitive/
Resistant Cells
Number of Cells in GDSC
GSE117872Cisplatin950/352735
GSE131984Paclitaxel922/752895
GSE108394PLX-47203242/3236898
GSE156246_BT474Lapatinib714/1107903
GSE156246_HCC1419Lapatinib1584/4346903
scRNA-seq: Single-cell RNA sequencing; GDSC: Genomics of Drug Sensitivity in Cancer.
Table 2. Performance of three different pathways information resources.
Pathways Information ResourceAccuracyF1 Score
Gene Ontology0.726 ± 0.0080.841 ± 0.007
Reactome0.710 ± 0.0080.825 ± 0.007
Hallmark0.696 ± 0.0110.815 ± 0.009
Table 3. Performance of different modeling strategies.
MethodsAccuracyF1 Score
base AE0.29760.0834
adv AE0.45450.3393
base share AE0.35380.2407
adv share AE0.54870.5145
ours (share AE + pathways)0.71300.8308
Disclaimer/Publisher’s Note: The statements, opinions and data contained in all publications are solely those of the individual author(s) and contributor(s) and not of MDPI and/or the editor(s). MDPI and/or the editor(s) disclaim responsibility for any injury to people or property resulting from any ideas, methods, instructions or products referred to in the content.

