1. Introduction
Neurodegenerative diseases have emerged as the second leading cause of mortality, posing a significant threat to human health and life expectancy [
1,
2,
3]. In the brain, neuronal death represents a core pathological hallmark of neurodegenerative diseases [
4]. Neuronal cell death occurs extensively during development and pathology, where it is especially important because of the limited capacity of adult neurons to proliferate or be replaced. Apoptosis is a genetically controlled program of cell death by which a cell regulates its natural self-destruction. Neuronal apoptosis is thought to contribute to the development of a series of neurodegenerative diseases, including Alzheimer’s and Parkinson’s diseases [
5]. Moreover, the progression and severity of neurodegenerative diseases are often closely linked to an increase in neuronal apoptosis [
6]. Because of this leading role in neurodegenerative disorders, the major interest has traditionally been directed to elucidating the molecular mechanisms underlying neuronal apoptosis and devising strategies aimed at counteracting it.
Importantly, neuronal apoptosis often occurs long before the disease reaches a stage where it can be clinically diagnosed. Current diagnostic methods, such as positron emission tomography (PET) [
7], single-photon emission computed tomography (SPECT) [
8], magnetic resonance imaging (MRI) [
9], plasma marker detection [
10], fluorescent diagnostic probes [
11], and clinical observation and cognitive assessments [
12], primarily detect neurodegenerative diseases in their middle to late stages [
13,
14]. This diagnostic delay significantly narrows the therapeutic window and restricts the efficacy of available treatments. Additionally, many of these methods are time-intensive, costly, and sometimes invasive. Therefore, there is an urgent need to develop diagnostic methods that can detect neurodegenerative diseases at an earlier stage by detecting neuronal apoptosis using simpler, noninvasive, and more sensitive analytical tools.
One hallmark of apoptosis is the translocation of phosphatidylserine (PS) from the inner to the outer leaflet of the cell membrane, which serves as a key early indicator of apoptotic events [
15,
16,
17]. To leverage this early apoptotic marker, apoptotic signals can be transduced into an alternative, quantifiable output, such as a highly sensitive luciferase signal, through the in situ modification of brain cells with a signal-sensing system [
18,
19,
20]. Astrocytes, the most abundant glial cell type in the brain, play essential roles in promoting neuronal growth and survival and maintain intimate contact with neighboring neurons [
21]. We are attempting to enable real-time and precise monitoring of neuronal apoptosis by in situ reprogramming of astrocytes with an apoptosis-sensing system. This approach allows for the real-time surveillance of neuronal apoptosis within the brain, providing timely alerts on apoptotic events during the initial stages of disease progression.
In the present study, we engineered the mouse Notch1 receptor (dual-synNotch) to function as a biosensor for neuronal apoptosis. This synthetic Notch1 (synNotch) receptor is designed to be effectively and precisely activated by cell surface antigens, with a robust ability to induce the expression of downstream genes, thereby initiating a cascade response targeting cell surface antigens [
22,
23,
24]. This system is designed to specifically identify neuronal apoptosis through the ‘AND Gate’ activation mechanism, which is triggered by the simultaneous sensing of the apoptotic signal PS and the neuronal signal ganglioside Gt1b. Upon recognition of PS and Gt1b, the two receptors undergo enzymatic cleavage, releasing the cleaved intracellular transcription factors that subsequently mediate the transcription of corresponding target genes. In the present study, we chose PS as the apoptosis marker because of its well-established role as an indicator of cell apoptosis. Furthermore, Ganglioside Gt1b, a surface marker, was incorporated to distinguish neurons from other cell types, such as glial cells [
25,
26]. This dual-marker system effectively minimizes off-target activation and ensures that system activation is specifically linked to neuronal apoptosis. Upon ‘AND Gate’ activation, these astrocytes express Gaussia luciferase (Gluc), thereby reporting neuronal apoptosis. Furthermore, activated astrocytes can simultaneously express neurotrophic or neuroprotective factors such as brain-derived neurotrophic factor (BDNF), which supports neuronal survival and preserves neuronal function [
27,
28]. Thus, this engineered system facilitates both the precise detection and targeted alleviation of neuronal apoptosis, effectively combining diagnostic and therapeutic functions in a cascade-driven process.
3. Discussion
Neuronal apoptosis often precedes the onset of clinical symptoms in neurodegenerative diseases. To enable early detection, we designed and optimized the synNotch system for reprogramming astrocytes. This system is activated when engineered astrocytes simultaneously detect apoptotic and neuronal signals, leading to the expression of Gaussia luciferase and BDNF, which not only reflect the extent of neuronal apoptosis but help mitigate its progression.
The selection of appropriate markers for detecting apoptosis is critical for the accurate identification of and response to apoptosis. In our study, PS was chosen as the apoptosis marker because of its well-established role as an indicator of cell apoptosis. Notably, PS externalization on the cell surface can also occur during cellular necrosis, indicating that synNotch receptor recognition of PS may extend to detecting other forms of cell death events such as necrosis [
43,
44] in necrosis-associated neurodegenerative diseases [
45]. To enhance specificity, we incorporated Ganglioside Gt1b, a classic neuronal surface marker, to distinguish neurons from other cell types, such as glial cells. This dual-marker system effectively minimizes off-target activation and ensures that system activation is specifically linked to neuronal apoptosis.
The selection of receptors plays a pivotal role in determining the activation efficiency and sensitivity of the system. Compared with classical synthetic receptor platforms, such as chimeric antigen receptors (CAR) [
46], modular extracellular signaling architecture (MESA) system [
47], two-component systems (TCS) [
48], and the Tango system [
49,
50], the synNotch receptor exhibits distinct advantages. Its activation pathway operates orthogonally to the cell’s intrinsic signaling pathways, thereby preserving normal cellular functions. Additionally, since the synNotch receptor is derived from the endogenous Notch1 receptor in mice, it can be efficiently expressed in murine-derived cells. The results revealed that the synNotch receptor system is also characterized by its relatively simple and efficient components and activation mode, making it an ideal candidate for achieving localized and precisely controlled cytokine secretion.
Beyond receptor selection, the modification and optimization of synNotch receptor can further enhance its activation efficiency and sensitivity. In recent years, the structural modification of synthetic receptors aiming at improving activation efficiency has emerged as a key focus in the field of synthetic biology. To increase the affinity of synNotch receptors for their target markers, we incorporated Annexin A5 and the C-terminal subunit of the tetanus toxin, which exhibit high affinity for PS and Gt1b, respectively. This selection was supported by the evidence that increased ligand–receptor affinity correlates with a heightened activation intensity of the synNotch receptor [
23]. To further improve activation efficiency, we propose exploring single-chain variable fragments (scFv) or nanoantibodies with higher affinities for PS and Gt1b. Additionally, we enhanced receptor flexibility and binding capacity by linking the extracellular binding domain to the transmembrane domain using a flexible (GGGGS)
3 linker. To avoid nonspecific receptor activation, we further incorporated an intracellular hydrophobic protein sequence (QHGQLWF) named RAM7 motif into the receptor structure [
51]. Recent studies have also indicated that synthetic intramembrane proteolysis receptors (SNIPRs) generated via replacement of core fragments of synNotch may also enhance receptor activation efficiency [
52].
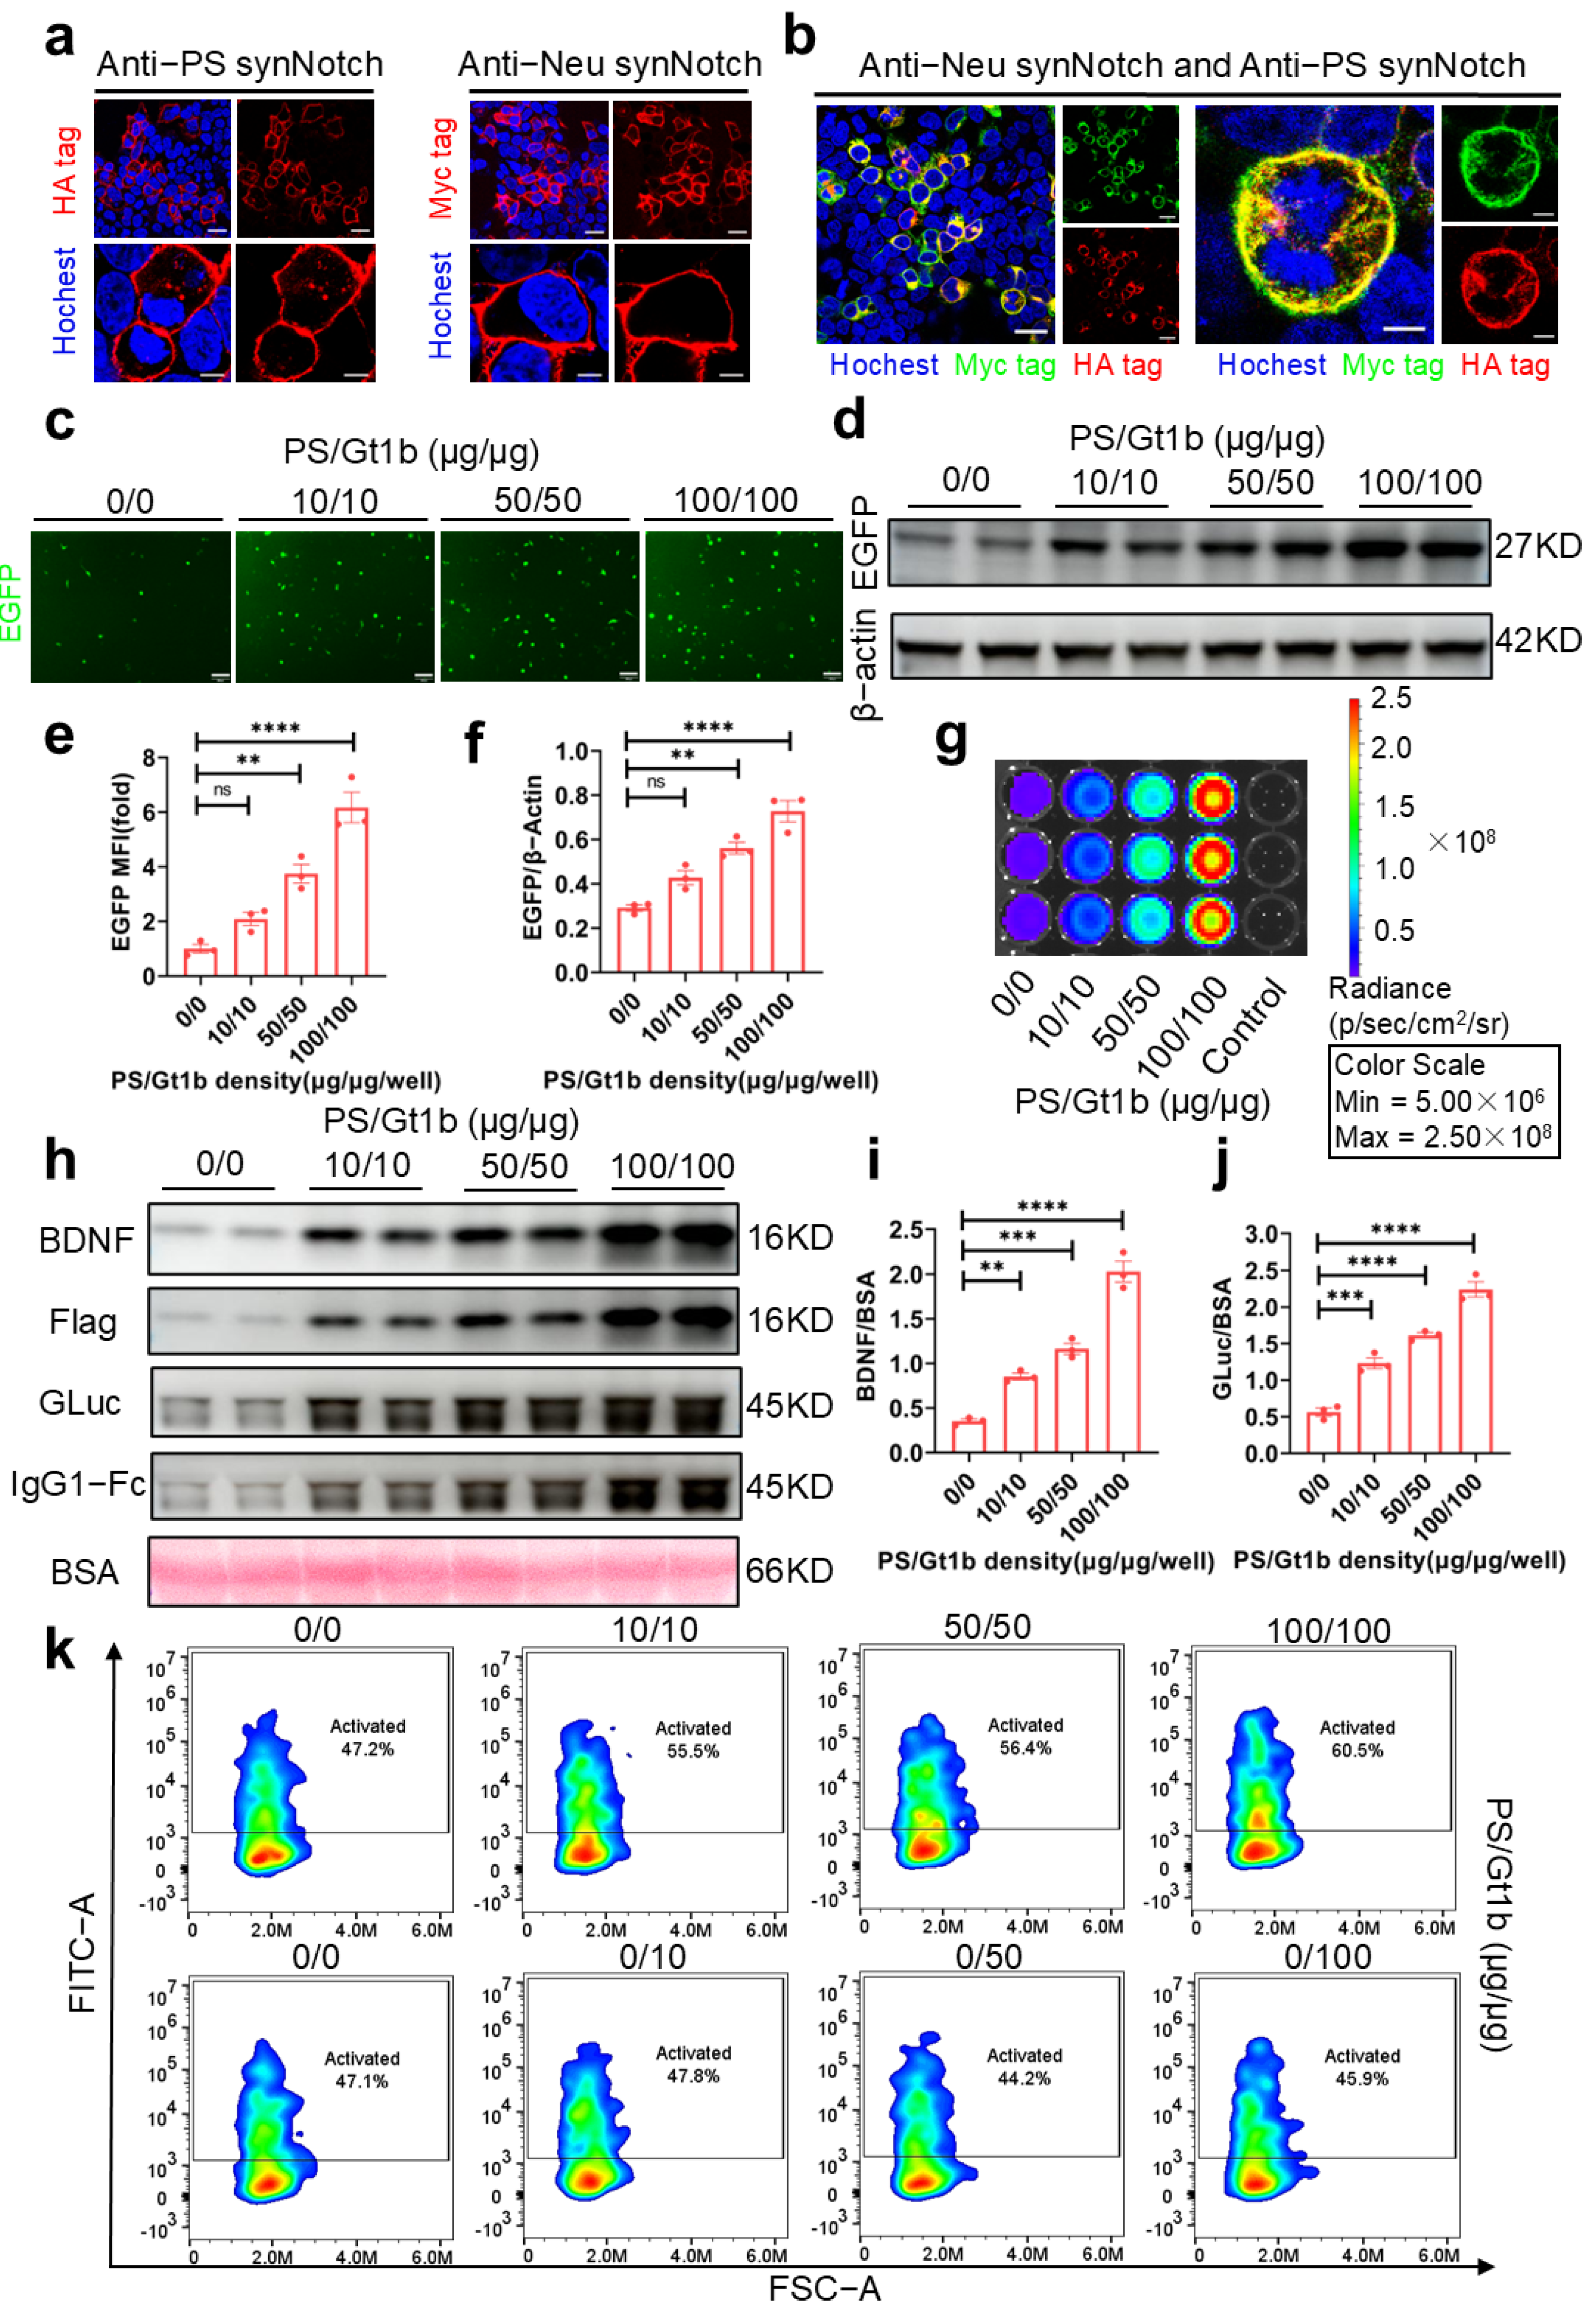
In addition to the intrinsic factors related to receptor structure, we demonstrated that the receptor expression density significantly impacted both the activation intensity and system sensitivity (
Figure 2b–d). While higher receptor density enhanced the activation intensity, it also increased nonspecific activation, thereby reducing the signal-to-noise ratio and the sensitivity of the system. Conversely, insufficient receptor density might result in the insufficient production of BDNF and luciferase, potentially falling below assay detection limits because of weak activation. Therefore, maintaining an optimal receptor density is crucial to balancing activation intensity and system sensitivity. In this study, we optimized transfection conditions to achieve enhanced sensitivity, reduced background noise, and a broader linear activation range. Importantly, the resulting BDNF and Gaussia luciferase levels met assay detection thresholds, enabling precise evaluation of neuronal apoptosis signals.
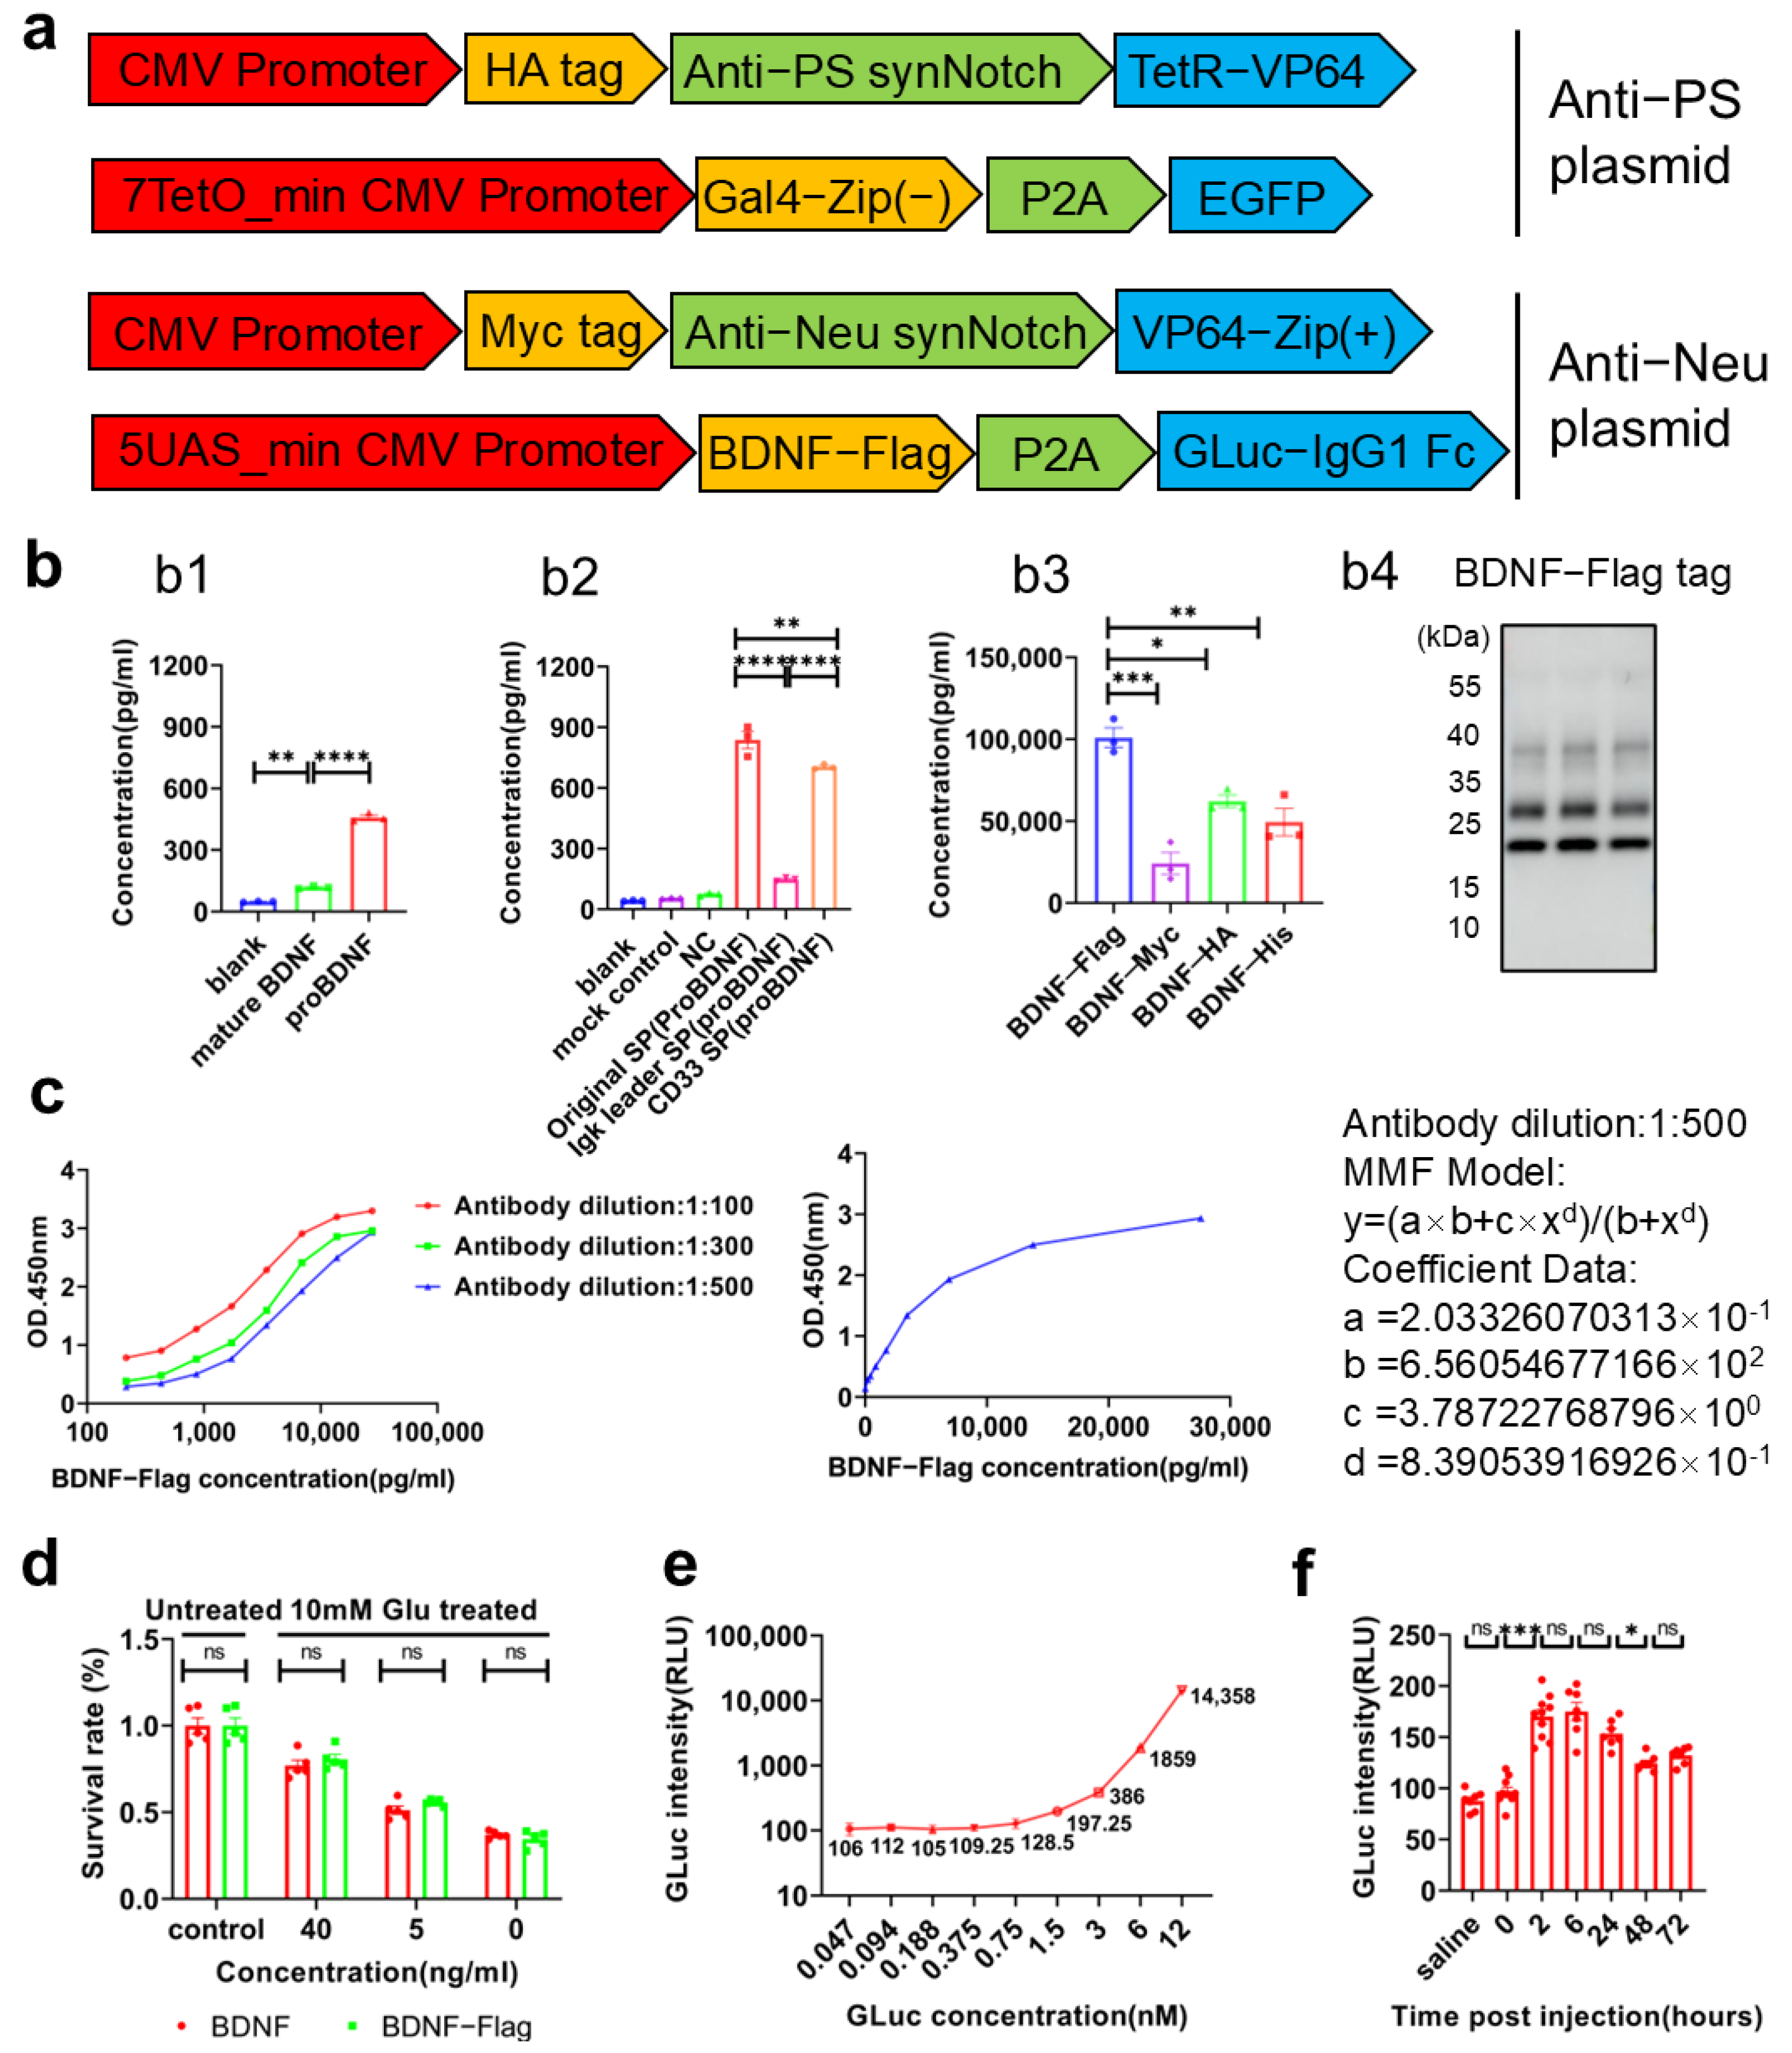
The mouse IgG1-Fc fragment, which is fused to the C-terminal of GLuc, facilitated GLuc’s crossing of the BBB into the bloodstream. By binding to the FcRn receptors on vascular endothelial cells, it also extended the half-life of GLuc, enabling more stable and convenient signal detection in bloodstream. We confirmed the expression of the GLuc-IgG1 Fc protein, its successful translocation across the BBB, and its prolonged half-life in mice (
Figure 3e). Addtionally, BDNF, produced in response to neuronal apoptosis recognition, promotes neuronal survival and inhibits apoptosis, thus fulfilling dual functions of detection and therapy (
Figure 3c). Given the dynamic equilibrium between BDNF in the central nervous system (CNS) and peripheral blood [
53], measuring activated BDNF in peripheral blood could also serve as an indicator of neuronal apoptosis. However, detecting BDNF is inherently more complex and costly than measuring luciferase. To effectively distinguish activated BDNF from its wild-type form, we constructed a recombinant Flag tag fused BDNF protein (
Figure 3a) and developed a high-sensitivity double-antibody sandwich ELISA detection system to enable precise quantification of activated BDNF (
Figure 3b).
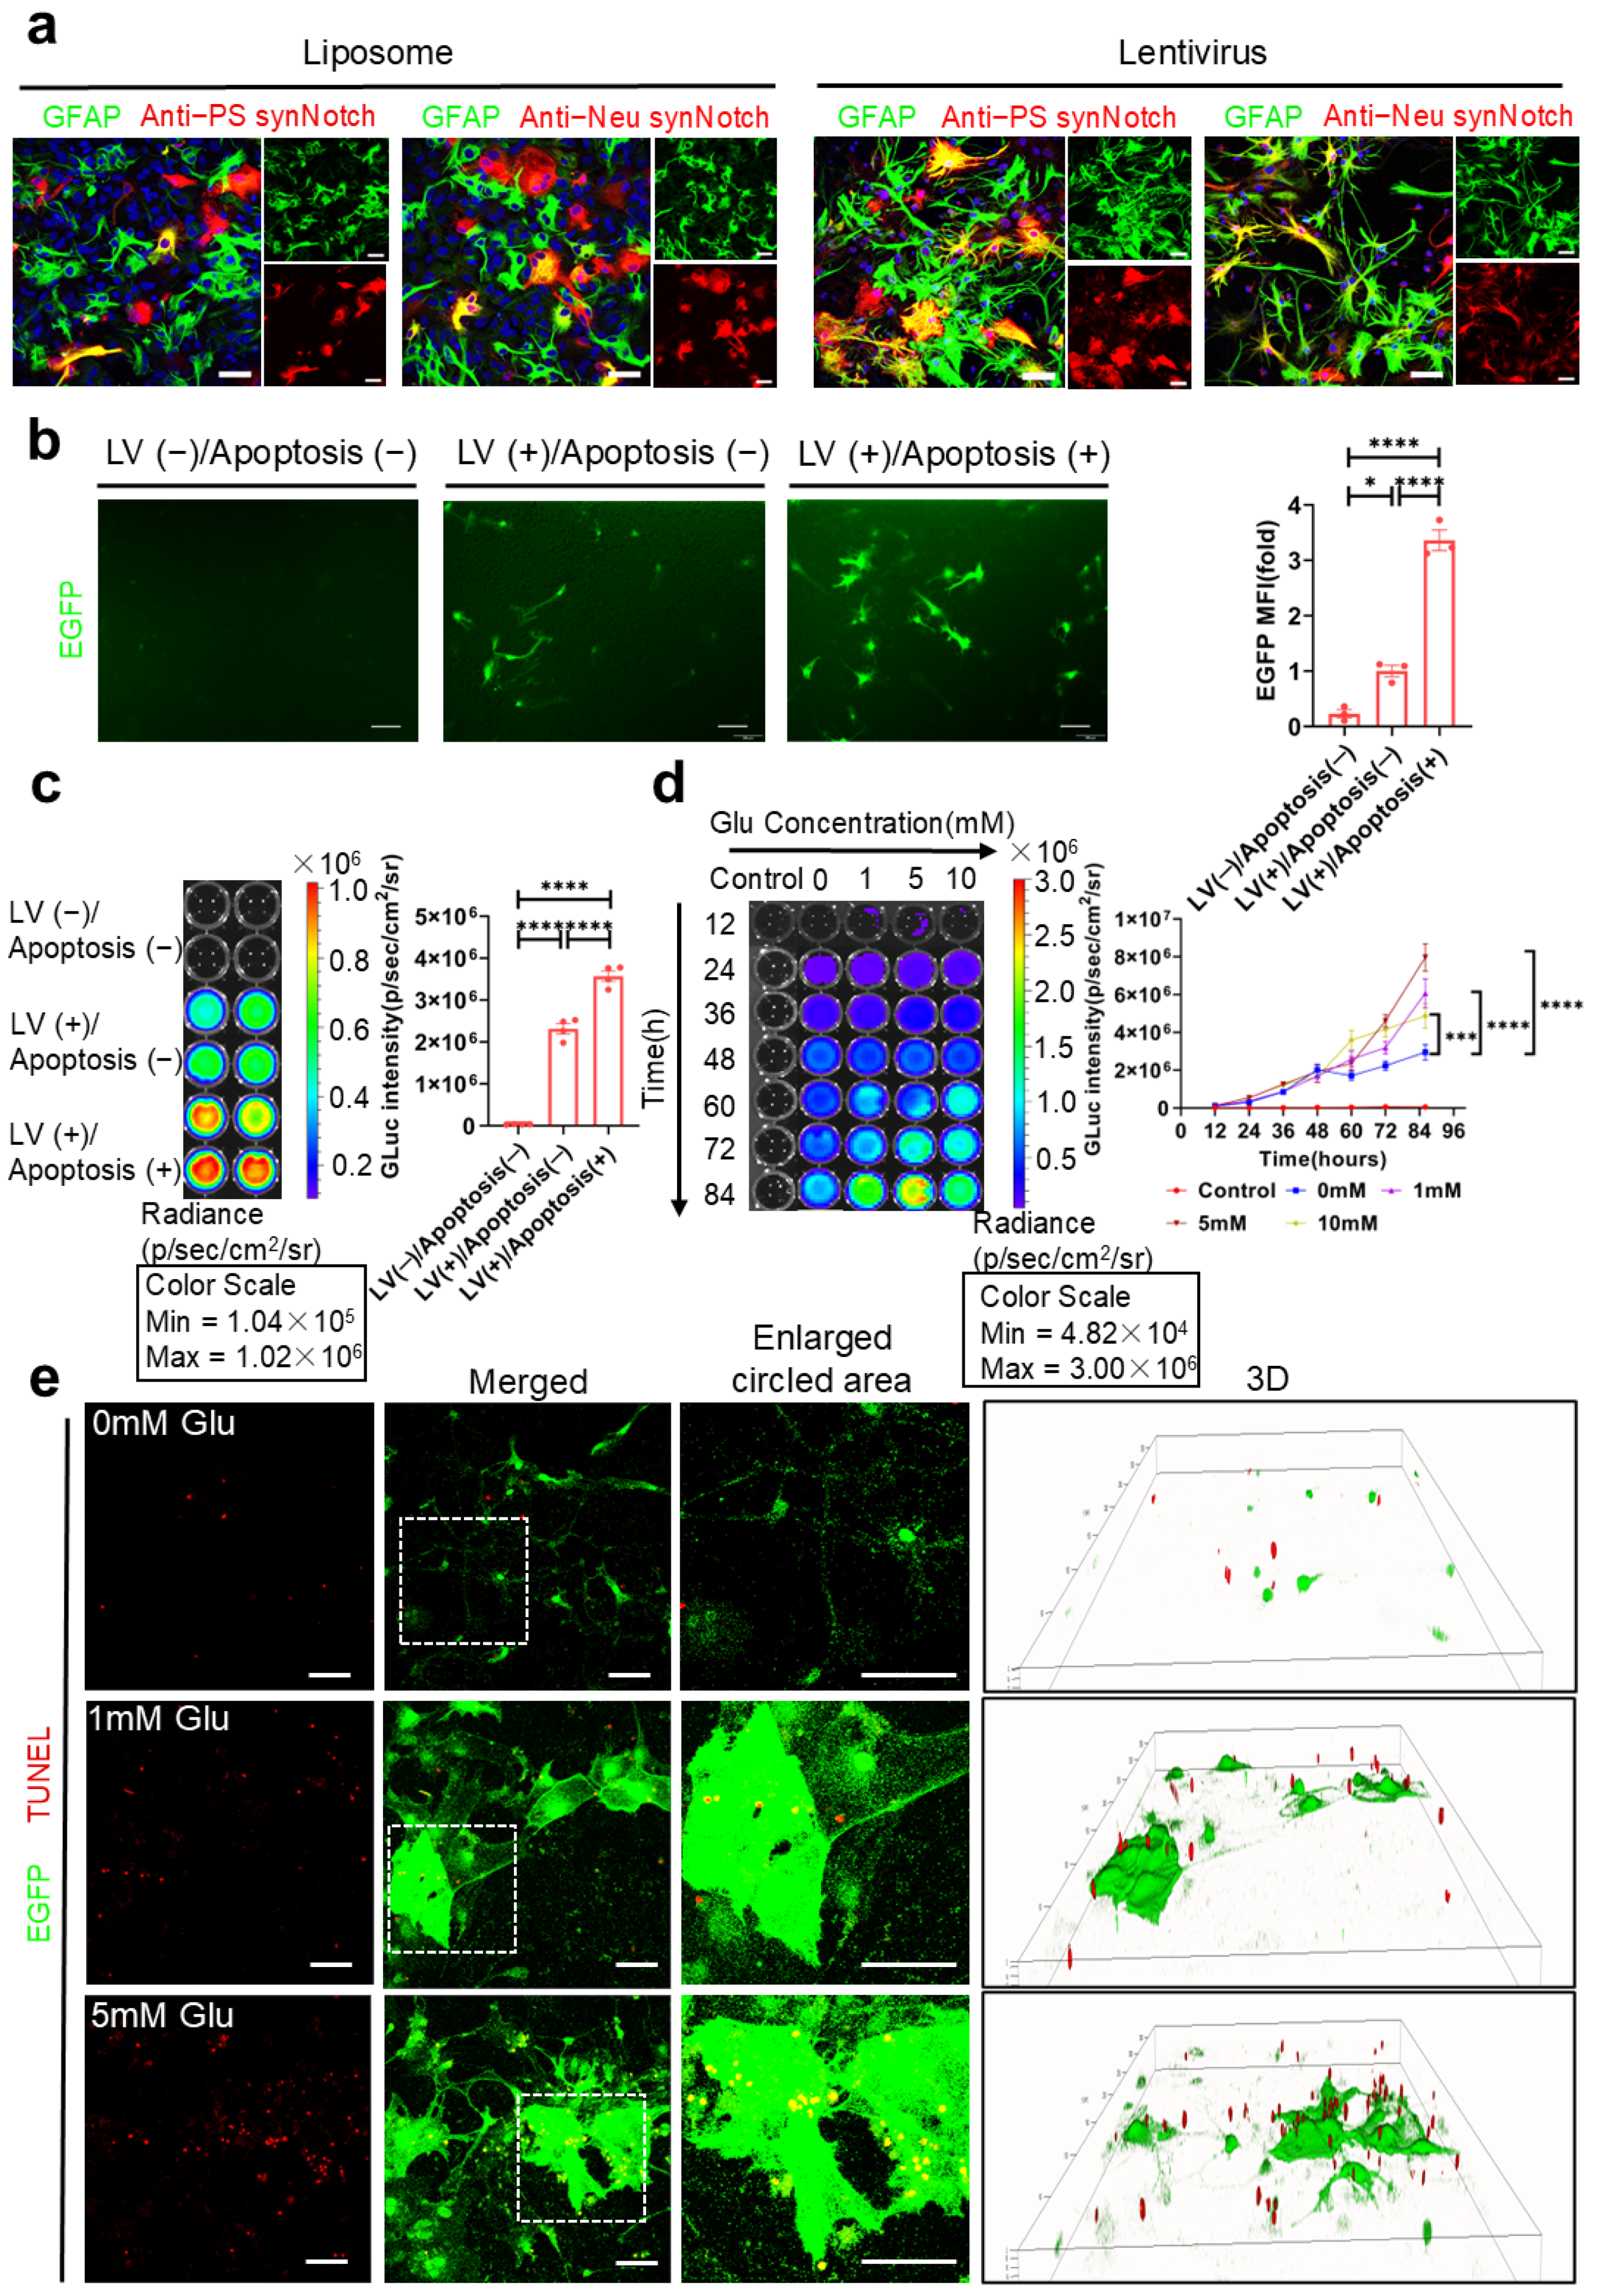
Through the transfection of the dual-synNotch system into HEK-293T cells and primary astrocytes, we demonstrated that this system could effectively recognize PS and ganglioside Gt1b, whether coated on cell culture plates or presented on the surface of apoptotic neurons. This recognition triggered dose-dependent activation, as depicted in
Figure 4,
Figure 5 and
Figure 6. Increasing the concentration and duration of the apoptosis inducer, glutamic acid, significantly enhanced the extent of neuronal apoptosis (
Figure 5a). Concurrently, both the GLuc-IgG1 Fc signal intensity and the BDNF concentration in the supernatant increased substantially, indicating that the system responded proportionally to the intensity of the apoptotic signal (
Figure 5d–f and
Figure 6b–d). Moreover, the activated astrocytes expressing the reporter protein EGFP showed a high degree of colocalization with TUNEL-positive apoptotic neurons, rather than with viable neurons, confirming the system’s high specificity (
Figure 6e).
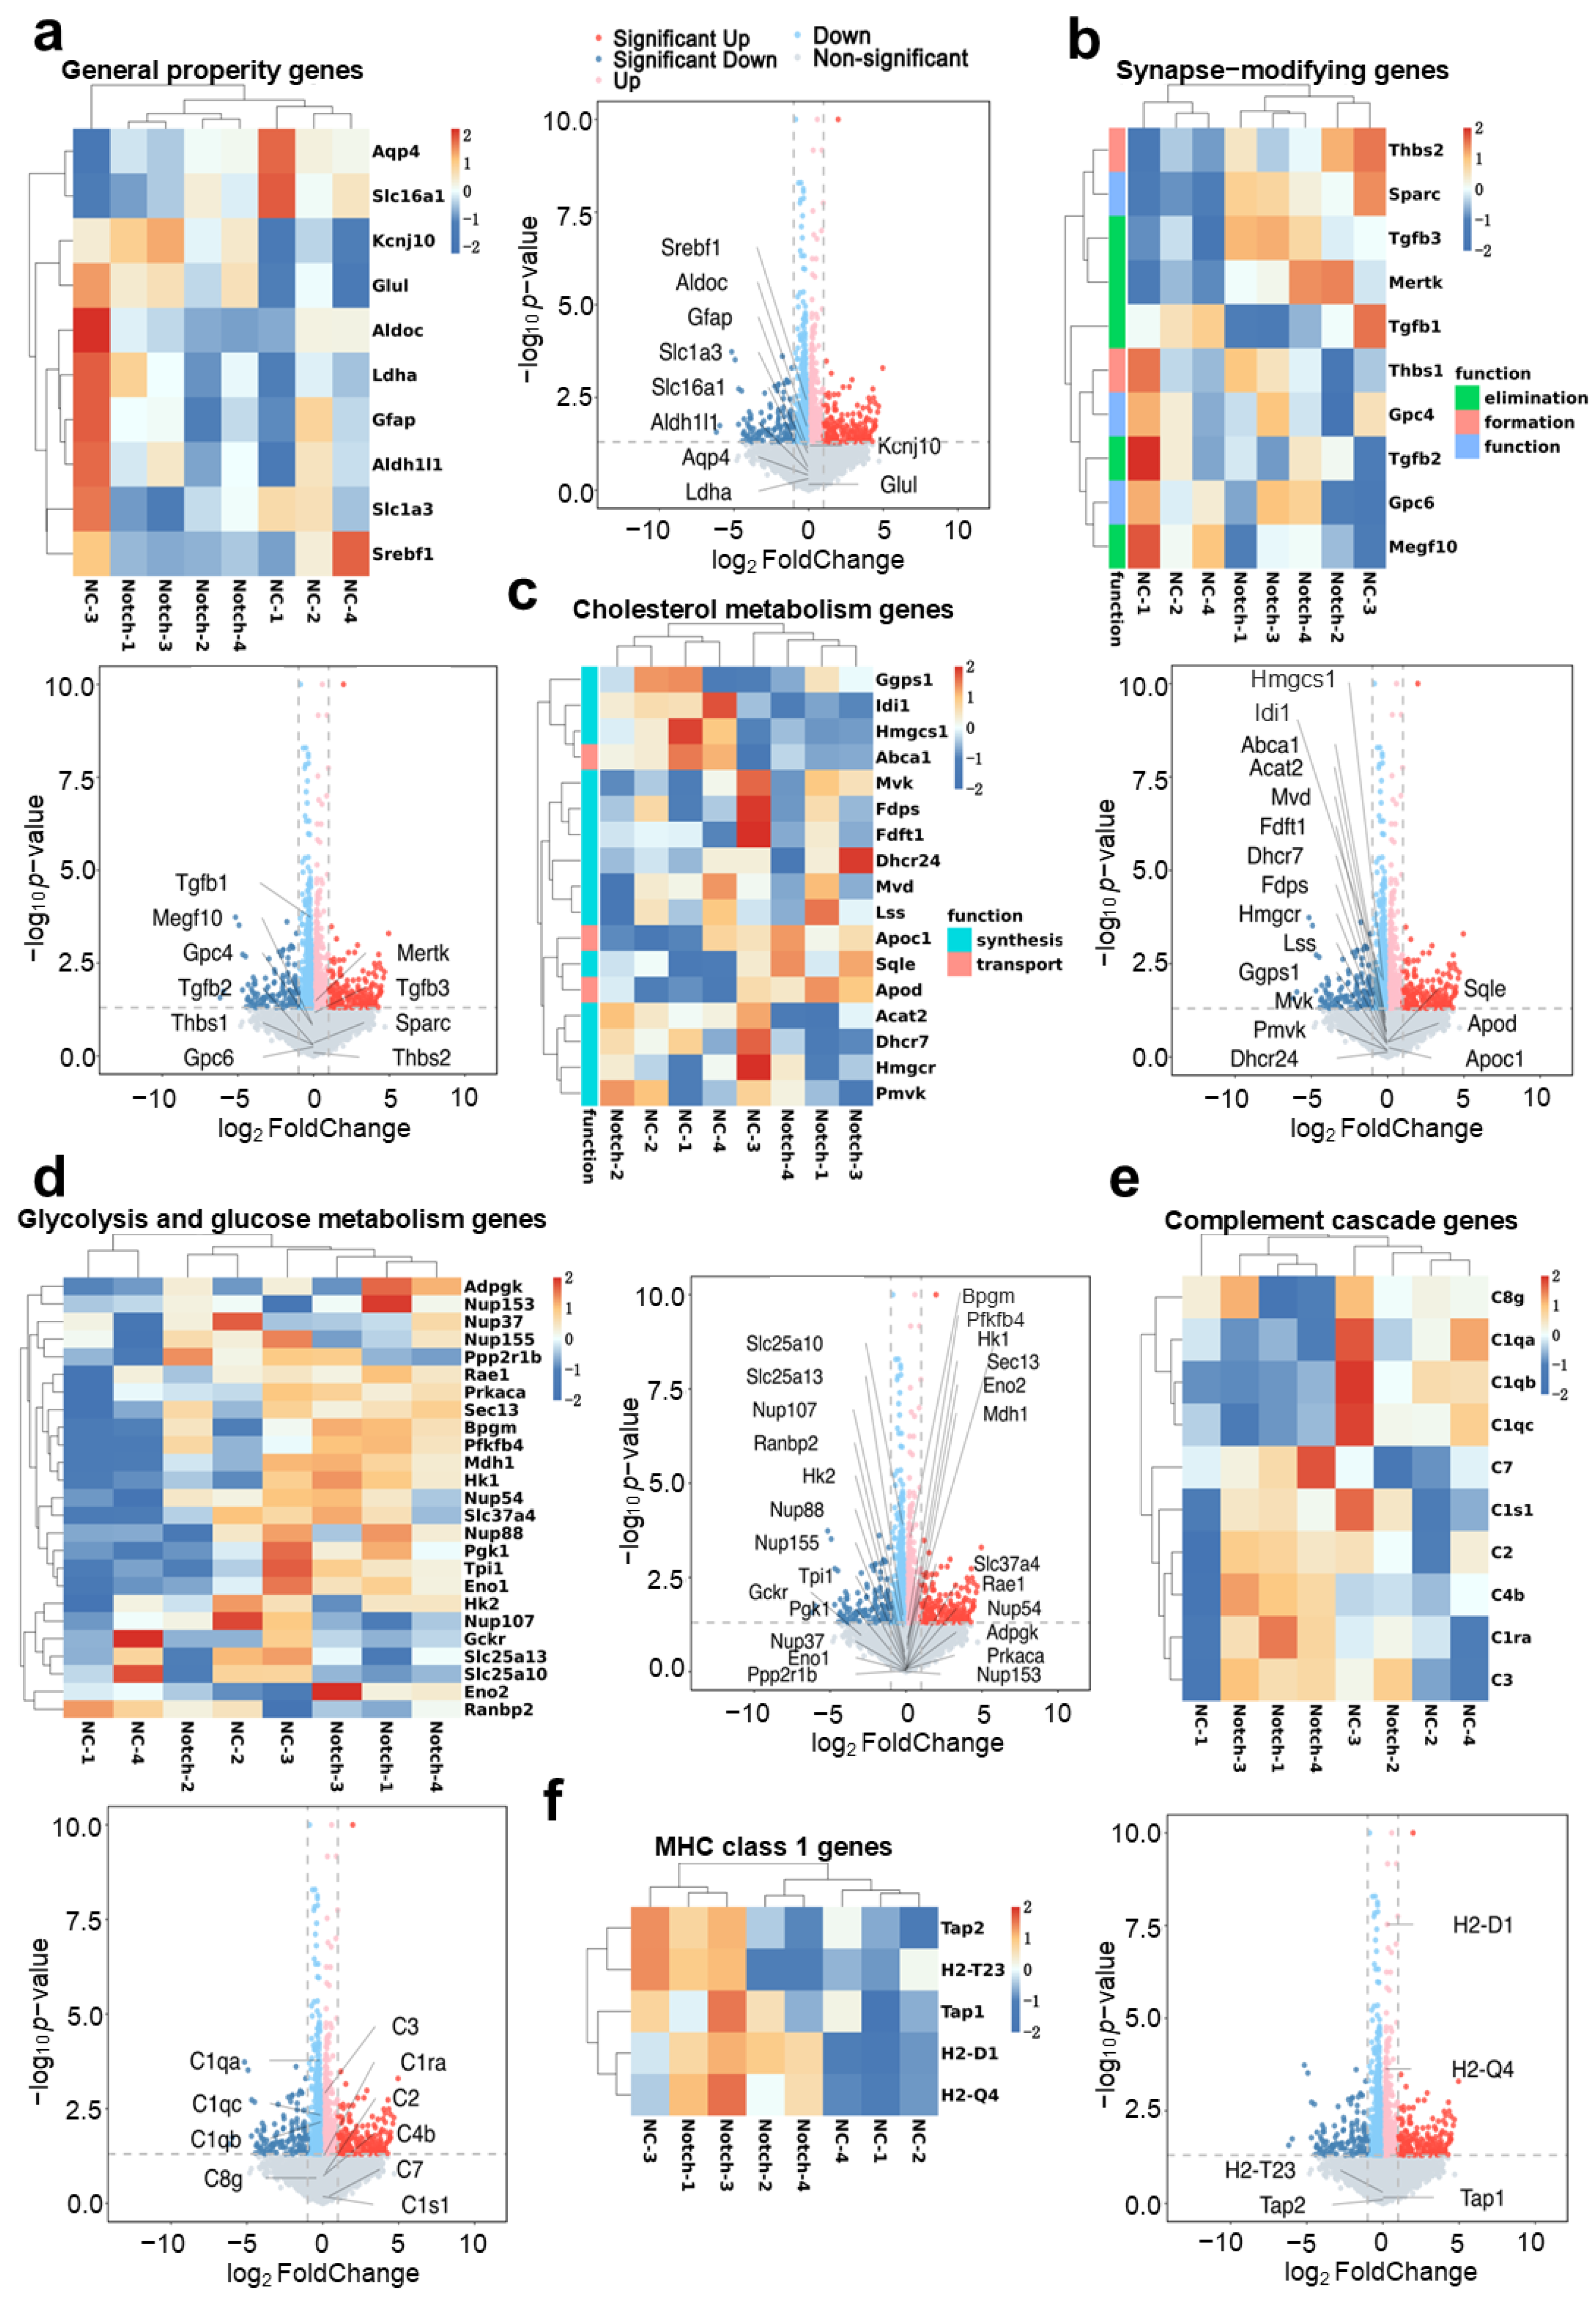
Regarding the safety of reprogramming astrocytes, we analyzed the transcriptomics of primary astrocytes in mice overexpressing synNotch (
Figure 7). It is essential to ensure that the overexpression of heterologous synthetic receptors does not interfere with the intracellular pathways of reprogrammed cells. Compared with wild-type astrocytes, we observed no significant changes (genes with a >2-fold change and
p < 0.05) in the expression of genes associated with key astrocyte functions, including neurotrophic support genes (
Figure 7a,b), substance metabolism genes (
Figure 7c,d), and immune response genes (
Figure 7e,f). These findings support the safety and applicability of this in situ modification method. However, further in vivo validation and refinement in various disease models are needed to ensure its effectiveness and safety.
While the reprogrammed astrocytes successfully achieved neuronal apoptosis signal-dependent activation, we also observed some background activation, likely due to inherent nonspecific cleavage of the synNotch system. This phenomenon is an unavoidable characteristic of the synNotch receptors currently in use [
51]. However, future studies should focus on modifying the synNotch receptor itself to reduce the background activation or enhance signal response intensity, thereby improving the signal-to-noise ratio for a more accurate indication of neuronal apoptosis. Additionally, minimizing the immunogenicity of both the synNotch receptor and its detection components will be crucial for clinical applications. Because of the considerable length of the genes encoding the entire dual-synNotch system, we opted for simultaneous delivery of two LVs, which slightly reduced the cotransfection efficiency of the system. It will be essential to further modify the entire system to reduce the size of gene fragments that need to be delivered. Ideally, these components should be constructed within a plasmid or viral vector concurrently, as this would significantly enhance the cotransfection efficiency of the system.
In summary, the study concluded that dual-synNotch system effectively translated the complex phenomenon of neuronal apoptosis into a specific and measurable signal, namely GLuc-IgG1 Fc, which was released into the bloodstream, enabling both the conversion and amplification of the neuronal apoptotic signal. Additionally, the BDNF produced by activation by neuronal apoptosis not only inhibited neuronal apoptosis but promoted neuronal survival. This innovative approach holds great potential for developing early-stage, convenient, and noninvasive diagnostic methods for diseases, especially for neurodegenerative disorders associated with neuronal apoptosis such as Alzheimer’s and Parkinson’s diseases.
4. Methods
4.1. Cell Lines
COS7 cells (ATCC, CRL-1651), HEK-293T cells (ATCC, CRL-3216), and HT22 cells (ATCC, LHY1277) were cultured in 10% fetal bovine serum (HUANKE) in DMEM (Invitrogen, 11965092) with 1% penicillin and streptomycin (Beyotime, C0222). All cell cultures were maintained in an incubator at 37% humidity and in a 5% CO2 atmosphere.
4.2. Plasmid Construction
Anti-PS synNotch receptors were built by fusing Annexin A5 (NM_001154, Met1-Asp320) to the mouse Notch1 extended regulatory region (NM_008714, Ile1427-Phe1759) with a (GGGGS)3 linker and then to TetR-VP64 (Addgene plasmid, Watertown, NY, USA, #79126). All anti-PS synNotch receptors contained a N-terminal CD8α signal peptide (N’-MALPVTALLLPLALLLHAARP-C’) with the aim of cell membrane localization and an HA tag epitope (N’-YPYDVPDYA-C’) for detecting the expression of the receptor by the anti-HA antibody (Abclonal, Wuhan, China, AE008). Anti-Neu synNotch receptors were built by fusing truncated tetanus toxin (X06214, Ile1111-Asp1315) to the mouse Notch1 extended regulatory region (NM_008714, Ile1427-Phe1759) with a (GGGGS)3 linker and then to VP64-Zip(+) (Addgene plasmid, #15305). All the anti-Neu synNotch receptors contained an N-terminal CD8α signal peptide (N’-MALPVTALLLPLALLLHAARP-C’) for cell membrane localization and an Myc tag epitope (N’-EQKLISEEDL-C’) for detecting the expression of the receptor with the anti-Myc antibody 9E10 (Santa Cruz, Dallas, TX, USA, sc-40, 1:200). The promoters on the 5′-terminal of synNotch receptor genes were a CMV promoter with a CMV enhancer or a GfaABC1D promoter followed by a Promega Chimeric Intron (Addgene plasmid, #100889). The response element downstream of the synNotch receptor contained an inducible promoter covering five copies of the Gal4 DBD targeting the UAS (5′-GGAGCACTGTCCTCCGAACG-3′) or seven copies of the TetR targeting the TRE sequence (5′-TCCCTATCAGTGATAGAGA-3′), followed by a minimal CMV promoter (Addgene plasmid, #79126). The reporter genes coding mCherry, EGFP, Gluc-IgG1 Fc (Addgene plasmid, #189629), and BDNF-Flag, which is a Flag tag (N’-DYKDHDGDYKDHDIDYKDDDDK-C’) directly linked to the C-terminal of mouse BDNF (NM_001048139, Met1-Arg249), were downstream of the inducible promoter. The BDNF-Flag contained a N-terminal original signal peptide (N’-MTILFLTMVISYFGCMKA-C’) that was optimized from the Igκ leader signal peptide (N’-METDTLLLWVLLLWVPGSTGD-C’) and the CD33 signal peptide (N’-MPLLLLLPLLWAGALA-C’). The gene fragment was obtained by PCR from Addgene plasmids (TaKaRa, R045Q). The whole genes were inserted into a pcDNA3.1 vector for liposome transfection or a pHR’SIN:CSW vector for lentiviral transduction using a Gibson Seamless Assembly cloning kit (Abclonal, RK21020).
In protein expression and purification experiments, plasmids encoding BDNF-Flag and Gluc-IgG1 Fc proteins were constructed by cloning the genes of mouse BDNF (NM_001048139, Met1-Arg249) with a Flag tag (N’-DYKDHDGDYKDHDIDYKDDDDK-C’) directly linked to the C-terminal and Gluc-IgG1 Fc (Addgene plasmid, #189629) into the pcDNA3.1 vector.
4.3. Lentivirus Production and Purification
The lentivirus packaging experiment was carried out with HEK-293T cells. The operations were as follows: First, HEK-293T cells were inoculated into a Petri dish coated with PDL. When the cell density reached about 70–90%, the cells were changed into a medium without antibiotics and continued to be cultured for 2 h. According to the proportion of PsPax2–PmD2.G–pHR’SIN:CSW = 2:1:3, three plasmids were mixed, and the mixture of plasmids and transfection reagent was added into the HEK-293T cells with Zlip2000 transfection reagent (Zomanbio, ZC305). After 6 h, the cell supernatant was removed, and a new medium was added for further culture. After 48 h of continuous culture, the supernatant of the cell culture containing the virus was collected for subsequent virus purification.
The cell culture supernatant containing the virus was centrifuged at 2000 rpm for 10 min, and the supernatant was collected and filtered with a 0.45 μm filter membrane. The virus supernatant after centrifugation was added to the centrifuge tube, and then 5 mL of 20% sucrose (PBS configuration) was slowly added to the bottom of the centrifuge tube. The centrifuge tubes were centrifuged at 25,000 rpm (SW28 rotor) at 4 °C for 3 h. After centrifugation, the supernatant was abandoned, and the virus precipitation was suspended with PBS and dissolved on ice for 2 h. The virus resuspension was collected and centrifuged at 4 °C at 16,000× g for 1 min. The supernatant was obtained as a lentiviral solution. Finally, the lentivirus solution was separated and stored in the refrigerator at −80 °C for later use.
4.4. Culture of Primary Neurons and Astrocytes
The brains of C57BL/6J fetal mice at E14 to E15 days of gestation were removed, the blood meninges were removed in HBSS, and the isolated hippocampus and cortex were cut up with tweezers. The tissue fragments were transferred to a 15 mL centrifuge tube and centrifuged at 800 rpm for 3 min. Then, 10 mL 0.25% pancreatic enzyme digestion solution (Beyotime, Shanghai, China, C0201) including DNase I (Solarbio, Beijing, China, D8071) was added to the precipitation, digested at 37 °C for 10 min, and gently reversed several times every 5 min. After digestion, the pancreatic enzyme digestion reaction was terminated with 20 mL DMEM medium (Gibco, Grand Island, NY, USA, 11965092) containing 10% FBS (Gibco, 10091155), the cells were gently blown into cell suspension with a pipette, and the undigested tissue mass was removed through a 70 μm cell screen. The remaining cells were collected by centrifugation at 1500 rpm for 10 min and then resuspended with DMEM medium and spread into 12-well plates. Basal culture medium with 2% B27 (Gibco, 17504044), 1% GlutaMAX (Gibco, 35050061), 0.5% penicillin, and streptomycin (Beyotime, C0222) was replaced with Neurobasal (Gibco, 21103049) medium for 2–4 h and continued for 7–9 days until neurons were mature for the follow-up study.
Primary astrocytes were extracted from the C57BL/6J neonatal mouse brain. The procedure was the same as that of primary neuron extraction. DMEM-F12 medium (Gibco, 11320033), containing 10% FBS and 1% penicillin and streptomycin, was cultured for 10–12 days, and the medium was changed every 2–3 days.
4.5. Plate Coated by PS and Gt1b
The indicated PS (YuanyeBio, Shanghai, China, S27340) and Gt1b (Cayman, Ann Arbor, MI, USA, 15588) dissolved by ultrasound in methanol (5 mg/mL) were added to 12-well polystyrene plates in various amounts and air-dried in a sterile ultraclean workbench for 2 h. The dried plates were used directly or stored at 4 °C.
4.6. Plasmid Transfection and Lentiviral Transduction In Vitro
Plasmids coding anti-PS synNotch and anti-Neu synNotch were at a 1:1 ratio in a total of 0.4 μg of plasmids per 2 × 10⁵ cells in a well of a 12-well plate with 2 μL of Zlip 2000 transfection reagent. After 6 h of incubation, the supernatant was removed and replaced with fresh medium for another 48 h. Then, the cells were used in later experiments. Lentiviral vectors coding anti-PS synNotch and anti-Neu synNotch were both added at an MOI = 1 per 2 × 10⁵ cells in a well of a 12-well plate. After 24 h of incubation, the supernatant was removed and replaced with fresh medium for another 48 h. Then, the cells were used in later experiments.
4.7. Cell Immunofluorescence Imaging and Analysis
The cell glass coverslips were washed three times with PBS for 5 min each time, fixed with 4% paraformaldehyde (Solarbio, P1110) at room temperature for 20 min, and then closed with a blocking solution containing 10% donkey serum (Solarbio, SL050) and 0.3% Triton-X100 (Sigma, St. Louis, MO, USA, T8787) for 1 h. Later, the corresponding primary antibody was added to the cell glass coverslips, and the coverslips were incubated at 4 °C overnight. Then, they were washed three times with PBS, the fluorescently labeled secondary antibody was added, and the coverslips were incubated at room temperature for 1 h. Hoechst 33258 was added and stained for 10 min at room temperature. After the film was sealed, the data were collected using confocal microscopy (Leica, Heerbrugg, Switzerland) and analyzed using the ImageJ (v1.8.0) software. The antibodies and dilutions used were as follows: mouse anti-HA antibody (Abclonal, AE008, 1:200), mouse anti-Myc antibody (Santa Cruz, sc-40, 1:100), rabbit anti-GFAP antibody (Affinity, Shanghai, China, DF6040, 1:200), and donkey antimouse, -rabbit, -chicken, and -goat Alexa fluor488, 546, 594, and 647 secondary antibodies (Life Technologies, Carlsbad, CA, USA, 1:500).
4.8. Flow Cytometry and Sorting
The cells were digested and suspended with 0.25% pancreatic enzyme, fixed with 4% paraformaldehyde for 2 min, and incubated at room temperature for 1 h with primary antibody. After the cells were washed three times with a flow buffer, which was PBS containing 0.1% Tween-20 (Beyotime, ST825) and 2% BSA (Beyotime, ST023), secondary antibody was added to the cells, and they were incubated at room temperature for 1 h. Then, after being washed with flow buffer for three times, the cells were resuspended with flow buffer and passed through a 100 μm cell screen (Beyotime, FSTR100). Data were then collected using CytoFLEX LX (Beckman, Pasadena, CA, USA) flow cytometry and analyzed with FlowJo (v10.8.1). SynNotch-positive astrocytes were sorted by a FACSAria II cell sorter for later RNA sequencing. The antibodies and dilutions used were as follows: mouse anti-HA antibody (Abclonal, AE008, 1:200), mouse anti-Myc antibody (Santa Cruz, sc-40, 1:100), and donkey antimouse Alexa fluor488 secondary antibodies (Life Technologies, 1:500).
4.9. BDNF-Flag Measurement by ELISA
Mouse anti-Flag antibody (Sigma, F1804) was coated on a 96-well plate with antibody coating buffer (2.935 g of NaHCO3 and 1.599 g of NaCO3 in 1 L of H2O at pH = 9.6), at a concentration of 0.5 μg/100 μL, and placed at 37 °C for 2 h. Then, the plate was washed with 0.05% PBST 3 times, sealing solution containing 0.05% PBST and 1% BSA was added in 300 μL per well, and the plate was sealed at 37 °C for 2 h. Later, the plate was washed with 0.05% PBST 3 times, the samples to be detected were added in 100 μL per well, and the plate was incubated at 37 °C for 1.5 h and washed with 0.05% PBST 3 times. Biotin-labeled rabbit antimouse BDNF (Signalway antibody, Wuhan, China, EK5128) diluted with sealing solution at a dilution of 1:500 was added at 100 μL per well, incubated at 37 °C for 1 h, and washed with 0.05% PBST for 3 times. Streptavidin-labeled HRP (Thermofisher, Waltham, MA, USA, 21140) diluted with sealing solution at a dilution of 1:5000 was added at 100 μL per well, incubated at 37 °C for 0.5 h, and washed with 0.05% PBST 5 times. TMB substrate solution (Solarbio, PR1210) was added at 100 μL per well and developed at 37 °C for 10 min. Finally, 1 M sulfuric acid termination solution was added at 100 μL per well to stop the chromogenic reaction. The absorption at 450 nm was measured by using a SpectraMax® M5 plate reader (Molecular Devices, Sunnyvale, CA, USA)within 5 min.
4.10. Protein Expression and Purification
BDNF-Flag protein was expressed by cultured primary astrocytes. Plasmids encoding three proteins were transfected into astrocyte cells, which were inoculated on 10 mm diameter cell culture dishes via Zlip2000 liposome. After 72 h of incubation, the cell culture supernatant was collected and centrifuged at 2000 rpm to remove cell debris. Next, 100 μL of magnetic beads coated with mouse anti-Flag tag antibody (MCE, Shanghai, China, HY-K0207) were incubated with 50 mL of cell culture supernatant at 4 °C on a shaker overnight. The next day, after the magnetic beads were separated from the cell supernatant using a magnetic rack, the magnetic beads were cleaned three times with 0.5% PBST until the OD280 in the supernatant after washing was less than 0.05. Then, 50 μL of elution buffer, which contained 0.15 M Glycine at pH = 2.5–3.1, was added to the magnetic beads, mixed evenly, and incubated together at room temperature for 10 min. The magnetic beads were separated, and the supernatant was collected into a new EP tube. The neutralization buffer, which contained 1 M Tris-HCl at pH = 8.0, was added at a ratio of 25 μL of neutralization buffer per 50 μL of eluent, and the pH of the elution product was soon adjusted to neutral. The eluted samples were stored at −80 °C or used for later functional analysis. The expression and purification of Gluc-IgG1 Fc were the same as the above process except that the magnetic beads were coated with protein-G (Beyotime, P2106) for the capture of the IgG1 Fc fragment.
4.11. Cytotoxicity Assay (MTT)
HT22 cells were cultured in DMEM containing 10% FBS and 1% penicillin/streptomycin. The cells in the Petri dish were digested by pancreatic enzymes, centrifuged, and then inoculated into 96-well plates with about 5000 cells per well per 100 μL of medium. After 12 h, the cells were treated with a 10 mM concentration of glutamate solution to induce neuronal apoptosis. After glutamate-induced neuronal apoptosis for 6 h, BDNF-Flag protein solution with a certain concentration gradient was added. After adding BDNF-Flag protein for 72 h, 25 μL 5 g/mL MTT (Solarbio, M8180) was added to each well, and the cells continued to culture at 37 °C for 3 h until the medium was absorbed. Later, 150 μL DMSO (Solarbio, D8371) was added to each cell well, and the reaction was performed at room temperature for 10 min away from light. The absorbance at 570 nm and 630 nm was measured using a microplate reader (MD-M5). There were six duplicate pore cells in each sample and control, and each experiment was repeated three times. After background correction, the relative cell survival rate was calculated by dividing the absorbance of the sample well by that of the control.
4.12. Brain Stereotaxic Injection
The mice were deeply anesthetized with a mixture of ketamine (100 mg/kg) and toluene thiazide (10 mg/kg) and fixed on a stereotaxic injection table. Bregma was used as the starting point using a stereotaxator with AP = −0.3 mm, ML = ±1.0 mm, DV = −1.8 mm for brain localization. After craniotomy with a cranial drill at a fixed point, injection was carried out with a microsyringe (Hamilton, Bonaduz, Switzerland, 10 μL), and a total of 1 μg GLuc-IgG1 Fc protein was injected into a single point at speed of 0.1 μL/min. After the injection, the needle was kept clean for 5 min so that the sample in the brain could be completely absorbed. The surgical site was cleaned with sterile saline, and the incisions were closed. The mice were monitored and provided with postoperative care.
4.13. Gaussia Luciferase Assay In Vitro
To conduct the luciferase assay of the cell culture supernatant, 20 μL of supernatant was mixed with 50 μL of 1% Gaussia luciferase assay substrate (Beyotime, RG021M) per well in a black 96-well plate. After incubation for 10 min at room temperature, the bioluminescence was read by using a SpectraMax® iD5 plate reader (Molecular Devices, Sunnyvale, CA, USA) or an IVIS spectrum imager (PerkinElmer, Waltham, MA, USA), the settings of which were open filter, 8 binning, F/1 aperture control, and auto-exposure time. For the measurement of the bioluminescence of blood samples, 50–100 μL of mouse blood was collected from the orbital vein, left at 37 °C for half an hour, and then centrifuged at 2000 rpm for 5 min to collect the upper serum. Later, 20 μL of serum was mixed with 50 μL of 1% Gaussia luciferase assay substrate per well in a black 96-well plate, and the bioluminescence was read using a microplate reader or an IVIS spectrum imager in the same way as in the process above.
4.14. Western Blotting
Protein samples of different groups were diluted to the same concentration using the BCA method (Beyotime, P0009) and separated by 4–20% gradient SDS-PAGE (Meilunbio, Dalian, China, MA0287) under the conditions of 80 V electrophoresis for 15 min and 120 V electrophoresis for 1 h. When transferring the protein from the gel to the nitrocellulose membrane (PALL, P-N66485) under the condition of 300 mA for 60 min was completed, the membrane was sealed with 5% skim milk (Solarbio, D8340) at room temperature for 1 h, and the primary antibody was added and incubated together at 4 °C on a shaker overnight. The membrane was washed three times with 0.1% TBST for 5 min each time the next day. After that, HRP-labeled secondary antibody (Zsbio, ZB2301/ZB2305) was added and incubated together at room temperature for 1 h, and the membrane was washed three times with 0.1% TBST for 5 min each time. Finally, blot bands were recorded using the A1600 system (GE Health, Chicago, IL, USA), and quantitative analysis was performed using ImageJ software. The antibodies and dilutions used were as follows: rabbit anti-BDNF antibody (Abcam, Cambridge, U.K., ab108319, 1:2000), mouse anti-Flag antibody (Sigma, F1804, 1:1000), goat anti-GFP antibody (Abcam, ab6673, 1:2000), rabbit anti-gaussia luciferase antibody (ThermoFisher, PA1-181, 1:1000) and rabbit anti-mouse IgG1 Fc antibody (SinoBiological, Beijing, China, 10690-T16, 1:1000).
4.15. RNA Sequencing
Total RNA was extracted using TRIzol reagent (Invitrogen, Carlsbad, CA, USA, 15596026CN) according to the manufacturer’s protocol. The RNA purity and quantity were evaluated using the NanoDrop 2000 spectrophotometer (Thermo Scientific, Waltham, MA, USA). The RNA integrity was assessed using the Agilent 2100 Bioanalyzer (Agilent Technologies, Santa Clara, CA, USA). Then, the libraries were constructed using the VAHTS Universal V6 RNA-seq Library Prep Kit according to the manufacturer’s instructions. The transcriptome sequencing and analysis were conducted by OE Biotech Co., Ltd. (Shanghai, China).
4.16. Statistical Analysis
All data were analyzed using Prism (GraphPad 8 software, LLC) or Excel (Microsoft). A Shapiro–Wilk test was first applied to determine whether the data were normally distributed. If the data were normally distributed, one-way or two-way ANOVA was used with Tukey’s multiple comparisons test in the comparison of three or more groups, or a nonparametric unpaired t test with a two-tailed p value was used in the comparison of two groups. Otherwise, a Mann–Whitney rank sum test was used in the comparison of two groups, or Kruskal–Wallis one-way ANOVA on ranks with post hoc Dunn’s test was used in the comparison of three or more groups. p < 0.05 indicates a statistically significant difference in the data and is represented by *; p < 0.01 indicates that the data have a very significant statistical difference and is represented by **; p < 0.001 means that the data have a very significant statistical difference, expressed by ***; and p < 0.0001 means that the data have a remarkably significant statistical difference and is represented by ****.


