Article

Depletion of WWP1 Increases Adrb3 Expression and Lipolysis in White Adipose Tissue of Obese Mice

1
Laboratory of Molecular Pathology and Metabolic Disease, Faculty of Pharmaceutical Sciences, Tokyo University of Science, Chiba 278-8510, Japan
2
Laboratory of Pharmacology, Faculty of Pharmaceutical Sciences, Tokyo University of Science, Chiba 278-8510, Japan
3
Department of Nutrition and Food Science, Graduate School of Humanities and Sciences, Ochanomizu University, Tokyo 112-8610, Japan
4
Institute for Human Life Science, Ochanomizu University, Tokyo 112-8610, Japan
5
Division of Cell Fate Regulation, Research Institute for Biomedical Science, Tokyo University of Science, Chiba 278-1501, Japan
*
Author to whom correspondence should be addressed.
These authors contributed equally to this work.
Int. J. Mol. Sci. 2025, 26(9), 4219; https://doi.org/10.3390/ijms26094219
Submission received: 24 January 2025 / Revised: 23 April 2025 / Accepted: 28 April 2025 / Published: 29 April 2025
(This article belongs to the Special Issue Obesity: From Molecular Mechanisms to Clinical Aspects)

Abstract

:
Obesity is defined as abnormal or excessive accumulation of body fat and contributes to several metabolic disorders. White adipose tissue (WAT) releases energy as free fatty acids and glycerol from triglycerides through a process called lipolysis. People with obesity have impaired catecholamine-stimulated lipolysis, but comprehensive understanding of this lipolysis is still unclear. We previously showed that expression of WW domain-containing E3 ubiquitin ligase 1 (WWP1), a member of the HECT-type E3 family of ubiquitin ligases, was increased in WAT of obese mice. In this study, we generated Wwp1 knockout (KO) mice to evaluate the effect of WWP1 in WAT of obese mice. The mRNA levels of beta-3 adrenergic receptor (Adrb3), which were decreased with a high-fat diet, were increased by Wwp1 KO in WAT. Moreover, Wwp1 KO mice showed increased phosphorylated hormone-sensitive lipase levels in WAT. In contrast, noradrenaline and its metabolism were not altered in WAT of obese Wwp1 KO mice. These findings indicate that WWP1, which is increased in adipocytes because of obesity, is a candidate for suppressing lipolysis independently of noradrenaline metabolism. We anticipate that inhibition of WWP1 is a promising approach for a new treatment of obesity and type-2 diabetes using Adrb3 agonists.

Graphical Abstract

1. Introduction

White adipose tissue (WAT) is the most effective lipid storage organ and plays an important role in systemic metabolic homeostasis. White adipocytes, which are the main component of WAT and contain unilocular lipid droplets, act as an endogenous energy supply by increasing lipolysis during periods of deficient nutritional availability. During the development of obesity, WAT becomes hypertrophied to store excess lipid as triglycerides (TGs) in white adipocytes. WAT in obesity is infiltrated by a large number of macrophages, and this recruitment is associated with metabolic disorders, such as insulin resistance and type-2 diabetes, through chronic inflammatory or oxidative stress [1,2].
Obesity is associated with an increase in basal lipolysis [3,4] but a decrease in catecholamine-stimulated lipolysis [5]. Resistance to catecholamine-induced lipolysis in WAT has been demonstrated in people with obesity [4,6]. These data suggest that decreased expression of the β3-adrenergic receptor, which is encoded by the Adrb3 gene, and hormone-sensitive lipase (HSL), which in turn causes impaired lipolytic capacity of WAT, leads to metabolic disorders in people with obesity. Mirabegron and vibegron, which have been approved as Adrb3 agonists for treating overactive bladder, have the basic pharmacophore 2-amino-1-phenylethanol, similar to adrenaline [7,8,9,10]. These Adrb3 agonists have been developed by several pharmaceutical companies as treatments for obesity and type-2 diabetes but have yet to become successful.
WW domain-containing E3 ubiquitin ligase 1 (WWP1) (also known as TIUL1 or AIP5) belongs to the homologous to the E6-associated protein carboxyl terminus (HECT)-type E3 ubiquitin protein ligase family. WWP1 has a C2 domain at its N-terminal, four WW domains (for recognition of PPXY-containing substrate) in its central region, and a HECT domain at its C-terminal (for the transfer of ubiquitin to substrate) [11,12]. We previously reported that WWP1 expression levels increase in a p53-dependent manner in a mouse model of obesity caused by a high-fat diet (HFD) [13]. To evaluate the involvement of WWP1 in metabolic regulation, we previously generated and studied systemic Wwp1 knockout (KO) mice and found that Wwp1 KO mice had improved insulin sensitivity and glucose tolerance from obesity-related insulin resistance [14]. In addition, we reported that obese Wwp1 KO mice showed enhanced hepatic insulin signaling and improved hepatic steatosis [15]. These results suggest that WWP1 contributes to systemic glucose metabolic regulation. However, whether WWP1 is involved in lipid homeostasis is unknown. Therefore, in this study, we investigated lipid homeostasis in WAT of obese mice by analyzing systemic KO of Wwp1.

2. Results

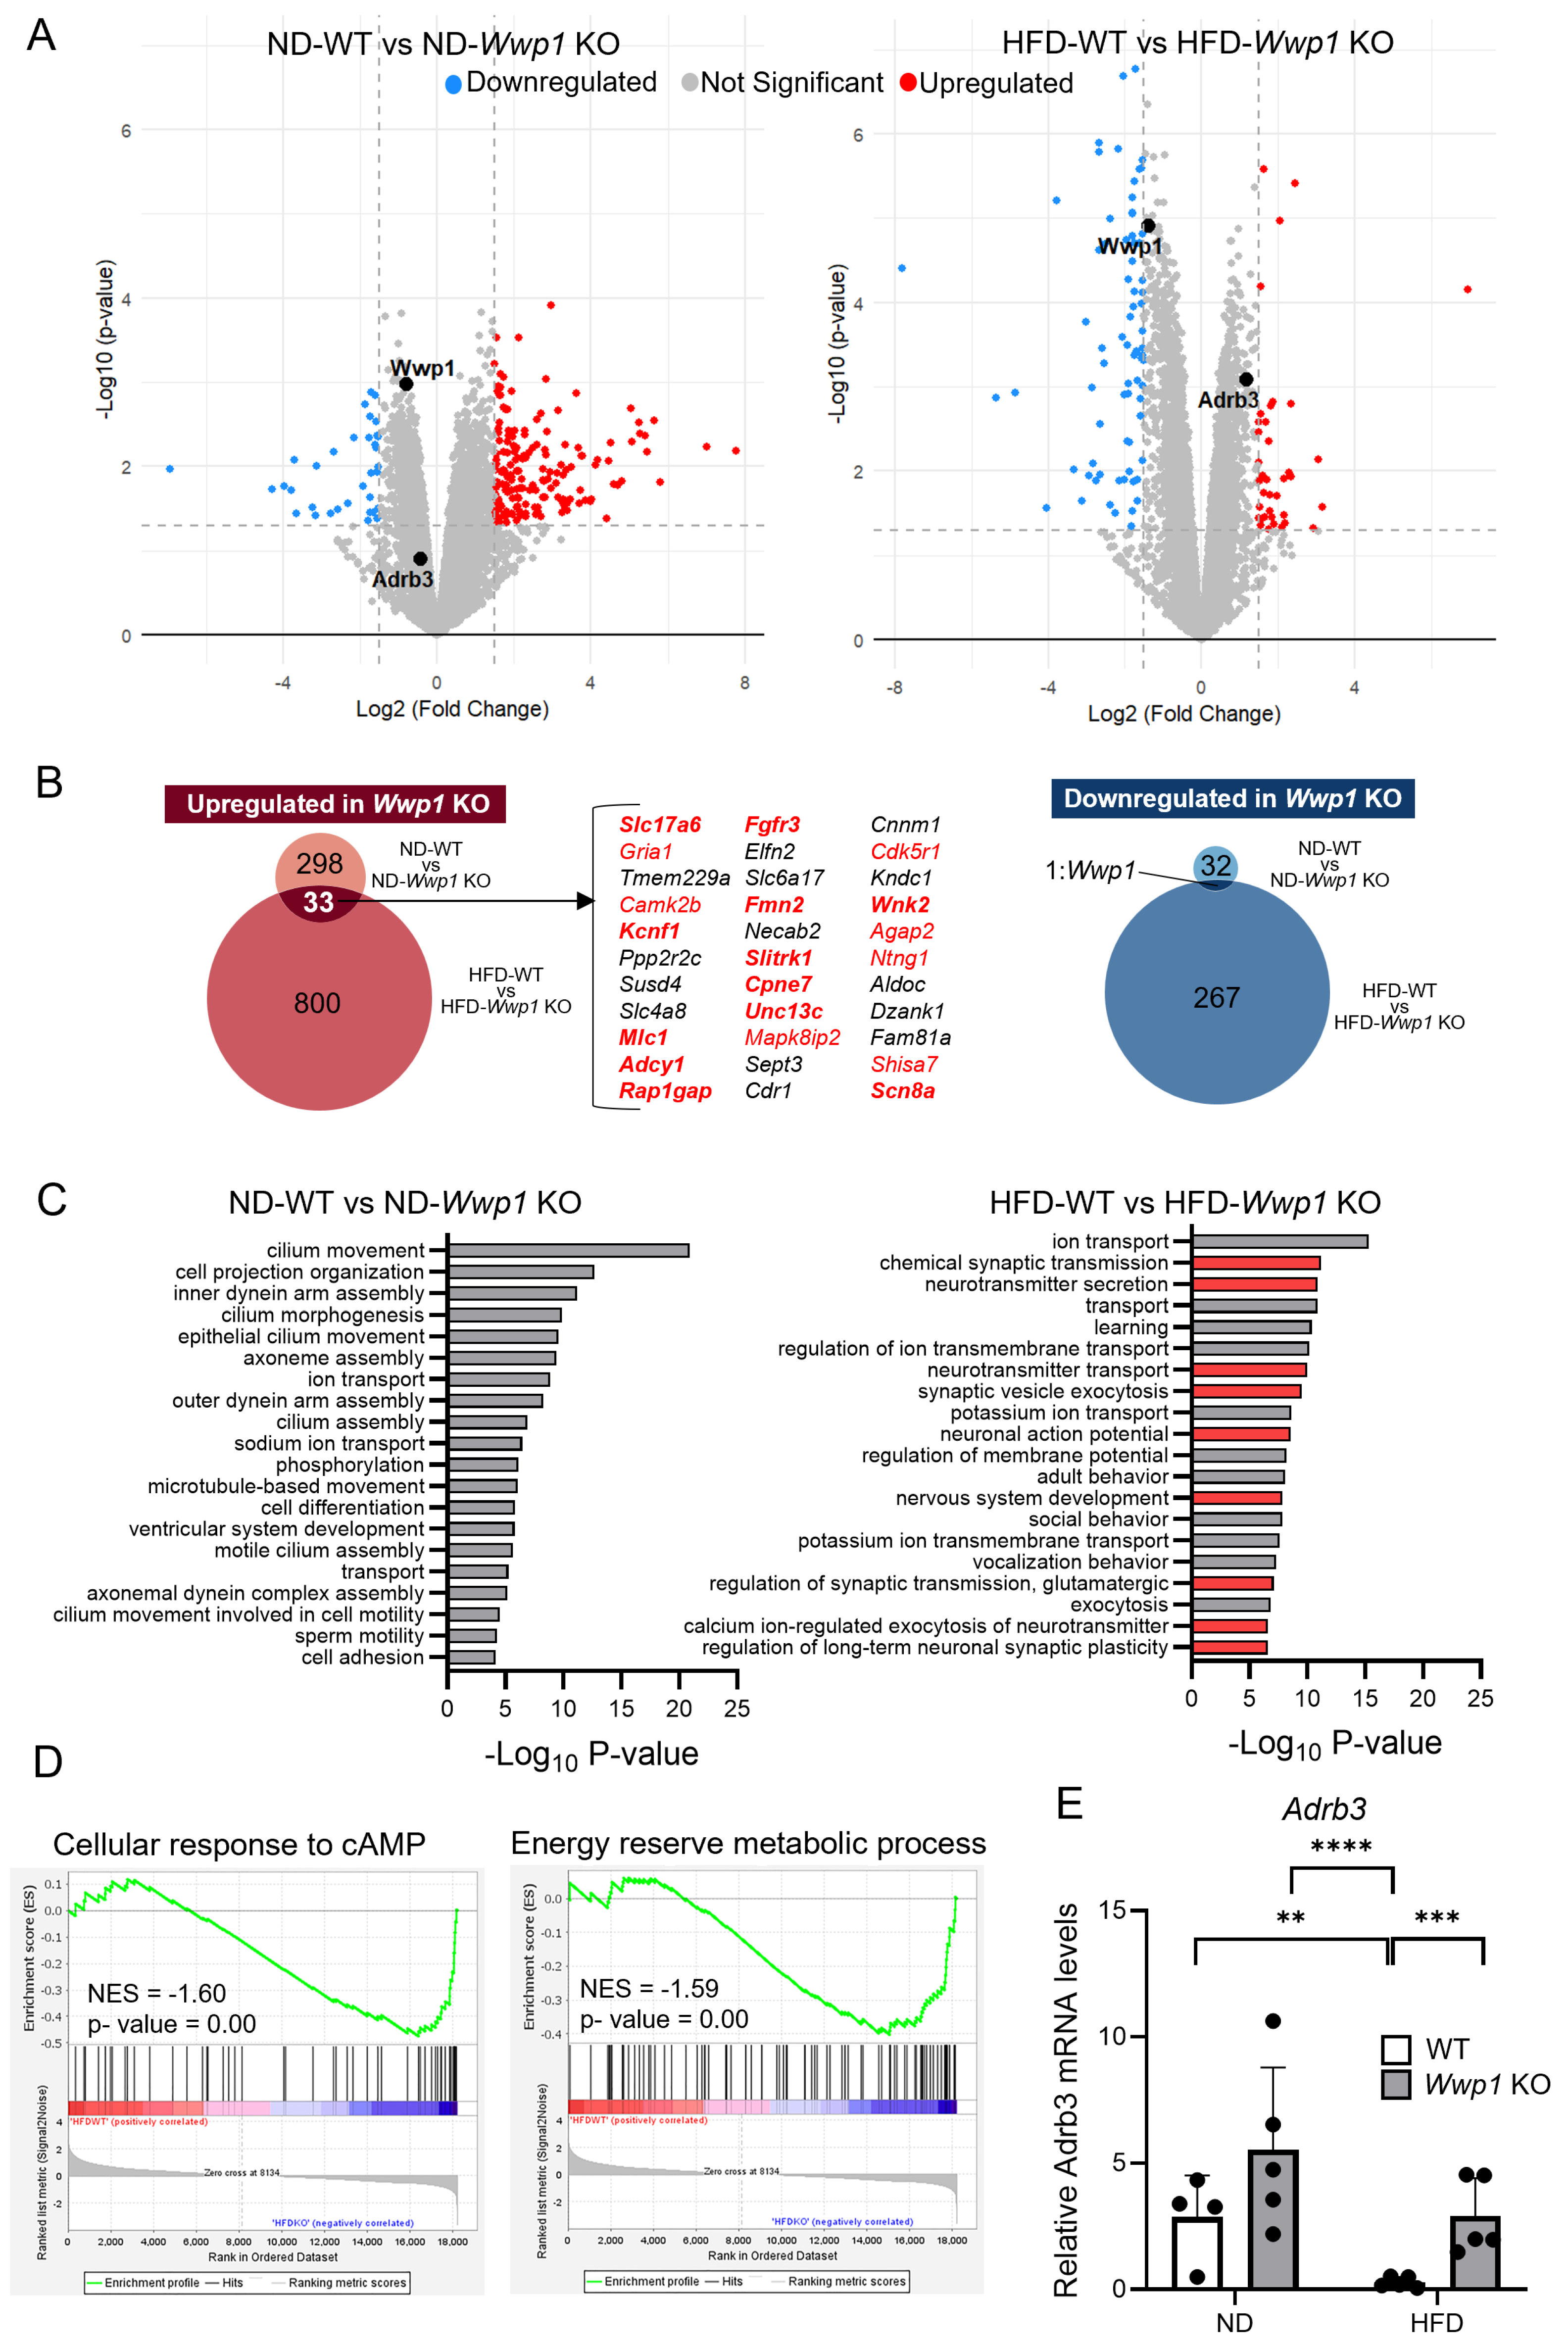
2.1. Depletion of WWP1 Increases Adrb3 mRNA Expression in Epididymal WAT

We found that HFD-induced obesity increased WWP1 protein expression in WAT, similar to our previous report [13]. Under HFD-fed conditions, Wwp1 KO mice exhibited reduced body weight, while there were no difference in subcutaneous WAT (sWAT) or epididymal WAT (eWAT) mass and amount of food intake compared with WT mice (Figure 1A,B and Table 1). The depletion of WWP1 in eWAT of Wwp1 KO mice was observed at the protein level (Figure 1). To gain insight into the distinctive features of eWAT in Wwp1 KO mice, we conducted a comparative transcriptome analysis using RNA-seq (Figure 2A). The 33 genes upregulated by Wwp1 KO with a normal diet (ND) or HFD were nervous-system-related genes, which suggests that depletion WWP1 contributes to nervous-system-related pathways. Among them, 12 genes are related to peripheral tissue (Figure 2B). Pathway enrichment analysis using DAVID showed that the genes involved in nervous-system-related pathways were increased by Wwp1 KO only in the HFD condition (Figure 2C). Differentially expressed genes (DEGs) were then determined using the edgeR program package [16]. Wwp1 KO enriched genes related to “cellular response to cAMP” and “energy reserve metabolic process” in HFD mice (Figure 2D). Obesity is frequently associated with chronic inflammation. We found that immune-system-related genes were not altered in Wwp1 KO (Figure 2D). We also found that an HFD-induced decrease in Adrb3 expression compared with the ND condition in WT mice was significantly increased in Wwp1 KO mice (Figure 2A,E).

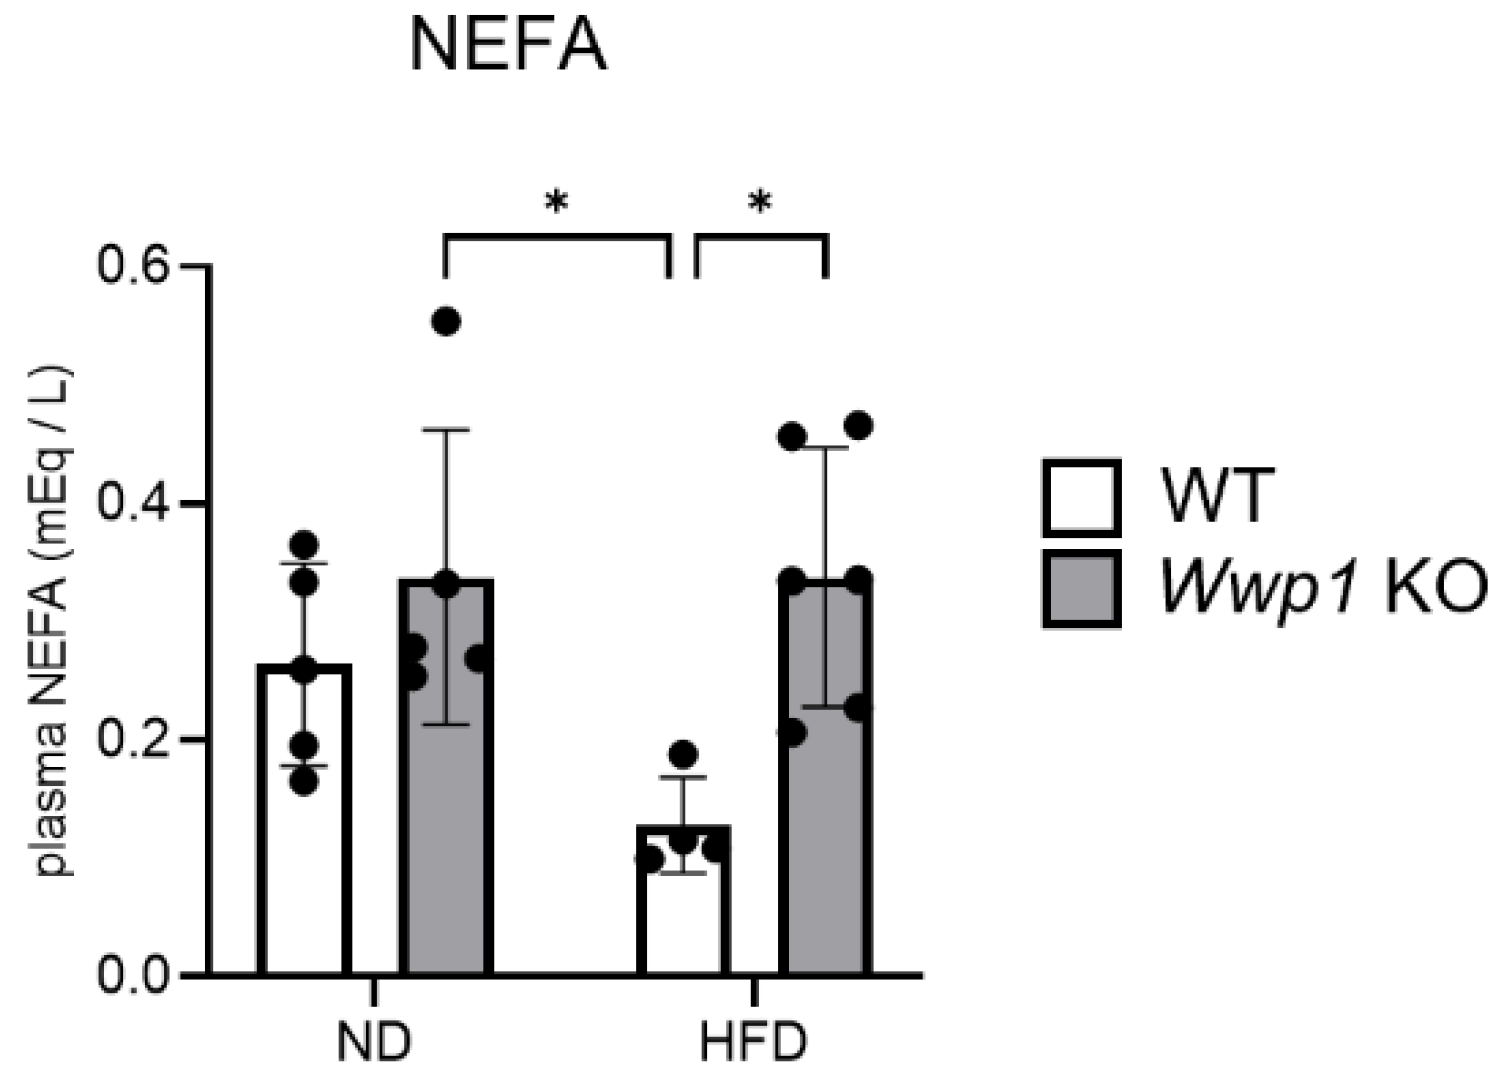
2.2. Depletion of WWP1 Increases Phosphorylation of HSL in eWAT and Plasma Non-Esterified Fatty Acid (NEFA) Concentrations

We performed Western blotting and analyzed the amount of lipid-homeostasis-related protein expression in Wwp1 KO mice in the ND or HFD condition. We found that the ratio of phosphorylated HSL (S660)/HSL was increased (suggesting enhanced lipolysis) in Wwp1 KO mice not only in the ND, but also in the HFD condition (Figure 3). Notably, plasma NEFA concentrations were increased only in HFD-fed Wwp1 KO mice (Figure 4). However, levels of lipogenesis-related proteins, namely acetyl-CoA carboxylase (ACC), ATP citrate lyase (ACLY), and malic enzyme 1 (ME1), were not significantly different between Wwp1 KO and WT mice (Supplementary Figure S1). These results suggested that depletion of WWP1 enhanced lipolysis by increasing phosphorylation of HSL in the HFD-fed model.

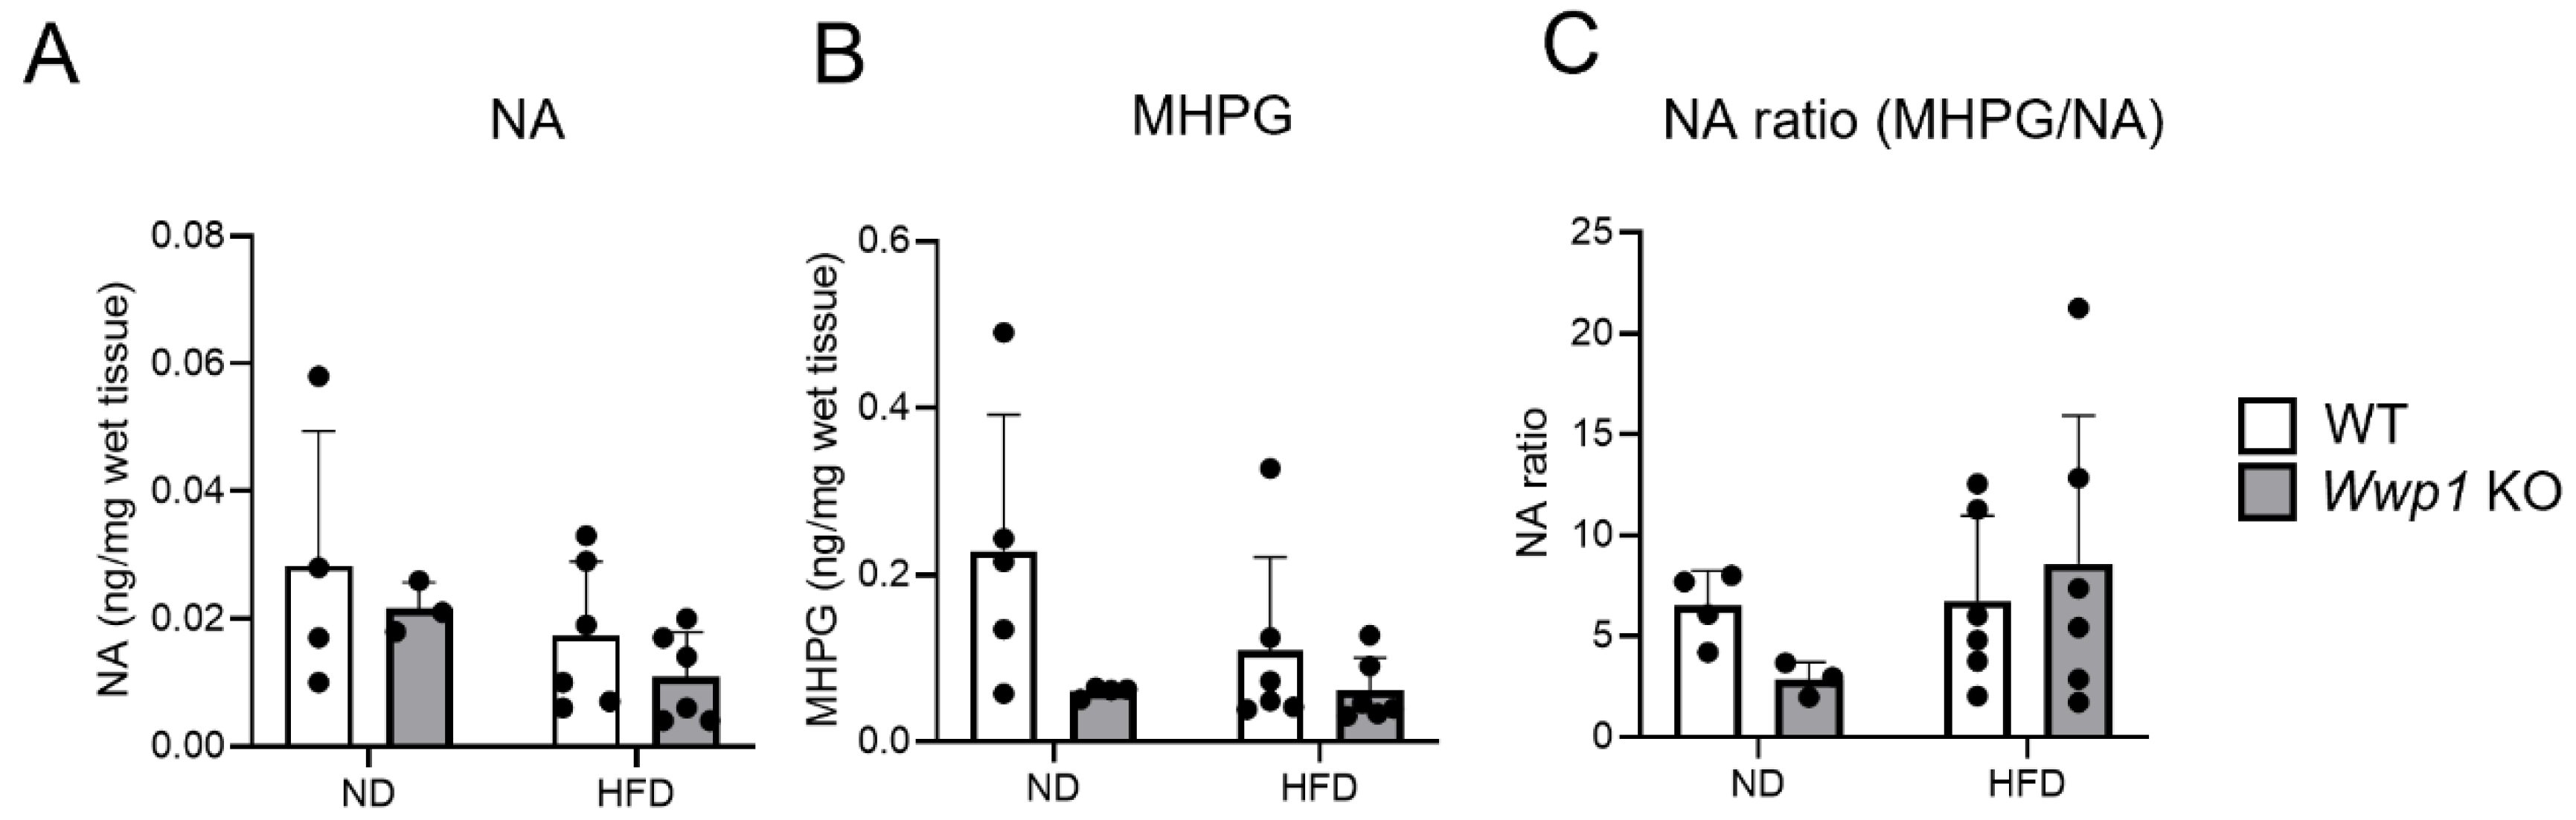
2.3. Noradrenaline Metabolism Is Not Changed by Wwp1 KO in eWAT

To evaluate whether noradrenaline (NA) contributes to the lipolytic response of Wwp1 KO mice, we measured the levels of NA and its end metabolite 3-methoxy-4-hydroxyphenilglycol (MHPG) in eWAT derived from ND- and HFD-fed Wwp1 KO mice. NA and MHPG levels were not significantly different between Wwp1 KO and WT mice in the ND- and HFD-fed conditions (Figure 5A,B), and the ratio of MHPG/NA was also not different between the two groups of mice in either diet condition (Figure 5C).

3. Discussion

β3-adrenergic receptor protein, which is coded by the Adrb3 gene, is stimulated by NA and then increases intracellular cAMP levels through activation of adenylyl cyclase. cAMP then activates protein kinase A, and protein kinase A catalyzes the phosphorylation of HSL to increase lipolysis [17]. Recent human cohort studies have shown that Adrb3 expression in subcutaneous WAT is negatively correlated with the body mass index in women with or without obesity [6]. In addition, several previous studies have shown that obesity reduces Adrb3 expression [18,19] and intracellular cAMP levels in adipocytes of WAT [18]. We found that Adrb3 mRNA expression was decreased by an HFD in WT mice, and this HFD-induced downregulation was completely abolished with Wwp1 KO (Figure 2E). We also found that upregulated genes by depletion of WWP1 enriched the “cellular response to cAMP”-related and “energy reserve metabolic process”-related genes using GSEA (Figure 2D),and increased phosphorylated HSL levels (Figure 3) and plasma NEFA concentrations (Figure 4). On the basis of our previous finding that an HFD increased WWP1 expression [13], we propose that WWP1 is one of the candidates that negatively regulates lipolysis owing to decreased Adrb3 expression in WAT during obesity. However, further studies are required to clearly identify the relationship between WWP1 and Adrb3 expression.
We also evaluated downstream signaling to assess whether there is cAMP-PKA signaling in WAT of obese Wwp1 KO mice. Although no significant change in global PKA substrate phosphorylation was detected in our study (Supplementary Figure S2), cAMP/PKA signaling is compartmentalized within subcellular microdomains and coordinated by A-kinase anchoring proteins, which may not be reflected in whole-tissue lysates [20,21]. Therefore, compartmentalization and local control of cAMP may be essential for effective lipolytic signaling downstream of Adrb3, with potential modulation by WWP1.
WWP1 is important for developing neurons and controlling the nervous system. WWP1 and WWP2, which are mediated by SRY-box9, contribute to the polarization of developing pyramidal neurons [22]. In addition, Qin et al. suggested that WWP1 interacts with Nogo-1, which is a key factor of inhibitory central nervous system regeneration and maintaining the integrity of the neuromuscular junction [23]. In our study, nervous-system-related pathways were increased by Wwp1 KO (Figure 2B,C). Based on these results, we speculated that WWP1 has the potential to control NA metabolism in peripheral nerves in WAT, but we found that NA metabolism did not change (Figure 5). Therefore, enhancing lipolysis in WAT due to WWP1 deficiency is mainly due to signal transduction via increased expression of Adrb3 in adipocytes and might not involve the nerve transmission and NA metabolism in WAT.
In our previous study, we showed that obese Wwp1 KO mice improved whole-body glucose metabolism compared with WT mice using the insulin tolerance test (ITT) and glucose tolerance test (GTT) [14]. To assess the role of WWP1 in glucose metabolism, in a previous study we evaluated insulin signaling (pAkt/Akt rate) in insulin-sensitive tissues, including WAT, the liver, and skeletal muscle. We found that obese Wwp1 KO mice showed an enhanced hepatic insulin signaling response and had a reduced weight and triglyceride contents only in the liver and not in WAT [15]. Therefore, targeting WWP1 may be useful in the treatment of obesity and type-2 diabetes through its dual functions. One of these functions is improving systemic glucose metabolism by increasing hepatic insulin sensitivity, and the other is increasing lipolysis in WAT by increasing Adrb3.

4. Materials and Methods

4.1. Mice

All mouse experiments and protocols were conducted in accordance with the Fundamental Guidelines for Proper Conduct of Animal Experiments and Related Activities in Academic Research Institutions under the jurisdiction of the Ministry of Education, Culture, Sports, Science and Technology of Japan. The study protocol was approved by the Ethics Review Committee for Animal Experimentation at Tokyo University of Science (approval numbers: Y20043, Y21043, and Y22037). Mice with systemic KO of Wwp1 (Wwp1−/− mice) and wild-type (WT) Wwp1+/+ mice were generated as previously reported [14]. Genotyping of the offspring was performed by polymerase chain reaction (PCR) using KOD FX neo (Toyobo, Osaka, Japan) with the following primers: forward, 5′-AGA GGC AAG AGA ATG GCG TCA AG-3′; and reverse, 5′-GGA GGT GAA AGG GTT GGA AGA ATA C-3′. The mice were maintained under specific-pathogen-free conditions at 23 °C, under a 12 h light/dark cycle in the animal facility at the Faculty of Pharmaceutical Sciences, Tokyo University of Science. They had free access to water and were fed a Charles River Formula-1 diet (21.9% crude protein, 5.4% crude fat, and 2.9% crude fiber; Oriental Yeast, Tokyo, Japan). At 5 weeks old, WT and KO mice were divided into the ND group and the HFD group. The Charles River Formula-1 diet and High-Fat Diet 32 (25.5% crude protein, 32.0% crude lipids, and 2.9% crude fiber; CREA, Tokyo, Japan) were fed as the ND and HFD, respectively. At 15 weeks old, the mice were euthanized under isoflurane anesthesia (Mylan, Canonsburg, PA, USA) and organs were collected. These tissues were immediately diced, frozen in liquid nitrogen, and stored at −80 °C.

4.2. RNA-Seq and Gene Set Enrichment Analysis

Total RNA was extracted from eWAT derived from ND-WT (n = 4), ND-Wwp1 KO (n = 3), HFD-WT (n = 4), and HFD-Wwp1 KO (n = 4) mice using ISOGEN II (Nippon Gene, Toyama, Japan) according to the manufacturer’s protocol. Library preparation and RNA-seq were outsourced to Tsukuba i-Laboratory LLP (Ibaraki, Japan). The RNA-seq reads were aligned to the mouse reference genome GRCm39, which was calculated using STAR two-pass alignment for mapping RNA-seq reads to genomes [24,25]. The number of transcripts per million was calculated and gene expression levels were quantified using featureCounts from the Subread package [26]. DEGs were calculated using the edgeR program package [16].

4.3. Immunoblotting

The preparation of cell lysates and immunoblotting were performed according to our previously reported methods [27]. Briefly, cells were lysed with sodium dodecyl sulfate sample buffer, boiled for 5 min, and sonicated. Lysates were subjected to sodium dodecyl sulfate–polyacrylamide gel electrophoresis (15 µg protein/well), and separated proteins were transferred onto nitrocellulose membranes. The membranes were blocked with blocking solution (2.5% skim milk, 0.25% bovine serum albumin in Tris-buffered saline with Tween 20 (25 mM Tris-HCl, pH 7.4, 140 mM NaCl, 2.5 mM KCl, and 0.1% Tween 20)) for 1 h at room temperature and then probed with the appropriate primary antibodies overnight at 4 °C. The anti-WWP1 antibody was generated in our laboratory [13]. Anti-HSL (#4017), anti-phospho-HSL (S660, #4126), ACC (#3662) antibodies, and phospho-PKA substrate (#9624) were from Cell Signaling Technology (Danvers, MA, USA). Anti-ACLY (#1699-1) and anti-phospho-ACLY (#1822-1) antibodies were from Epitomics, an Abcam company (Cambridge, UK), The anti-FASN antibody (fatty acid synthase; #910963) was from BD Biosciences (Franklin Lakes, NJ, USA). The anti-ME1 antibody (#SAB4501853) was from Sigma-Aldrich (St. Louis, MO, USA), and the anti-lamin B1 antibody (#PM064) was from MBL (Aichi, Japan). Subsequently, the membranes were incubated with appropriate secondary antibodies (horseradish-peroxidase-conjugated F[ab′]2 fragment of goat anti-mouse immunoglobulin G or anti-rabbit immunoglobulin G (Jackson ImmunoResearch; West Grove, PA, USA)) for 1 h at room temperature. Antibody-bound proteins were visualized using ImmunoStar LD Reagent from Wako (Osaka, Japan) and a LAS3000 Image Analyzer from Fujifilm (Tokyo, Japan) or ChemiDoc Touch MP from Bio-Rad (Hercules, CA, USA). The data were analyzed using MULTIGAGE software (v3.2) (GE Healthcare, Chicago, WI, USA) or Image Lab (v6.1.0) from Bio-Rad (Hercules).

4.4. Image Processing of Original Blots

The original blots are shown in the Supplementary Information. Original images of full-length membranes could not be included because the membranes were cut before hybridization with antibodies. Therefore, all replicates performed for some blots are included.

4.5. Quantitative Real-Time PCR

Total RNA was extracted using ISOGEN II (Nippon Gene), and reverse transcription was performed using ReverTra Ace® qPCR RT Master Mix (Toyobo). Quantitative real-time PCR was performed using the CFX ConnectTM Real Time System (Bio-Rad, Hercules) and Thunderbird SYBR qPCR mix (Toyobo) according to the manufacturers’ protocols. Values were normalized to Rps18 expression levels. All expression changes were normalized to the ND-WT. Sequences of primers used for PCR were as follows: Adrb3 (forward, 5′-AAC TGA AAC AGC AGA CAG GGA C-3′ and reverse, 5′-CCC CCA TGT ACA CCC TAG TT-3′), and Rps18 (forward, 5′-TGC GAG TAC TCA ACA CCA ACA T-3′ and reverse, 5′-CTT TCC TCA ACA CCA CAT GAG C-3′). Rps18 was used as a housekeeping gene.

4.6. Plasma Non-Esterified Fatty Acid Concentrations

Plasma non-esterified fatty acid (NEFA) concentrations were measured using LabAssay NEFA (Fujifilm Wako Pure Chemical, Osaka, Japan) and this was performed in accordance with the manufacturer’s protocols.

4.7. Quantification of Monoamine Contents in the Brain

Using eWAT, MHPG and NA levels were quantified using high-performance liquid chromatography. The eWAT was homogenized in 500 µL of 0.2 M perchloric acid containing 2 ng of isoproterenol as an internal standard. The homogenates were placed on ice for 30 min and then centrifuged at 15,000 rpm for 20 min at 4 °C. To maintain the mixture at pH 3, 0.1 M sodium acetate was added to the supernatant. The samples were filtered using 0.2 µm Minisart RC 4.0 (Sartorius, Göttingen, Germany). The samples (10 µL) were analyzed by high-performance liquid chromatography using electrochemical detection. NA levels were quantified under the following conditions. An electrochemical detector (ECD-300; Eicom Co., Ltd., Kyoto, Japan) was equipped with a graphite electrode (WE-3G; Eicom Co., Ltd.), which was used at a voltage setting of 650 mV with an Ag/AgCl reference electrode. The mobile phase comprised 0.1 M sodium acetate/0.1 M citric acid buffer (pH 3.5) containing 12% methanol, 175 mg/L 1-octanesulfonic acid sodium salt, and 5 mg/L EDTA-2 Na. Monoamines were separated on a C-18 column (150 × 3 mm reversed-phase, EICOMPAK SC-5ODS; Eicom Co., Ltd.). The mobile phase flow rate was maintained at 0.3 mL/min with a column temperature of 30.0 °C. MHPG levels were quantified under the following conditions. The electrochemical detector (ECD-300; Eicom Co., Ltd.) was equipped with a graphite electrode (WE-3G; Eicom Co., Ltd.), which was used at a voltage setting of 750 mV with an Ag/AgCl reference electrode. The mobile phase comprised 0.1 M sodium acetate/0.1 M citric acid buffer (pH 3.5) containing 13% methanol, 180 mg/L 1-octanesulfonic acid sodium salt, and 5 mg/L EDTA-2 Na. Monoamines were separated on a C-18 column (150 × 3 mm reversed-phase, EICOMPAK SC-5ODS; Eicom Co., Ltd.). The mobile phase flow rate was maintained at 0.5 mL/min with a column temperature of 30.0 °C [28].

4.8. Statistical Analysis

Statistical analysis was performed using GraphPad Prism version 10.1.2 (324) and version 8.4.1 (676) (GraphPad Software, San Diego, CA, USA; www.graphpad.com). To assess the normality of data distribution in each group, we conducted the Shapiro–Wilk test and visual inspection using Q-Q plots (Supplementary Figure S3). While the Shapiro–Wilk test did not provide statistically significant evidence of normality, likely because of the small sample size, the Q-Q plots did not indicate substantial deviations from the normal distribution. Therefore, we judged that the data were approximately normally distributed. An ANOVA is robust for mild violations of normality, particularly in small-sample studies [29,30]. Therefore, a two-way ANOVA was applied to compare groups.

5. Conclusions

Obesity is associated with an increase in basal lipolysis [3,4] but a decrease in catecholamine-stimulated lipolysis [5]. This study shows that depletion of WWP1 increases Adrb3 expression, which is decreased by an HFD, and increases phosphorylation of HSL. We speculate that WWP1, which is increased in obesity, is a candidate for reducing catecholamine-stimulated lipolysis due to obesity. This research will ultimately lead to a better understanding of a decrease in catecholamine-stimulated lipolysis in WAT in obesity. On the basis of our results, we anticipate that co-treatment of inhibition of WWP1 expression and Adrb3 agonists will become a novel treatment for catecholamine resistance of obesity and diabetes.

Supplementary Materials

The following supporting information can be downloaded at: https://www.mdpi.com/article/10.3390/ijms26094219/s1.

Author Contributions

Conceptualization, Y.N., M.K. and Y.H.; methodology, Y.N., Y.M., M.K., A.S. and Y.H.; investigation, Y.N., Y.O. and C.O.; writing—original draft, Y.N.; writing—review and editing, Y.M., M.K., A.S. and Y.H.; supervision, M.K. and Y.H. All authors have read and agreed to the published version of the manuscript.

Funding

This work was supported by JSPS KAKENHI Grant Number 23659207.

Institutional Review Board Statement

The animal study protocol was approved by the Ethics Review Committee for Animal Experimentation at Tokyo University of Science (approval numbers: Y20043, Y21043, and Y22037).

Informed Consent Statement

Not applicable.

Data Availability Statement

The RNA-seq data have been deposited in the public repository “Gene Expression Omnibus” (GEO) (www.ncbi.nlm.nih.gov/geo (accessed on 17 December 2024)) and will be accessible through GEO: GSE286128. All data reported in this article will be shared by the lead contact upon request. Any additional information required to reanalyze the data reported in this article is available from the lead contact upon request.

Acknowledgments

We are grateful to Hiroshi Kawabe (Gunma University) for providing the Wwp1 KO mice. We thank Ellen Knapp, from Edanz (https://jp.edanz.com/ac (accessed on 17 December 2024)), for editing a draft of this manuscript.

Conflicts of Interest

The authors declare no competing interests.

Abbreviations

ACCacetylcholine-gated chloride channel subunit
ACLYATP citrate synthase
AIP5atrophin-1-interacting protein 5
eWATepididymal white adipose tissue
Adrb3 beta-3 adrenergic receptor
cAMPcyclic adenosine monophosphate
HECThomologous to the E6-AP carboxyl terminus
HFDhigh-fat diet
HSLhormone-sensitive lipase
ME1malic enzyme 1
MHPGmetabolite 3-methoxy-4-hydroxyphenilglycol
NAnoradrenaline
NDnormal diet
TIUL1TGIF-interacting ubiquitin ligase 1
WWP1WW domain-containing E3 ubiquitin protein ligase 1

References

  1. Hotamisligil, G.S. Inflammation and metabolic disorders. Nature 2006, 444, 860–867. [Google Scholar] [CrossRef] [PubMed]
  2. Ouchi, N.; Parker, J.L.; Lugus, J.J.; Walsh, K. Adipokines in inflammation and metabolic disease. Nat. Rev. Immunol. 2011, 1, 85–97. [Google Scholar] [CrossRef] [PubMed]
  3. Reynisdottir, S.; Langin, D.; Carlström, K.; Holm, C.; Rössner, S.; Arner, P. Effects of weight reduction on the regulation of lipolysis in adipocytes of women with upper-body obesity. Clin. Sci. 1995, 89, 421–429. [Google Scholar] [CrossRef]
  4. Bougnères, P.; Stunff, C.L.; Pecqueur, C.; Pinglier, E.; Adnot, P.; Ricquier, D. In vivo resistance of lipolysis to epinephrine. A new feature of childhood onset obesity. J. Clin. Investig. 1997, 99, 2568–2573. [Google Scholar] [CrossRef]
  5. Large, V.; Reynisdottir, S.; Langin, D.; Fredby, K.; Klannemark, M.; Holm, C.; Arner, P. Decreased expression and function of adipocyte hormone-sensitive lipase in subcutaneous fat cells of obese subjects. J. Lipid Res. 1999, 40, 2059–2066. [Google Scholar] [CrossRef]
  6. Valentine, J.M.; Ahmadian, M.; Keinan, O.; Abu-Odeh, M.; Zhao, P.; Zhou, X.; Keller, M.P.; Gao, H.; Yu, R.T.; Liddle, C.; et al. β3-Adrenergic receptor downregulation leads to adipocyte catecholamine resistance in obesity. J. Clin. Investig. 2022, 132, e153357. [Google Scholar] [CrossRef]
  7. Nagiri, C.; Kobayashi, K.; Tomita, A.; Kato, M.; Kobayashi, K.; Yamashita, K.; Nishizawa, T.; Inoue, A.; Shihoya, W.; Nureki, O. Cryo-EM structure of the β3-adrenergic receptor reveals the molecular basis of subtype selectivity. Mol. Cell 2021, 81, 3205–3215.e5. [Google Scholar] [CrossRef]
  8. Di Salvo, J.; Nagabukuro, H.; Wickham, L.A.; Abbadie, C.; DeMartino, J.A.; Fitzmaurice, A.; Gichuru, L.; Kulick, A.; Donnelly, M.J.; Jochnowitz, N.; et al. Pharmacological Characterization of a Novel Beta 3 Adrenergic Agonist, Vibegron: Evaluation of Antimuscarinic Receptor Selectivity for Combination Therapy for Overactive Bladder. J. Pharmacol. Exp. Ther. 2017, 360, 346–355. [Google Scholar] [CrossRef]
  9. Takasu, T.; Ukai, M.; Sato, S.; Matsui, T.; Nagase, I.; Maruyama, T.; Sasamata, M.; Miyata, K.; Uchida, H.; Yamaguchi, O. Effect of (R)-2-(2-aminothiazol-4-yl)-4′-{2-[(2-hydroxy-2-phenylethyl)amino]ethyl} acetanilide (YM178), a novel selective beta3-adrenoceptor agonist, on bladder function. J. Pharmacol. Exp. Ther. 2007, 321, 642–647. [Google Scholar] [CrossRef]
  10. Sacco, E.; Bientinesi, R. Mirabegron: A review of recent data and its prospects in the management of overactive bladder. Ther. Adv. Urol. 2012, 4, 315–324. [Google Scholar] [CrossRef]
  11. Seo, S.; RLallemand, F.; Ferrand, N.; Pessah, M.; L’Hoste, S.; Camonis, J.; Atfi, A. The novel E3 ubiquitin ligase Tiul1 associates with TGIF to target Smad2 for degradation. EMBO J. 2004, 23, 3780–3792. [Google Scholar] [CrossRef] [PubMed]
  12. Zhi, X.; Chen, C. WWP1: A versatile ubiquitin E3 ligase in signaling and diseases. Cell Mol. Life Sci. 2012, 69, 1425–1434. [Google Scholar] [CrossRef]
  13. Kobayashi, M.; Hoshino, S.; Abe, T.; Okita, N.; Tagawa, R.; Nagai, W.; Konno, R.; Suzuki, Y.; Furuya, K.; Ishikawa, N.; et al. Identification of WWP1 as an obesity-associated E3 ubiquitin ligase with a protective role against oxidative stress in adipocytes. Biochem. Biophys. Res. Commun. 2019, 508, 117–122. [Google Scholar] [CrossRef]
  14. Hoshino, S.; Kobayashi, M.; Tagawa, R.; Konno, R.; Abe, T.; Furuya, K.; Miura, K.; Wakasawa, H.; Okita, N.; Sudo, Y.; et al. WWP1 knockout in mice exacerbates obesity-related phenotypes in white adipose tissue but improves whole-body glucose metabolism. FEBS Open Bio 2020, 10, 306–315. [Google Scholar] [CrossRef]
  15. Nozaki, Y.; Kobayashi, M.; Wakasawa, H.; Hoshino, S.; Suwa, F.; Ose, Y.; Tagawa, R.; Higami, Y. Systemic depletion of WWP1 improves insulin sensitivity and lowers triglyceride content in the liver of obese mice. FEBS Open Bio 2023, 13, 1086–1094. [Google Scholar] [CrossRef]
  16. Robinson, M.D.; Oshlack, A. A scaling normalization method for differential expression analysis of RNA-seq data. Genome Biol. 2010, 11, R25. [Google Scholar] [CrossRef]
  17. Carmen, G.Y.; Víctor, S.M. Signalling mechanisms regulating lipolysis. Cell. Signal. 2006, 18, 401–408. [Google Scholar] [CrossRef]
  18. Komai, A.M.; Musovic, S.; Peris, E.; Alrifaiy, A.; El Hachmane, M.F.; Johansson, M.; Asterholm, I.W.; Olofsson, C.S. White Adipocyte Adiponectin Exocytosis Is Stimulated via β3-Adrenergic Signaling and Activation of Epac1: Catecholamine Resistance in Obesity and Type 2 Diabetes. Diabetes 2016, 65, 3301–3313. [Google Scholar] [CrossRef]
  19. Cao, W.Y.; Liu, Z.; Guo, F.; Yu, J.; Li, H.; Yin, X. Adipocyte ADRB3 Down-Regulated in Chinese Overweight Individuals Adipocyte ADRB3 in Overweight. Obes. Facts 2018, 11, 524–533. [Google Scholar] [CrossRef]
  20. Zaccolo, M. Spatial control of cAMP signalling in health and disease. Curr. Opin. Pharmacol. 2011, 11, 649–655. [Google Scholar] [CrossRef]
  21. Steinberg, S.F.; Brunton, L.L. Compartmentation of G protein-coupled signaling pathways in cardiac myocytes. Annu. Rev. Pharmacol. Toxicol. 2001, 41, 751–773. [Google Scholar] [CrossRef] [PubMed]
  22. Ambrozkiewicz, M.C.; Schwark, M.; Kishimoto-Suga, M.; Borisova, E.; Hori, K.; Salazar-Lázaro, A.; Rusanova, A.; Altas, B.; Piepkorn, L.; Bessa, P.; et al. Polarity Acquisition in Cortical Neurons Is Driven by Synergistic Action of Sox9-Regulated Wwp1 and Wwp2 E3 Ubiquitin Ligases and Intronic miR-140. Neuron 2018, 100, 1097–1115.e1015. [Google Scholar] [CrossRef] [PubMed]
  23. Qin, H.; Pu, H.X.; Li, M.; Ahmed, S.; Song, J. Identification and structural mechanism for a novel interaction between a ubiquitin ligase WWP1 and Nogo-A, a key inhibitor for central nervous system regeneration. Biochemistry 2008, 47, 13647–13658. [Google Scholar] [CrossRef]
  24. Dobin, A.; Gingeras, T.R. Mapping RNA-seq Reads with STAR. Curr. Protoc. Bioinform. 2015, 51, 11–14. [Google Scholar] [CrossRef]
  25. Dobin, A.; Davis, C.A.; Schlesinger, F.; Drenkow, J.; Zaleski, C.; Jha, S.; Batut, P.; Chaisson, M.; Gingeras, T.R. STAR: Ultrafast universal RNA-seq aligner. Bioinformatics 2013, 29, 15–21. [Google Scholar] [CrossRef]
  26. Liao, Y.; Smyth, G.K.; Shi, W. featureCounts: An efficient general purpose program for assigning sequence reads to genomic features. Bioinformatics 2014, 30, 923–930. [Google Scholar] [CrossRef] [PubMed]
  27. Okita, N.; Hayashida, Y.; Kojima, Y.; Fukushima, M.; Yuguchi, K.; Mikami, K.; Yamauchi, A.; Watanabe, K.; Noguchi, M.; Nakamura, M.; et al. Differential responses of white adipose tissue and brown adipose tissue to caloric restriction in rats. Mech. Ageing Dev. 2012, 133, 255–266. [Google Scholar] [CrossRef]
  28. Saitoh, A.; Nagayama, Y.; Yamada, D.; Makino, K.; Yoshioka, T.; Yamanaka, N.; Nakatani, M.; Takahashi, Y.; Yamazaki, M.; Shigemoto, C.; et al. Disulfiram Produces Potent Anxiolytic-Like Effects Without Benzodiazepine Anxiolytics-Related Adverse Effects in Mice. Front. Pharmacol. 2022, 13, 826783. [Google Scholar] [CrossRef]
  29. Blanca, M.J.; Alarcón, R.; Arnau, J.; Bono, R.; Bendayan, R. Non-normal data: Is ANOVA still a valid option? Psicothema 2017, 29, 552–557. [Google Scholar] [CrossRef]
  30. Norman, G. Likert scales, levels of measurement and the “laws” of statistics. Adv. Health Sci. Educ. Theory Pract. 2010, 15, 625–632. [Google Scholar] [CrossRef]
Figure 1. Body weight, food intake, and WWP1 protein levels of obese Wwp1 KO mice. (A,B) Monitoring of body weight (n = 4–6) (A) and food intake (n = 10–14) (B) for 10 weeks in the HFD-fed period in 5-week-old ND- or HFD-fed Wwp1 KO mice. (C) WWP1 protein levels in eWAT derived from ND-WT, ND-Wwp1 KO, HFD-WT, and HFD-Wwp1 KO mice (upper panel; representative image, lower panel; quantitative value). Lamin B1 was used as an internal control. Each dot represents one mouse (n = 4–6). Quantitative values are the mean ± SD. Differences between these values were analyzed using two-way ANOVA and the Tukey–Kramer test (*** p < 0.001 and **** p < 0.0001).
Ijms 26 04219 g001
Figure 2. Wwp1 KO increases nervous-system-related gene expression and Adrb3 expression in eWAT of obese mice. (AD) Expression analysis using RNA-seq of eWAT derived from ND-WT (n = 4), ND-Wwp1 KO (n = 3), HFD-WT (n = 4), and HFD-Wwp1 KO (n = 4) mice. Three or four samples in each group were used as experimental replicates. (A) Volcano plots present DEGs of eWAT of Wwp1 KO mice compared with WT in the ND (left panel, total = 11,497 variables) and HFD (right panel, total = 10,779 variables) conditions. Red indicates upregulated genes (log2 fold change ≥ 1.5) and blue indicates downregulated genes (log2 fold change ≤ −1.5), with a p value threshold of 0.05. (B) Venn diagram showing overlapped upregulated (upper panel) and downregulated (lower panel) genes (false discovery rate < 0.1 and |FC| > 1.5) in WT and Wwp1 KO mice in the ND and HFD conditions. The genes in red font are nervous-system-related factors. (C) Gene ontology enrichment analysis showing significantly enriched upregulated genes in Wwp1 KO mice compared with WT mice in the ND and HFD conditions (false discovery rate < 0.1 and fold change > 1.5) using DAVID. Red bars indicate nervous-system-related pathways. (D) Gene set enrichment analysis of DEGs of eWAT of HFD-fed Wwp1 KO mice compared with HFD-fed WT mice. (E) Levels of Adrb3 mRNA in WAT of ND- and HFD-fed WT and Wwp1 KO mice. Rps18 was used as an internal control. Quantitative values are the mean ± SD. Each dot represents one mouse (n = 4–5). Differences between these values were analyzed using two-way ANOVA and the Tukey–Kramer test with log transformation (** p < 0.01, *** p < 0.001, and **** p < 0.0001).
Ijms 26 04219 g002
Figure 3. Depletion of WWP1 increases the expression levels of lipolysis-related proteins. (A) Protein expression levels of phospho-HSL (S660), HSL, and lamin B1 in eWAT of ND- and HFD-fed WT and Wwp1 KO mice. Lamin B1 was used as an internal control. (B,C) Quantitative values of data shown in panel (A). The quantitative values are the mean ± SD. Each dot represents one mouse (n = 4–5). Differences between these values were analyzed using two-way ANOVA and the Tukey–Kramer test (* p < 0.05, ** p < 0.01, and **** p < 0.0001).
Ijms 26 04219 g003
Figure 4. Depletion of WWP1 increases plasma NEFA concentrations. Plasma NEFA concentrations in ND- and HFD-fed WT and Wwp1 KO mice are shown. The quantitative values are the mean ± SD. Each dot represents one mouse (n = 4–6). Differences between these values were analyzed using two-way ANOVA and the Tukey–Kramer test (* p < 0.05).
Ijms 26 04219 g004
Figure 5. The MHPG/NA ratio is not changed by Wwp1 KO in the HFD-fed condition. (AC) NA (A), MHPG content (B), and the MHPG/NA ratio (C) in eWAT of ND- and HFD-fed WT and Wwp1 KO mice. The quantitative values are the mean ± SD. Each dot represents one mouse (n = 4–6). Differences between these values were analyzed using two-way ANOVA and the Tukey–Kramer test.
Ijms 26 04219 g005
Table 1. Organ weight of ND- or HFD-fed Wwp1 KO mice.
NDHFD
WTWwp1 KOWTWwp1 KO
Body Weight (g)29.30 ± 0.9727.38 ± 1.0141.67 ± 2.45 ####37.11 ± 3.23 * ####
sWAT (g)0.37 ± 0.040.33 ± 0.162.04 ± 0.28 ####2.32 ± 0.62 ####
eWAT (g)0.62 ± 0.160.46 ± 0.141.64 ± 0.28 ####1.92 ± 0.52 ####
Liver (g)1.00 ± 0.031.02 ± 0.041.56 ± 0.32 ###1.24 ± 0.17 *
QFM (g)0.12 ± 0.030.13 ± 0.040.12 ± 0.040.13 ± 0.03
Heart (g)0.12 ± 0.020.12 ± 0.010.13 ± 0.010.13 ± 0.01
Brain (g)0.39 ± 0.040.39 ± 0.030.37 ± 0.030.39 ± 0.01
Values are the mean ± SD (n = 6–8). Differences between values were analyzed by two-way ANOVA and the Tukey–Kramer test. * p < 0.05 vs. WT, ### p < 0.001, #### p < 0.0001 vs. ND.
Disclaimer/Publisher’s Note: The statements, opinions and data contained in all publications are solely those of the individual author(s) and contributor(s) and not of MDPI and/or the editor(s). MDPI and/or the editor(s) disclaim responsibility for any injury to people or property resulting from any ideas, methods, instructions or products referred to in the content.

