
Exploring the Potential of Optical Genome Mapping in the Diagnosis and Prognosis of Soft Tissue and Bone Tumors

 , , , , ,
Abstract
1. Introduction
2. Results
2.1. General Data
2.2. Optical Genome Mapping Analysis
2.2.1. Performance of the Technique
2.2.2. Quality Parameters
2.2.3. Detection of Genetic Aberrations
2.2.4. Diagnosis Refinement
2.2.5. CNV Aberrations
2.2.6. Complex Cases
3. Discussion
4. Materials and Methods
4.1. Sample Processing and Selection
4.2. Ultra-High Molecular Weight DNA Extraction and Labeling
4.3. Sample Loading on Chip, Reading by Saphyr, and Data Analysis
4.4. Highly Complex Genomic Cases Analysis
5. Conclusions
Supplementary Materials
Author Contributions
Funding
Institutional Review Board Statement
Informed Consent Statement
Data Availability Statement
Acknowledgments
Conflicts of Interest
References
- Bourcier, K.; Le Cesne, A.; Tselikas, L.; Adam, J.; Mir, O.; Honore, C.; de Baere, T. Basic Knowledge in Soft Tissue Sarcoma. Cardiovasc. Intervent Radiol. 2019, 42, 1255–1261. [Google Scholar] [CrossRef] [PubMed]
- Strauss, S.J.; Frezza, A.M.; Abecassis, N.; Bajpai, J.; Bauer, S.; Biagini, R.; Bielack, S.; Blay, J.Y.; Bolle, S.; Bonvalot, S.; et al. Bone Sarcomas: ESMO-EURACAN-GENTURIS-ERN PaedCan Clinical Practice Guideline for Diagnosis, Treatment and Follow-Up. Ann. Oncol. 2021, 32, 1520–1536. [Google Scholar] [CrossRef] [PubMed]
- Gronchi, A.; Miah, A.B.; Dei Tos, A.P.; Abecassis, N.; Bajpai, J.; Bauer, S.; Biagini, R.; Bielack, S.; Blay, J.Y.; Bolle, S.; et al. Soft Tissue and Visceral Sarcomas: ESMO-EURACAN-GENTURIS Clinical Practice Guidelines for Diagnosis, Treatment and Follow-Up*. Ann. Oncol. 2021, 32, 1348–1365. [Google Scholar] [CrossRef] [PubMed]
- Pfister, S.M.; Reyes-Múgica, M.; Chan, J.K.C.; Hasle, H.; Lazar, A.J.; Rossi, S.; Ferrari, A.; Jarzembowski, J.A.; Pritchard-Jones, K.; Hill, D.A.; et al. A Summary of the Inaugural WHO Classification of Pediatric Tumors: Transitioning from the Optical into the Molecular Era. Cancer Discov. 2022, 12, 331–355. [Google Scholar] [CrossRef]
- Stiller, C.A.; Trama, A.; Serraino, D.; Rossi, S.; Navarro, C.; Chirlaque, M.D.; Casali, P.G. RARECARE Working Group Descriptive Epidemiology of Sarcomas in Europe: Report from the RARECARE Project. Eur. J. Cancer 2013, 49, 684–695. [Google Scholar] [CrossRef]
- Sbaraglia, M.; Bellan, E.; Dei Tos, A.P. The 2020 WHO Classification of Soft Tissue Tumours: News and Perspectives. Pathologica 2020, 113, 70–84. [Google Scholar] [CrossRef]
- Gamboa, A.C.; Gronchi, A.; Cardona, K. Soft-Tissue Sarcoma in Adults: An Update on the Current State of Histiotype-Specific Management in an Era of Personalized Medicine. CA Cancer J. Clin. 2020, 70, 200–229. [Google Scholar] [CrossRef]
- Choi, J.H.; Ro, J.Y. The Recent Advances in Molecular Diagnosis of Soft Tissue Tumors. Int. J. Mol. Sci. 2023, 24, 5934. [Google Scholar] [CrossRef]
- Nakano, K.; Takahashi, S. Translocation-Related Sarcomas. Int. J. Mol. Sci. 2018, 19, 3784. [Google Scholar] [CrossRef]
- Wallander, K.; Öfverholm, I.; Boye, K.; Tsagkozis, P.; Papakonstantinou, A.; Lin, Y.; Haglund de Flon, F. Sarcoma Care in the Era of Precision Medicine. J. Intern. Med. 2023, 294, 690–707. [Google Scholar] [CrossRef]
- Garcia del Muro, X.; de Alava, E.; Artigas, V.; Bague, S.; Braña, A.; Cubedo, R.; Cruz, J.; Mulet-Margalef, N.; Narvaez, J.A.; Martinez Tirado, O.; et al. Clinical Practice Guidelines for the Diagnosis and Treatment of Patients with Soft Tissue Sarcoma by the Spanish Group for Research in Sarcomas (GEIS). Cancer Chemother. Pharmacol. 2016, 77, 133–146. [Google Scholar] [CrossRef]
- Laufer, V.A.; Glover, T.W.; Wilson, T.E. Applications of Advanced Technologies for Detecting Genomic Structural Variation. Mutat. Res. Rev. Mutat. Res. 2023, 792, 108475. [Google Scholar] [CrossRef] [PubMed]
- Benini, S.; Gamberi, G.; Cocchi, S.; Magagnoli, G.; Fortunato, A.R.; Sciulli, E.; Righi, A.; Gambarotti, M. The Efficacy of Molecular Analysis in the Diagnosis of Bone and Soft Tissue Sarcoma: A 15-Year Mono-Institutional Study. Int. J. Mol. Sci. 2022, 24, 632. [Google Scholar] [CrossRef] [PubMed]
- Lopes-Brás, R.; Lopez-Presa, D.; Esperança-Martins, M.; Melo-Alvim, C.; Gallego, L.; Costa, L.; Fernandes, I. Genomic Profiling of Sarcomas: A Promising Weapon in the Therapeutic Arsenal. Int. J. Mol. Sci. 2022, 23, 14227. [Google Scholar] [CrossRef] [PubMed]
- Dremsek, P.; Schwarz, T.; Weil, B.; Malashka, A.; Laccone, F.; Neesen, J. Optical Genome Mapping in Routine Human Genetic Diagnostics—Its Advantages and Limitations. Genes 2021, 12, 1958. [Google Scholar] [CrossRef]
- How Optical Genome Mapping (OGM) Works. Available online: https://bionano.com/how-ogm-works/ (accessed on 1 February 2025).
- Levy, B.; Kanagal-Shamanna, R.; Sahajpal, N.S.; Neveling, K.; Rack, K.; Dewaele, B.; Olde Weghuis, D.; Stevens-Kroef, M.; Puiggros, A.; Mallo, M.; et al. A Framework for the Clinical Implementation of Optical Genome Mapping in Hematologic Malignancies. Am. J. Hematol. 2024, 99, 642–661. [Google Scholar] [CrossRef]
- Giguère, A.; Raymond-Bouchard, I.; Collin, V.; Claveau, J.-S.; Hébert, J.; LeBlanc, R. Optical Genome Mapping Reveals the Complex Genetic Landscape of Myeloma. Cancers 2023, 15, 4687. [Google Scholar] [CrossRef]
- Levy, B.; Baughn, L.B.; Akkari, Y.; Chartrand, S.; LaBarge, B.; Claxton, D.; Lennon, P.A.; Cujar, C.; Kolhe, R.; Kroeger, K.; et al. Optical Genome Mapping in Acute Myeloid Leukemia: A Multicenter Evaluation. Blood Adv. 2022, 7, 1297–1307. [Google Scholar] [CrossRef]
- Díaz-González, Á.; Mora, E.; Avetisyan, G.; Furió, S.; De la Puerta, R.; Gil, J.V.; Liquori, A.; Villamón, E.; García-Hernández, C.; Santiago, M.; et al. Cytogenetic Assessment and Risk Stratification in Myelofibrosis with Optical Genome Mapping. Cancers 2023, 15, 3039. [Google Scholar] [CrossRef]
- Goldrich, D.Y.; LaBarge, B.; Chartrand, S.; Zhang, L.; Sadowski, H.B.; Zhang, Y.; Pham, K.; Way, H.; Lai, C.-Y.J.; Pang, A.W.C.; et al. Identification of Somatic Structural Variants in Solid Tumors by Optical Genome Mapping. J. Pers. Med. 2021, 11, 142. [Google Scholar] [CrossRef]
- Shim, Y.; Lee, J.; Seo, J.; Park, C.K.; Shin, S.; Han, H.; Lee, S.-T.; Choi, J.R.; Chung, B.H.; Choi, Y.D. Optical Genome Mapping Identifies Clinically Relevant Genomic Rearrangements in Prostate Cancer Biopsy Sample. Cancer Cell Int. 2022, 22, 306. [Google Scholar] [CrossRef]
- Baelen, J.; Dewaele, B.; Debiec-Rychter, M.; Sciot, R.; Schöffski, P.; Hompes, D.; Sinnaeve, F.; Wafa, H.; Vanden Bempt, I. Optical Genome Mapping for Comprehensive Cytogenetic Analysis of Soft-Tissue and Bone Tumors for Diagnostic Purposes. J. Mol. Diagn. 2024, 26, 374–386. [Google Scholar] [CrossRef]
- Tariq, M.U.; Din, N.U.; Abdul-Ghafar, J.; Park, Y.-K. The Many Faces of Solitary Fibrous Tumor; Diversity of Histological Features, Differential Diagnosis and Role of Molecular Studies and Surrogate Markers in Avoiding Misdiagnosis and Predicting the Behavior. Diagn. Pathol. 2021, 16, 32. [Google Scholar] [CrossRef]
- Georgiesh, T.; Namløs, H.M.; Sharma, N.; Lorenz, S.; Myklebost, O.; Bjerkehagen, B.; Meza-Zepeda, L.A.; Boye, K. Clinical and Molecular Implications of NAB2-STAT6 Fusion Variants in Solitary Fibrous Tumour. Pathology 2021, 53, 713–719. [Google Scholar] [CrossRef]
- Hastings, R.J.; Moore, S.; Chia, N. ISCN 2024—An International System for Human Cytogenomic Nomenclature. Cytogenet. Genome. Res. 2024, 164, 1–224. [Google Scholar] [CrossRef]
- Balko, J.; Stanek, M.; Krskova, L.; Zamecnik, J. Unusual Fusion Gene Rearrangements in Patients with Nodular Fasciitis: A Study of Rare and Novel USP6 Fusion Partners with a Review of the Literature. J. Clin. Pathol. 2024, 77, 411–416. [Google Scholar] [CrossRef]
- Yoshida, A.; Satomi, K.; Kobayashi, E.; Ryo, E.; Matsushita, Y.; Narita, Y.; Ichimura, K.; Kawai, A.; Mori, T. Soft-Tissue Sarcoma with Fusion: A Case Report and Comparison with Astroblastoma. Genes Chromosomes Cancer 2022, 61, 427–431. [Google Scholar] [CrossRef]
- Sato, C.; Sugiyama, M.; Mori, T.; Nishino, S.; Tao, K.; Ogawa, C.; Yoshida, A. Pediatric Mesenchymal Tumor with MN1::TAF3 Fusion. Genes Chromosomes Cancer 2024, 63, e70009. [Google Scholar] [CrossRef]
- Lucas, D.R. Myxoinflammatory Fibroblastic Sarcoma: Review and Update. Arch. Pathol. Lab. Med. 2017, 141, 1503–1507. [Google Scholar] [CrossRef]
- Kager, M.; Kager, R.; Fałek, P.; Fałek, A.; Szczypiór, G.; Niemunis-Sawicka, J.; Rzepecka-Wejs, L.; Starosławska, E.; Burdan, F. Tenosynovial Giant Cell Tumor. Folia Med. Cracov 2022, 62, 93–107. [Google Scholar] [CrossRef]
- Sciot, R. MDM2 Amplified Sarcomas: A Literature Review. Diagnostics 2021, 11, 496. [Google Scholar] [CrossRef]
- Bill, K.L.J.; Seligson, N.D.; Hays, J.L.; Awasthi, A.; Demoret, B.; Stets, C.W.; Duggan, M.C.; Bupathi, M.; Brock, G.N.; Millis, S.Z.; et al. Degree of MDM2 Amplification Affects Clinical Outcomes in Dedifferentiated Liposarcoma. Oncologist 2019, 24, 989–996. [Google Scholar] [CrossRef]
- Yamashita, K.; Kohashi, K.; Yamada, Y.; Akatsuka, S.; Ikuta, K.; Nishida, Y.; Toyokuni, S.; Oda, Y. Prognostic Significance of the MDM2/HMGA2 Ratio and Histological Tumor Grade in Dedifferentiated Liposarcoma. Genes Chromosomes Cancer 2021, 60, 26–37. [Google Scholar] [CrossRef]
- Somaiah, N.; Tap, W. MDM2-P53 in Liposarcoma: The Need for Targeted Therapies with Novel Mechanisms of Action. Cancer Treat. Rev. 2024, 122, 102668. [Google Scholar] [CrossRef]
- Hang, J.-F.; Chen, P.C.-H. Parosteal Osteosarcoma. Arch. Pathol. Lab. Med. 2014, 138, 694–699. [Google Scholar] [CrossRef]
- Saâda-Bouzid, E.; Burel-Vandenbos, F.; Ranchère-Vince, D.; Birtwisle-Peyrottes, I.; Chetaille, B.; Bouvier, C.; Château, M.-C.; Peoc’h, M.; Battistella, M.; Bazin, A.; et al. Prognostic Value of HMGA2, CDK4, and JUN Amplification in Well-Differentiated and Dedifferentiated Liposarcomas. Mod. Pathol. 2015, 28, 1404–1414. [Google Scholar] [CrossRef]
- Nagao-Kitamoto, H.; Nagata, M.; Nagano, S.; Kitamoto, S.; Ishidou, Y.; Yamamoto, T.; Nakamura, S.; Tsuru, A.; Abematsu, M.; Fujimoto, Y.; et al. GLI2 Is a Novel Therapeutic Target for Metastasis of Osteosarcoma. Int. J. Cancer 2015, 136, 1276–1284. [Google Scholar] [CrossRef]
- Bui, N.Q.; Przybyl, J.; Trabucco, S.E.; Frampton, G.; Hastie, T.; van de Rijn, M.; Ganjoo, K.N. A Clinico-Genomic Analysis of Soft Tissue Sarcoma Patients Reveals CDKN2A Deletion as a Biomarker for Poor Prognosis. Clin. Sarcoma Res. 2019, 9, 12. [Google Scholar] [CrossRef]
- Gounder, M.M.; Agaram, N.P.; Trabucco, S.E.; Robinson, V.; Ferraro, R.A.; Millis, S.Z.; Krishnan, A.; Lee, J.; Attia, S.; Abida, W.; et al. Clinical Genomic Profiling in the Management of Patients with Soft Tissue and Bone Sarcoma. Nat. Commun. 2022, 13, 3406. [Google Scholar] [CrossRef]
- Takeuchi, Y.; Yoshida, K.; Halik, A.; Kunitz, A.; Suzuki, H.; Kakiuchi, N.; Shiozawa, Y.; Yokoyama, A.; Inoue, Y.; Hirano, T.; et al. The Landscape of Genetic Aberrations in Myxofibrosarcoma. Int. J. Cancer 2022, 151, 565–577. [Google Scholar] [CrossRef]
- Tirode, F.; Surdez, D.; Ma, X.; Parker, M.; Le Deley, M.C.; Bahrami, A.; Zhang, Z.; Lapouble, E.; Grossetête-Lalami, S.; Rusch, M.; et al. Genomic Landscape of Ewing Sarcoma Defines an Aggressive Subtype with Co-Association of STAG2 and TP53 Mutations. Cancer Discov. 2014, 4, 1342–1353. [Google Scholar] [CrossRef]
- Heitzer, E.; Sunitsch, S.; Gilg, M.M.; Lohberger, B.; Rinner, B.; Kashofer, K.; Stündl, N.; Ulz, P.; Szkandera, J.; Leithner, A.; et al. Expanded Molecular Profiling of Myxofibrosarcoma Reveals Potentially Actionable Targets. Mod. Pathol. 2017, 30, 1698–1709. [Google Scholar] [CrossRef]
- Thoenen, E.; Curl, A.; Iwakuma, T. TP53 in Bone and Soft Tissue Sarcomas. Pharmacol. Ther. 2019, 202, 149–164. [Google Scholar] [CrossRef]
- Abeshouse, A.; Adebamowo, C.; Adebamowo, S.N.; Akbani, R.; Akeredolu, T.; Ally, A.; Anderson, M.L.; Anur, P.; Appelbaum, E.L.; Armenia, J.; et al. Comprehensive and Integrated Genomic Characterization of Adult Soft Tissue Sarcomas. Cell 2017, 171, 950–965.e28. [Google Scholar] [CrossRef]
- Anderson, N.D.; de Borja, R.; Young, M.D.; Fuligni, F.; Rosic, A.; Roberts, N.D.; Hajjar, S.; Layeghifard, M.; Novokmet, A.; Kowalski, P.E.; et al. Rearrangement Bursts Generate Canonical Gene Fusions in Bone and Soft Tissue Tumors. Science 2018, 361, eaam8419. [Google Scholar] [CrossRef]
- Voronina, N.; Wong, J.K.L.; Hübschmann, D.; Hlevnjak, M.; Uhrig, S.; Heilig, C.E.; Horak, P.; Kreutzfeldt, S.; Mock, A.; Stenzinger, A.; et al. The Landscape of Chromothripsis across Adult Cancer Types. Nat. Commun. 2020, 11, 2320. [Google Scholar] [CrossRef]
- Fontana, M.C.; Marconi, G.; Feenstra, J.D.M.; Fonzi, E.; Papayannidis, C.; Ghelli Luserna di Rorá, A.; Padella, A.; Solli, V.; Franchini, E.; Ottaviani, E.; et al. Chromothripsis in Acute Myeloid Leukemia: Biological Features and Impact on Survival. Leukemia 2018, 32, 1609–1620. [Google Scholar] [CrossRef]
- Rausch, T.; Jones, D.T.W.; Zapatka, M.; Stütz, A.M.; Zichner, T.; Weischenfeldt, J.; Jäger, N.; Remke, M.; Shih, D.; Northcott, P.A.; et al. Genome Sequencing of Pediatric Medulloblastoma Links Catastrophic DNA Rearrangements with TP53 Mutations. Cell 2012, 148, 59–71. [Google Scholar] [CrossRef]
- Espejo Valle-Inclan, J.; De Noon, S.; Trevers, K.; Elrick, H.; Van Belzen, I.A.E.M.; Zumalave, S.; Sauer, C.M.; Tanguy, M.; Butters, T.; Muyas, F.; et al. Ongoing Chromothripsis Underpins Osteosarcoma Genome Complexity and Clonal Evolution. Cell 2025, 188, 352–370.e22. [Google Scholar] [CrossRef]
- Mandahl, N.; Magnusson, L.; Nilsson, J.; Viklund, B.; Arbajian, E.; von Steyern, F.V.; Isaksson, A.; Mertens, F. Scattered Genomic Amplification in Dedifferentiated Liposarcoma. Mol. Cytogenet. 2017, 10, 25. [Google Scholar] [CrossRef]
- Blay, J.-Y.; Kang, Y.-K.; Nishida, T.; von Mehren, M. Gastrointestinal Stromal Tumours. Nat. Rev. Dis. Primers 2021, 7, 22. [Google Scholar] [CrossRef]
- Riedel, R.F.; Agulnik, M. Evolving Strategies for Management of Desmoid Tumor. Cancer 2022, 128, 3027–3040. [Google Scholar] [CrossRef]
- Bionano Prep SP Tissue and Tumor DNA Isolation Protocol. Available online: https://bionano.com/wp-content/uploads/2023/01/30339-Bionano-Prep-SP-Tissue-and-Tumor-DNA-Isolation-Protocol-1.pdf (accessed on 1 February 2025).
- Bionano Prep DLS-G2 Protocol. Available online: https://bionano.com/wp-content/uploads/2024/02/CG-30553-1_Bionano-Prep-DLS-G2-Protocol.pdf (accessed on 1 February 2025).
- Saphyr® System User Guide. Available online: https://bionanogenomics.com/wp-content/uploads/2017/02/30247-Saphyr-System-User-Guide-for-PN-60325.pdf (accessed on 1 February 2025).
- Bionano Solve™ Theory of Operation: Structural Variant Calling. Available online: https://bionanogenomics.com/wp-content/uploads/2018/04/30110-Bionano-Solve-Theory-of-Operation-Structural-Variant-Calling.pdf (accessed on 1 February 2025).
- Holland, A.J.; Cleveland, D.W. Chromoanagenesis and Cancer: Mechanisms and Consequences of Localized, Complex Chromosomal Rearrangements. Nat. Med. 2012, 18, 1630–1638. [Google Scholar] [CrossRef]
- Baca, S.C.; Prandi, D.; Lawrence, M.S.; Mosquera, J.M.; Romanel, A.; Drier, Y.; Park, K.; Kitabayashi, N.; MacDonald, T.Y.; Ghandi, M.; et al. Punctuated Evolution of Prostate Cancer Genomes. Cell 2013, 153, 666–677. [Google Scholar] [CrossRef]
- Shen, M.M. Chromoplexy: A New Category of Complex Rearrangements in the Cancer Genome. Cancer Cell 2013, 23, 567–569. [Google Scholar] [CrossRef]
- Stephens, P.J.; Greenman, C.D.; Fu, B.; Yang, F.; Bignell, G.R.; Mudie, L.J.; Pleasance, E.D.; Lau, K.W.; Beare, D.; Stebbings, L.A.; et al. Massive Genomic Rearrangement Acquired in a Single Catastrophic Event during Cancer Development. Cell 2011, 144, 27–40. [Google Scholar] [CrossRef]
- Korbel, J.O.; Campbell, P.J. Criteria for Inference of Chromothripsis in Cancer Genomes. Cell 2013, 152, 1226–1236. [Google Scholar] [CrossRef]
- Cortés-Ciriano, I.; Lee, J.J.-K.; Xi, R.; Jain, D.; Jung, Y.L.; Yang, L.; Gordenin, D.; Klimczak, L.J.; Zhang, C.-Z.; Pellman, D.S.; et al. Comprehensive Analysis of Chromothripsis in 2,658 Human Cancers Using Whole-Genome Sequencing. Nat. Genet. 2020, 52, 331–341. [Google Scholar] [CrossRef]
- Shorokhova, M.; Nikolsky, N.; Grinchuk, T. Chromothripsis—Explosion in Genetic Science. Cells 2021, 10, 1102. [Google Scholar] [CrossRef]


| Age | (Years) |
|---|---|
| Average age | 59 |
| Age range | 18–93 |
| Sex | n (%) |
| Male | 33 (62.3%) |
| Female | 20 (37.7%) |
| Adipocytic | n (Total: 21) |
|---|---|
| Dedifferentiated Liposarcoma | 7 |
| Myxoid Liposarcoma | 4 |
| Atypical Lipomatous Tumor | 4 |
| Well-Differentiated Liposarcoma | 3 |
| Lipoma | 2 |
| Pleomorphic Liposarcoma | 1 |
| Non-Adipocytic | n (Total: 15) |
| Myxofibrosarcoma | 11 |
| Malignant Tenosynovial Giant Cell Tumor | 1 |
| Superficial Fibroblastic CD34+ Tumor | 1 |
| Solitary Fibrous Tumor | 1 |
| Low-Grade Myofibroblastic Lesion | 1 |
| Bone | n (Total: 6) |
| Malignant Giant Cell Tumor of the Bone | 2 |
| Osteosarcoma NOS * | 1 |
| Infantile Fibrosarcoma | 1 |
| Dedifferentiated Parosteal Osteosarcoma | 1 |
| Chondrosarcoma | 1 |
| Uncertain Differentiation | n (Total: 7) |
| Undifferentiated Pleomorphic Sarcoma | 5 |
| Monophasic Synovial Sarcoma | 1 |
| Atypical Fibromyxoid Ossifying Tumor | 1 |
| Small Round Cell Sarcoma | n (Total: 4) |
| Ewing Sarcoma | 4 |
| Case | Soft Tissue or Bone Sarcoma Diagnosis | Expected Genetic Alteration | Detected by OGM | Total DNA > 150 Kb (Gbp) | Effective Coverage |
|---|---|---|---|---|---|
| 3 | G3 Undifferentiated Pleomorphic Sarcoma | CNV and SV | Yes | 1513.96 | 366.74 |
| 5 | G3 Myxofibrosarcoma | CNV and SV | Yes | 1507.80 | 381.03 |
| 8 | Myxoid Liposarcoma | FUS::DDIT3 | Yes | 640.20 | 107.44 |
| 9 | Dedifferentiated Parosteal Osteosarcoma | MDM2 amplification | Yes | 1500.01 | 379.76 |
| 12 | G3 Undifferentiated Pleomorphic Sarcoma | CNV and SV | Yes | 1502.11 | 351.86 |
| 14 | G1 Myxofibrosarcoma | CNV and SV | Yes | 1518.97 | 294.82 |
| 19 | Dedifferentiated Liposarcoma | MDM2 amplification | Yes | 1188.88 | 154.24 |
| 20 | Low-Grade Myofibroblastic Lesion | CNV and SV * | Yes * | 1511.15 | 202.35 |
| 22 | Well-Differentiated Liposarcoma | MDM2 amplification | Yes | 1502.11 | 391.16 |
| 23 | G3 Myxofibrosarcoma | CNV and SV | Yes | 1516.40 | 366.11 |
| 24 | Atypical Lipomatous Liposarcoma | MDM2 amplification | Yes | 1544.76 | 399.65 |
| 25 | Lipoma | CNV and SV | Yes | 1513.80 | 388.96 |
| 26 | G3 Undifferentiated Pleomorphic Sarcoma | CNV and SV | Yes | 1508.79 | 408.45 |
| 28 | Dedifferentiated Liposarcoma | MDM2 amplification | Yes | 1501.12 | 394.68 |
| 29 | G3 Myxofibrosarcoma | CNV and SV | Yes | 1456.12 | 317.03 |
| 30 | Ewing Sarcoma | Unknown rearrangement * | Yes * | 1545.00 | 417.77 |
| 31 | Superficial CD34+ Fibroblastic Tumor | CNV and SV | Yes | 1371.84 | 260.05 |
| 33 | Malignant Tenosynovial Giant Cell Tumor | COL6A3::CSF1 | No | 1511.78 | 415.80 |
| 34 | Atypical Fibromyxoid Ossifying Tumor | PHF1 rearrangement | Yes | 1514.63 | 377.71 |
| 35 | Dedifferentiated Liposarcoma | MDM2 amplification | Yes | 1514.09 | 339.48 |
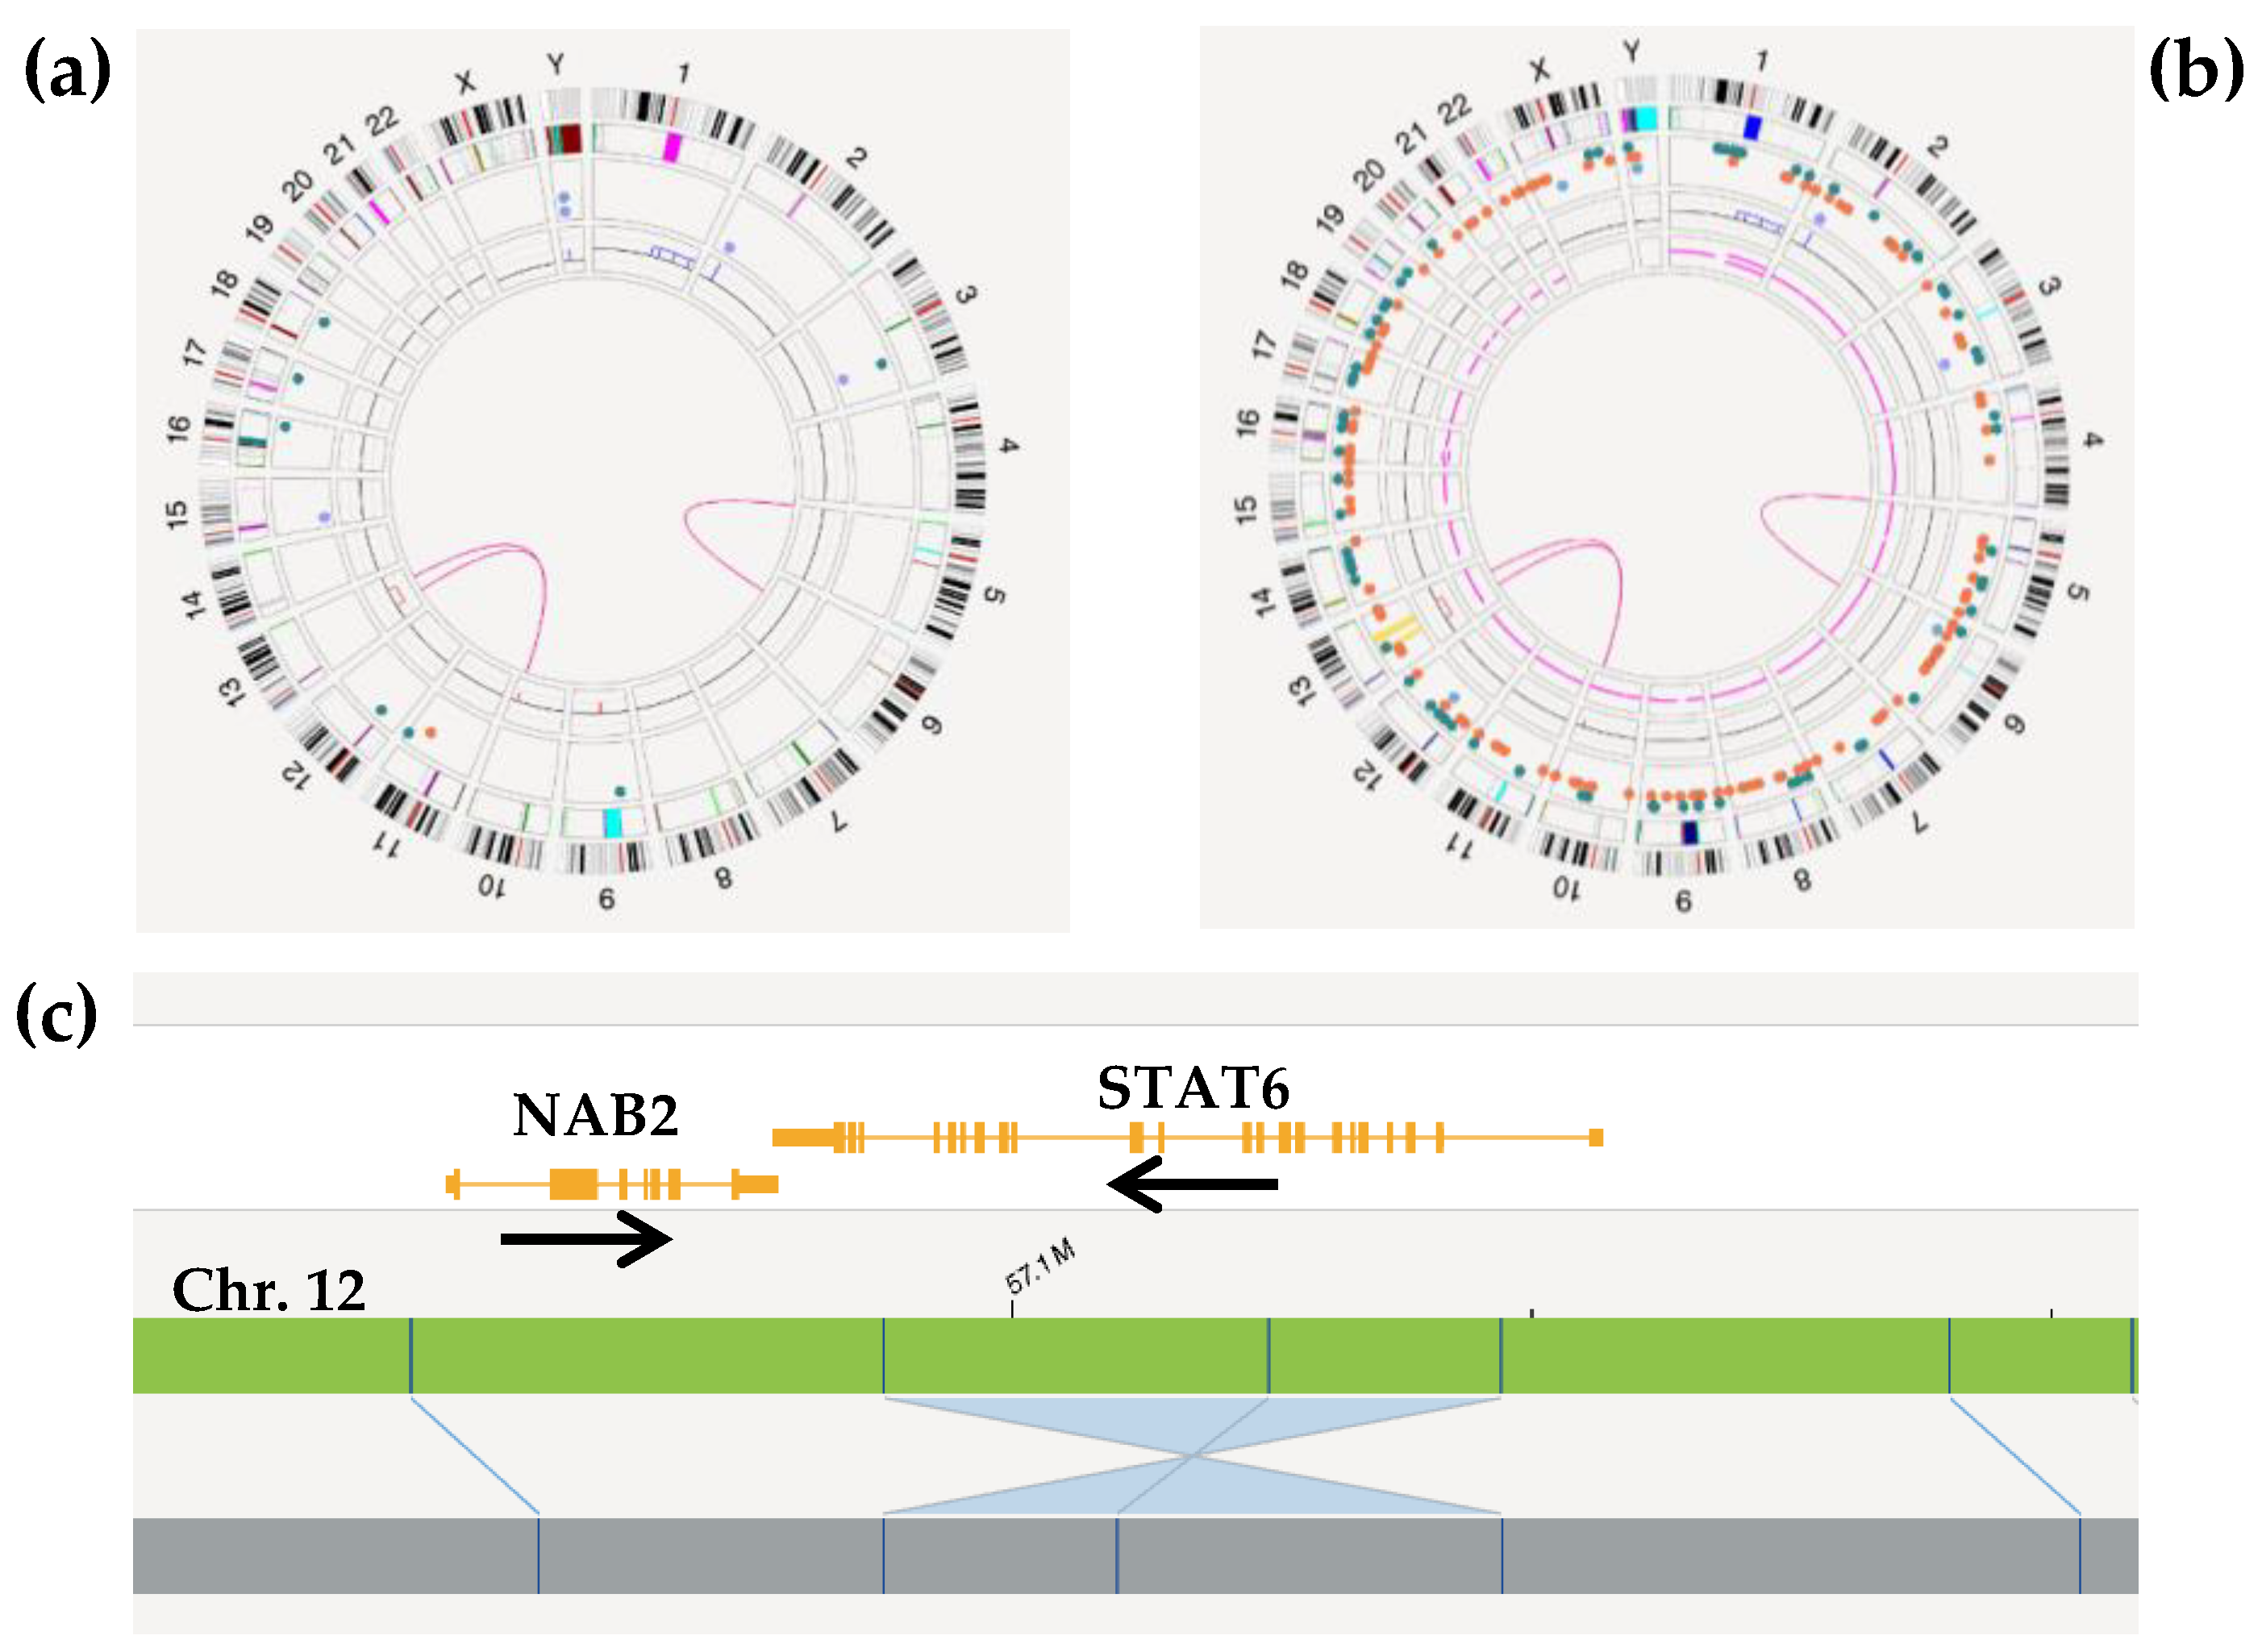
| 36 | Solitary Fibrous Tumor | NAB2::STAT6 ** | Yes ** | 1522.03 | 402.56 |
| 39 | Dedifferentiated Liposarcoma | MDM2 amplification | Yes | 1548.60 | 413.73 |
| 40 | G3 Myxofibrosarcoma | CNV and SV | Yes | 1506.95 | 202.71 |
| 41 | G3 Myxofibrosarcoma | CNV and SV * | Yes * | 1501.94 | 379.13 |
| 42 | Monophasic Synovial Sarcoma | SS18::SSX1 | Yes | 1518.48 | 344.09 |
| 43 | G3 Osteosarcoma NOS | MDM2 amplification | Yes | 1507.71 | 310.69 |
| 44 | Ewing Sarcoma | FUS::ERG | Yes | 724.03 | 122.79 |
| 46 | High Grade Myxoid Liposarcoma | FUS::DDIT3 | Yes | 1453.70 | 415.64 |
| 47 | G1 Myxofibrosarcoma | CNV and SV | Yes | 1501.50 | 365.60 |
| 48 | Ewing Sarcoma | EWSR1::FLI1 | Yes | 1502.46 | 394.20 |
| 49 | Dedifferentiated Liposarcoma | MDM2 amplification | Yes | 1515.32 | 358.94 |
| 50 | Myxoid Liposarcoma | FUS::DDIT3 | Yes | 1516.61 | 364.82 |
| 51 | Dedifferentiated Liposarcoma | MDM2 amplification | Yes | 1501.60 | 185.60 |
| Recommended values | >1500 | >300 | |||
Disclaimer/Publisher’s Note: The statements, opinions and data contained in all publications are solely those of the individual author(s) and contributor(s) and not of MDPI and/or the editor(s). MDPI and/or the editor(s) disclaim responsibility for any injury to people or property resulting from any ideas, methods, instructions or products referred to in the content. |
© 2025 by the authors. Licensee MDPI, Basel, Switzerland. This article is an open access article distributed under the terms and conditions of the Creative Commons Attribution (CC BY) license (https://creativecommons.org/licenses/by/4.0/).
Share and Cite
Berenguer-Rubio, A.; Such, E.; Hernández, N.T.; González-Rojo, P.; Díaz-González, Á.; Avetisyan, G.; Gil-Aparicio, C.; González-López, J.; Pantoja-Borja, N.; Rubio-Martínez, L.A.; et al. Exploring the Potential of Optical Genome Mapping in the Diagnosis and Prognosis of Soft Tissue and Bone Tumors. Int. J. Mol. Sci. 2025, 26, 2820. https://doi.org/10.3390/ijms26062820
Berenguer-Rubio A, Such E, Hernández NT, González-Rojo P, Díaz-González Á, Avetisyan G, Gil-Aparicio C, González-López J, Pantoja-Borja N, Rubio-Martínez LA, et al. Exploring the Potential of Optical Genome Mapping in the Diagnosis and Prognosis of Soft Tissue and Bone Tumors. International Journal of Molecular Sciences. 2025; 26(6):2820. https://doi.org/10.3390/ijms26062820
Chicago/Turabian StyleBerenguer-Rubio, Alejandro, Esperanza Such, Neus Torres Hernández, Paula González-Rojo, Álvaro Díaz-González, Gayane Avetisyan, Carolina Gil-Aparicio, Judith González-López, Nicolay Pantoja-Borja, Luis Alberto Rubio-Martínez, and et al. 2025. "Exploring the Potential of Optical Genome Mapping in the Diagnosis and Prognosis of Soft Tissue and Bone Tumors" International Journal of Molecular Sciences 26, no. 6: 2820. https://doi.org/10.3390/ijms26062820
APA StyleBerenguer-Rubio, A., Such, E., Hernández, N. T., González-Rojo, P., Díaz-González, Á., Avetisyan, G., Gil-Aparicio, C., González-López, J., Pantoja-Borja, N., Rubio-Martínez, L. A., Hernández-Girón, S., Valera-Cuesta, M. S., Ramírez-Fuentes, C., Simonet-Redondo, M., Díaz-Beveridge, R., de la Calva, C., Amaya-Valero, J. V., Ballester-Ibáñez, C., Liquori, A., ... Mayordomo-Aranda, E. (2025). Exploring the Potential of Optical Genome Mapping in the Diagnosis and Prognosis of Soft Tissue and Bone Tumors. International Journal of Molecular Sciences, 26(6), 2820. https://doi.org/10.3390/ijms26062820