
Tn5-Labeled DNA-FISH: An Optimized Probe Preparation Method for Probing Genome Architecture
 , , and
Abstract
1. Introduction
2. Experimental Design
3. Materials
3.1. Reagents and Consumables
- 0.1 M dithiothreitol (DTT) (Thermo Fisher Scientific, Waltham, MA, USA, #707265ML).
- 0.5 M EDTA (Invitrogen, Waltham, MA, USA, #AM9260G).
- 1 M citric acid (pH 6.0) (Macgene, Beijing, China, #MC009).
- 1 M magnesium acetate (Sigma-Aldrich, Burlington, VT, USA, #63052-100ML).
- 1 M Tris-HCl pH 7.0 (Invitrogen, Waltham, MA, USA, #AM9851).
- 1 M Tris-HCl pH 8.0 (Invitrogen, Waltham, MA, USA, #AM9856).
- 1.5 mL DNA LoBind Tubes (Eppendorf, Hamburg, Germany, #30108051).
- 10 mM dATP (Invitrogen, Waltham, MA, USA, #18252015).
- 10% SDS (w/v) (Invitrogen, Waltham, MA, USA, #AM9822).
- 10× TBE Buffer (Invitrogen, Waltham, MA, USA, #AM9863).
- 11.6–12.0 M HCl (MERCK, Darmstadt, Germany, #1.00317.2508).
- 15 cm plate (JET Biofil, Shanghai, China, #CAD010150).
- 20× SSC Buffer (Invitrogen, Waltham, MA, USA, #AM9770).
- 200 μL PCR tubes (Sangon Biotech, Shanghai, China, #F611541-0010).
- 2 mL DNA LoBind tubes (Eppendorf, Hamburg, Germany, #22431048).
- 4% paraformaldehyde (PFA) (BosterBio, Wuhan, China, #AR1068).
- 4–20% Novex TBE Gels (Invitrogen, Waltham, MA, USA, #EC6225BOX).
- 5 M NaCl (Invitrogen, Waltham, MA, USA, #AM9759).
- 5 M potassium acetate (Sigma-Aldrich, Burlington, VT, USA, #95843-100ML-F).
- 50× Denhardt’s solution (Sangon Biotech, Shanghai, China, #B548209-0050).
- 6-well plate (JET Biofil, Shanghai, China, #TCP010006).
- Buffer EB (Qiagen, Hilden, Germany, #19086).
- Coverslips (Thorlabs, Newton, NJ, USA, #CG15XH).
- Dextran sulfate (Sigma-Aldrich, Burlington, VT, USA, #D8906).
- DNA Clean & Concentrator-5 (Zymo Research, Irvine, CA, USA, #D4013).
- Dulbecco’s Phosphate-Buffered Saline (DPBS) (Gibco, Waltham, MA, USA, #14190250).
- Ethyl alcohol (Sigma-Aldrich, Burlington, VT, USA, #E7023-500ML).
- Fetal bovine serum (ExCell Bio, Shanghai, China, #FSP500).
- Formamide (deionized) (Invitrogen, Waltham, MA, USA, #AM9342).
- Glycerol (Sigma-Aldrich, Burlington, VT, USA, #G2025-100mL).
- Heparin (Sigma-Aldrich, Burlington, VT, USA, #H3149-10KU).
- N, N-dimethylformamide (DMF) (Sigma-Aldrich, Burlington, VT, USA, #227056-100ML).
- N1 Cartridge (High Sensitivity Cartridge) (Bioptic, Beijing, China, #C105105).
- Nuclease-Free Water (not DEPC-treated) (Invitrogen, Waltham, MA, USA, #AM9932).
- Nuclease-Free Water (not DEPC-treated) (Invitrogen, Waltham, MA, USA, #AM9937).
- Oligos (GENEWIZ, Suzhou, China).
- Penicillin/streptomycin (Gibco, Waltham, MA, USA, #15140122).
- Phanta Max Super-Fidelity DNA Polymerase (Vazyme, Nanjing, China, #P505-d1).
- Poly-L-Lysine (Sigma-Aldrich, Burlington, VT, USA, #P4707).
- Proteinase K Solution (Invitrogen, Waltham, MA, USA, #AM2548).
- Qubit dsDNA HS Assay Kit (Invitrogen, Waltham, MA, USA, #Q32851).
- RNase A (10 mg/mL) (Thermo Fisher Scientific, Waltham, MA, USA, #EN0531).
- RNase-free 15 mL tubes (Invitrogen, Waltham, MA, USA, #AM12500).
- RNase-free 50 mL tubes, (Invitrogen, Waltham, MA, USA, #AM12502).
- RPMI 1640 Medium (Gibco, Waltham, MA, USA, #A1049101).
- S3 Cartridge (Kilo Base Cartridge) (Bioptic, Beijing, China, #C106106).
- Safe green (Biosharp, Hefei, China, #BS356A).
- Schneider’s Drosophila Medium (Gibco, Waltham, MA, USA, #21720024).
- TE Buffer pH 8.0 (Invitrogen, Waltham, MA, USA, #AM9849).
- TIANamp Genomic DNA Kit (TIANGEN, Beijing, China, #DP304).
- Tn5 transposase (BGI, Shenzhen, China, #LS-EZ-E-00009O).
- Triton X-100 (Acros Organics, Geel, Belgium, #327371000-100mL).
- Tween 20 (Sigma-Aldrich, Burlington, VT, USA, #P1379-100ML).
- Ultra Low Range DNA Ladder (Invitrogen, Waltham, MA, USA, #10597012).
3.2. Equipment
- C1000 Touch Thermal Cycler (Bio-Rad, Hercules, CA, USA, #1851148).
- Eppendorf 5424R Centrifuge (Eppendorf, Hamburg, Germany, #5404F1621754).
- Eppendorf 5425 Centrifuge (Eppendorf, Hamburg, Germany, #5405000204).
- Eppendorf 5810R Centrifuge (Eppendorf, Hamburg, Germany, #22628180).
- Eppendorf Thermomixer C (Eppendorf, Hamburg, Germany, #5382000023).
- Gel imaging system (Tanon, Shanghai, China, #Tanon 3500R).
- Intelli-mixer RM-2L (ELMI, Riga, Latvia, #RM-2L).
- Magnetic stirrer (CRYSTAL, Shanghai, China, #MS2-P1H).
- Nikon Eclipse TS2 Microscope (Nikon, Tokyo, Japan, #Eclipse TS2).
- Qsep100 (Bioptic, Beijing, China).
- Qubit 4.0 Fluorometer (Invitrogen, Waltham, MA, USA, #Q33226).
- Refrigerator (Haier, Qingdao, China, #DW-25L262).
- Thermo Scientific Heratherm IMH180 Advanced Microbiological Incubator (Thermo Fisher Scientific, Waltham, MA, USA, #IMH180).
- Thermo Scientific IMP180 Heratherm Refrigerated Incubators (Thermo Fisher Scientific, Waltham, MA, USA, #IMP180).
- Thermo Scientific Heracell VIOS 160i CO2 Incubator (Thermo Fisher Scientific, Waltham, MA, USA, #51033549).
- Ultra-Low Temperature Freezers (Thermo Fisher Scientific, Waltham, MA, USA, #995).
3.3. Oligo Sequences
3.4. Solutions and Buffers
- 1× TNE buffer: Add 9.798 mL of Nuclease-Free Water (Invitrogen, Waltham, MA, USA) to a 15 mL tube first and then sequentially add 100 µL of 1 M Tris-HCl pH 8.0 (Invitrogen, Waltham, MA, USA), 100 µL of 5 M NaCl (Invitrogen, Waltham, MA, USA), and 2 µL of 0.5 M EDTA (Invitrogen, Waltham, MA, USA); mix the solution well. The buffer can be stored at room temperature for up to 6 months.
- 20% Triton X-100: Add 40 mL of Nuclease-Free Water (Invitrogen, Waltham, MA, USA) to a 50 mL tube first and then slowly add 10 mL of Triton X-100 (Acros Organics, Geel, Belgium); mix the solution well by rotation overnight. The buffer can be stored at room temperature for up to 6 months. CRITICAL: Triton X-100 is highly viscous; aspirate and dispense it slowly using pipette tips. Pipette up and down several times to ensure all Triton X-100 adhering to the tip walls is recovered. Protect the buffer from light.
- Coupling buffer: Add 2.174 mL of Nuclease-Free Water (Invitrogen, Waltham, MA, USA) to a 15 mL tube first and then sequentially add 125 µL of 1 M Tris-HCl pH 7.0 (Invitrogen, Waltham, MA, USA), 125 µL of 1 M Tris-HCl pH 8.0 (Invitrogen, Waltham, MA, USA), 1 µL of 0.5 M EDTA (Invitrogen, Waltham, MA, USA), 50 µL of 0.1 M DTT (Thermo Fisher Scientific, Waltham, MA, USA), 25 µL of 20% Triton X-100, and 2.5 mL of glycerol (Sigma-Aldrich, Burlington, VT, USA); mix the solution well. The buffer can be stored at −20 °C for up to 1 year.
- 4× THS TD buffer: Add 676 µL of Nuclease-Free Water (Invitrogen, Waltham, MA, USA) to a 15 mL tube first and then sequentially add 660 µL of 1 M Tris-HCl pH 8.0 (Invitrogen, Waltham, MA, USA), 264 µL of 5 M potassium acetate (Sigma-Aldrich, Burlington, VT, USA), 200 µL of 1 M magnesium acetate (Sigma-Aldrich, Burlington, VT, USA), and 3.2 mL of DMF (Sigma-Aldrich, Burlington, VT, USA); mix the solution well. The buffer can be stored at −20 °C for up to 1 year. CRITICAL: manipulate DMF in a chemical hood.
- ChIP Elution buffer: Add 8.3 mL of Nuclease-Free Water (Invitrogen, Waltham, MA, USA) to a 15 mL tube first and then sequentially add 250 µL of 1 M Tris-HCl pH 7.0 (Invitrogen, Waltham, MA, USA), 250 µL of 1 M Tris-HCl pH 8.0 (Invitrogen, Waltham, MA, USA), 200 µL of 0.5 M EDTA (Invitrogen, Waltham, MA, USA), and 1 mL of 10% SDS (w/v) (Invitrogen, Waltham, MA, USA); mix the solution well. The buffer can be stored at room temperature for up to 6 months.
- 0.5% Triton X-100/DPBS: Add 1.95 mL of DPBS (Gibco, Waltham, MA, USA) to a 2 mL tube first and then add 50 µL of 20% Triton X-100; mix the solution well. The buffer can be stored at room temperature for up to one week.
- 100 µg/mL RNase A/DPBS: Add 1.98 mL of DPBS (Gibco, Waltham, MA, USA) to a 2 mL tube first and then add 20 µL of RNase A (10 mg/mL) (Thermo Fisher Scientific, Waltham, MA, USA); mix the solution well. CRITICAL: prepare the buffer freshly.
- 20% glycerol/DPBS: Add 1.6 mL of DPBS (Gibco, Waltham, MA, USA) to a 2 mL tube first and then add 400 µL of glycerol (Sigma-Aldrich, Burlington, VT, USA); mix the solution well. The buffer can be stored at room temperature for up to 6 months. CRITICAL: Glycerol is highly viscous; aspirate and dispense it slowly using pipette tips. Pipette up and down several times to ensure all glycerol adhering to the tip walls is recovered.
- 1 M HCl: Add 1.983 mL of Nuclease-Free Water (Invitrogen, Waltham, MA, USA) to a 2 mL tube first and then slowly add 17 µL of 11.6–12.0 M HCl (MERCK, Darmstadt, Germany); mix the solution well. CRITICAL: prepare the buffer freshly and carefully and manipulate in a chemical hood.
- 2× SSC: Add 45 mL of Nuclease-Free Water (Invitrogen, Waltham, MA, USA) to a 50 mL tube first and then add 5 mL of 20× SSC (Invitrogen, Waltham, MA, USA); mix the solution well. The buffer can be stored at room temperature for up to one week.
- 2× SSC/50% formamide: Add 2 mL of Nuclease-Free Water (Invitrogen, Waltham, MA, USA) to a 15 mL tube first and then add 500 µL of 20× SSC (Invitrogen, Waltham, MA, USA); mix the solution well. The stock buffer can be stored at room temperature. Add 2.5 mL of formamide (Invitrogen, Waltham, MA, USA) before use, mix the solution well. CRITICAL: Formamide is stored at 4 °C; pre-warm it to room temperature before taking. Add formamide before use. Manipulate formamide in a chemical hood.
- 10% Tween 20: Add 90 µL of Nuclease-Free Water (Invitrogen, Waltham, MA, USA) to a 1.5 mL tube first and then add 10 µL of Tween 20 (Sigma-Aldrich, Burlington, VT, USA); mix the solution well. The buffer can be stored at room temperature for up to 6 months. CRITICAL: Tween 20 is highly viscous; aspirate and dispense it slowly using pipette tips. Pipette up and down several times to ensure all Tween 20 adhering to the tip walls is recovered.
- Hybridization buffer: Add 5 µL of Nuclease-Free Water (Invitrogen, Waltham, MA, USA) to a 1.5 mL tube first and then sequentially add 125 µL of 20× SSC (Invitrogen, Waltham, MA, USA), 4.5 µL of 1 M citric acid (pH 6.0) (Macgene, Beijing, China), 250 µL of formamide (Invitrogen, Waltham, MA, USA), 5 µL of 10% Tween 20 (Sigma-Aldrich, Burlington, VT, USA), 0.5 µL of 50 mg/mL heparin (Sigma-Aldrich, Burlington, VT, USA), 10 µL of 50× Denhardt’s solution (Sangon Biotech, Shanghai, China), and 100 µL of 50% dextran sulfate (Sigma-Aldrich, Burlington, VT, USA); mix the solution well. CRITICAL: Prepare the buffer freshly. Formamide is stored at 4 °C; pre-warm it to room temperature before taking. Manipulate formamide in a chemical hood.
- 0.1× SSC: Add 5.97 mL of Nuclease-Free Water (Invitrogen, Waltham, MA, USA) to a 15 mL tube first and then add 30 µL of 20× SSC (Invitrogen, Waltham, MA, USA); mix the solution well. The buffer can be stored at room temperature for up to one week.
4. Experimental Procedures
4.1. Cell Culture
4.2. Probe Template Preparation
4.2.1. Genomic DNA Extraction
4.2.2. Genomic Loci Amplification
- Design primers: Use the UCSC Genome Browser RepeatMasker track (https://genome.ucsc.edu/, accessed on 31 January 2024) to select non-repetitive regions as target genomic loci, perform primer design using Primer3 (https://primer3.ut.ee/, accessed on 31 January 2024), and further verify through BLAST analysis (https://blast.ncbi.nlm.nih.gov/Blast.cgi, accessed on 31 January 2024) to ensure that the amplified regions are unique and free from repetitive sequences.
- Set up PCR mix in a PCR tube on ice (vol. 50 μL) and mix well: 25 µL of 2× Phanta Max Buffer, 1 µL of 10 mM dNTP, 2 µL of 10 µM Forward primer, 2 µL of 10 µM Reverse primer, 100 ng of genomic DNA, 1 µL of Phanta Max Super-Fidelity DNA Polymerase, and Nuclease-Free Water up to 50 µL.
- Incubate in a thermal cycler (BioRad, Hercules, CA, USA) using the following program: Heat the lid at 105 °C, 1 cycle of initial denaturation for 3 min at 95 °C, 35 cycles of denaturation, annealing and extension at 95 °C for 15 s, 55 °C (adjust annealing temperature according to primers’ melting temperature) for 15 s, and 72 °C for several minutes (adjust extension time according to product length, the extension time for 1 kb typically ranges from 30 to 60 s) respectively, a final extension for 5 min at 72 °C, and hold at 4 °C.
- Purify PCR product with DNA Clean & Concentrator-5 (Zymo Research, Irvine, CA, USA) and quantify DNA with Qubit (Invitrogen, Waltham, MA, USA) and Qsep100 (Bioptic, Beijing, China) referring to the manual.
4.3. Assembly of Tn5-Labeled Transposome
4.3.1. Adaptor A/B Annealing
- Add 1× TNE buffer to dissolve designed and synthesized oligos (ME, ME_A, and ME_B) to a concentration of 100 μM. Vortex the oligos for 10 s and then leave the solution for 12 h at 4 °C to ensure complete dissolve.
- 2.
- Prepare 1:1.1 ratios of ME and ME_A/ME_B oligos by mixing 5 μL of ME with 5.5 μL of ME_A or 5 μL of ME with 5.5 μL of ME_B.
- 3.
- Run the reaction on the PCR machine using the following program: Heat the lid at 105 °C, incubate at 95 °C for 2 min; ramp from 95 °C to 75 °C with 0.1 °C/s, incubate at 75 °C for 2 min; ramp from 75 °C to 65 °C with 0.1 °C/s, incubate at 65 °C for 2 min; ramp from 65 °C to 50 °C with 0.1 °C/s, incubate at 50 °C for 2 min; ramp from 50 °C to 37 °C with 0.1 °C/s, incubate at 37 °C for 2 min; ramp from 37 °C to 20 °C with 0.1 °C/s, incubate at 20 °C for 2 min; ramp from 20 °C to 4 °C with 0.1 °C/s, incubate at 4 °C for 2 min; hold at 4 °C.
- 4.
- Dilute ME, ME_A, ME_B and the annealed Adaptor A/B ten times and quantify the concentration with Qubit referring to the manual.
- 5.
- Run 200 ng of each single-stranded oligo as control alongside 200 ng of annealed Adaptor A/B on the same 4–20% (w/v) TBE gel at 120 V for 60 min.
- 6.
- Transfer TBE gel to a box containing 50 mL of 1× TBE buffer and add 10 μL of Safe green to stain the DNA. Incubate the gel at room temperature for 15 min.
- 7.
- Image using imaging system Tanon 6100A under UV (Tanon, Shanghai, China).
- 8.
- Choose the optimal ratio between ME and ME_A/ME_B oligos (i.e., only annealed strand is observed, with no detectable unannealed single oligo in the lane) and mix the rest of the ME and ME_A/ME_B oligo stocks with the optimal ratio and then run the annealing program. Divide the annealed Adaptor A/B into 50 μL of aliquots.
4.3.2. Tn5-Labeled Transposome Assembly
- Tn5 transposase and Adaptor A/B are used to assemble the Tn5-labeled transposome (BGI, Shenzhen, China).
- Take out Tn5 transposase (1 U/µL) from −80 °C and thaw on ice.
- Set up Transposome Assembly Mix in 1.5 mL tube on ice and mix well: 4.8 µL of Adaptor A, 4.8 µL of Adaptor B, 120 µL of Coupling buffer, 16 µL of Tn5 transposase (1 U/µL) and 14.4 µL of Nuclease-Free Water (Invitrogen, Waltham, MA, USA).
- Incubate the mixture for 1 h at room temperature.
4.4. Tn5-Labeled Transposome Fragmentation Testing
- Prepare the reaction in a PCR tube on ice (vol. 50 μL), add Nuclease-Free Water in advance, and then add 50 ng of probes template DNA and 12.5 µL of 4× THS TD buffer, mix 10–20 times by pipetting with setting at 30 μL, briefly spin down, finally add Tn5-labeled transposome, mix 10–20 times by pipetting with setting at 30 μL, spin down briefly, and make sure there are no bubbles.
- Incubate in a thermal cycler using the following program: heat the lid at 70 °C, incubate at 55 °C for 10 min, and hold at 4 °C.
- 3.
- Add 50 μL of ChIP Elution buffer and 1 μL of Proteinase K to fragmented DNA (final concentration of SDS is 0.5%), mix, and incubate on Thermomixer (900 rpm) for 30 min at 65 °C.
- 4.
- Purify DNA with DNA Clean & Concentrator-5 and quantify with Qubit and Qsep100 referring to the manual.
4.5. FISH Probes Preparation
4.6. Tn5-Labeled DNA-FISH Experimental Protocol
4.6.1. Coverslip Preparation
- Take out one 6-well plate and put one coverslip in a well.
- Wash with 1 mL of pure ethanol twice.
- Dry in air at 37 °C for 1 h until completely dry.
- Add l00 μL of Poly-L-Lysine onto coverslip.
- Incubate for more than 20 min at room temperature.
- Remove the Poly-L-Lysine and dry in air at room temperature for 1 h until completely dry.
- Wash the coverslip with 2 mL of DPBS once.
- Dry in air at room temperature for 1 h until completely dry.
4.6.2. Attached Cells to Coverslip
- Dilute fresh cultured S2 cells with 27 °C pre-warmed SDM growth medium to a concentration of 2.5 million cells/mL.
- Add 2 mL of cells (5 million cells) onto the coverslip.
- Incubated at 27 °C for 30 min.
- Then, check the cell density under microscopy and wash with 27 °C pre-warmed DPBS twice.
4.6.3. Cellular Fixation
- Add 2 mL of 4% PFA onto the coverslip.
- Incubate for 10 min at room temperature.
- Then, wash with 2 mL of DPBS three times.
4.6.4. Permeabilization
- Add 2 mL of freshly prepared 0.5% Triton X-100/DPBS onto the coverslip.
- Incubate for 5 min at room temperature.
- Then, wash with 2 mL of DPBS once.
4.6.5. RNase A Treatment
- Add 2 mL of 100 µg/mL RNase A/DPBS onto the coverslip.
- Incubate for 1 h at 37 °C.
- Then, wash with 2 mL of DPBS three times.
4.6.6. 20% Glycerol Treatment
- Add 2 mL of 20% glycerol/DPBS onto the coverslip.
- Incubate for 30 min at room temperature.
4.6.7. Liquid Nitrogen Freeze
- Freeze the coverslip in liquid nitrogen for approximately 30 s.
- Then, thaw the frozen coverslip in air.
- Once the frozen layer disappears, put the coverslip back into glycerol.
- Repeat liquid nitrogen freeze once.
4.6.8. HCl Denaturation
- Remove the solution.
- Add 2 mL of 0.1 M HCl onto the coverslip.
- Incubate for 5 min at room temperature.
- Then, wash with 2 mL of 2× SSC three times.
4.6.9. Preparation for Hybridization
- Rinse the coverslip with 2 mL of 2× SSC/50% formamide once and then remove the solution.
- Add 2 mL of fresh 2× SSC/50% formamide.
- Incubate for 30 min at room temperature.
4.6.10. Hybridization
- Prepare a 15 cm plate, put paper towels in the plate and wet them with 40 mL of 2× SSC, and pre-warm at 42 °C.
- 2.
- Set up one tube of 5 ng of FISH probes in 110 µL of hybridization buffer in a PCR tube (Sangon Biotech, Shanghai, China).
- 3.
- Denature the hybridization buffer with probes for 10 min at 80 °C in a PCR machine.
- 4.
- At the same time, pre-warm a piece of ~7 × 7 cm2 parafilm on the 80 °C magnetic stirrer (CRYSTAL, Shanghai, China).
- 5.
- Quickly add 110 µL of hybridization buffer with probes (pre-denatured at 80 °C) onto the center of the parafilm on the 80 °C magnetic stirrer.
- 6.
- Take out the coverslip and turn it cell-side down onto the hybridization buffer with probes.
- 7.
- Denature the coverslip with probes for 5 min at 80 °C.
- 8.
- Transfer the slide with parafilm onto the wet paper towels in the humidified chamber and incubate at 42 °C for 5 min.
- 9.
- Then, add 20 mL of H2O to the surroundings of paper towels and seal the plate surroundings with parafilm.
- 10.
- Incubate the slide in dark humidified chamber at 42 °C overnight.
- 11.
- Take out the coverslip and then turn it cell-side up onto the original 6-well plate containing 2 mL of 2× SSC/50% formamide.
- 12.
- Wash three times with 2 mL of 2× SSC at 42 °C for 5 min each.
- 13.
- Wash three times with 2 mL of 0.1× SSC at 42 °C for 5 min each.
- 14.
- Wash twice with 2 mL of DPBS at room temperature for 5 min each.
- 15.
- Add 2 mL of DPBS and keep at 4 °C before microscopy observation.
4.6.11. Microscopy and Analysis
5. Results
5.1. Amplification of Target Genomic Regions as Templates for FISH Probes
5.2. Synthesis and Fluorescent Labeling of Oligos for Tn5-Labeled Transposome Assembly
5.3. Preparation of FISH Probes Using Tn5-Labeled Transposome
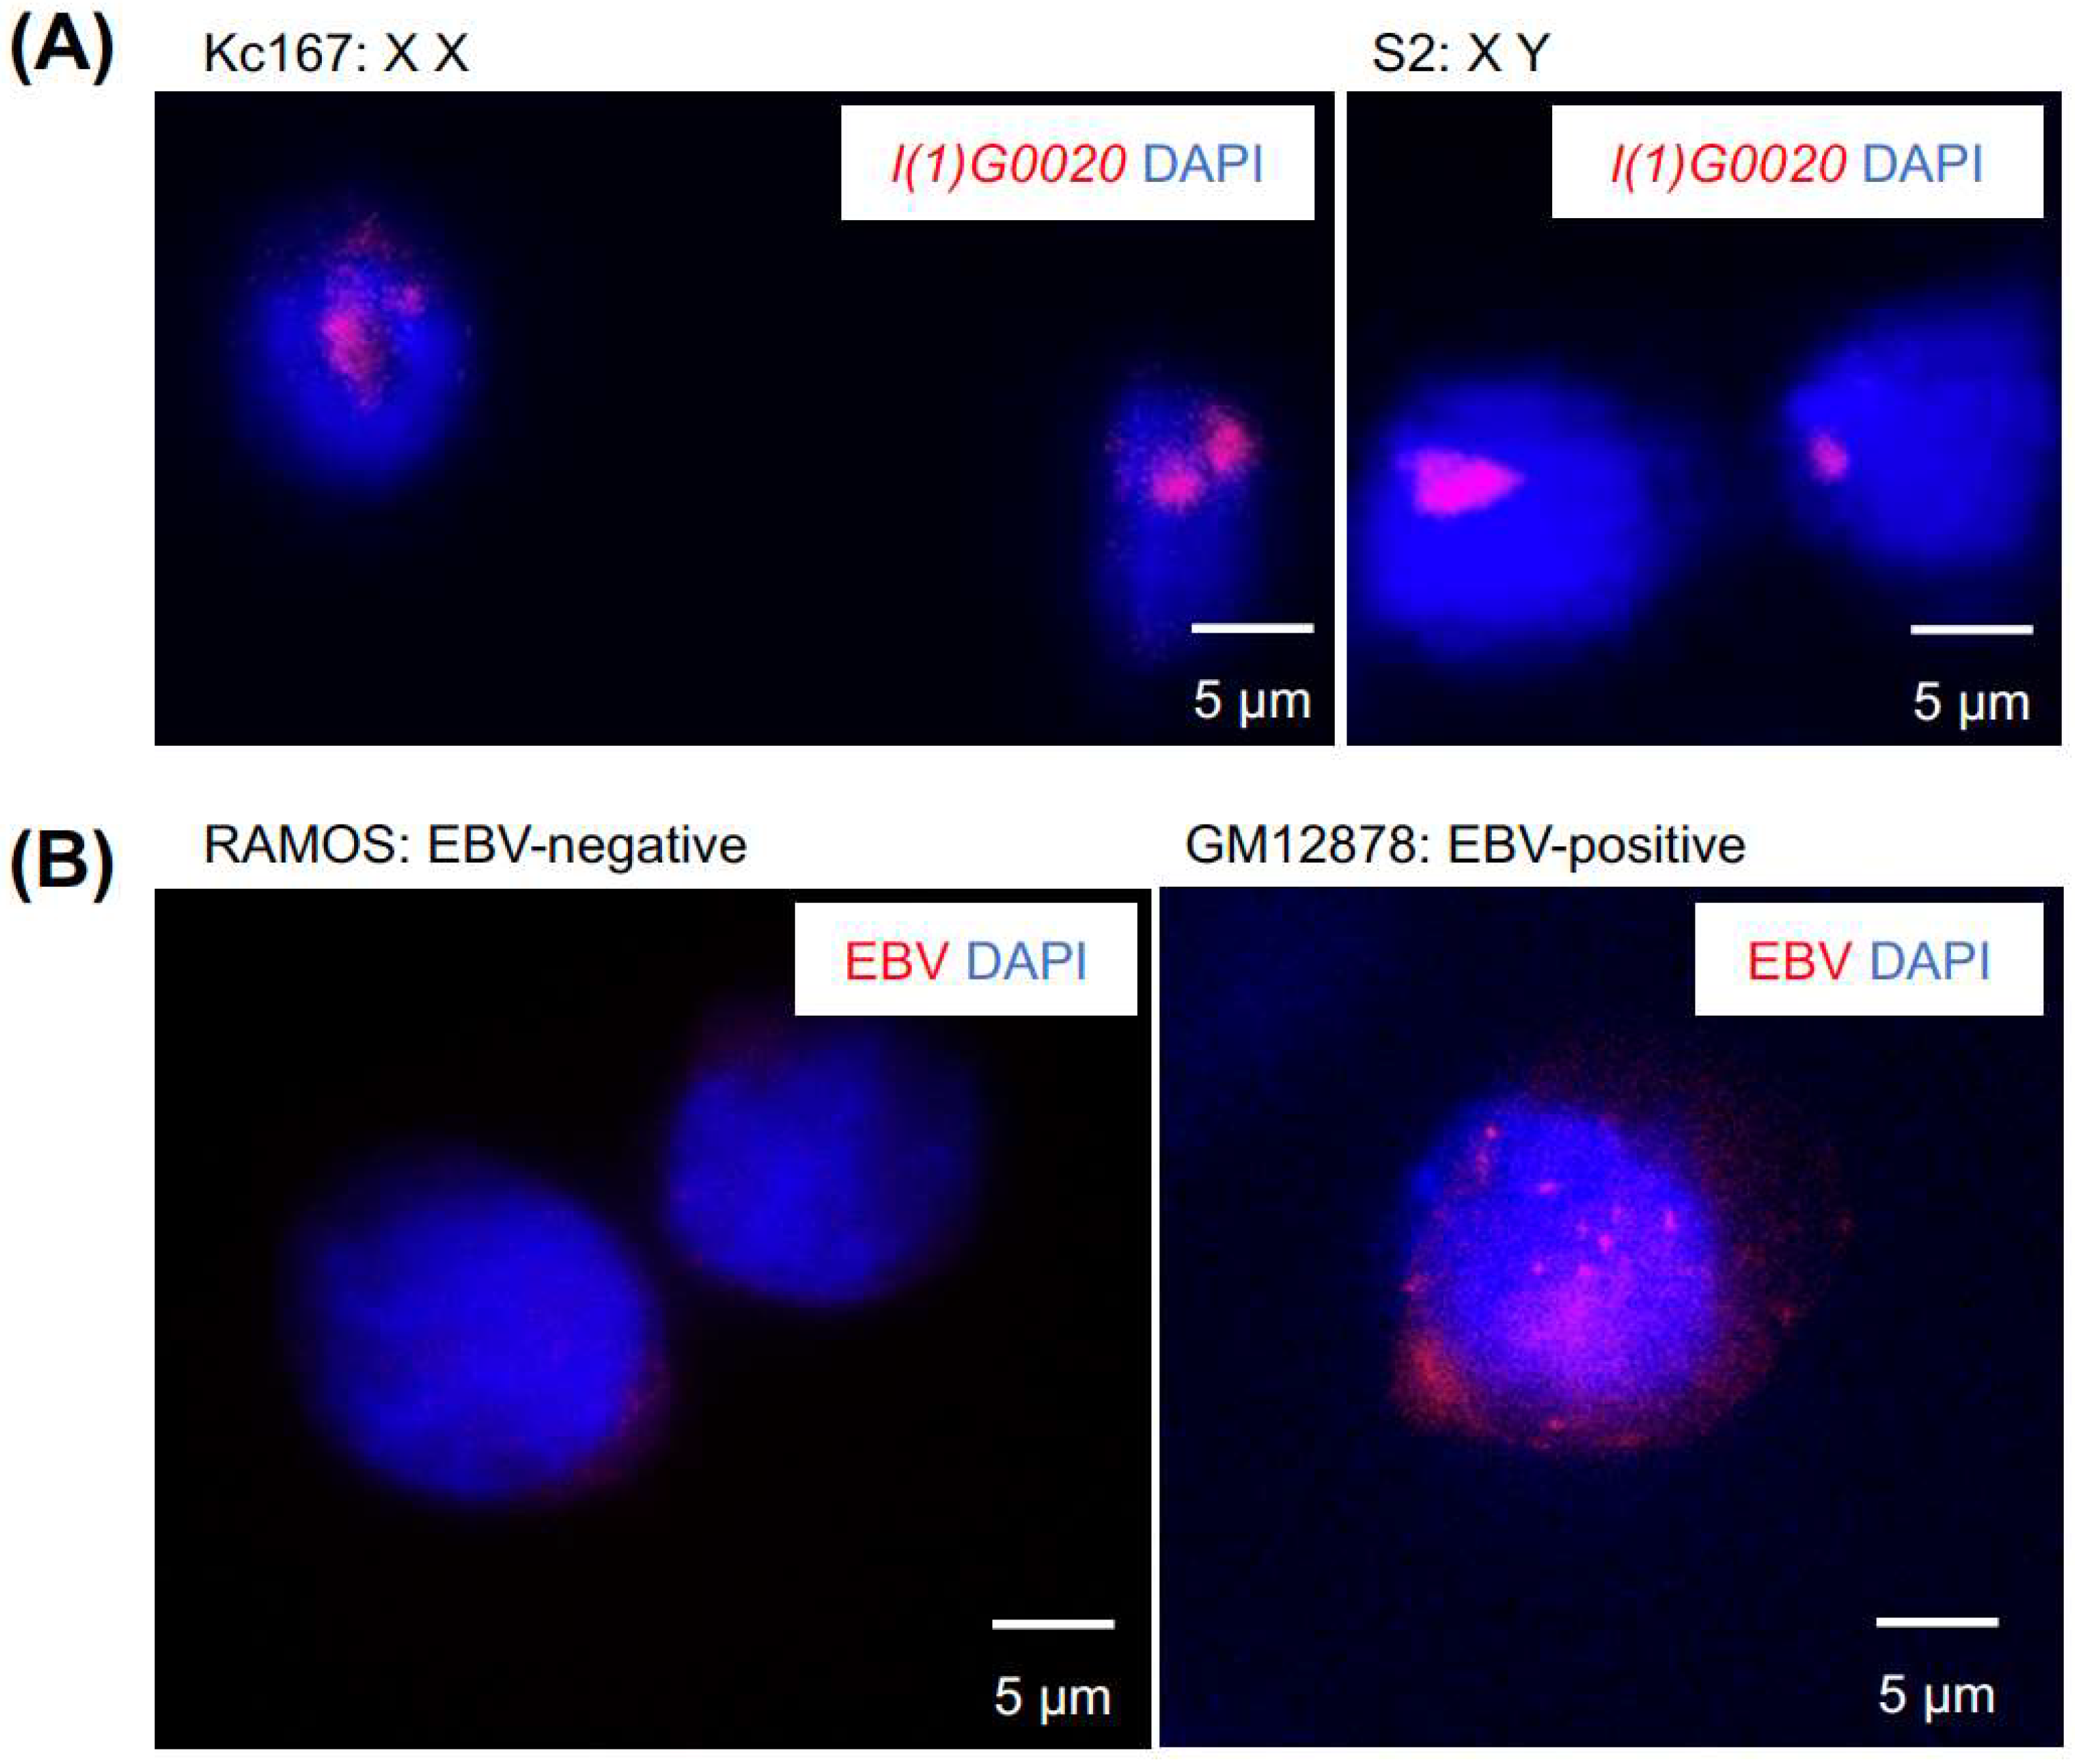
5.4. Image Analysis of Tn5-Labeled DNA-FISH
6. Conclusions
Author Contributions
Funding
Institutional Review Board Statement
Informed Consent Statement
Data Availability Statement
Acknowledgments
Conflicts of Interest
References
- Dekker, J.; Marti-Renom, M.A.; Mirny, L.A. Exploring the three-dimensional organization of genomes: Interpreting chromatin interaction data. Nat. Rev. Genet. 2013, 14, 390–403. [Google Scholar] [CrossRef] [PubMed]
- Schoenfelder, S.; Fraser, P. Long-range enhancer–promoter contacts in gene expression control. Nat. Rev. Genet. 2019, 20, 437–455. [Google Scholar] [CrossRef]
- Dekker, J.; Mirny, L.A. The chromosome folding problem and how cells solve it. Cell 2024, 187, 6424–6450. [Google Scholar] [CrossRef]
- Lieberman-Aiden, E.; van Berkum, N.L.; Williams, L.; Imakaev, M.; Ragoczy, T.; Telling, A.; Amit, I.; Lajoie, B.R.; Sabo, P.J.; Dorschner, M.O.; et al. Comprehensive Mapping of Long-Range Interactions Reveals Folding Principles of the Human Genome. Science 2009, 326, 289–293. [Google Scholar] [CrossRef] [PubMed]
- Fullwood, M.J.; Liu, M.H.; Pan, Y.F.; Liu, J.; Xu, H.; Mohamed, Y.B.; Orlov, Y.L.; Velkov, S.; Ho, A.; Mei, P.H.; et al. An oestrogen-receptor-α-bound human chromatin interactome. Nature 2009, 462, 58–64. [Google Scholar] [CrossRef]
- Kocanova, S.; Goiffon, I.; Bystricky, K. 3D FISH to analyse gene domain-specific chromatin re-modeling in human cancer cell lines. Methods 2018, 142, 3–15. [Google Scholar] [CrossRef] [PubMed]
- Wang, S.; Su, J.-H.; Beliveau, B.J.; Bintu, B.; Moffitt, J.R.; Wu, C.; Zhuang, X. Spatial organization of chromatin domains and compartments in single chromosomes. Science 2016, 353, 598–602. [Google Scholar] [CrossRef]
- Stone, N.E.; Fan, J.-B.; Willour, V.; Pennacchio, L.A.; Warrington, J.A.; Hu, A. Construction of a 750-kb bacterial clone contig and restriction map in the region of human chromosome 21 containing the progressive myoclonus epilepsy gene. Genome Res. 1996, 6, 218–225. [Google Scholar] [CrossRef]
- Finn, E.H.; Misteli, T. A high-throughput DNA FISH protocol to visualize genome regions in human cells. STAR Protoc. 2021, 2, 100741. [Google Scholar] [CrossRef]
- Zuin, J.; Roth, G.; Zhan, Y.; Cramard, J.; Redolfi, J.; Piskadlo, E.; Mach, P.; Kryzhanovska, M.; Tihanyi, G.; Kohler, H.; et al. Nonlinear control of transcription through enhancer–promoter interactions. Nature 2022, 604, 571–577. [Google Scholar] [CrossRef]
- Sexton, T.; Yaffe, E.; Kenigsberg, E.; Bantignies, F.; Leblanc, B.; Hoichman, M.; Parrinello, H.; Tanay, A.; Cavalli, G. Three-Dimensional Folding and Functional Organization Principles of the Drosophila Genome. Cell 2012, 148, 458–472. [Google Scholar] [CrossRef] [PubMed]
- Beliveau, B.J.; Joyce, E.F.; Apostolopoulos, N.; Yilmaz, F.; Fonseka, C.Y.; McCole, R.B.; Chang, Y.; Li, J.B.; Senaratne, T.N.; Williams, B.R.; et al. Versatile design and synthesis platform for visualizing genomes with Oligopaint FISH probes. Proc. Natl. Acad. Sci. USA 2012, 109, 21301–21306. [Google Scholar] [CrossRef]
- Chen, K.H.; Boettiger, A.N.; Moffitt, J.R.; Wang, S.; Zhuang, X. Spatially resolved, highly multiplexed RNA profiling in single cells. Science 2015, 348, aaa6090. [Google Scholar] [CrossRef] [PubMed]
- Masri, R.A.; Karagodin, D.A.; Sharma, A.; Sharakhova, M.V. A Gene-Based Method for Cytogenetic Mapping of Repeat-Rich Mosquito Genomes. Insects 2021, 12, 138. [Google Scholar] [CrossRef] [PubMed]
- Li, N.; Jin, K.; Bai, Y.; Fu, H.; Liu, L.; Liu, B. Tn5 Transposase Applied in Genomics Research. Int. J. Mol. Sci. 2020, 21, 8329. [Google Scholar] [CrossRef]
- Niu, J.; Zhang, X.; Li, G.P.; Yan, P.X.; Yan, Q.; Dai, Q.H.; Jin, D.Y.; Shen, X.H.; Wang, J.C.; Zhang, M.Q.; et al. Tn5-FISH, a novel cytogenetic method to image chromatin interactions with sub-kilobase resolution. J. Genet. Genomics 2020, 47, 727–734. [Google Scholar] [CrossRef]
- Yang, L.; Yan, Y.; Li, J.; Zhou, C.; Jin, J.; Zhang, T.; Wu, H.; Li, X.; Wang, W.; Yuan, L.; et al. Tn5-FISH-based imaging in the era of 3D/spatial genomics. Biophys. Rep. 2023, 9, 15. [Google Scholar] [CrossRef]
- Tian, S.Z.; Yang, Y.; Ning, D.; Fang, K.; Jing, K.; Huang, G.; Xu, Y.; Yin, P.; Huang, H.; Chen, G.; et al. 3D chromatin structures associated with ncRNA roX2 for hyperactivation and coactivation across the entire X chromosome. Sci. Adv. 2024, 10, eado5716. [Google Scholar] [CrossRef]
- Kawabata, K.C.; Ehata, S.; Komuro, A.; Takeuchi, K.; Miyazono, K. TGF-β-induced apoptosis of B-cell lymphoma Ramos cells through reduction of MS4A1/CD20. Oncogene 2013, 32, 2096–2106. [Google Scholar] [CrossRef]
- Kim, K.-D.; Tanizawa, H.; De Leo, A.; Vladimirova, O.; Kossenkov, A.; Lu, F.; Showe, L.C.; Noma, K.; Lieberman, P.M. Epigenetic specifications of host chromosome docking sites for latent Epstein-Barr virus. Nat. Commun. 2020, 11, 877. [Google Scholar] [CrossRef]
- Chen, X.; Shen, Y.; Draper, W.; Buenrostro, J.D.; Litzenburger, U.; Cho, S.W.; Satpathy, A.T.; Carter, A.C.; Ghosh, R.P.; East-Seletsky, A.; et al. ATAC-see reveals the accessible genome by transposase-mediated imaging and sequencing. Nat. Methods 2016, 13, 1013–1020. [Google Scholar] [CrossRef]


| Oligo ID | Sequence (5′-3′) | Purification 1 |
|---|---|---|
| Oligos for adaptor annealing | ||
| ME | /5Phos/CTGTCTCTTATACACATCT | HPLC |
| ME_A | /5Cy5.5/TCGTCGGCAGCGTCAGATGTGTATAAGAGACAG | HPLC |
| ME_B | /5Cy5.5/GTCTCGTGGGCTCGGAGATGTGTATAAGAGACAG | HPLC |
| Primers for Drosophila l(1)G0020 gene amplification | ||
| Forward primer | TTCTCCAGGAATCCCAGATG | DSL |
| Reverse primer | CGTAAATCTGCCCGAGGATA | DSL |
| Primers for EBV genome one fragment amplification | ||
| Forward primer | TGCCTGCCTGTAATTGTTGC | DSL |
| Reverse primer | GGTCCTGAGGTTTTGCAGTG | DSL |
Disclaimer/Publisher’s Note: The statements, opinions and data contained in all publications are solely those of the individual author(s) and contributor(s) and not of MDPI and/or the editor(s). MDPI and/or the editor(s) disclaim responsibility for any injury to people or property resulting from any ideas, methods, instructions or products referred to in the content. |
© 2025 by the authors. Licensee MDPI, Basel, Switzerland. This article is an open access article distributed under the terms and conditions of the Creative Commons Attribution (CC BY) license (https://creativecommons.org/licenses/by/4.0/).
Share and Cite
Yang, Y.; Chen, G.; Gao, T.; Ning, D.; Deng, Y.; Tian, Z.; Zheng, M. Tn5-Labeled DNA-FISH: An Optimized Probe Preparation Method for Probing Genome Architecture. Int. J. Mol. Sci. 2025, 26, 2224. https://doi.org/10.3390/ijms26052224
Yang Y, Chen G, Gao T, Ning D, Deng Y, Tian Z, Zheng M. Tn5-Labeled DNA-FISH: An Optimized Probe Preparation Method for Probing Genome Architecture. International Journal of Molecular Sciences. 2025; 26(5):2224. https://doi.org/10.3390/ijms26052224
Chicago/Turabian StyleYang, Yang, Gengzhan Chen, Tong Gao, Duo Ning, Yuqing Deng, Zhongyuan (Simon) Tian, and Meizhen Zheng. 2025. "Tn5-Labeled DNA-FISH: An Optimized Probe Preparation Method for Probing Genome Architecture" International Journal of Molecular Sciences 26, no. 5: 2224. https://doi.org/10.3390/ijms26052224
APA StyleYang, Y., Chen, G., Gao, T., Ning, D., Deng, Y., Tian, Z., & Zheng, M. (2025). Tn5-Labeled DNA-FISH: An Optimized Probe Preparation Method for Probing Genome Architecture. International Journal of Molecular Sciences, 26(5), 2224. https://doi.org/10.3390/ijms26052224