Article

NapR Regulates the Expression of Phosphoserine Aminotransferase SerC to Modulate Biofilm Formation and Resistance to Serine Stress of Mycobacteria

by
Minhao Guo
,
Xiaocui Ling
,
Linzhao He
,
Yukuo Gou
,
Zhun Li
and
Weihui Li
*
State Key Laboratory for Conservation and Utilization of Subtropical Agro-Bioresources, College of Life Science and Technology, Guangxi University, Nanning 530004, China
*
Author to whom correspondence should be addressed.
Int. J. Mol. Sci. 2025, 26(5), 2181; https://doi.org/10.3390/ijms26052181
Submission received: 18 January 2025 / Revised: 26 February 2025 / Accepted: 26 February 2025 / Published: 28 February 2025
(This article belongs to the Section Molecular Microbiology)

Abstract

Mycobacterium tuberculosis is a formidable pathogen capable of establishing persistent infections within macrophages. To survive and thrive within the host environment, it has evolved intricate regulatory networks, including a diverse array of transcription factors that enable adaptation to various stresses encountered within the host. However, the mechanisms by which transcription factors regulate biofilm formation in M. tuberculosis remain incompletely understood. This study aimed to investigate the role of serC, encoding phosphoserine aminotransferase, and its regulation by NapR, a transcription factor, in mycobacterial physiology. NapR regulates serC through directly binding to its promoter. Notably, the regulatory effect and corresponding phenotypes vary due to distinct binding affinities of NapR for the serC promoter in different mycobacterial species. In Mycobacterium smegmatis, NapRMsm positively regulates biofilm formation, growth on solid media, and the transition from microcolonies to microcolonies by activating serCMsm. In the BCG vaccine, on the contrary, NapRBCG represses serCBCG, thus negatively regulating colony size and alleviating the growth inhibition caused by high concentrations of serine. Furthermore, proteomic analysis suggested NapR serves as a global transcriptional regulator in BCG vaccine strains by simultaneously modulating four metabolic pathways. These findings underscore the complex and strain-specific regulatory mechanisms governing serine metabolism in mycobacteria and provide valuable insights into the interplay between metabolism, gene regulation, and bacterial physiology.

1. Introduction

Pulmonary tuberculosis is a zoonotic infectious disease caused by infection with the Mycobacterium tuberculosis complex (MTB). In 2023, an estimated 400,000 cases of MDR-TB were found [1]. The BCG vaccine, a live attenuated strain of Mycobacterium bovis, is administered to children for the prevention of tuberculosis clinically [2]. M. tuberculosis is capable of infecting macrophages and inhibiting the maturation of phagolysosomes [3], thereby ensuring long-term intracellular survival within macrophages [4]. To survive within this hostile environment, M. tuberculosis encounters various stressors, including but not limited to oxidative stress, reductive stress, acid stress, and nutrient deprivation. To promptly respond to these unfavorable environmental challenges, M. tuberculosis possesses a sophisticated regulatory network, including a diverse array of transcription factors that orchestrate cellular responses to environmental cues [5].
M. tuberculosis is subjected to a variety of external adverse stressors, including but not limited to oxidative stress, reductive stress, acid stress, and nutrient deprivation. To promptly respond to these unfavorable environmental challenges, M. tuberculosis possesses an extensive array of transcription factors within its cells, ensuring a rapid and effective response to external stresses [5]. Transcription factors need to interact with RNA polymerase to exert their transcriptional regulatory activity. RNA polymerase depends on sigma factors to recognize promoters and ensure transcription specificity. Activating transcription factors enhance transcription by altering promoter structure, interacting with sigma factors, or binding the RNA polymerase α-subunit. In contrast, repressive transcription factors inhibit mRNA synthesis by blocking RNA polymerase binding, modifying promoter topology, or antagonizing activators [6]. To date, at least 35 transcription factors and 11 nucleoid-associated proteins have been identified in M. tuberculosis [5,7]. These molecules are extensively involved in the bacterium’s response to external stressors. For example, c-di-GMP regulates the antioxidant capacity of Mycobacterium by activating LtmA and inhibiting HpoR [8]. Whib7 mediates the resistance of Mycobacterium to aminoglycosides, β-lactams, macrolides, and quinolones [9]. However, current research has not yet clarified which transcription factors regulate biofilm formation in Mycobacterium.
Biofilms are typically defined as “a sessile community derived from microorganisms, characterized by cells that irreversibly attach to a substrate or interface, or to one another, become embedded in a self-produced extracellular polymeric matrix, and exhibit altered phenotypes with respect to growth rate and gene transcription”. Under certain environmental stimuli, planktonic (free-floating) bacteria can initiate the transition from a planktonic state to a complex, surface-attached community structure [10]. Biofilms are composed of biofilm cells and a matrix of hydrated extracellular polymeric substances (EPSs), with EPSs accounting for over 90% of the biofilm’s dry weight [11]. Extensive in vitro studies have shown that biofilms contribute to the development of drug resistance in Mycobacterium tuberculosis. Even rifampin-sensitive mutant strains can regain resistance to rifampin when grown within biofilms [12]. In M. tuberculosis infections, biofilm formation has been implicated in the establishment of persistent infections. Studies have demonstrated the presence of cellulose-dominant biofilms in the lung tissues of tuberculosis patients, contributing to the development of drug tolerance [13]. However, the mechanism of regulating biofilm formation in M. tuberculosis remains incompletely understood. Recent studies have highlighted the crucial role of nucleoid-associated proteins in biofilm formation. Lsr2 has been shown to mediate biofilm development induced by high concentrations of c-di-GMP through transcriptional upregulation of hadD [14].
Serine, a non-essential amino acid, plays a pivotal role in various cellular processes, including protein synthesis, one-carbon metabolism, and lipid biosynthesis. Serine de novo synthesis originates from glycolysis, where 3-phosphoglycerate (3-PG) is sequentially oxidized by SerA to form 3-phosphohydroxypyruvate (3-PHP), converted to 3-phosphoserine (3-PS) by SerC with glutamate deamination, and dephosphorylated by SerB to produce L-serine [15]. Accordingly, SerC is necessary for serine metabolism and essential for mycobacterial growth and survival. A study on M. smegmatis demonstrated that serC expression is induced in response to various environmental stresses, including oxidative stress, nitric oxide (NO), membrane-denaturing agents, and antibiotic exposure [16]. Isoniazid, rifampin, and H2O2 induce the upregulation of serC expression in M. smegmatis, while inhibiting serC expression enhances the bactericidal effect of these agents and H2O2 on M. smegmatis [16].
In our previous screening, we identified a M. smegmatis strain exhibiting a smooth colony surface morphology. Subsequent sequencing revealed that the expression of the intracellular serC was suppressed in this strain. Here, we demonstrate that serC, a key enzyme in serine biosynthesis, plays a crucial role in various aspects of mycobacterial physiology, including growth, biofilm formation, and adaptation to environmental stresses. Furthermore, we elucidate the contrasting regulatory roles of a novel transcription factor NapR on serC in M. smegmatis and the BCG vaccine strains, highlighting the complex and strain-specific nature of these regulatory networks.

2. Results

2.1. serCMsm Positively Regulates Biofilm Formation of M. smegmatis

In our preliminary experiment, we developed a whole-genome CRISPR interference (CRISPRi) library in M. smegmatis that produced colonies with a rough surface morphology on 7H10 solid medium (Figure S1A) [17]. Upon treatment with anhydrotetracycline to activate the CRISPRi system, an M. smegmatis strain with a smooth colony surface was screened out (Figure 1A). Subsequent sequencing analysis indicated that the suppression of the serCMsm gene was responsible for this phenotype. Next, the biofilm formation capability at the air–liquid interface was investigated in the serCMsm-repressed strain (serCMsm KD). In the absence of anhydrotetracycline, biofilm formation in the serCMsm KD strain was comparable to that of the wild-type M. smegmatis (Msm/WT) (Figure S1B). However, when anhydrotetracycline was present, the serCMsm KD strain exhibited significantly impaired biofilm formation relative to the Msm/WT strain (Figure 1B).

2.2. NapRMsm Directly Binds to the serCMsm Promoter and Activates serCMsm

To further elucidate the regulatory mechanisms governing serCMsm expression, we utilized the TB Database to search for potential transcription factors of its homologous gene serCMtb in M. tuberculosis. This analysis revealed Rv3050c as a potential transcriptional regulator of serCMtb, which we named NapRMtb. Subsequently, we investigated the potential regulatory role of NapRMsm (encoded by msmeg_1029), the M. smegmatis homolog of NapRMtb, on serCMsm expression.
First, we performed an electrophoretic mobility shift assay (EMSA) to examine the in vitro binding capacity of NapRMsm to the serCMsm promoter (serCMsm p). The results showed that NapRMsm binds directly to serCMsm p (Figure 2A). To further validate the transcriptional regulatory role of NapRMsm on serCMsm expression, we constructed an M. smegmatis mutant lacking napRMsm (napRMsm KO). An RT-qPCR assay revealed a significant downregulation of serCMsm mRNA level in the napRMsm KO strain compared to Msm/WT (Figure 2B). These findings collectively demonstrate that NapRMsm functions as a transcriptional activator of serCMsm by directly binding to its promoter.

2.3. NapRMsm Activates serC to Positively Regulate Biofilm Formation in M. smegmatis

Considering that NapRMsm works as transcriptional activator of serCMsm, and serCMsm plays a crucial role in M. smegmatis biofilm formation, we investigated the impact of NapRMsm on the colony surface morphology and biofilm formation capability at the air–liquid interface in M. smegmatis. Consistent with the serCMsm KD strain, the napRMsm KO strain exhibited a smooth colony surface and impaired biofilm formation compared to the Msm/WT strain (Figure 2C). To further dissect the contribution of NapRMsm-mediated serCMsm activation to these phenotypes, we generated an M. smegmatis strain lacking napRMsm with simultaneous repression of serCMsm expression (napRMsm KO/serCMsm KD). The results indicated that the napRMsm KO/serCMsm KD strain exhibited the most pronounced smooth and smallest colony morphology, as well as the most severe biofilm deficiency, compared to the Msm/WT, serCMsm KD, and napRMsm KO strains (Figure 2D,E). Notably, no significant differences were observed in the control group without anhydrotetracycline induction (Figure S2A,B). Additionally, quantitative biofilm formation assays using crystal violet staining corroborated these findings, with the napRMsm KO/serCMsm KD strain displaying the most significant biofilm reduction, followed by the napRMsm KO and serCMsm KD strains (Figure 2F and Figure S2C).
In summary, serCMsm positively regulates colony radius and biofilm formation in M. smegmatis. The absence of napRMsm in the serCMsm KD strain further exacerbates the reduction in colony radius and biofilm formation. These findings demonstrate that NapRMsm positively regulates colony radius and biofilm formation in M. smegmatis by activating serCMsm.

2.4. NapRMsm Activates serCMsm and Influences the Growth State of M. smegmatis on Solid Surfaces

It was observed that the colony radius of the serCMsm KD and napRMsm KO strains was smaller than that of Msm/WT (Figure 2D). Given that serCMsm is involved in serine biosynthesis and cellular growth, we investigated the impact of serCMsm and napRMsm on M. smegmatis growth. Growth curves of the Msm/WT, napRMsm KO, serCMsm KD, and napRMsm KO/serCMsm KD strains were determined in 7H9 liquid medium containing 0 mM or 5 mM serine under shaking conditions (37 °C, 160 rpm). Surprisingly, only the serCMsm KD and napRMsm KO/serCMsm KD strains showed slight growth inhibition, which was reversed by the addition of serine (Figure S3A). Moreover, no significant growth differences were observed among these strains under static growth conditions in 7H9 liquid medium at 37 °C (Figure S3B). These findings suggest that serCMsm and napRMsm do not significantly affect the growth of M. smegmatis in liquid media, and the observed biofilm formation defects due to serCMsm repression or napRMsm knockout are not attributed to growth inhibition.
To further investigate the impact of serCMsm on growth under solid-phase conditions, we sampled the statically cultured M. smegmatis strains and plated them onto 7H10 solid medium. In contrast to liquid culture, both napRMsm KO and serCMsm KD strains exhibited a significant reduction in colony-forming units (CFUs) compared to Msm/WT, while the napRMsm KO/serCMsm KD strain showed a more pronounced decrease, with approximately one-tenth the CFU count of Msm/WT (Figure 3A). Notably, the addition of serine only partially restored the growth inhibition observed on solid media, indicating that serCMsm may affect M. smegmatis growth on solid media through mechanisms beyond serine biosynthesis.
According to the established biofilm formation model, biofilm maturation can be subdivided into three phases: the microcolony phase, the macrocolony phase, and the mature biofilm phase [18]. Microscopic examination of colonies on 7H10 agar revealed a coexistence of microcolonies and macrocolonies. Importantly, the loss of napRMsm and reduced serCMsm expression resulted in an increased proportion of microcolonies, with the napRMsm KO/serCMsm KD strain exhibiting the highest proportion of microcolonies (Figure 3B).
Overall, serCMsm positively regulates M. smegmatis growth on solid media but not in liquid media, and influences the transition from microcolonies to macrocolonies during biofilm development. Furthermore, the absence of napRMsm in the serCMsm KD background exacerbates the growth inhibition on solid media and further disrupts the transition from microcolonies to macrocolonies. In conclusion, NapRMsm positively regulates the colony count and the progression of biofilm development by activating serCMsm.

2.5. NapRBCG Directly Represses the Expression of serCBCG

Based on sequence alignment, we found that NapRMsm in M. smegmatis shares up to 76.6% homology with NapRBCG in the BCG vaccine strain (Figure S4). Meanwhile, SerCMsm in M. smegmatis shares up to 81.5% homology with SerCBCG in the BCG vaccine strain (Figure S5). As the BCG vaccine is an attenuated strain of M. bovis, we used the BCG vaccine as a representative pathogenic strain to investigate how NapRBCG regulates serCBCG and to explore its effects on the physiological phenotypes of the BCG vaccine.
First, we performed an EMSA to examine the in vitro binding of NapRBCG to the serCBCG promoter (serCBCGp). The results showed that a concentration of 0.5 μM NapRBCG was sufficient to fully saturate 50 ng of serCBCGp, indicating that there is specific binding between NapRBCG and serCBCGp (Figure 4A). To verify the transcriptional regulatory relationship between NapRBCG and serCBCG, we constructed a napRBCG knockout mutant (napRBCG KO) in the BCG vaccine strain. Surprisingly, RT-qPCR analysis using sigABCG as an internal control revealed an upregulation of serCBCG mRNA level in the napRBCG KO strain compared to the wild-type BCG vaccine strain (BCG/WT) (Figure 4B). These findings demonstrate that NapRBCG represses serCBCG at the transcriptional level by directly binding to its promoter, which contrasts with the activating role of NapRMsm on serCMsm expression.

2.6. NapRBCG Influences BCG Vaccine Colony Size by Repressing serCBCG

To investigate the effect of NapRBCG on the physiological phenotype of the BCG vaccine strain, we examined the colony morphology of the napRBCG KO mutant. In contrast to the observations in M. smegmatis, the napRBCG KO strain produced colonies with an increased radius compared with the BCG/WT strain (Figure 4C). Next, we constructed a CRISPRi-based serCBCG knockdown strain (serCBCG KD), as well as a napRBCG KO/serCBCG KD double mutant. Upon induction with anhydrotetracycline, the serCBCG KD strain exhibited smaller and smoother colony morphology compared to BCG/WT (Figure 4D). However, the napRBCG KO/serCBCG KD strain reversed this change, exhibiting a larger colony size than the serCBCG KD strain, but still smaller than the napRBCG KO strain (Figure 4E). No such phenotype was observed in the absence of anhydrotetracycline (Figures S6 and S7). These findings demonstrate that serCBCG positively regulates colony size in the BCG vaccine, while NapRBCG exerts a negative regulatory effect on BCG vaccine colony size by repressing serCBCG.

2.7. NapRBCG Relieves High-Serine Stress by Repressing serCBCG

Since serCBCG encodes phosphoserine aminotransferase, and is involved in serine metabolism, we further measured the growth curves of the BCG/WT and serCBCG KD strains in 7H9 liquid medium supplemented with varying concentrations of serine (Figure 5A). In the absence of exogenous serine, BCG/WT displayed slightly better growth than serCBCG KD. However, the addition of 5 µM serine resulted in a significant growth inhibition of BCG/WT, while the serCBCG KD strain displayed a pronounced growth advantage over BCG/WT, suggesting serine supplementation induces stress for the BCG vaccine, and downregulation of serCBCG confers increased resistance to serine-induced stress.
To further clarify the physiological role of NapRBCG under high-serine conditions, we constructed a napRBCG overexpression strain (napRBCG OE) and examined its growth under different serine concentrations (Figure 5B). Similarly, BCG/WT grew better than napRBCG OE without serine supplementation. However, as the serine concentration increased, the growth inhibition of BCG/WT intensified. In contrast, napRBCG OE almost completely overcame the inhibitory effect of high serine levels on the growth.
Collectively, the BCG vaccine is more susceptible to growth inhibition induced by high serine concentrations compared with M. smegmatis. serCBCG negatively regulates the serine stress tolerance of the BCG vaccine, whereas NapRBCG positively regulates the BCG vaccine’s tolerance to serine stress by repressing the expression of serCBCG.

2.8. Proteomic Analysis for the Targets of NapRBCG

To elucidate the specific mechanism by which napRBCG regulates serine metabolism, we conducted a proteomic analysis of the napRBCG OE strain. As expected, NapRBCG expression was markedly higher in the napRBCG OE group than in the BCG/WT group (Figure S8A). Across the proteomic, a total of 2737 proteins were identified. Based on the screening criteria of p-value ≤ 0.05 and fold change (FC) ≥ 1.2, we identified 1077 differentially expressed proteins, suggesting that NapRBCG acts as a global transcriptional regulator in the BCG vaccine (Figure 6A).
Subsequently, Kyoto Encyclopedia of Genes and Genomes (KEGG) (Figure 6B), and Gene Ontology (GO) (Figure 6C) enrichment analyses were performed to probe the underlying mechanisms. KEGG analysis revealed that napRBCG is a key regulator of amino acid metabolism in the BCG vaccine, and is involved in the regulation of valine, leucine, isoleucine, tryptophan, alanine, phenylalanine, lysine, serine, and glycine metabolism. GO enrichment analysis further indicated that NapRBCG regulates the expression of 154 hydrolases and 42 transferases, contributes to the metabolism of carboxylic acids, organic acids, and oxygenated acids, and is involved in cell wall synthesis and vitamin B6 biosynthesis in the BCG vaccine. In addition, NapRBCG plays a role in the BCG vaccine’s response to multiple stress factors, including antibiotics, oxidative stress, and ion homeostasis. The expression of isocitrate lyase (ICL), associated with resistance to isoniazid (INH), rifampin (RIF), and streptomycin (STREP), was upregulated 1.33-fold; catalase KatG, linked to Mycobacterium sensitivity to INH and oxidative stress, was upregulated 1.46-fold; superoxide dismutase SodA was increased 1.33-fold, and Mycobacterium ferritin BfrB 1.25-fold [19,20,21].
Based on our KEGG analysis, we identified 15 differentially expressed proteins within the glycine, serine, and threonine metabolism pathway (ko00260) (Figure 6B), with 8 proteins upregulated and 7 proteins downregulated (Figure S8B). Consistent with our findings, overexpression of napRBCG resulted in a decreased expression level of serCBCG, confirming its role as a transcriptional repressor of serCBCG (Figure S8B). To further investigate the impact of napRBCG on serine metabolism, we performed a protein–protein interaction analysis of the enriched proteins (Figure S8C). The results revealed that serCBCG serves as a central hub in the ko00260 interaction network, while TrpB and GlyA also occupy key positions.
Drawing on the protein–protein interaction analysis, we conducted an in-depth examination of the roles of these 15 proteins in the ko00260 metabolic pathway. Our findings indicate that increased napRBCG expression decreases the intracellular serine levels in the BCG vaccine through four distinct pathways (Figure 6D). First, upregulation of napRBCG enhances the expression of BCG_0100c and TrpA, irreversibly converting serine into pyruvate or L-tryptophan [22,23,24]. Second, increased napRBCG expression leads to upregulation of GlyA and Aao. Although GlyA reversibly converts serine into glycine, the upregulation of Aao irreversibly degrades glycine into glyoxylate, thereby driving serine flux towards glycine formation [25,26]. Finally, napRBCG represses serCBCG, blocking the conversion of 3-phosphohydroxypyruvate into serine and thus inhibiting serine biosynthesis.
To validate the proteomics results, we used RT-qPCR to examine the expression of glyA and trpA in napRBCG OE. Consistent with the proteomics data, the relative mRNA expression levels of glyA and trpA were upregulated in napRBCG OE (Figure S8D).
In summary, our omics data indicate that NapRBCG is a key regulator of intracellular amino acid metabolism in the BCG vaccine. Increased NapRBCG expression orchestrates a coordinated modulation of four distinct serine metabolic pathways, ultimately leading to a reduction in intracellular serine levels.

3. Discussion

In this study, we investigated the regulatory relationship between NapR and serC, and explored their impact on mycobacteria growth, colony morphology, and biofilm formation in both nonpathogenic strains, represented by M. smegmatis, and pathogenic strains, represented by the BCG vaccine. Our findings demonstrate that NapR functions as a transcriptional regulator of serC by binding directly to the 
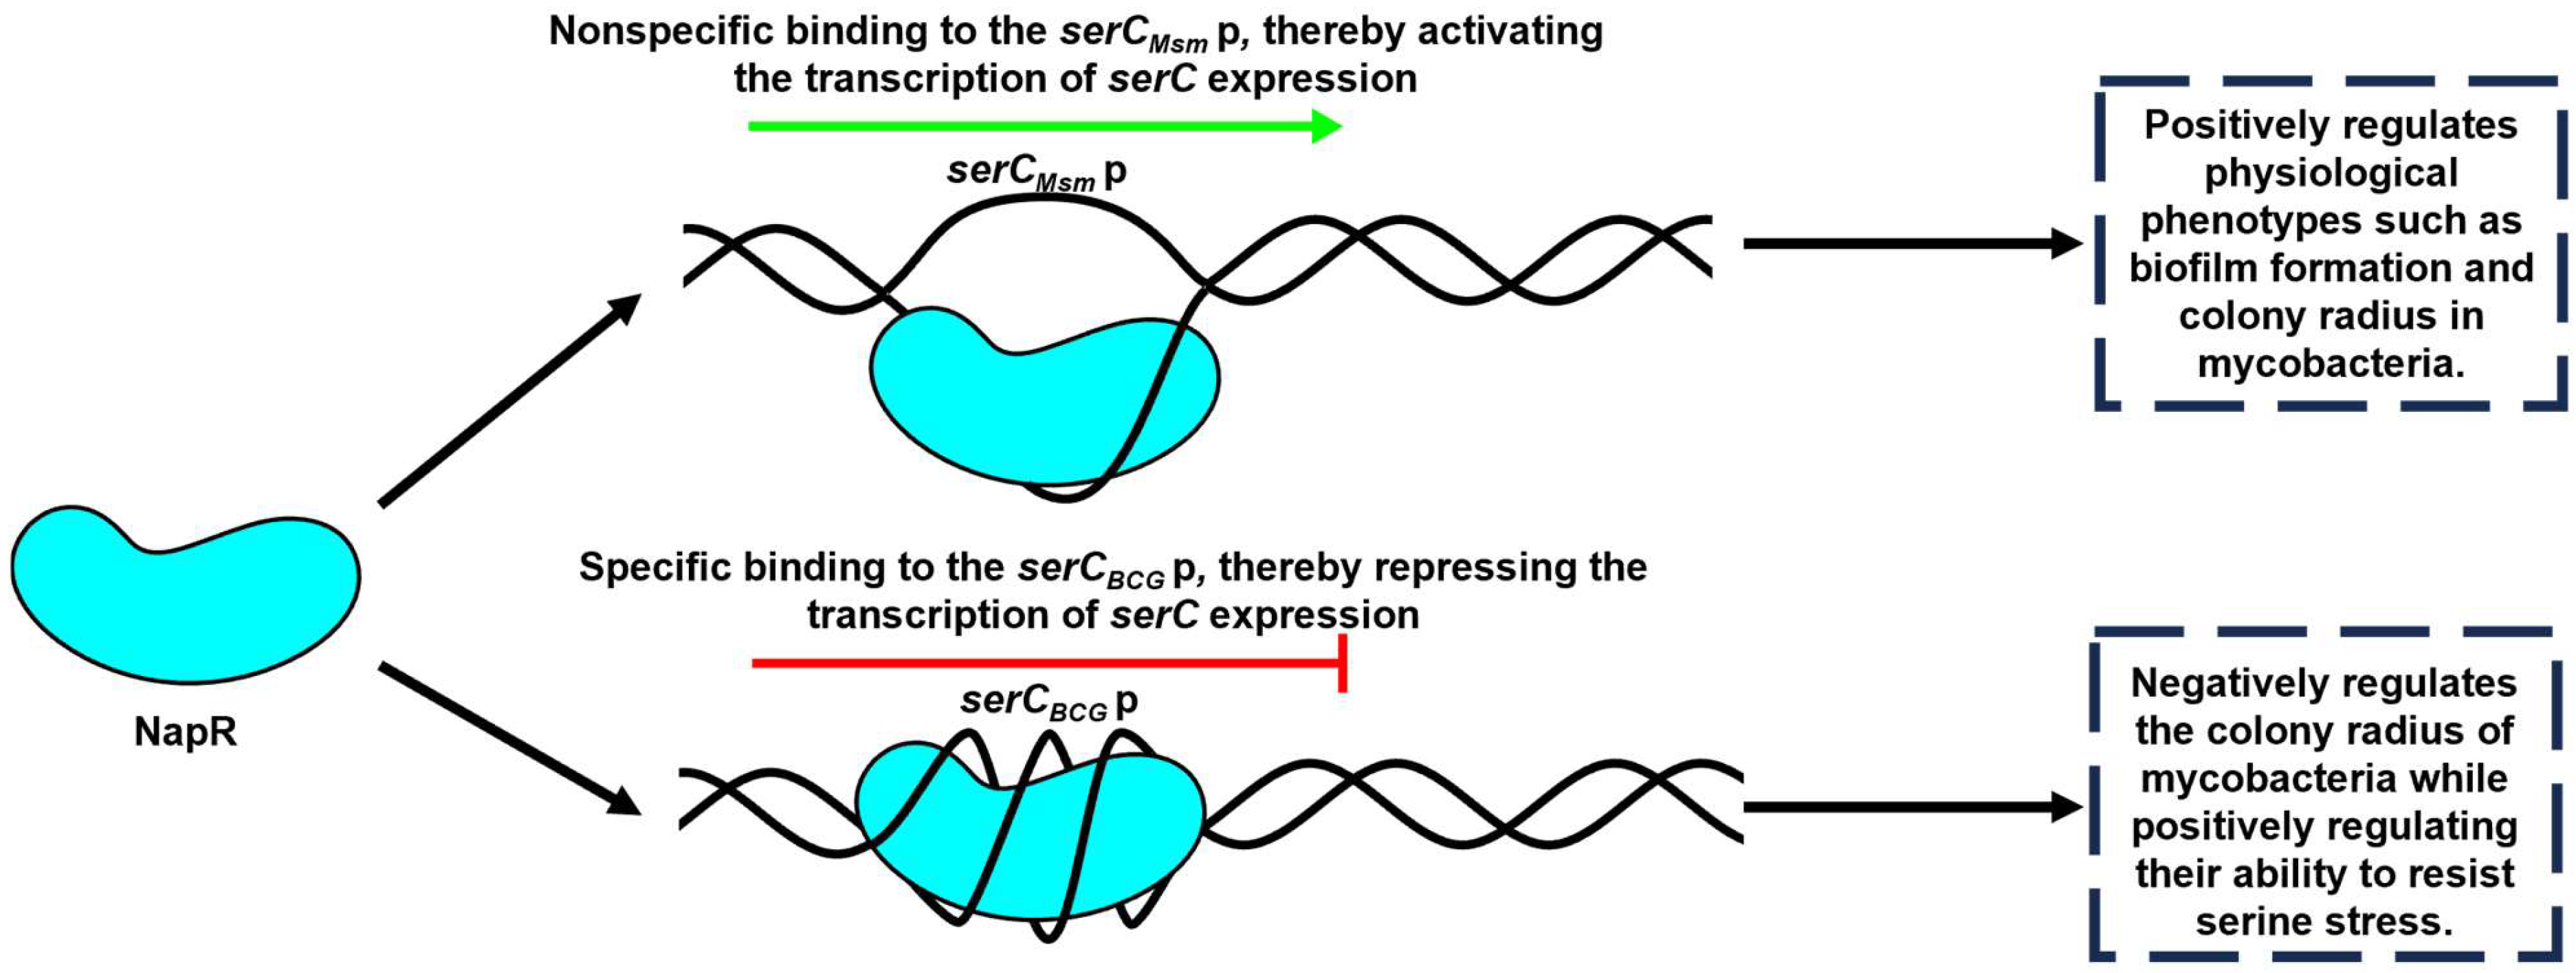
serC promoter; however, the regulatory mechanism and its physiological consequences exhibit significant strain-specific differences. In
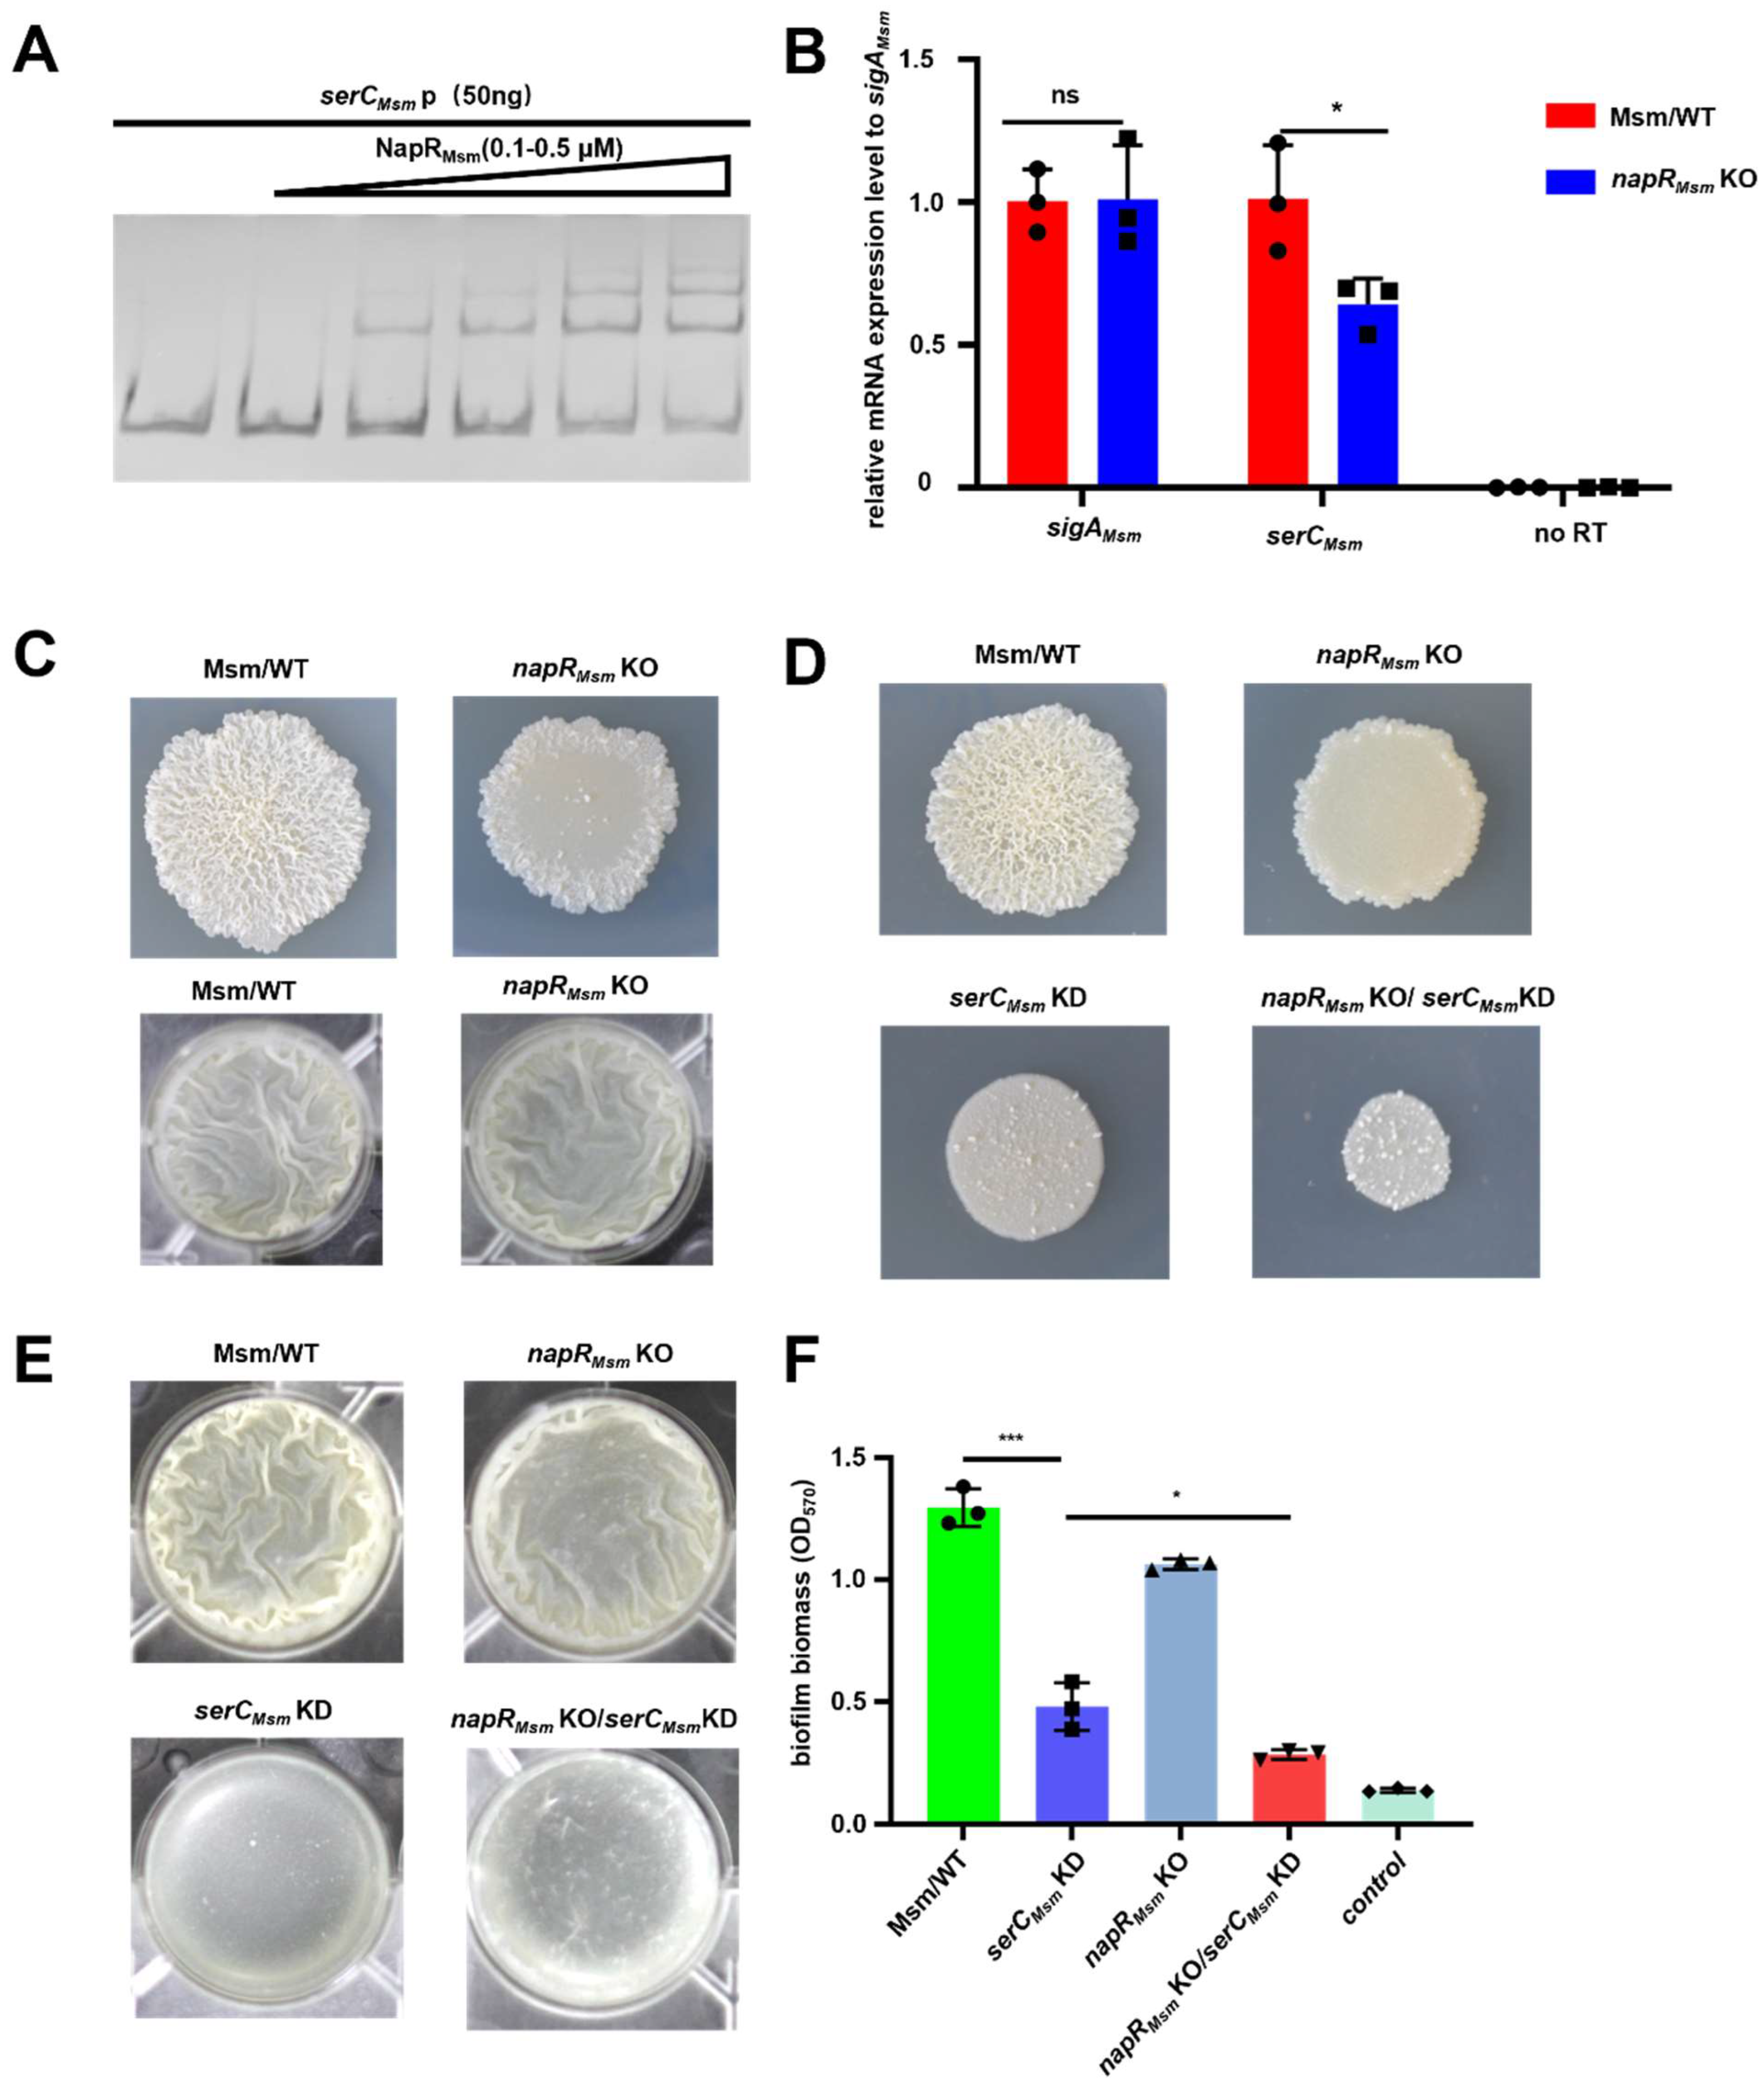
 M. smegmatis, NapRMsm positively regulates colony radius and biofilm formation by activating 
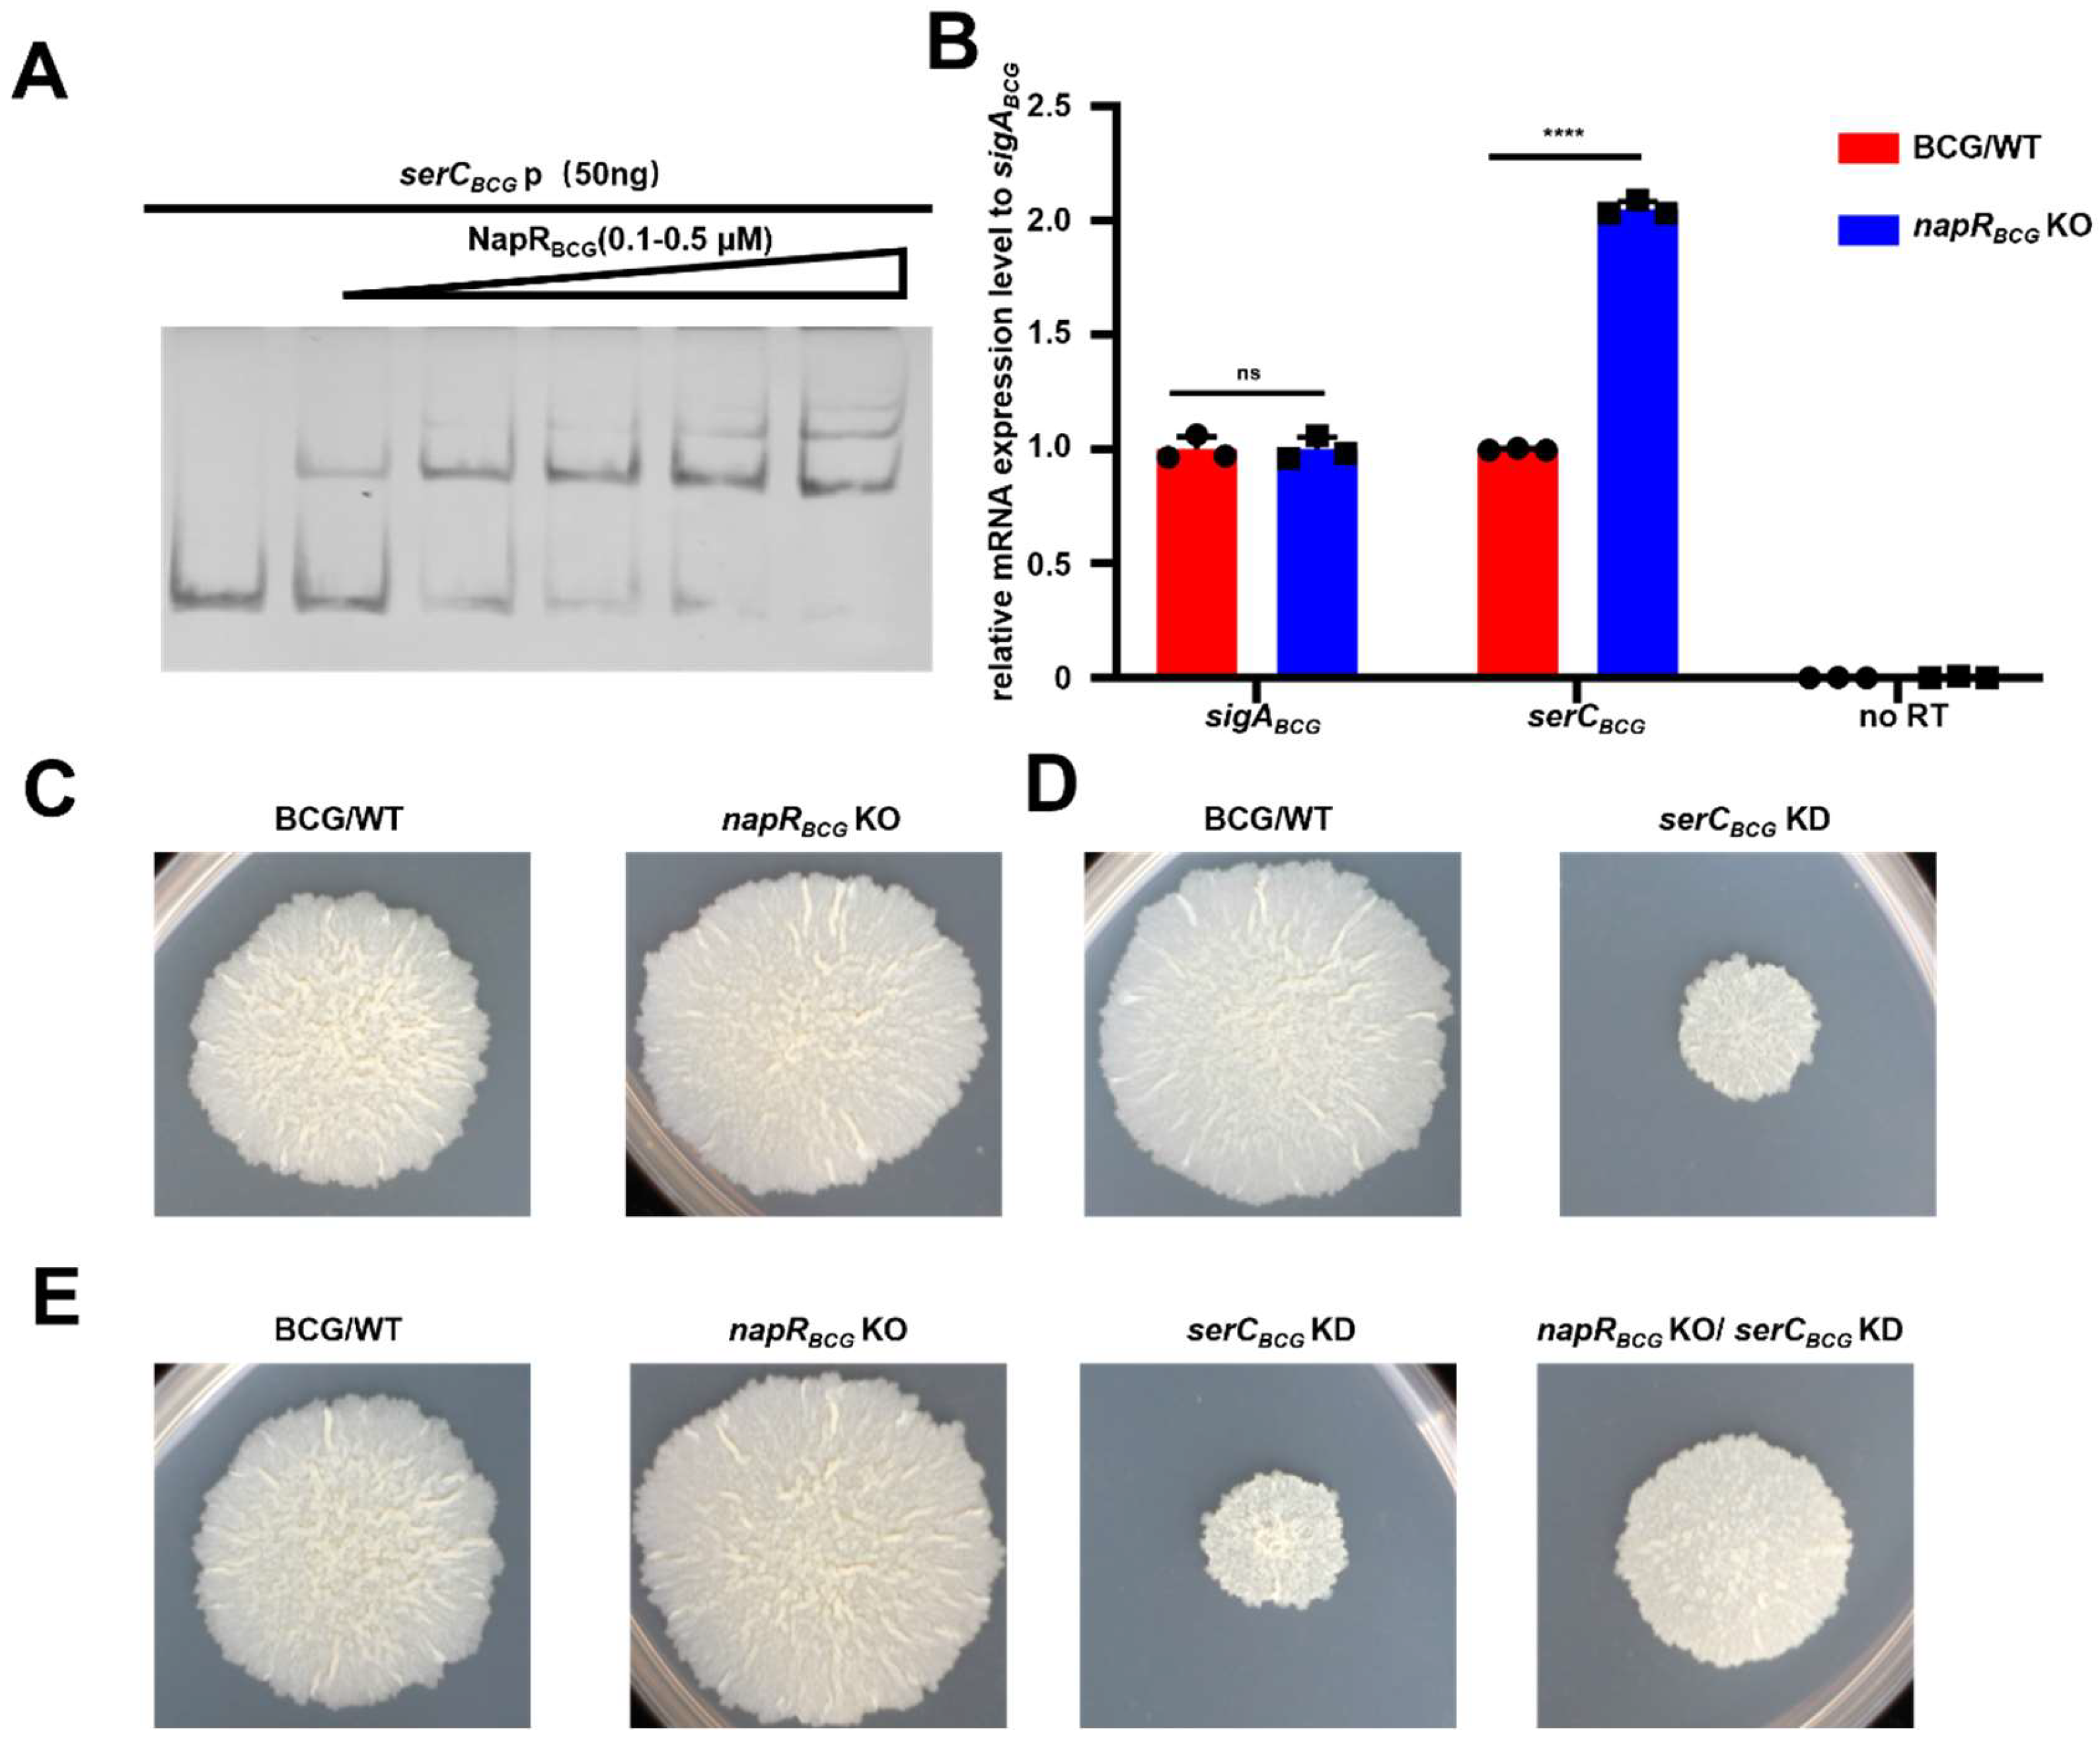
serCMsm. In contrast, in the BCG vaccine, NapRBCG exerts a negative regulatory effect on BCG vaccine colony size, but facilitates the BCG vaccine’s tolerance to serine stress by repressing serCBCG (Figure 7).
As the key enzyme in serine metabolism, SerC is essential for mycobacterial growth, with its repression leading to significant growth defects on solid media. Intriguingly, NapR activates serC in pathogenic strains but represses serC in nonpathogenic strains. The contrasting regulatory effects of NapR might be associated with the form and degree of its binding to the serC promoter. EMSA experiments revealed that at a concentration of 5 μM, both NapRMsm and NapRBCG could fully bind 50 ng of the serC promoter from the BCG vaccine (Figure 4A and Figure S9A), whereas neither protein was unable to completely bind 50 ng of the serC promoter from M. smegmatis under the same conditions (Figure 2A and Figure S9A). Despite the high degree of homology between NapRMsm and NapRBCG, the sequence homology of the serC promoter regions in these two species is relatively low (Figure S9B). The BCG vaccine and M. tuberculosis share a high degree of homology. The homology between serCBCGp and serCMtb p is 100% (Figure S9B), and the homology of NapR and SerC between M. tuberculosis and BCG vaccine is also 100% (Figure S10B). We conclude that NapR functions as a repressor of SerC in M. tuberculosis. Based on these findings, we speculate that variations in the serC promoter sequence leads to the strong and specific binding of NapR to the serC promoter in pathogenic strains, and, on the other hand, weak and nonspecific binding in nonpathogenic strains, likely contributing to the observed differences in the regulatory outcomes.
According to the widely accepted biofilm development model, biofilm formation can be summarized into reversible attachment, irreversible attachment, maturation, and dispersion [27]. The maturation phase can be further divided into three stages: the microcolony phase, the macrocolony phase, and the mature biofilm phase [18]. However, the precise distinctions between microcolonies and macrocolonies remain to be fully elucidated. A recent study in Pseudomonas aeruginosa demonstrated that Psl polysaccharides are evenly distributed throughout microcolonies, whereas in macrocolonies, Psl is predominantly localized at the biofilm periphery [
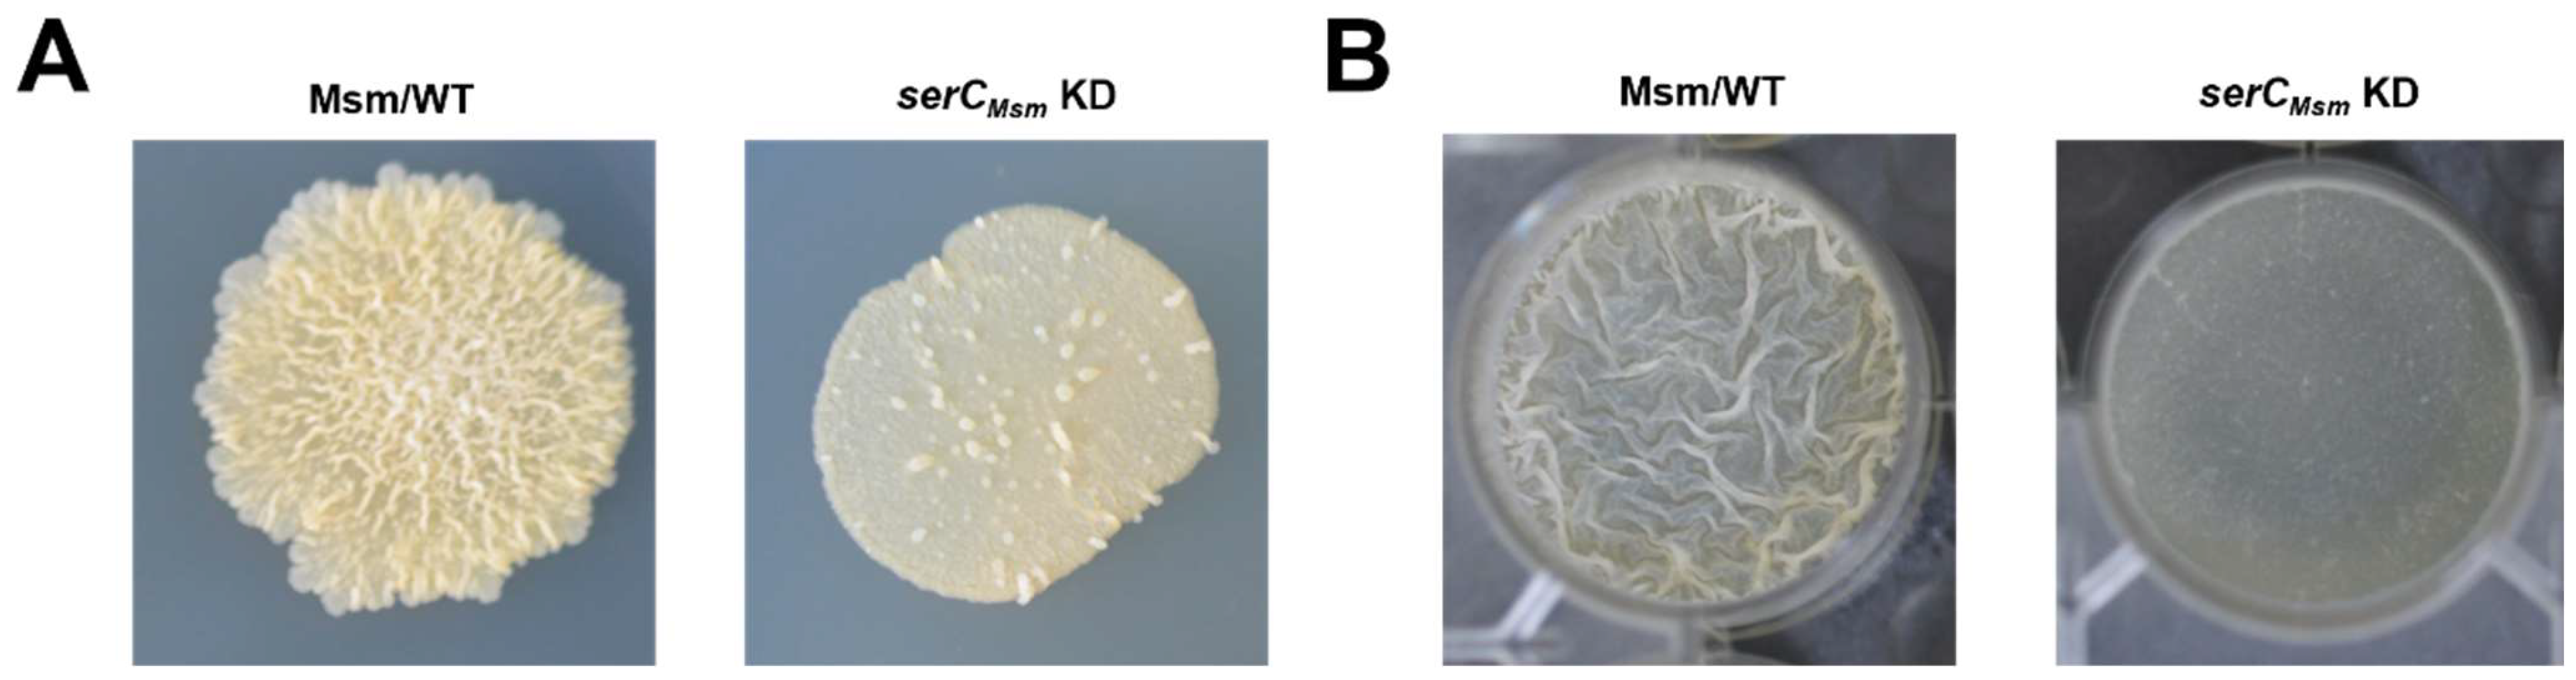
28]. In our study, serC repression inhibited biofilm formation in M. smegmatis (Figure 2E,F). Further experiments showed that while 
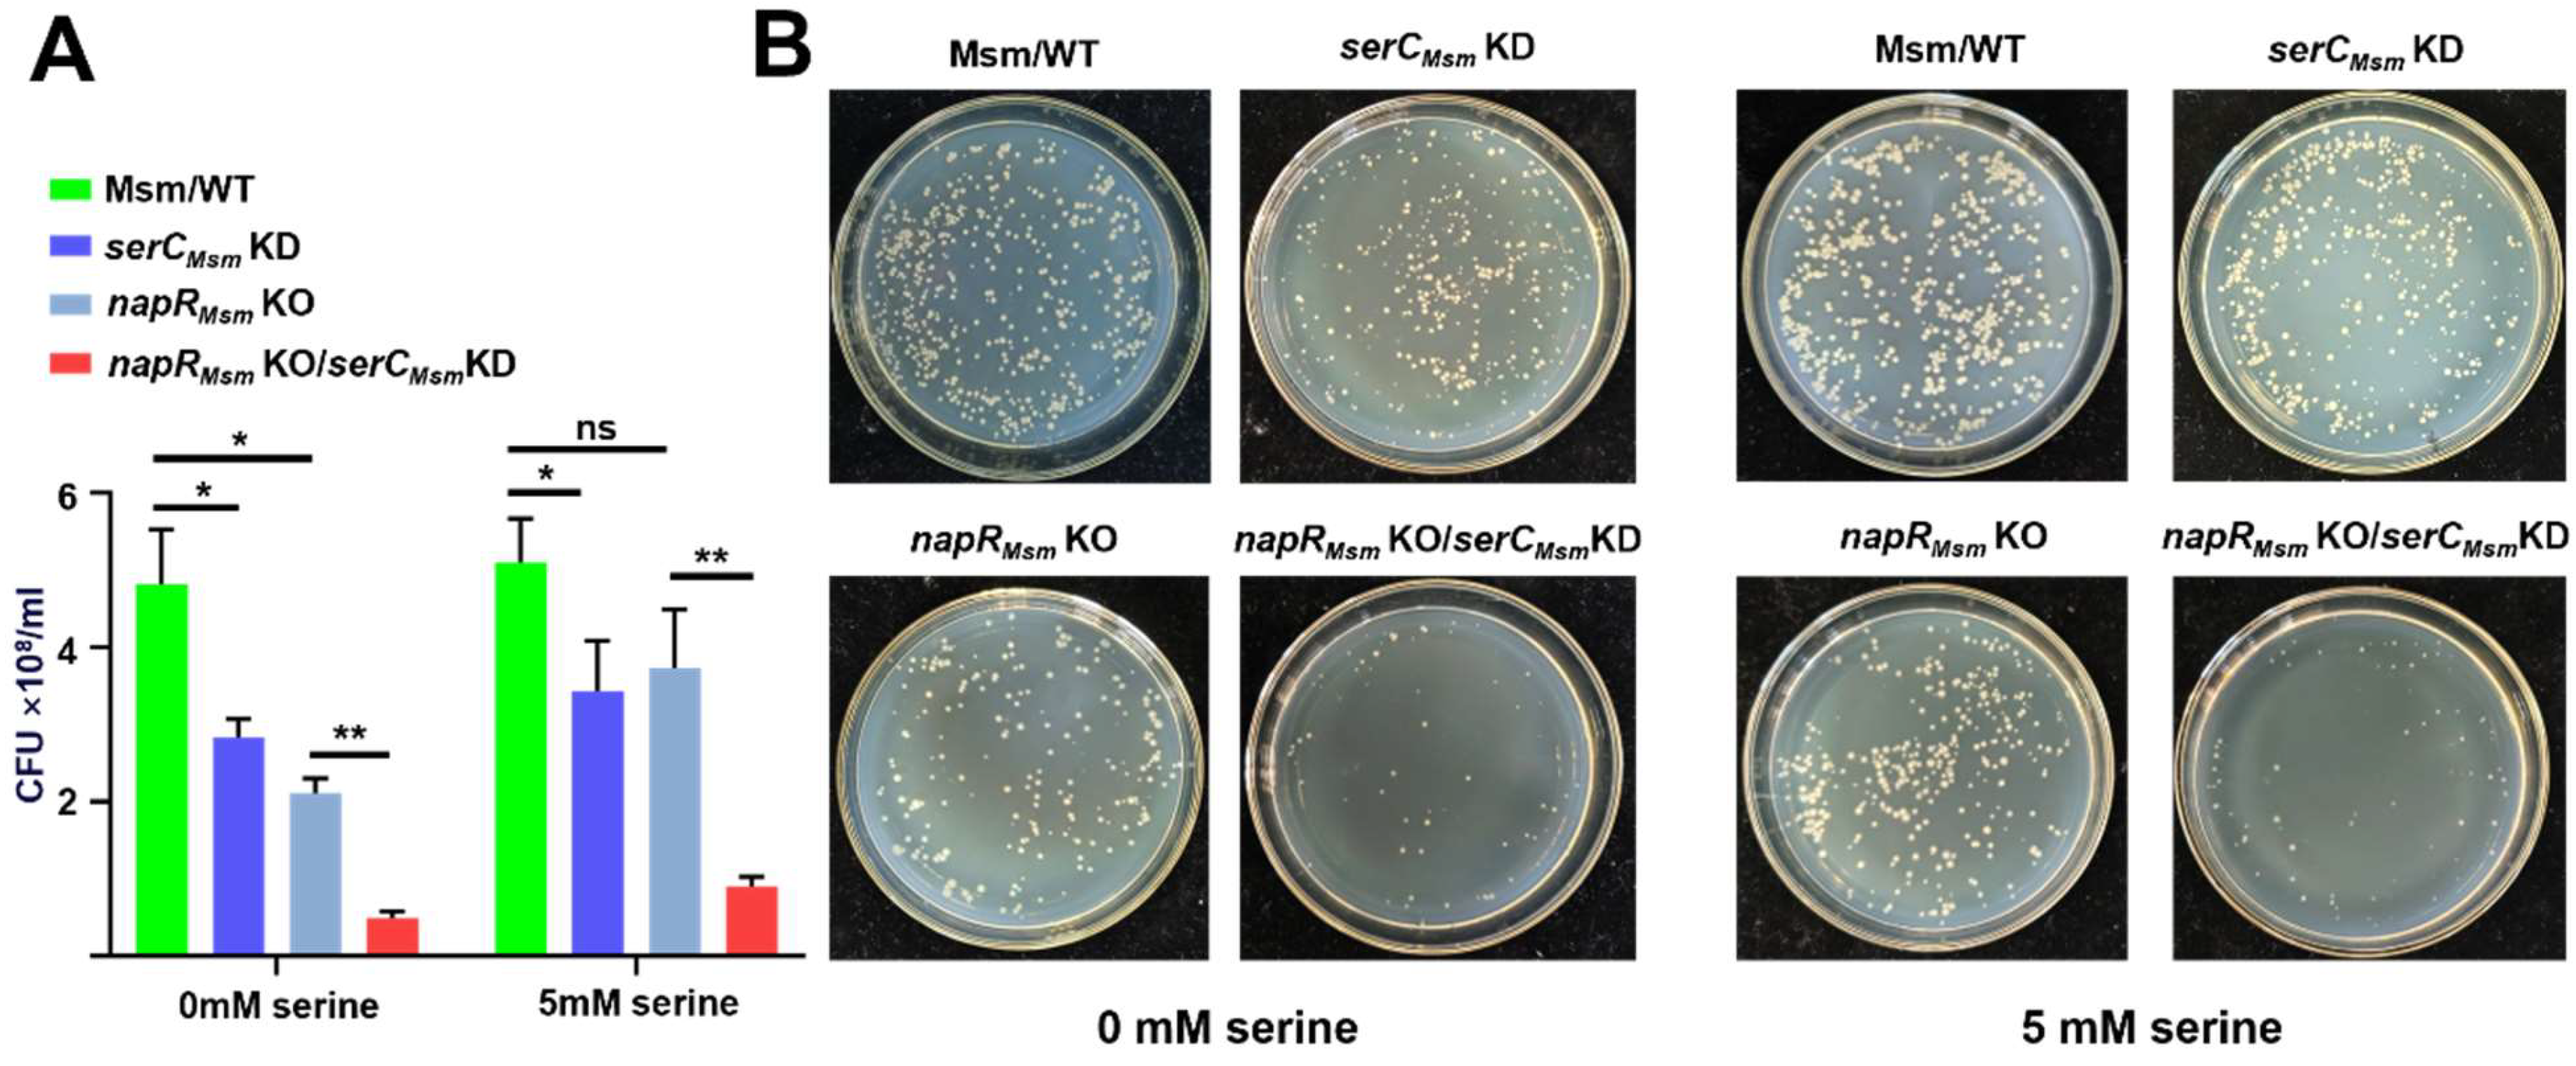
serC repression does not affect growth in static liquid cultures, plating these cultures onto 7H10 solid media not only resulted in a colony count reduced to half that of the wild-type strain, but also inhibited the transition from microcolonies to macrocolonies (Figure 3B). Moreover, in a strain lacking napR with concomitant serC repression, the colony count was even reduced to approximately one-tenth that of the wild-type (Figure 3A and Figure S3B). This phenomenon is likely due to reduced attachment of M. smegmatis to 7H10 agar as a result of serC repression. The different effect in liquid and solid media can likely be attributed to nutrient availability and diffusion dynamics, as well as the cell–cell interactions and communication. Notably, this growth inhibition on solid medium could not be completely alleviated by serine supplementation, suggesting that the effects of serC repression on solid-phase growth extend beyond serine metabolism. Although serC is necessary for the serine biosynthesis pathway, it is also interconnected with other amino acid metabolic pathways. Therefore, serine supplementation alone could not restore the broader metabolic imbalances due to serC repression. Altogether, our study revealed that serC repression impairs biofilm formation in M. smegmatis through a multi-faceted mechanism, encompassing both defects in initial attachment to solid surfaces and an inhibition of the transition from microcolonies to macrocolonies during biofilm development.
Beyond its role in biosynthesis and cell growth, serine metabolism plays a pivotal role in eukaryotic anti-infection processes. Lipopolysaccharide (LPS) can directly stimulate Toll-like receptors on macrophages, thereby activating intracellular serine synthesis [29]. Through the provision of one-carbon units to the methionine cycle, serine promotes the production of S-adenosylmethionine (SAM), which, in turn, modifies histones or DNA via methylation and stimulates macrophages to release IL-1β [29]. IL-1β, a key pro-inflammatory cytokine, plays a crucial role in macrophage-mediated resistance to M. tuberculosis. It was reported that mice infected with M. tuberculosis and lacking IL-1β exhibit significantly reduced survival rate rates compared to wild-type mice [30]. IL-1β can also act on epithelial cells to produce antimicrobial peptides, such as DEFB4/HBD2, and promotes endothelial cell expression of adhesion molecules, facilitating the recruitment of other immune cells to sites of infection [31]. To counteract these host defense mechanisms, M. tuberculosis has evolved strategies to inhibit IL-1β secretion. For instance, Rv0198c, a M. tuberculosis protein, suppresses IL-1β secretion by inhibiting inflammasome activation [32]. As an environmental microbe frequently exposed to nutrient-poor conditions, M. smegmatis must acquire large amounts of serine from its surroundings to survive. NapRMsm, functioning as a transcriptional activator of serCMsm, facilitates serine acquisition in M. smegmatis. In contrast, 
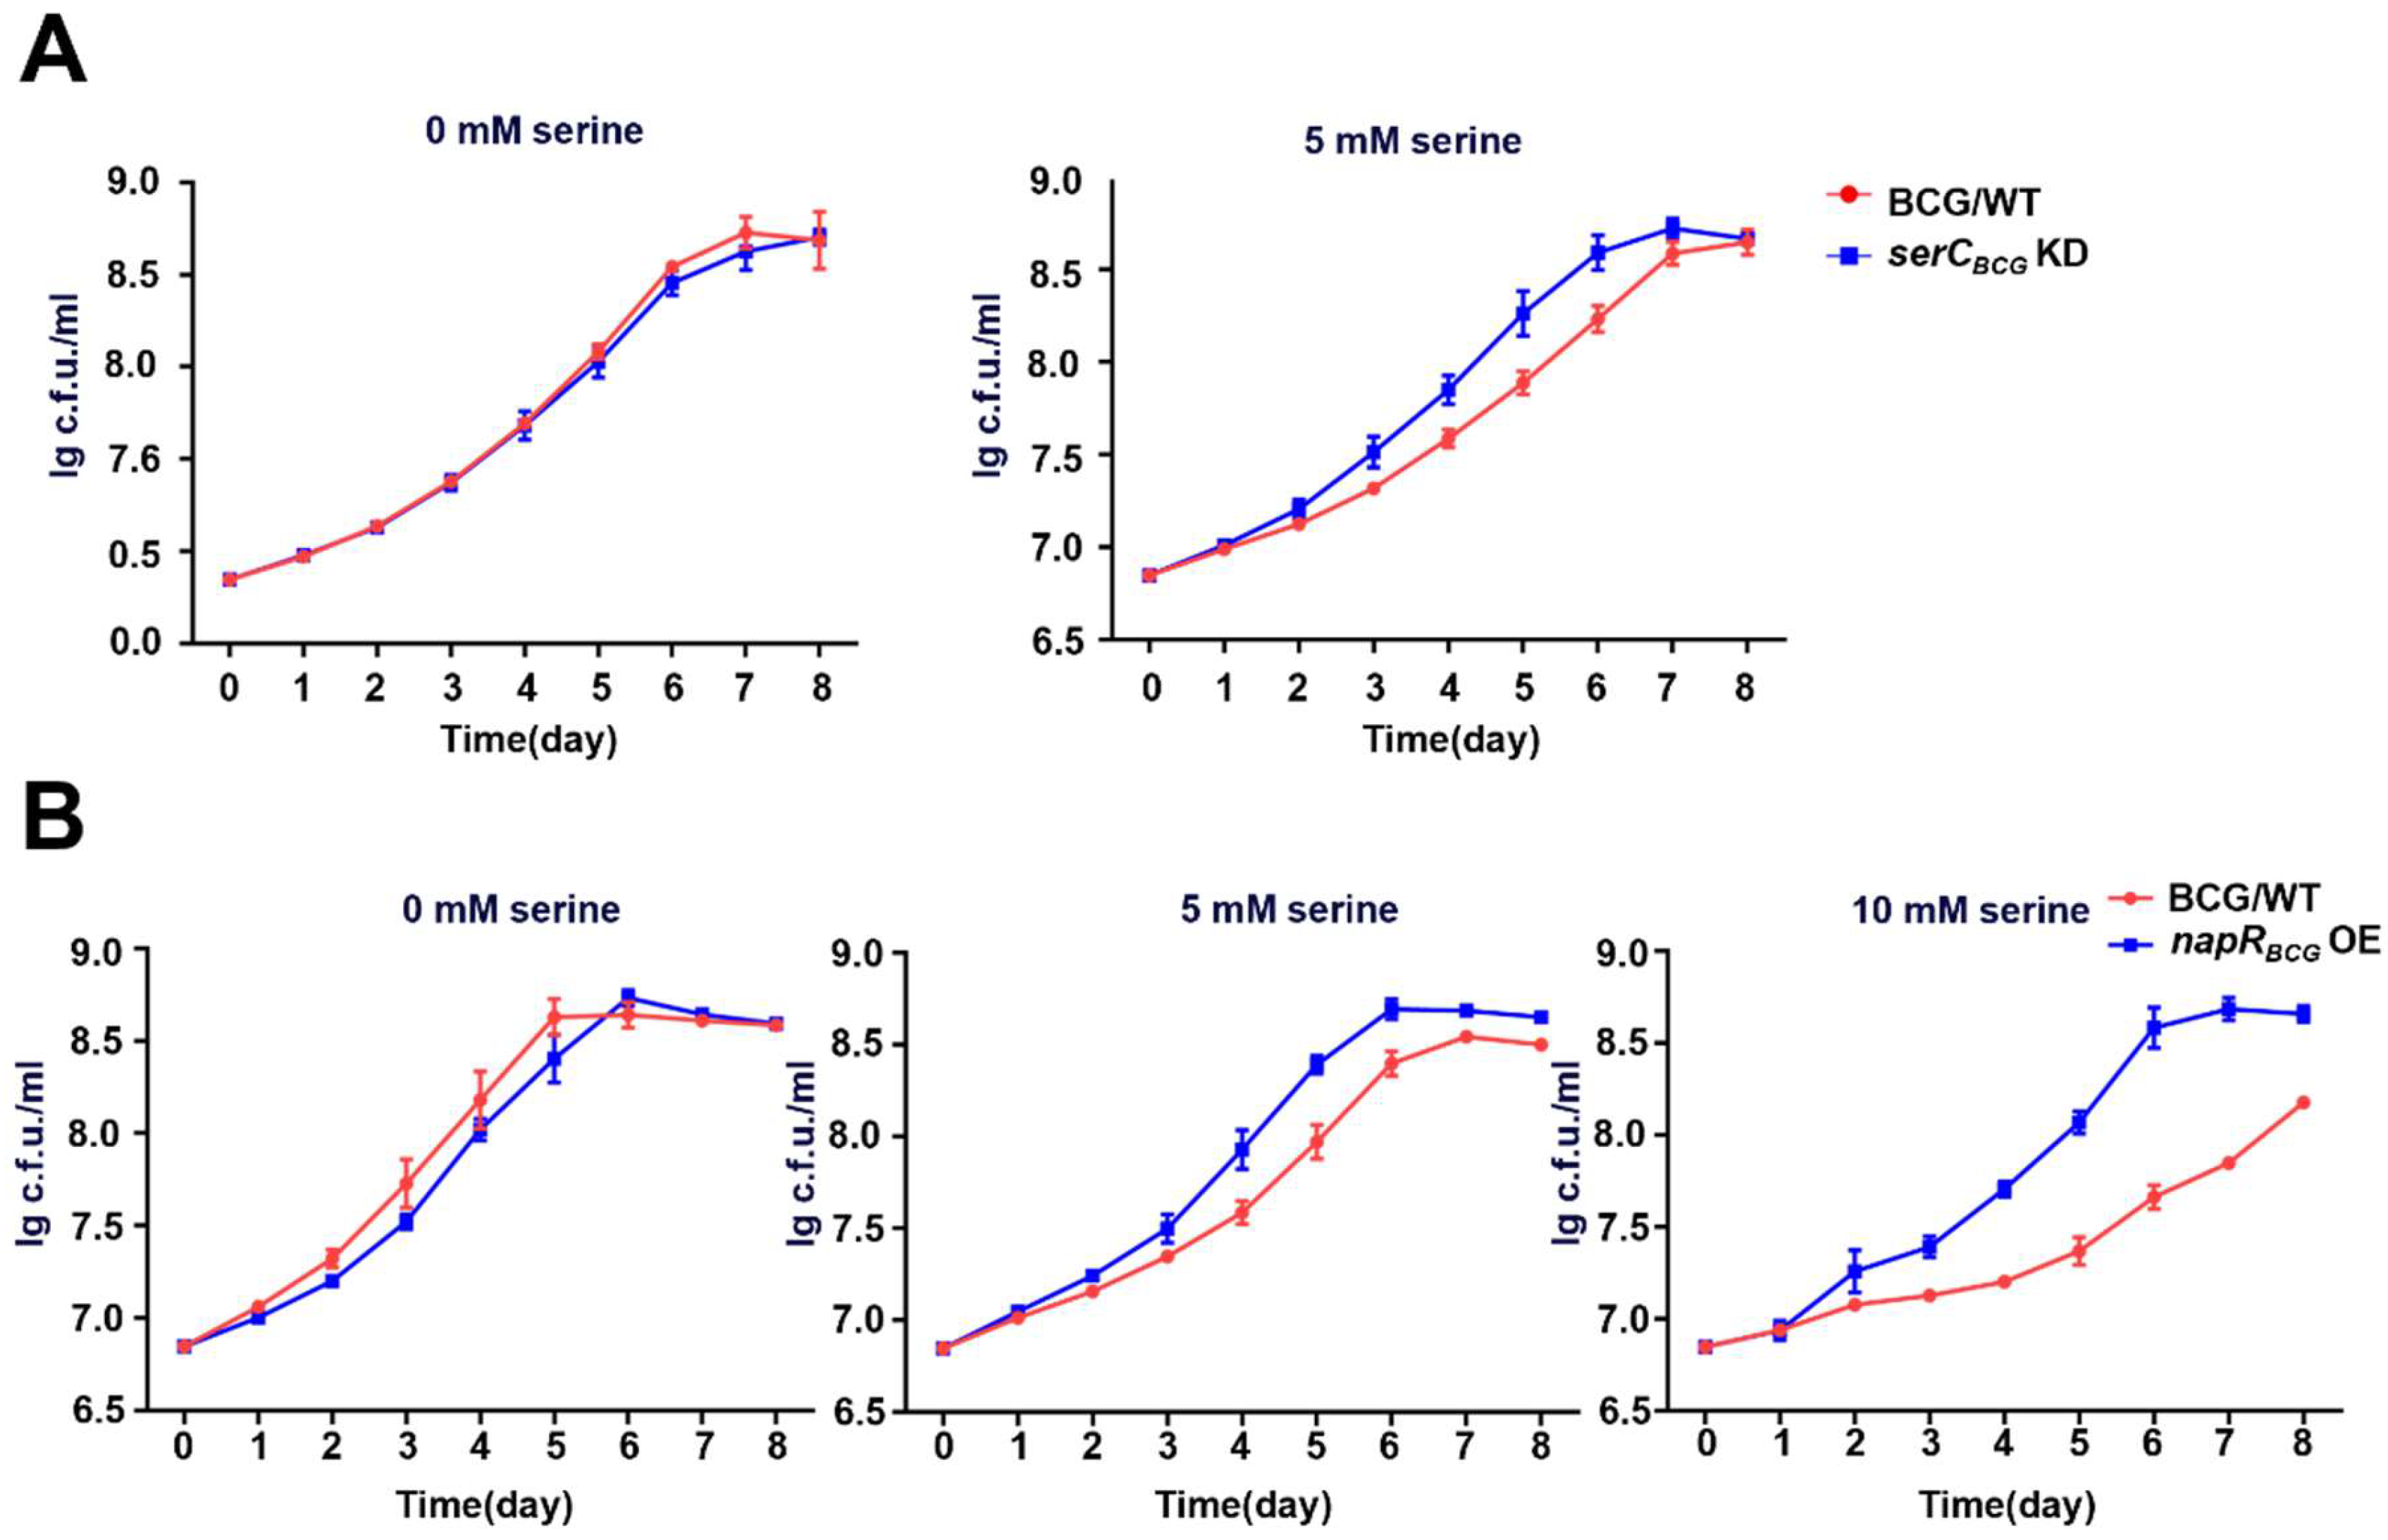
M. bovis, a pathogenic bacterium that resides within macrophages, faces a different challenge. Within the macrophage environment, high serine levels may serve as an indicator of host immune activation, particularly IL-1β production. To counteract this potential threat, M. bovis may detect high serine levels and quickly shift into a metabolically repressed state to cope with the threat posed by macrophage activation. This inference could explain our findings that high concentrations of serine inhibit the growth of the BCG vaccine strain, a close relative of M. bovis, while exhibiting minimal impact on M. smegmatis growth (Figure S3A and Figure 5B), suggesting that the BCG vaccine has evolved a heightened sensitivity to serine-induced stress. Accordingly, overexpression of NapRBCG, by repressing serCBCG and orchestrating a coordinated modulation of other distinct serine metabolic pathways, results in a reduction in intracellular serine levels and then mitigates the detrimental effects of elevated serine levels within the macrophage environment. This mechanism enables the BCG vaccine strain to better withstand the host immune response (Figure 5B and Figure 6D).
Overall, our findings demonstrate that SerC is critical for mycobacteria, and its repression has profound impacts on M. smegmatis. Previous studies have successfully resolved the protein structure of SerC in M. tuberculosis, revealing only 23.6% homology with human phosphoserine aminotransferase. This significant structural divergence indicates that SerC could serve as a promising new drug target for tuberculosis treatments amenable to drug discovery efforts utilizing virtual screening and molecular dynamics simulations [33,34]. Our findings also highlight the contrasting regulatory effects of NapR on serC expression in pathogenic and nonpathogenic mycobacteria, suggesting a key role for NapR during human infection. Although napR knockout in the BCG vaccine did not produce dramatic phenotypic changes under in vitro conditions, the extensive involvement of NapR in in serine metabolism and multiple stress responses in the BCG vaccine implies that targeting NapR may offer a novel therapeutic strategy to combat drug-resistant M. tuberculosis and enhance host-mediated immune responses.
In conclusion, we showed that NapR functions as a transcriptional regulator of serC by binding directly to the serC promoter. In M. smegmatis, NapR activates serCMsm transcription, positively impacting biofilm formation, the transition from microcolonies to macrocolonies, and growth on solid media. In contrast, in the BCG vaccine strain, NapR functions as a transcriptional repressor of serCBCG, contributing to the BCG vaccine’s tolerance to serine stress. These findings highlight the contrasting regulatory roles of NapR in different mycobacterial species and underscore the importance of serine metabolism in bacterial adaptation and survival. This study provides valuable insights into the complex interplay between metabolism, gene regulation, and bacterial physiology, with potential implications for the development of novel anti-mycobacterial therapies.

4. Material and Methods

4.1. Cloning

Primers containing restriction sites were designed by selecting 20 bp sequences upstream and downstream of the target gene. The primers were synthesized by Tsingke Biotech (Beijing, China). The plasmid pMV261 was used to overexpress the target gene, and pET-cm1 was used for protein purification. PCR-amplified DNA fragments were ligated into the plasmids using T4 DNA ligase, and the ligated products were then chemically transformed into E. coli DH5α. The transformants were cultured in LB medium (20 g/L tryptone (OXOID, Basingstoke, UK), 10 g/L yeast extract (OXOID, Basingstoke, UK), 20 g/L NaCl (Sangon Biotech, Shanghai, China), pH 7.0), and the recombinant plasmids were extracted using the alkaline lysis method. To confirm successful construction, PCR amplification of the target gene from the recombinant plasmid was performed, and the size of the recombinant plasmid was compared with that of the original plasmid.

4.2. Protein Expression and Purification

The constructed pET-cm1 plasmid harboring the target gene was chemically transformed into E. coli BL21(DE3), followed by expansion in LB medium. The culture was incubated at 37 °C and 160 rpm until the OD600 reached 0.6. The temperature was then lowered to 16 °C, and isopropyl-β-D-1-thiogalactopyranoside (IPTG) (Solarbio, Beijing, China) was added to a final concentration of 0.4 mM. After 12 h of induction, cells were harvested by centrifugation, and the cell pellets were disrupted using a 300 W ultrasonic homogenizer. Cellular debris was collected by centrifugation at 8000× g rpm for 30 min. Ni-NTA (Solarbio, Beijing, China) agarose affinity chromatography was employed to purify proteins containing His tags: column washes were performed with 50 mM and 100 mM imidazole (Solarbio, Beijing, China), while the target protein was eluted using 250 mM imidazole. The eluted proteins were dialyzed against protein dialysis buffer (20 mM Tris-base (Sigma-Aldrich, Saint Louis, MO, USA), 100 mM NaCl, 10% v/v glycerol (Sangon Biotech, Shanghai, China)). Purified proteins were examined by sodium dodecyl sulfate–polyacrylamide gel electrophoresis (SDS–PAGE), and their concentrations were measured with a NanoDrop (Thermo Fisher Scientific, Waltham, MA, USA) instrument.

4.3. Electrophoretic Mobility Shift Assay

The promoter fragment of serC was obtained via PCR. An 8% native polyacrylamide (Solarbio, Beijing, China) gel was prepared. The promoter fragment was mixed with protein dialysis buffer to form a total volume of 17.5 μL containing various concentrations of protein, along with an additional 1.5 μL of H buffer (Takara, Dalian, China) and 1 μL of 50% (v/v) glycerol. The mixture was incubated for 15 min. Afterward, the incubated solution was loaded onto the previously prepared 8% polyacrylamide gel and subjected to electrophoresis at 150 V for 1 h in TBE buffer (5.4 g/L Tris-base, 2.75 g/L boric acid (Tianjin Aopusheng Chemical Co., Ltd., Tianjin, China), 0.372 g/L Na2EDTA·2H2O (Solarbio, Beijing, China), pH 8.3). The gel was then stained with ethidium bromide (EB) (Solarbio, Beijing, China), and images were captured using a GelDoc scanner (BIO-RAD, Hercules, CA, USA).

4.4. Construction of Target Gene Knockdown/Overexpression Strains

Knockdown plasmid construction: To knock down target gene expression, potential PAM sites on the full-length serC gene were identified, and complementary paired sgRNA primers targeting serC were designed. Bsm BI restriction sites were incorporated into the primers. After annealing, the double-stranded DNA was inserted into either the pLJR 962 vector (for M. smegmatis) or the pLJR 965 vector (for the BCG vaccine) through restriction digestion and ligation, thereby creating the corresponding recombinant plasmids.
Overexpression plasmid construction: For overexpression, napR was cloned into the pMV261+ vector to generate the recombinant plasmid. A total of 200 ng of the recombinant plasmid was introduced into competent M. smegmatis or BCG vaccine cells. Electroporation was performed at 2500 V, after which the cells were allowed to recover in 7H9 liquid medium (4.9 g/L Middlebrook 7H9 Broth (BD Difco, Franklin Lakes, NJ, USA), 0.2% v/v glycerol, 0.05% v/v Tween-80). The M. smegmatis cultures were recovered for 4 h, and the BCG vaccine cultures were recovered for 24 h. The recovered cells were then plated on 7H10 solid medium (19 g/L Middlebrook 7H10 Powder (BD Difco, Franklin Lakes, NJ, USA), 0.2% v/v glycerol, 0.03 g/L kanamycin (Solarbio, Beijing, China)) and incubated—3–4 days for M. smegmatis and 25–30 days for the BCG vaccine. Primers designed to validate the presence of the recombinant plasmid were used in PCR with bacterial lysates (prepared by heating to 100 °C for 10 min), and the resulting amplicons were analyzed to confirm the successful construction of the recombinant strains.

4.5. Real-Time Quantitative PCR (RT-qPCR)

When the constructed M. smegmatis/BCG vaccine cultures reached an OD600 of 1.0, the cells were harvested and washed twice with PBS. The cell pellets were then resuspended in 200 μL of 3 mg/mL lysozyme (Solarbio, Beijing, China) and incubated at 37 °C for 30 min. Total bacterial RNA was extracted using an RNA extraction kit from Aidlab (Beijing, China). A 20 μL aliquot of the extracted RNA was treated with 1 μL of DNase I (Takara, Dalian, China) and 2 μL of 10× DNase I buffer (Takara, Dalian, China) at 37 °C for 30 min to remove any residual genomic DNA. The reaction mixture was then heated at 65 °C for 10 min to inactivate DNase I. Using a reverse transcription kit, mRNA was reverse-transcribed. The concentration of total RNA was measured with a NanoDrop, and the reaction volume for reverse transcription was set to 40 μL, which included 300 ng RNA, 2 ng random primer (Aidlab, Beijing, China), and 8 ng 5× TURE R Mix (Aidlab, Beijing, China).
Primers for qPCR were designed using sigA as the internal reference gene, where msmeg_2758 served as sigA for M. smegmatis, and bcg_2716 served as sigA for the BCG vaccine. Real-time quantitative PCR was performed using SYBR qPCR Green Master Mix (Aidlab, Beijing, China). The relative expression of the target gene was calculated as 2−ΔΔCt.

4.6. Observation of Colony Surface Morphology

Activated mycobacterial cultures were grown in 7H9 medium containing kanamycin until OD600 reached 1.0. Subsequently, 7H10 agar plates with kanamycin—and, where applicable, 0.1 ng/mL anhydrotetracycline (Solarbio, Beijing, China)—were prepared. Two microliters of the OD600 = 1.0 culture were spotted onto the surface of 7H10 agar plates (with or without anhydrotetracycline). M. smegmatis plates were incubated statically at 37 °C for 3–5 days, while BCG vaccine plates were incubated at 37 °C for 20–30 days. Colony size and surface wrinkling were then observed.

4.7. Biofilm Assays

Activated mycobacterial cultures were grown in 7H9 medium containing kanamycin to OD600 = 1.0. The cells were harvested and resuspended in M63 salt medium (13.6 g/L KH2PO4 (Solarbio, Beijing, China), 4.2 g/L KOH (Tianjin Beichen Fangzheng Reagent Factory, Tianjin, China), 1.98 g/L (NH4)2SO4 (Sinopharm Chemical Reagent Co., Ltd., Shanghai, China), 1.08 mg/L FeSO4 (Tianjin New Technology Industrial Park Kemao Chemical Reagent Co., Ltd. Tianjin, China), 50 mL 40% (v/v) glucose (Tianjin AoboKai Chemical Co., Ltd., Tianjin, China), 10 mL 20% (v/v) casein hydrolysate (Macklin, Shanghai, China), 10 mL 100 mM MgSO4 (Sinopharm Chemical Reagent Co., Ltd., Shanghai, China), 7 mL 100 mM CaCl2 (Tianjin Aopusheng Chemical Co., Ltd., Tianjin, China), 0.03 g/L kanamycin). The resuspended cells were then diluted in M63 medium to OD600 = 0.3, and the resulting cell suspension was divided into two portions—one supplemented with anhydrotetracycline to a final concentration of 0.1 ng/mL, and the other without anhydrotetracycline. Three milliliters of each suspension were dispensed into the wells of a 12-well plate.
Separately, the OD600 = 0.3 suspension was further diluted to OD600 = 0.1, divided into two portions (with or without anhydrotetracycline), and 100 μL of each was dispensed into the wells of a 96-well plate.
Air–Liquid Interface Biofilm Assay: The 12-well plate was incubated statically at 30 °C for 3–5 days. Biofilm formation was monitored daily, and images were taken to record changes.
Biofilm Quantification Assay: The 96-well plate was incubated at 37 °C and 80 rpm for 36–48 h. Biofilms were then stained with 120 μL of 1% crystal violet (Solarbio, Beijing, China) solution for 30 min, followed by rinsing with deionized water to remove excess dye. The remaining crystal violet bound to the biofilm was dissolved in an ethanol–acetone solution (20% (v/v) ethanol (Sangon Biotech, Shanghai, China), 80% (v/v) acetone (Sigma-Aldrich, Saint Louis, MO, USA)) for 5 min, and the absorbance at 570 nm (OD570) was measured with a microplate reader.

4.8. Growth Curve Assays

Activated mycobacterial cultures were grown in 7H9 medium containing kanamycin to OD600 = 1.0. The cells were collected, resuspended in fresh 7H9 medium, and transferred to 100 mL 7H9 medium containing kanamycin at a starting OD600 = 0.15. If CRISPRi strains were used, anhydrotetracycline was added to a final concentration of 0.1 ng/mL. For M. smegmatis, samples (2 mL) were taken every 4 h to measure OD600; for the BCG vaccine, samples were collected every 24 h. The measured OD600 values were subsequently converted to CFU counts.

4.9. Colony Counting Assays

Activated mycobacterial cultures were grown in 7H9 medium containing kanamycin to OD600 = 1.0. The cells were then harvested and resuspended in fresh 7H9 medium. The resuspended cells were inoculated into 100 mL of 7H9 medium containing kanamycin and 0.1 ng/mL anhydrotetracycline, with a starting OD600 = 0.6. Cultures were incubated statically at 37 °C for 48 h, and OD600 was recorded. The culture was then diluted 1:20,000, and 100 μL of the diluted suspension was plated onto 7H10 agar containing kanamycin. Plates were incubated statically at 37 °C for 3–5 days (for M. smegmatis) or 20–30 days (for the BCG vaccine), after which the number of colonies on the 7H10 plates were counted.

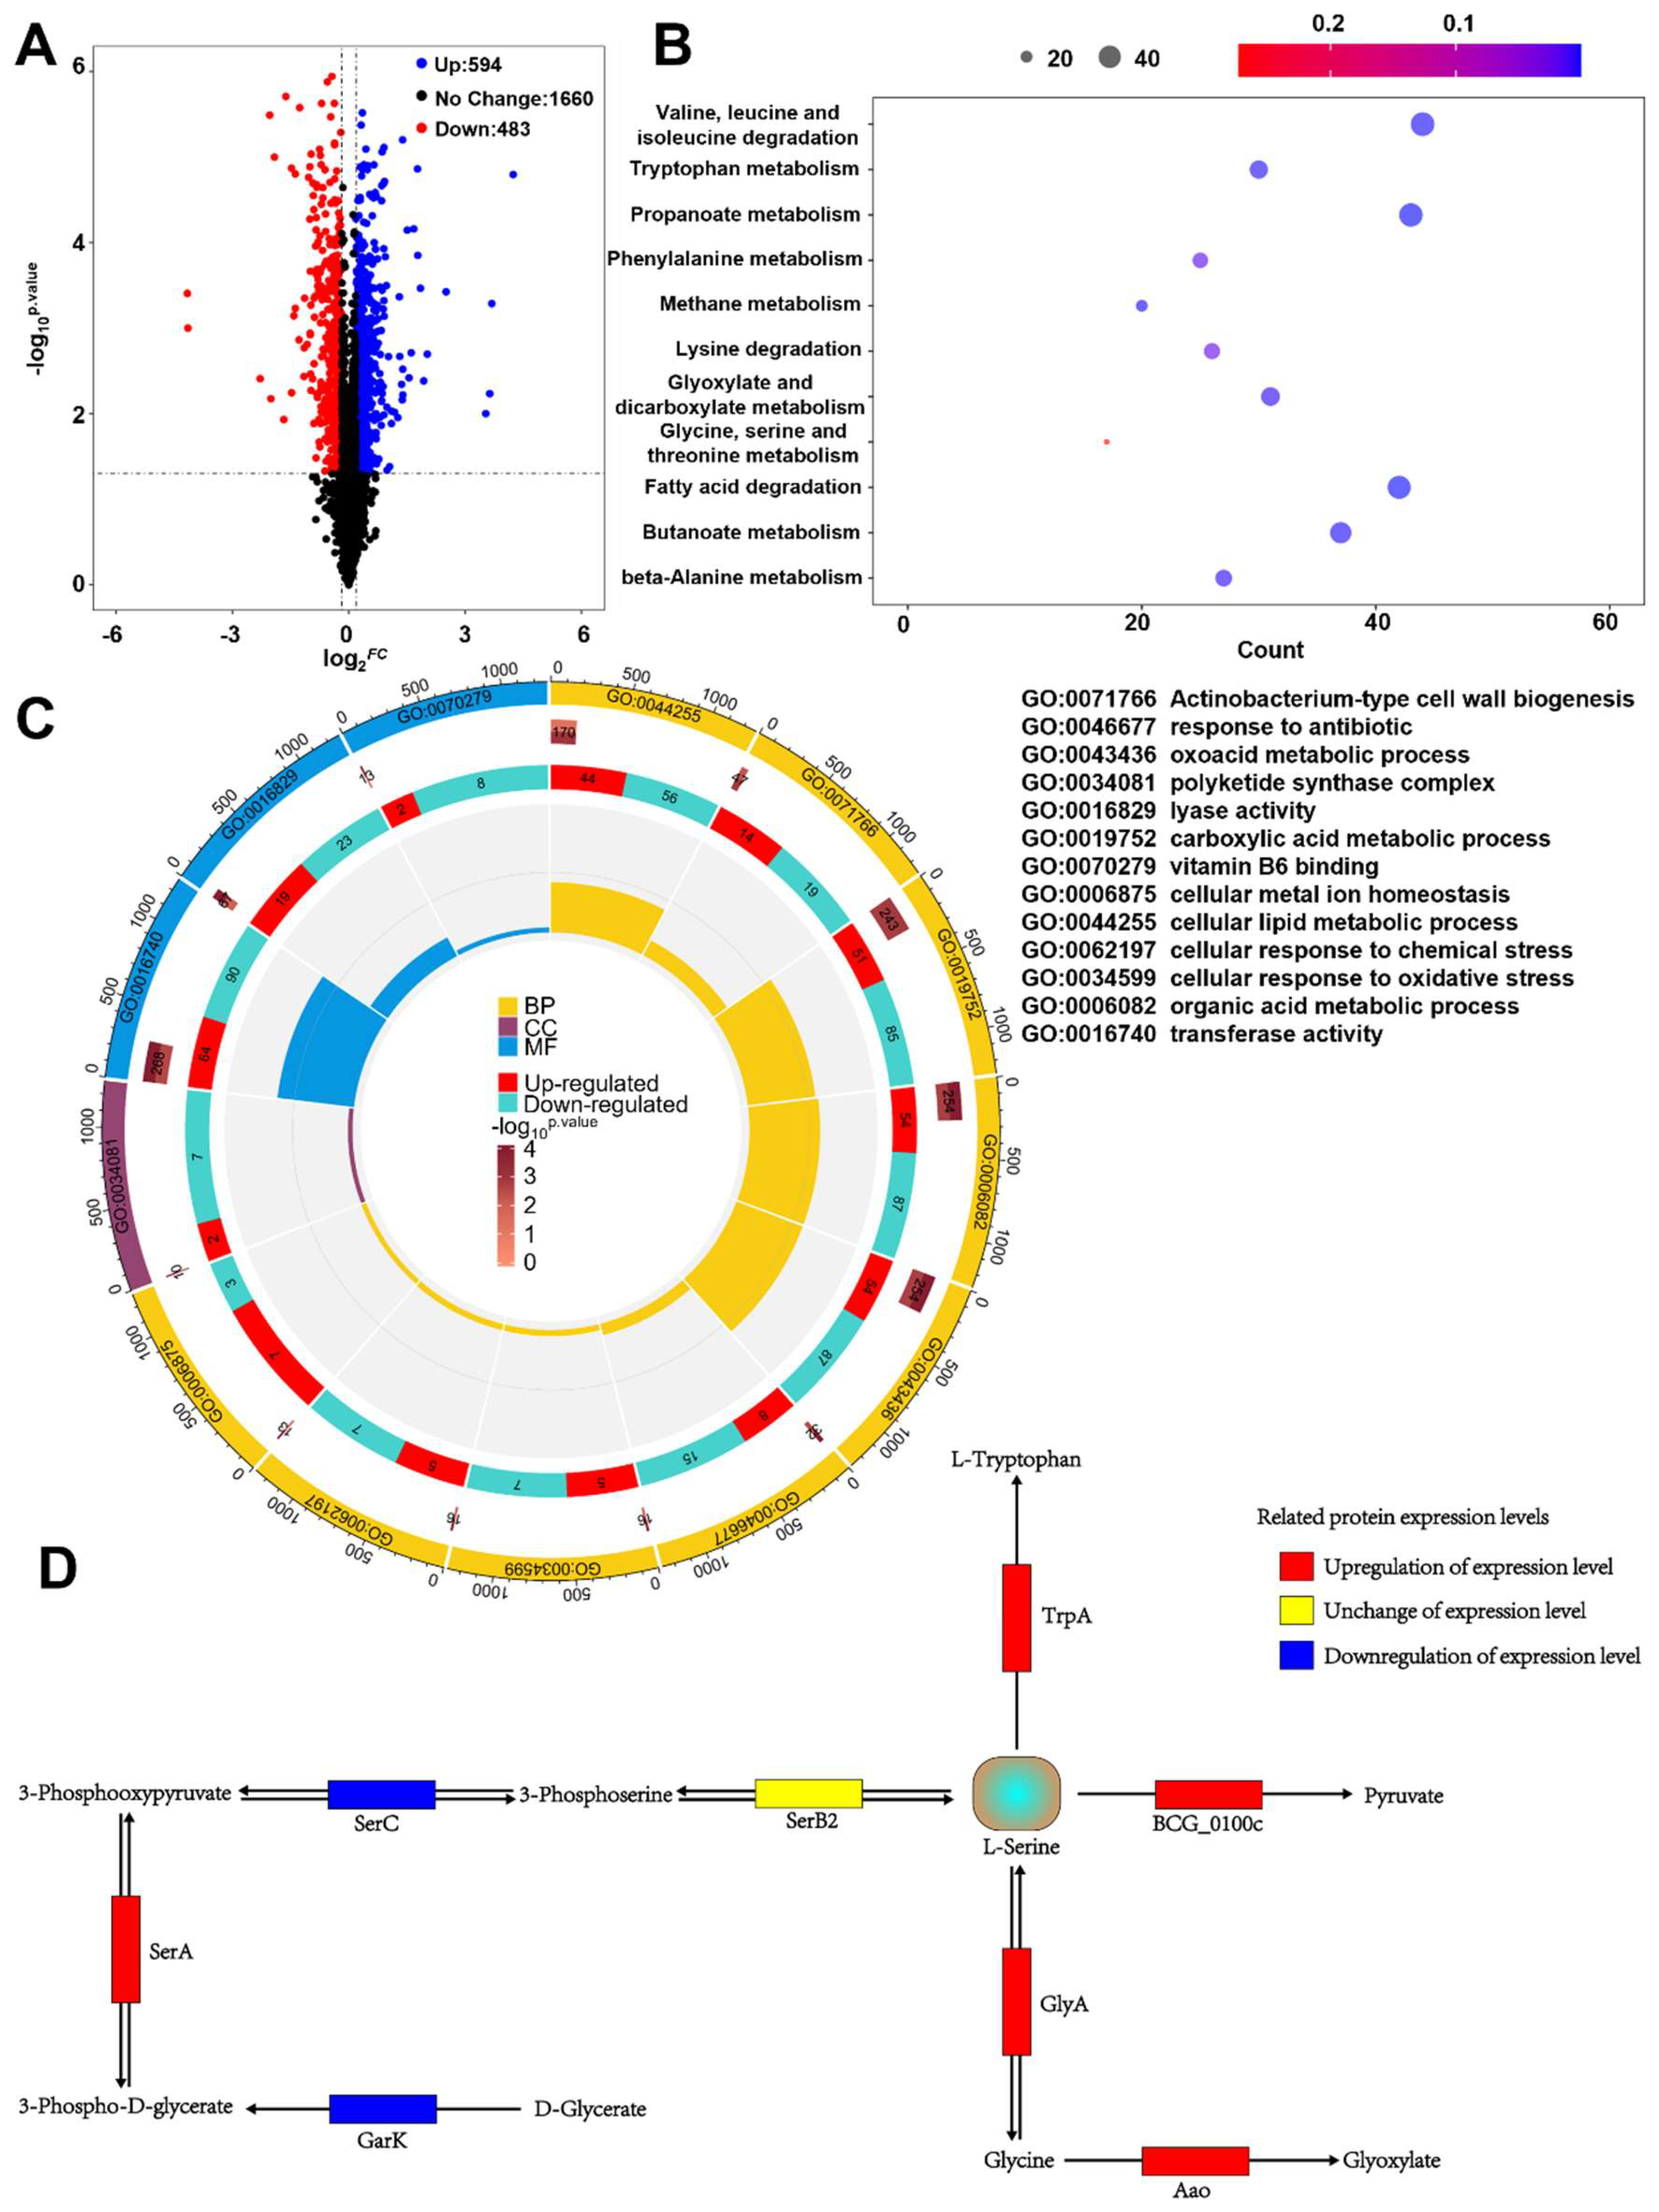
4.10. Proteomic Analysis

Activated BCG vaccine cultures were grown in 7H9 medium containing kanamycin until the OD600 reached 1.2. The cells were harvested, washed with PBS, and frozen in liquid nitrogen. Protein extraction, enzymatic digestion, and liquid chromatography–tandem mass spectrometry (LC-MS/MS) analysis were performed by Hangzhou Jingjie Biotechnology Co., Ltd. (Hangzhou, China). The bacterial pellets were then lysed in a buffer consisting of 8 M urea (Sigma-Aldrich, Saint Louis, MO, USA) and 1% protease (Merck Millipore, Billerica, MA, USA) inhibitor cocktail using a high-intensity ultrasonic processor (Scientz, Ningbo, China), followed by centrifugation to remove cell debris. Next, the proteins were reduced with 5 mM dithiothreitol (DTT) (Sigma-Aldrich, Saint Louis, MO, USA) at 56 °C for 30 min, then alkylated with 11 mM iodoacetamide (Sigma-Aldrich, Saint Louis, MO, USA) in the dark at room temperature for 15 min. The protein sample was diluted with 100 mM TEAB (Sigma-Aldrich, Saint Louis, MO, USA) until the urea concentration was below 2 M. Finally, trypsin (Promega, Madison, WI, USA) digestion was performed overnight at a trypsin-to-protein mass ratio of 1:50, followed by a second digestion for 4 h at 1:100. The resulting peptides were desalted using a C18 SPE column (ThermoFisher Scientific, Waltham, MA, USA).
After being dissolved in Liquid Phase A (0.1% formic acid (Sigma-Aldrich, Saint Louis, MO, USA), 2% acetonitrile (Thermo Fisher Scientific, Waltham, MA, USA), 98% deionized water), the peptides were separated on a NanoElute ultra-high-performance liquid chromatography (UHPLC) system (Bruker Corporation, Billerica, MA, USA). Mobile Phase A was 0.1% formic acid, 2% acetonitrile, and 98% deionized water; Mobile Phase B was 0.1% formic acid in 100% acetonitrile. The gradient was set as follows: 0–40 min, 6–24% B; 40–52 min, 24–35% B; 52–56 min, 35–80% B; 56–60 min, 80% B, at a flow rate of 450 nL/min. The separated peptides were then introduced into a capillary ion source for electrospray ionization and analyzed using a timsTOF Pro 2 mass spectrometer (Bruker Corporation, Billerica, MA, USA). The ion source voltage was set at 1.65 kV, and both the precursor ions and their corresponding fragments were detected at high resolution by the TOF analyzer. The MS/MS scan range was 100–1700 m/z. Data were acquired in parallel accumulation–serial fragmentation (PASEF) mode: after each full MS scan, 10 PASEF MS/MS scans were triggered for precursor ions with charges ranging from 0 to 5. The dynamic exclusion time was set to 30 s to avoid repeated scans of the same precursor ions.
The raw mass spectrometry data were imported into a database search engine, with the relevant analytical parameters set according to the experimental design. In this experiment, the MS2 data were processed using MaxQuant (v1.6.15.0) against the Blast_Mycobacterium_bovis_strain_BCG_410289_PR_20220526.fasta database. A reverse database was added to calculate the false discovery rate (FDR) caused by random matches, and a common contaminant database was included to eliminate the influence of contamination. The enzyme specificity was set to Trypsin/P, with up to two missed cleavage sites allowed. The minimum peptide length was set to seven amino acid residues, and a maximum of five modifications per peptide was allowed. The mass tolerances for both the first (First search) and main (Main search) searches were 20 ppm, and the MS/MS tolerance was also 20 ppm. Carbamidomethylation of cysteine (C) was set as a fixed modification, while methionine oxidation and protein N-terminal acetylation were set as variable modifications. The FDR for both protein and PSM identifications was set to 1%.
GO and KEGG enrichment analyses of the proteomic data were performed using the R language (v4.2.2) package “clusterProfiler” (v4.6.2). Volcano plots and KEGG enrichment diagrams were generated using the R package “ggplot2” (v3.5.0), while GO enrichment results were visualized with “circlize” (v0.4.16), and heatmaps were plotted using “pheatmap” (v1.0.12). Protein–protein interaction analyses were conducted via the STRING database, and protein interaction networks were visualized with the R package “igraph” (v1.4.1).

4.11. Statistical Analysis

All data are presented as the mean ± S.E.M. and represent results from at least three independent experiments. Two-tailed Student’s t-tests with equal variance assumptions were performed using Microsoft Excel (v2408, Build 16.0.17932.20252), and p-value < 0.05 was considered statistically significant.

Supplementary Materials

The following supporting information can be downloaded at: https://www.mdpi.com/article/10.3390/ijms26052181/s1.

Author Contributions

Conceptualization, W.L. and M.G.; methodology, M.G. and X.L.; data collection and interpretation, M.G., X.L, L.H., Y.G. and Z.L.; writing—original draft preparation, M.G. and X.L.; writing—review and editing, M.G. and W.L.; funding acquisition, W.L.; supervision, W.L. All authors have read and agreed to the published version of the manuscript.

Funding

This work was supported by the National Key R&D Program of China 2020YFA0907200, Guangxi Science Fund for Distinguished Young Scholars (2022JJG130005), and Ba-Gui Youth Talent Support Program of Guangxi (GXR-1BGQ2424009), National Natural Science Foundation of China Grants 32470034 and 32360013.

Institutional Review Board Statement

Not applicable.

Informed Consent Statement

Not applicable.

Data Availability Statement

The original contributions presented in this study are included in the article. Further inquiries can be directed to the corresponding author. The proteomics data of the BCG vaccine have been deposited in the Proteomics Identification Database (ID: PXD059682).

Conflicts of Interest

The authors declare no conflicts of interest.

References

  1. World Health Organization. Global Tuberculosis Report 2024; World Health Organization: Geneva, Switzerland, 2024; Available online: https://www.who.int/publications/i/item/9789240101531 (accessed on 2 January 2025).
  2. Kumar, P. A perspective on the success and failure of BCG. Front. Immunol. 2021, 12, 778028. [Google Scholar] [CrossRef]
  3. BoseDasgupta, S.; Pieters, J. Macrophage-microbe interaction: Lessons learned from the pathogen Mycobacterium tuberculosis. Semin. Immunopathol. 2018, 40, 577–591. [Google Scholar] [CrossRef] [PubMed]
  4. Philips, J.A.; Ernst, J.D. Tuberculosis pathogenesis and immunity. Annu. Rev. Pathol. Mech. Dis. 2012, 7, 353–384. [Google Scholar] [CrossRef] [PubMed]
  5. Flentie, K.; Garner, A.L.; Stallings, C.L. Mycobacterium tuberculosis transcription machinery: Ready to respond to host attacks. J. Bacteriol. 2016, 198, 1360–1373. [Google Scholar] [CrossRef]
  6. Browning, D.F.; Busby, S.J.W. Local and global regulation of transcription initiation in bacteria. Nat. Rev. Microbiol. 2016, 14, 638–650. [Google Scholar] [CrossRef] [PubMed]
  7. Santoshi, M.; Tare, P.; Nagaraja, V. Nucleoid-associated proteins of mycobacteria come with a distinctive flavor. Mol. Microbiol. 2024. [Google Scholar] [CrossRef] [PubMed]
  8. Li, W.; Hu, L.; Xie, Z.; Xu, H.; Li, M.; Cui, T.; He, Z.G. Cyclic di-GMP integrates functionally divergent transcription factors into a regulation pathway for antioxidant defense. Nucleic Acids Res. 2018, 46, 7270–7283. [Google Scholar] [CrossRef] [PubMed]
  9. Burian, J.; Ramon-Garcia, S.; Howes, C.G.; Thompson, C.J. WhiB7, a transcriptional activator that coordinates physiology with intrinsic drug resistance in Mycobacterium tuberculosis. Expert Rev. Anti-Infect. Ther. 2012, 10, 1037–1047. [Google Scholar] [CrossRef] [PubMed]
  10. O’Toole, G.; Kaplan, H.B.; Kolter, R. Biofilm formation as microbial development. Annu. Rev. Microbiol. 2000, 54, 49–79. [Google Scholar] [CrossRef] [PubMed]
  11. Flemming, H.C.; Wingender, J. The biofilm matrix. Nat. Rev. Microbiol. 2010, 8, 623–633. [Google Scholar] [CrossRef]
  12. Sambandan, D.; Dao, D.N.; Weinrick, B.C.; Vilchèze, C.; Gurcha, S.S.; Ojha, A.; Kremer, L.; Besra, G.S.; Hatfull, G.F.; Jacobs, W.R., Jr. Keto-mycolic acid-dependent pellicle formation confers tolerance to drug-sensitive Mycobacterium tuberculosis. MBio 2013, 4, e00222-13. [Google Scholar] [CrossRef] [PubMed]
  13. Chakraborty, P.; Bajeli, S.; Kaushal, D.; Radotra, B.D.; Kumar, A. Biofilm formation in the lung contributes to virulence and drug tolerance of Mycobacterium tuberculosis. Nat. Commun. 2021, 12, 1606. [Google Scholar] [CrossRef] [PubMed]
  14. Ling, X.; Liu, X.; Wang, K.; Guo, M.; Ou, Y.; Li, D.; Xiang, Y.; Zheng, J.; Hu, L.; Zhang, H.; et al. Lsr2 acts as a cyclic di-GMP receptor that promotes keto-mycolic acid synthesis and biofilm formation in mycobacteria. Nat. Commun. 2024, 15, 695. [Google Scholar] [CrossRef]
  15. Geeraerts, S.L.; Heylen, E.; De Keersmaecker, K.; Kampen, K.R. The ins and outs of serine and glycine metabolism in cancer. Nat. Metab. 2021, 3, 131–141. [Google Scholar] [CrossRef] [PubMed]
  16. Keshari, D.; Singh, K.S.; Sharma, R.; Yadav, S.; Singh, S.K. MSMEG_5684 down-regulation in Mycobacterium smegmatis affects its permeability, survival under stress and persistence. Tuberculosis 2017, 103, 61–70. [Google Scholar] [CrossRef] [PubMed]
  17. Qi, L.S.; Larson, M.H.; Gilbert, L.A.; Doudna, J.A.; Weissman, J.S.; Arkin, A.P.; Lim, W.A. Repurposing CRISPR as an RNA-guided platform for sequence-specific control of gene expression. Cell 2013, 152, 1173–1183. [Google Scholar] [CrossRef]
  18. Ha, D.G.; O’Toole, G.A. c-di-GMP and its effects on biofilm formation and dispersion: A Pseudomonas aeruginosa review. Microbiol. Spectr. 2015, 3, 301–317. [Google Scholar] [CrossRef] [PubMed]
  19. Nandakumar, M.; Nathan, C.; Rhee, K.Y. Isocitrate lyase mediates broad antibiotic tolerance in Mycobacterium tuberculosis. Nat. Commun. 2014, 5, 4306. [Google Scholar] [CrossRef]
  20. Ando, H.; Kitao, T.; Miyoshi-Akiyama, T.; Kato, S.; Mori, T.; Kirikae, T. Downregulation of katG expression is associated with isoniazid resistance in Mycobacterium tuberculosis. Mol. Microbiol. 2011, 79, 1615–1628. [Google Scholar] [CrossRef] [PubMed]
  21. Kurthkoti, K.; Tare, P.; Paitchowdhury, R.; Gowthami, V.N.; Garcia, M.J.; Colangeli, R.; Chatterji, D.; Nagaraja, V.; Rodriguez, G.M. The mycobacterial iron-dependent regulator IdeR induces ferritin (bfrB) by alleviating Lsr2 repression. Mol. Microbiol. 2015, 98, 864–877. [Google Scholar] [CrossRef] [PubMed]
  22. Holeček, M. Serine metabolism in health and disease and as a conditionally essential amino acid. Nutrients 2022, 14, 1987. [Google Scholar] [CrossRef] [PubMed]
  23. Lane, A.N.; Kirschner, K. The Mechanism of Binding of L-Serine to Tryptophan Synthase from Escherichia coli. Eur. J. Biochem. 1983, 129, 561–570. [Google Scholar] [CrossRef] [PubMed]
  24. Xu, G.; Zhu, Q.; Luo, Y.; Zhang, X.; Guo, W.; Dou, W.; Li, H.; Xu, H.; Zhang, X.; Xu, Z. Enhanced production of l-serine by deleting sdaA combined with modifying and overexpressing serA in a mutant of Corynebacterium glutamicum SYPS-062 from sucrose. Biochem. Eng. J. 2015, 103, 60–67. [Google Scholar] [CrossRef]
  25. Amelio, I.; Cutruzzolá, F.; Antonov, A.; Zhang, X.; Guo, W.; Dou, W.; Li, H.; Xu, H.; Zhang, X.; Xu, Z. Serine and glycine metabolism in cancer. Trends Biochem. Sci. 2014, 39, 191–198. [Google Scholar] [CrossRef]
  26. Danpure, C.J. Variable peroxisomal and mitochondrial targeting of alanine: Glyoxylate aminotransferase in mammalian evolution and disease. Bioessays 1997, 19, 317–326. [Google Scholar] [CrossRef] [PubMed]
  27. Sauer, K.; Stoodley, P.; Goeres, D.M.; Hall-Stoodley, L.; Burmølle, M.; Stewart, P.S.; Bjarnsholt, T. The biofilm life cycle: Expanding the conceptual model of biofilm formation. Nat. Rev. Microbiol. 2022, 20, 608–620. [Google Scholar] [CrossRef] [PubMed]
  28. Ma, L.; Conover, M.; Lu, H.; Parsek, M.R.; Bayles, K.; Wozniak, D.J. Assembly and development of the Pseudomonas aeruginosa biofilm matrix. PLoS Pathog. 2009, 5, e1000354. [Google Scholar] [CrossRef]
  29. Yu, W.; Wang, Z.; Zhang, K.; Chi, Z.; Xu, T.; Jiang, D.; Chen, S.; Li, W.; Yang, X.; Zhang, X.; et al. One-carbon metabolism supports S-adenosylmethionine and histone methylation to drive inflammatory macrophages. Mol. Cell 2019, 75, 1147–1160. [Google Scholar] [CrossRef]
  30. Mayer-Barber, K.D.; Barber, D.L.; Shenderov, K.; White, S.D.; Wilson, M.S.; Cheever, A.; Kugler, D.; Hieny, S.; Caspar, P.; Núñez, G.; et al. Cutting edge: Caspase-1 independent IL-1β production is critical for host resistance to Mycobacterium tuberculosis and does not require TLR signaling in vivo. J. Immunol. 2010, 184, 3326–3330. [Google Scholar] [CrossRef]
  31. Silvério, D.; Gonçalves, R.; Appelberg, R.; Saraiva, M. Advances on the Role and Applications of Interleukin-1 in Tuberculosis. mBio 2021, 12, e03134-21. [Google Scholar] [CrossRef] [PubMed]
  32. Master, S.S.; Rampini, S.K.; Davis, A.S.; Keller, C.; Ehlers, S.; Springer, B.; Timmins, G.S.; Sander, P.; Deretic, V. Mycobacterium tuberculosis prevents inflammasome activation. Cell Host Microbe 2008, 3, 224–232. [Google Scholar] [CrossRef]
  33. Coulibaly, F.; Lassalle, E.; Baker, H.M.; Baker, E.N. Structure of phosphoserine aminotransferase from Mycobacterium tuberculosis. Acta Crystallogr. Sect. D Biol. Crystallogr. 2012, 68, 553–563. [Google Scholar] [CrossRef]
  34. Haufroid, M.; Wouters, J. Targeting the serine pathway: A promising approach against tuberculosis? Pharmaceuticals 2019, 12, 66. [Google Scholar] [CrossRef]
Figure 1. Effects of serCMsm repression on the physiological phenotypes of M. smegmatis. (A) Spot colony morphology of the Msm/WT strain and the serCMsm KD strain in the presence of anhydrotetracycline. (B) The biofilm formation at the air–liquid surface of the Msm/WT strain and the serCMsm KD strain in the presence of anhydrotetracycline.
Ijms 26 02181 g001
Figure 2. NapRMsm activates serCMsm to positively regulate biofilm formation in M. smegmatis. (A) EMSA assays for the serCMsm promoter DNA-binding activity of NapRMsm. serCMsmp was co-incubated with increasing amounts of NapRMsm. (B) RT-qPCR analysis for mRNA levels of serCMsm in Msm/WT and napRMsm KO strains. sigAMsm was used as a reference control. (C) Spot colony morphology and biofilm formation at the air–liquid surface of the Msm/WT strain and the napRMsm KO strain. (D) Spot colony morphology of the Msm/WT strain, napRMsm KO strain, serCMsm KD strain, and the napRMsm KO/serCMsm KD strain under anhydrotetracycline induction. (E) The biofilm formation at the air–liquid surface of the Msm/WT strain, napRMsm KO strain, serCMsm KD strain, and the napRMsm KO/serCMsm KD strain under anhydrotetracycline induction. (F) Quantitation of biofilm biomass by crystal violet staining. ns p ≥ 0.05, * p < 0.05, *** p < 0.001.
Ijms 26 02181 g002
Figure 3. NapRMsm activates serCMsm to positively regulate the growth of M. smegmatis on solid media. (A) Quantification of colony counts of M. smegmatis on 7H10 solid medium. (B) Representative images of M. smegmatis colonies on 7H10 solid medium. Equal amounts of the Msm/WT, serCMsm KD, napRMsm KO and napRMsm KO/serCMsm KD strains were plated on 7H10 solid medium supplemented with 0 mM or 5 mM serine, and colony counts were recorded after 4 days. ns p ≥ 0.05, * p < 0.05, ** p < 0.01.
Ijms 26 02181 g003
Figure 4. NapRBCG represses serCBCG to negatively regulate biofilm formation in the BCG vaccine strain. (A) EMSA assays for the serCBCG promoter DNA-binding activity of NapRBCG. serCBCGp was co-incubated with increasing amounts of NapRBCG. (B) RT-qPCR analysis for the expression of levels of serCBCG in BCG/WT and napRBCG KO strains. sigABCG was used as a reference control. (C) Spot colony morphology of BCG/WT and napRBCG KO strains. (D) Spot colony morphology of BCG/WT and serCBCG KD strains under anhydrotetracycline induction. (E) Spot colony morphology of the BCG/WT, napRBCG KO, serCBCG KD, and napRBCG KO/serCBCG KD strains under anhydrotetracycline induction. ns p ≥ 0.05, **** p < 0.0001.
Ijms 26 02181 g004
Figure 5. NapRBCG represses the expression of serCBCG to alleviate growth inhibition caused by high serine concentrations in BCG vaccine. (A) Growth curves of BCG/WT and serCBCG KD strains under the condition of 0 mM or 5 mM serine. (B) Growth curves of BCG/WT and napRBCG OE strains under the condition of 0 mM, 5 mM, or 10 mM serine.
Ijms 26 02181 g005
Figure 6. Proteomic analysis for the targets of napRBCG. (A) Volcano plot of the proteomic data. (B) KEGG enrichment analysis of the proteomic data. (C) GO enrichment analysis of the proteomic data. (D) Four metabolic pathways involved in the reduction of intracellular serine concentrations in the napRBCG OE strain.
Ijms 26 02181 g006
Figure 7. Schematic summary of the major findings of this study. NapR can act as either a transcriptional activator or repressor depending on the serC promoter variant, leading to distinct regulatory outcomes in pathogenic versus nonpathogenic mycobacterial strains.
Ijms 26 02181 g007
Disclaimer/Publisher’s Note: The statements, opinions and data contained in all publications are solely those of the individual author(s) and contributor(s) and not of MDPI and/or the editor(s). MDPI and/or the editor(s) disclaim responsibility for any injury to people or property resulting from any ideas, methods, instructions or products referred to in the content.

