2. Results and Discussion
This section delivers a detailed analysis of MLCs in
Section 3.3.
The very first unexpected outcome that we observe is that the two multiplicative Zagreb connection descriptors, i.e.,
, showcase a considerably poor performance as the MLC for both
is <
, which in structure–property studies is considered very poor. Thus, the study by Javaid et al. [
41], who proposed the two multiplicative Zagreb connection invariants, has no meaningful applicative potential from a structure–property studies perspective. We discourage authors from further investigating these two descriptors. Furthermore, the MLC value for the 2nd Zagreb connection invariant
is <
, which from the perspective of mathematical investigation is feasible; however, it does not find popularity among researchers.
Notably, the performance of the 1st Zagreb connection invariant with MLC seems reasonable.
Secondly, among the newly proposed connection-based invariants, we observe that the Randić and the general Randić connection descriptors with are less-efficient. However, the general Randić connection descriptor delivers a reasonable performance with . The only other newly proposed connection invariant is the augmented Zagreb connection invariant, i.e., with MLC . Apart from these connection invariants that deliver poor performance, all other newly proposed connection invariants showcase significantly improved efficiency. For instance, the general sum-connectivity connection index with records the strongest MLC of and this connection index is among the newly proposed graphical connection-dependent invariants.
The strong potential of the newly proposed connection invariants, such as
, motivates us to look for other potential connection invariants. Our experiment shows that the general sum-connectivity
connection index with
, the sum-connectivity connection descriptor
, the atom-bond-connectivity
connection index, the geometric-arithmetic
connection invariant, and the arithmetic–geometric
connection index are among the top five connection-based graphical invariants for estimating the physicochemical characteristics of BHs. It is noteworthy to observe that all of these five best connection descriptors are the newly proposed connection-based invariants, which ultimately justify considering introducing new connection graphical invariants.
Table 1 depicts the list of the five best connection-related graphical invariants.
Next, we conduct a detailed statistical analysis of the five best connection-related graphical invariants. First, we put forward appropriate data-fitting multiple linear regression (MLR) models between the PCPs
and
and the five best connection-related graphical invariants.
Table 2 delivers the most appropriate data-fitting MLRs with 95% confidence intervals for the intercept and the two
X-variables. Moreover,
Table 2 computes the standard error of estimation and the determination coefficient for the top five connection-related graphical invariants.
We performed the leave-one-out cross validation (LOOCV) method on the data and generated LOOCV root mean squared errors
corresponding to the predictions in
Table 2. Next, we deliver these cross-validation results.
Table 3 reports
for the predictions by the top five connection indices in
Table 2. Note that
in
Table 3 are fairly close to
s values in
Table 2 which shows the efficiency of our predictive models.
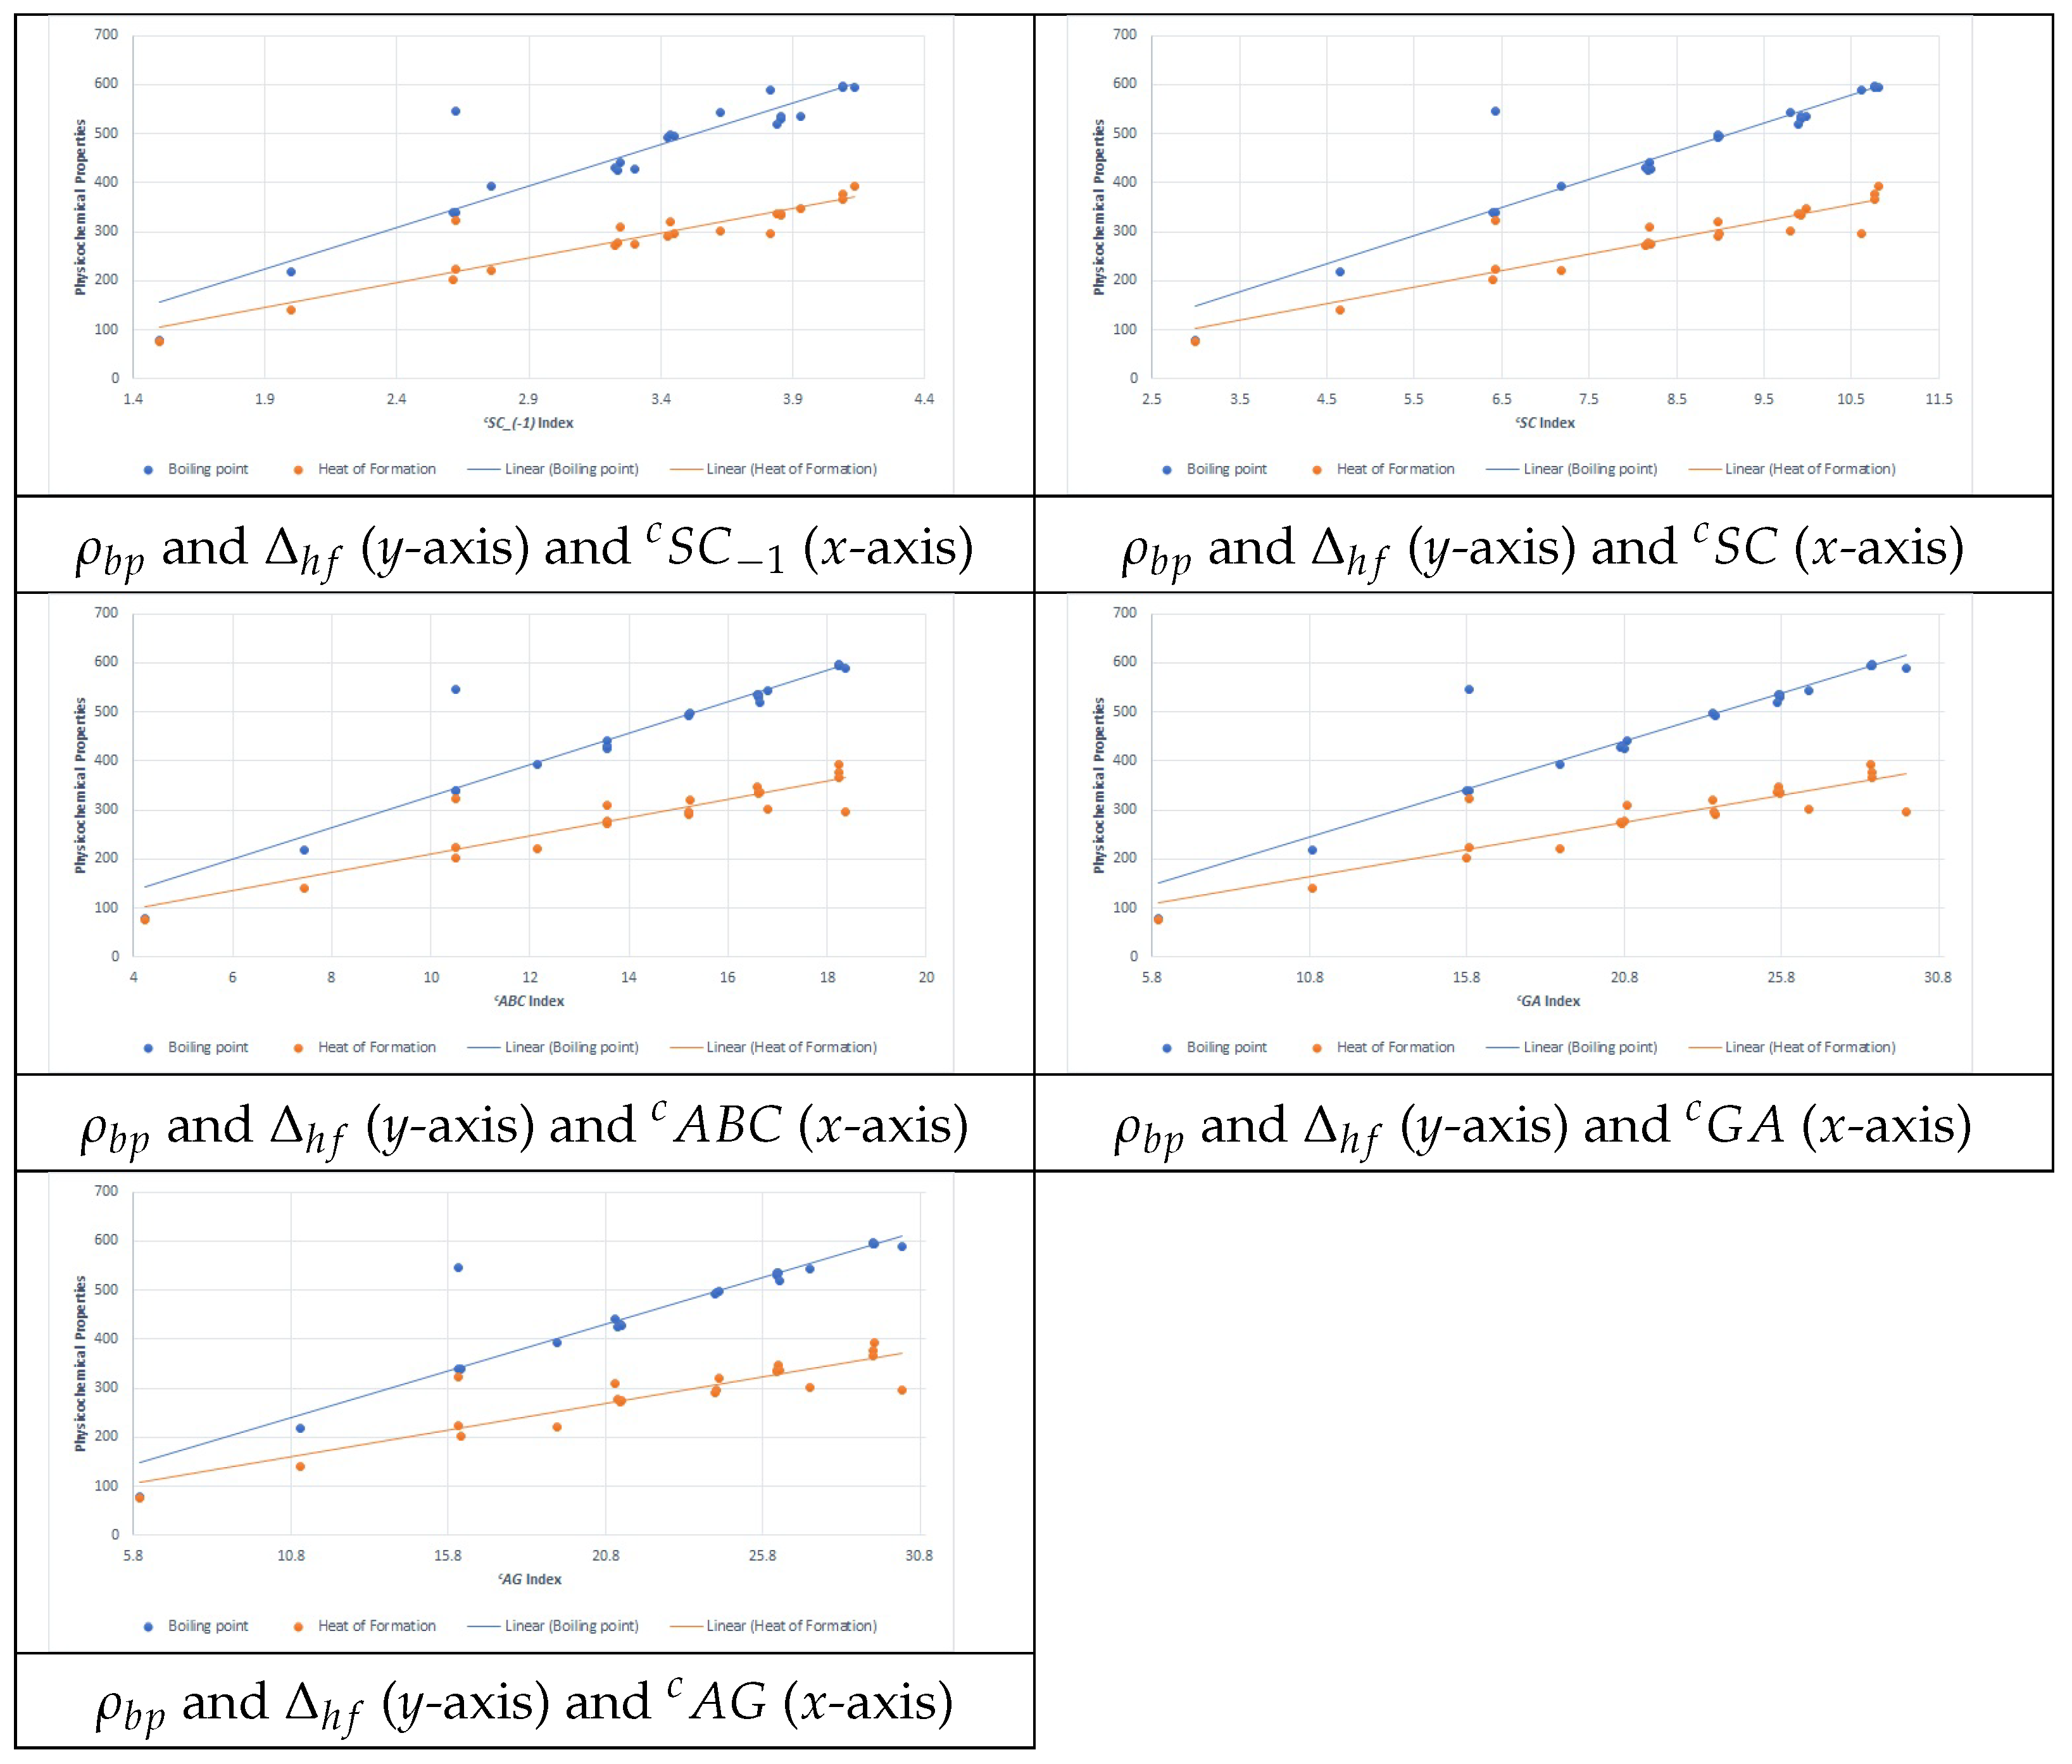
Figure 1 present the plots for scattering data between the PCPs
and
and the five best connection-related graphical invariants.
Note that the general sum-connectivity connection index () has been identified as the best predictor among the tested topological descriptors. This superior predictive power can be attributed to several key theoretical and structural factors:
Balanced Sensitivity to Molecular Connectivity
Unlike degree-based or distance-based indices, incorporates both local and global molecular connectivity by summing the inverse square roots of vertex connections. This ensures a smooth variation across different molecular structures, preventing excessive dependence on extreme values (as seen in multiplicative indices like and ).
Strong Correlation with van der Waals Interactions
The sum-connectivity framework aligns well with intramolecular interactions, particularly van der Waals forces and dispersion interactions. These weak but cumulative effects influence key physicochemical properties like boiling points and heat of formation, which were the primary test variables in our study.
achieved the highest multiple correlation coefficient () across all tested indices.
Regression analysis demonstrated that quadratic and cubic models using provided the best predictive accuracy, suggesting that its mathematical form aligns well with nonlinear structure–property relationships.
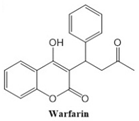
2.1. Structure–Property Modeling of Coumarin-Related Anti-Cancer Drugs
2.1.1. Coumarin-Related Compounds as Potential Anti-Cancer Drugs
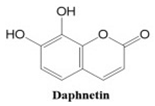
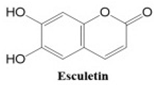
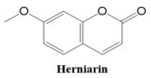
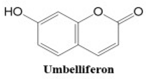
Coumarin-related compounds, derived from the benzopyrone family, have garnered significant attention in medicinal chemistry for their diverse biological activities [
29], particularly their anti-cancer properties. These compounds exhibit a range of pharmacological actions, including anti-proliferative, pro-apoptotic, and anti-angiogenic effects, which make them promising candidates for cancer therapy [
30]. The anti-cancer potential of coumarins is attributed to their ability to modulate various molecular targets, such as inhibiting tyrosine kinases, disrupting cell cycle progression, and inducing oxidative stress in cancer cells. Additionally, coumarins can act as chemosensitizers, enhancing the efficacy of conventional chemotherapy drugs and overcoming drug resistance in certain cancer types.
Coumarins also show potential for selective toxicity, targeting cancer cells while sparing healthy tissues. Their versatility allows for structural modifications, enabling the development of derivatives with enhanced potency and specificity against different cancer types [
30]. Examples include esculetin and umbelliferone, which exhibit notable anti-cancer activity through the inhibition of cell signaling pathways and the suppression of metastasis. Furthermore, coumarin derivatives have demonstrated synergistic effects when combined with other anti-cancer agents, highlighting their utility in combination therapy strategies. These compounds represent a promising area of research for developing novel and effective treatments for a wide range of malignancies.
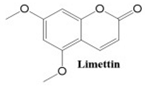
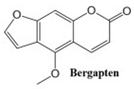
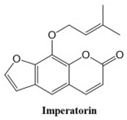
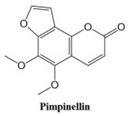
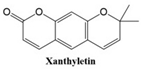
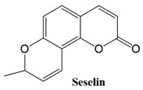
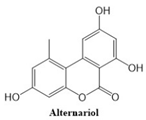
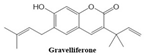
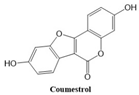
Coumarins exhibit a variety of structural types that contribute to their diverse biological activities [
26]. Simple coumarins, the most basic form, consist of a benzopyrone core and are widely found in nature. Furanocoumarins, characterized by a fused furan ring, are known for their photoreactive properties and are often studied for their anti-cancer and anti-inflammatory effects. Pyranocoumarins, with an additional pyran ring, exhibit enhanced lipophilicity and improved bioavailability [
28], making them suitable for pharmaceutical applications. Pyrone-substituted coumarins, in which the lactone moiety is modified, demonstrate unique biochemical interactions that broaden their therapeutic potential. These structural variations allow for extensive functional diversity, enabling tailored applications in the design of anti-cancer drugs.
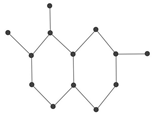
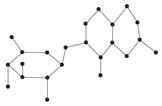
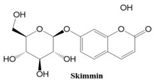
In this paper, we consider 25 contemporary anti-cancer drugs and conduct structure–property modeling of their physicochemical properties. These drugs and their transformed molecular graphs are delivered in
Table 4,
Table 5 and
Table 6. Moreover,
Table 4 shows simple coumarin-related compounds, whereas
Table 5 (resp.
Table 6) records furanocoumarins (resp. pyranocoumarins and pyrone-substituted coumarins) considered in this work. The data of these coumarin compounds were taken from Küpeli et al. [
42] who conducted a structure–property study on these compounds. For more on the chemistry of these compounds, we refer to [
43,
44].
For our structure–property predictive modeling, we consider a diverse range of physicochemical properties, including boiling point (BP) in °C at 760 mmHg, molar volume (MV) in m
3/mol, enthalpy of vaporization (E) in kJ/mol, density (D) in g/cm
3, surface tension (ST) cm
3, vapor pressure (VP) in mmHg at 25 °C, molar refractivity (MR) in A
2, index of refraction (IR) in cm
3, flash point (FP) in °C, polarizability (P) in dyne/cm, and polar surface area (PSA) cm
3. We retrieved the experimental data of these physicochemical properties from the open source
http://www.chemspider.com/ (accessed on 15 February 2025).
Table 7 delivers the experimental values of these properties for the selected 25 coumarin-related anti-cancer drugs.
2.1.2. Structure–Property Modeling of Physicochemical Properties
Now, we conduct a detailed correlation and regression analysis of the coumarin-related drugs from
Table 4,
Table 5 and
Table 6 with their physicochemical properties in
Table 7. We employ the top five connection-based topological descriptors from
Table 1 as our predictors.
With three types of regression models, linear, quadratic, and cubic, we evaluated the relationship between molecular descriptors and their hyper-counterparts with 11 essential physicochemical properties of anti-cancer drugs derived from coumarins. The objective of this study was to determine how well these descriptors could predict properties that are crucial to the effectiveness and stability of anti-cancer drugs. In order to evaluate the quality of each model, two key statistical parameters were used: the correlation coefficient (r), a measure of the strength and direction of linear relationships between variables, and the standard error of estimate (s), a measure of how accurate regression models are. As linear models evolved into cubic models, their complexity and accuracy increased.
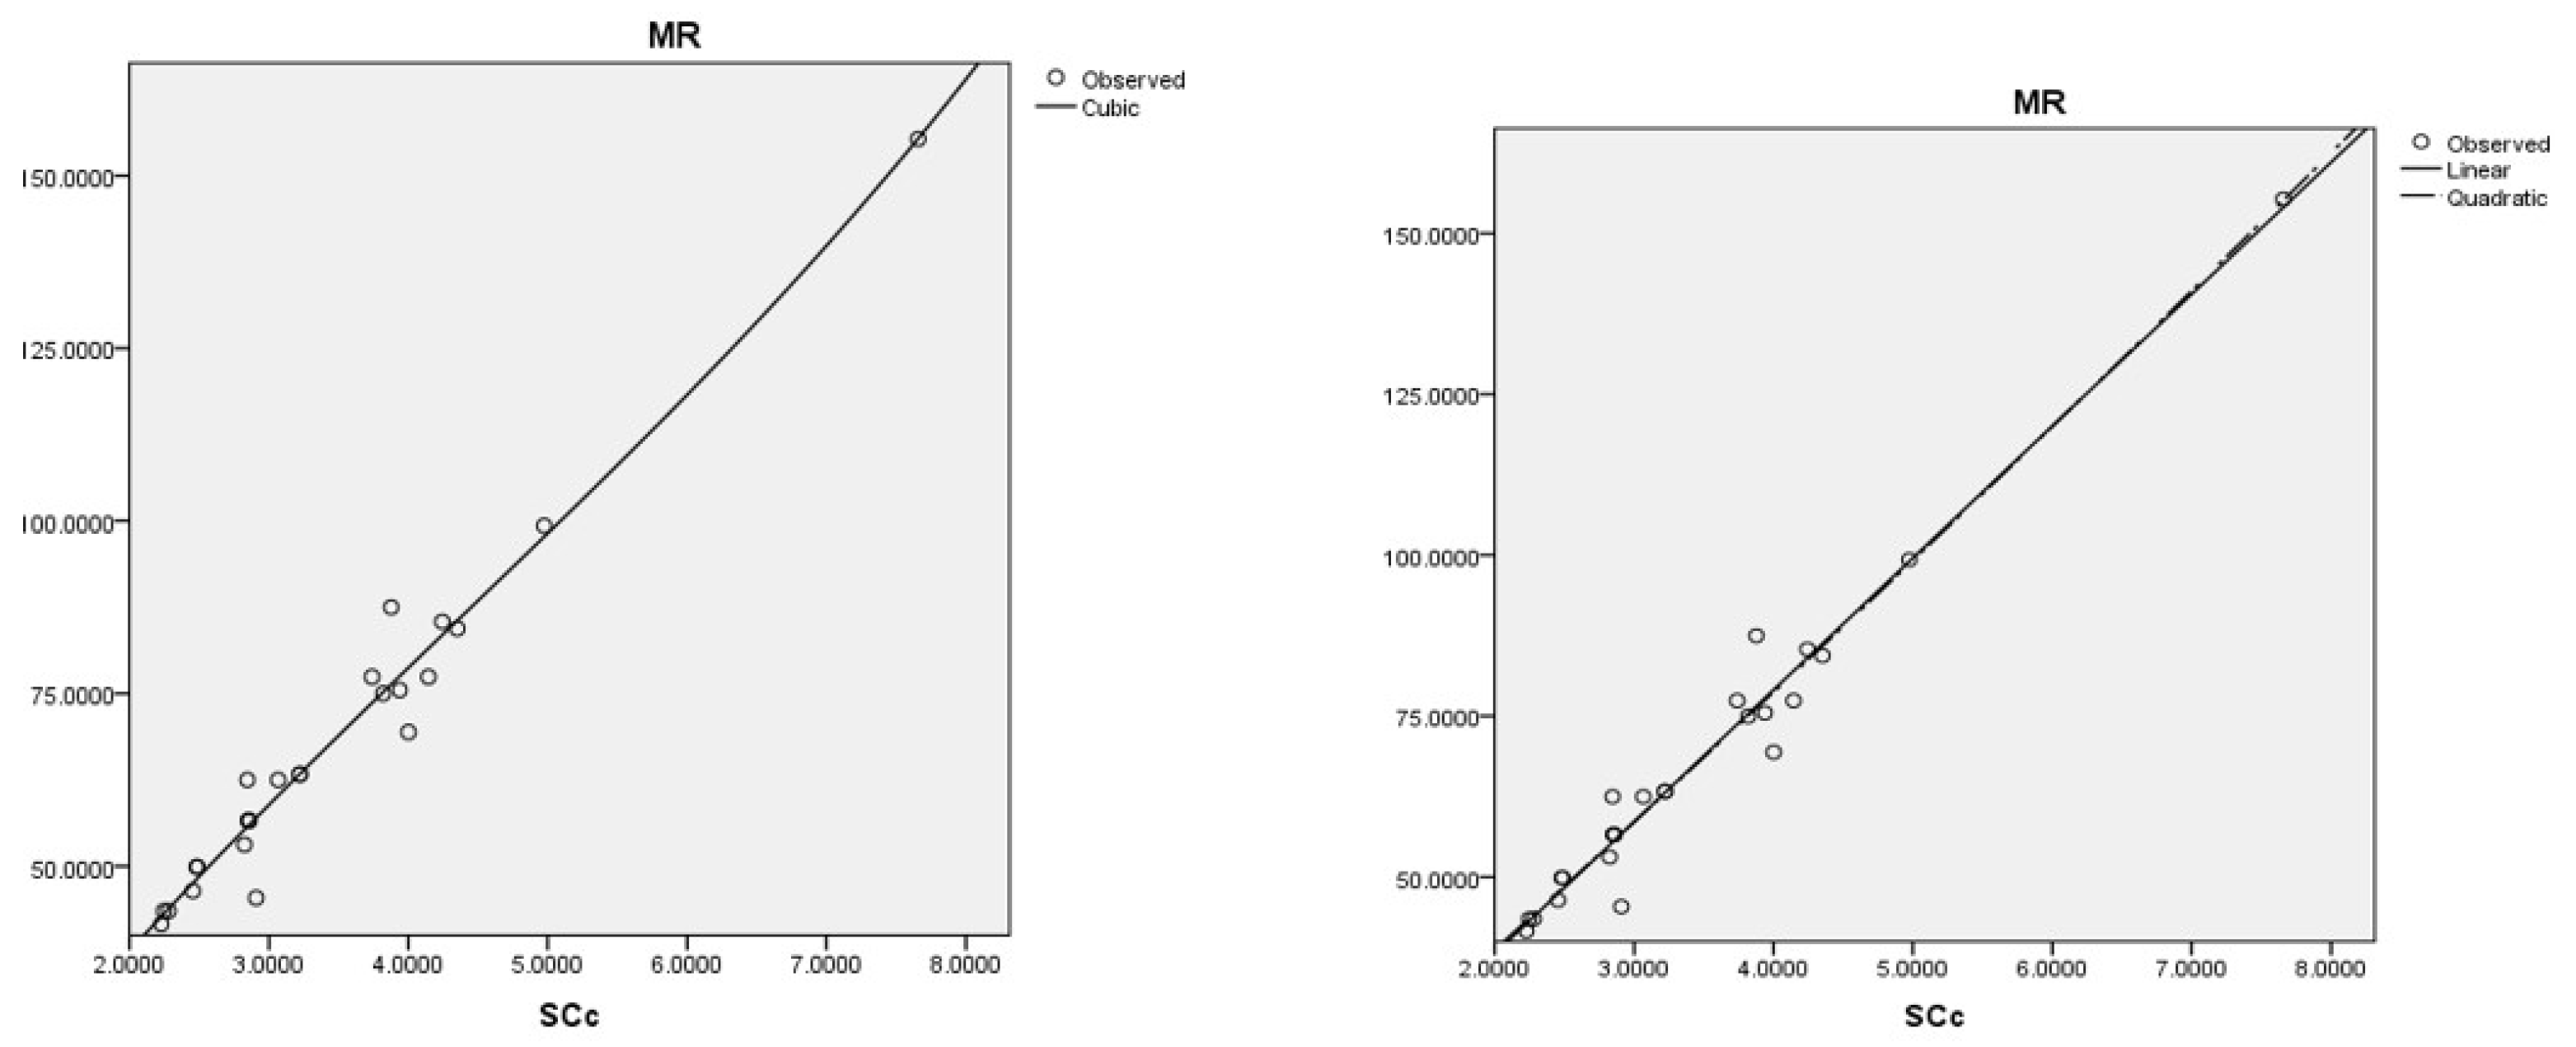
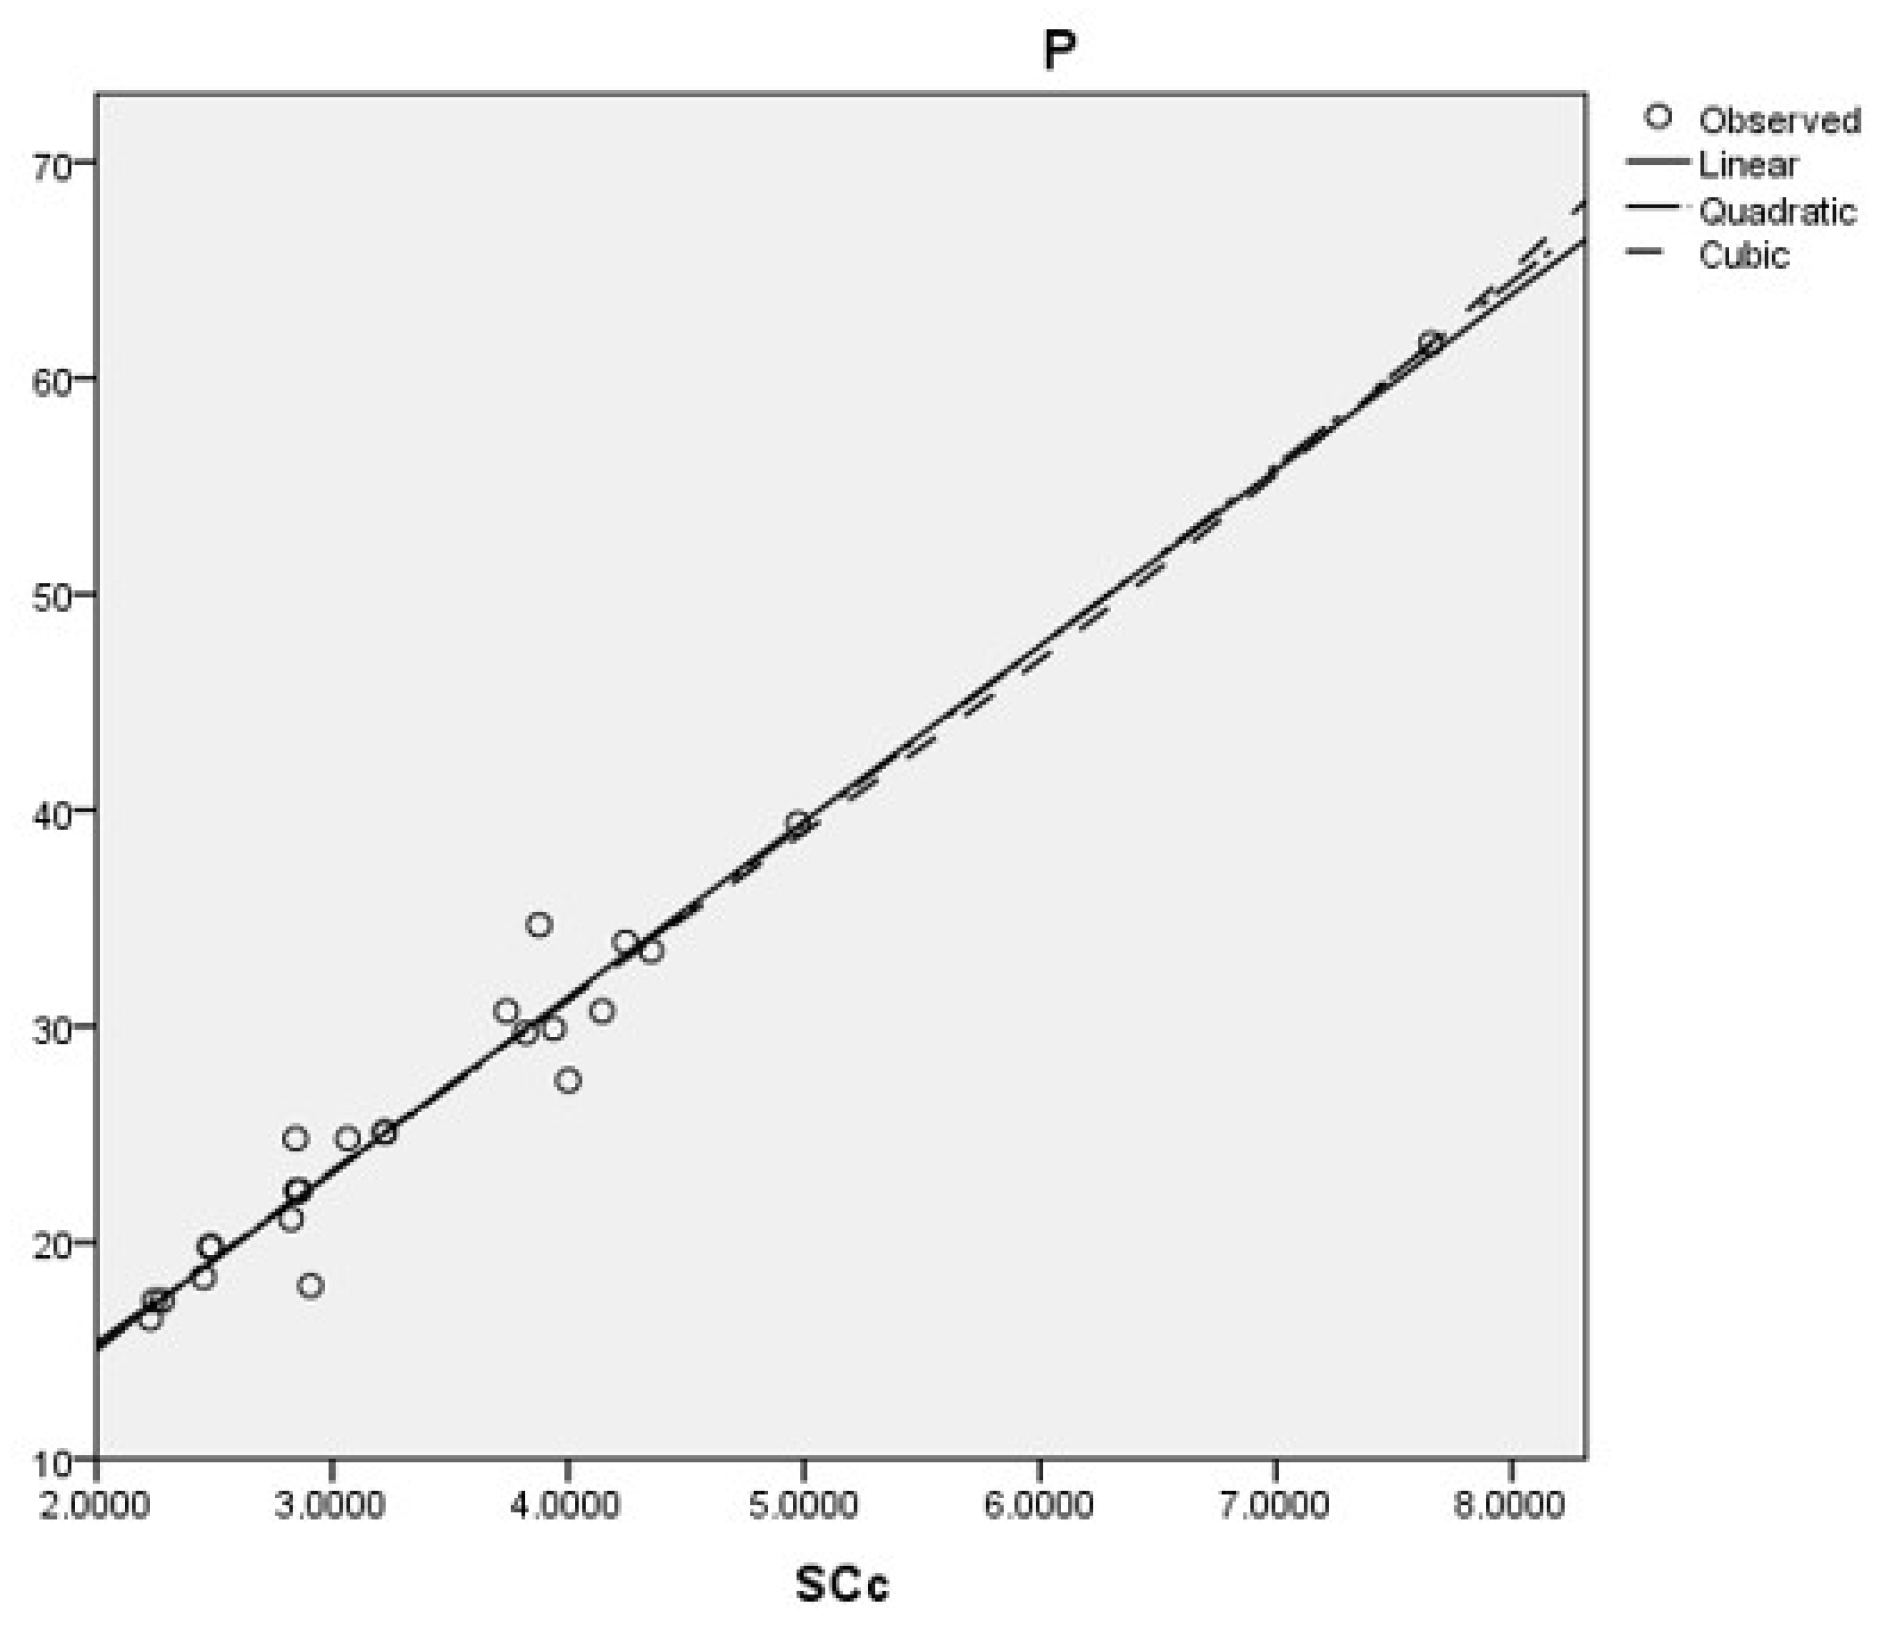
The linear regression model provided insight into the relationship between molecular descriptors and drug properties, with molar refractivity (MR) and polarizability (P) showing the highest correlation coefficients. According to
Table 8, these properties have a direct and significant linear relationship, suggesting their predictability through linear modeling.
Quadratic regression improves fitting compared to linear models for several properties, such as molar volume (MV) and polarizability (P). According to
Table 9, these improvements suggest that the physicochemical properties of these drugs change nonlinearly with changes in molecular descriptors. By including squared terms, the model can capture a wider range of dynamics and variances in data that are not captured by linear models.
As shown in
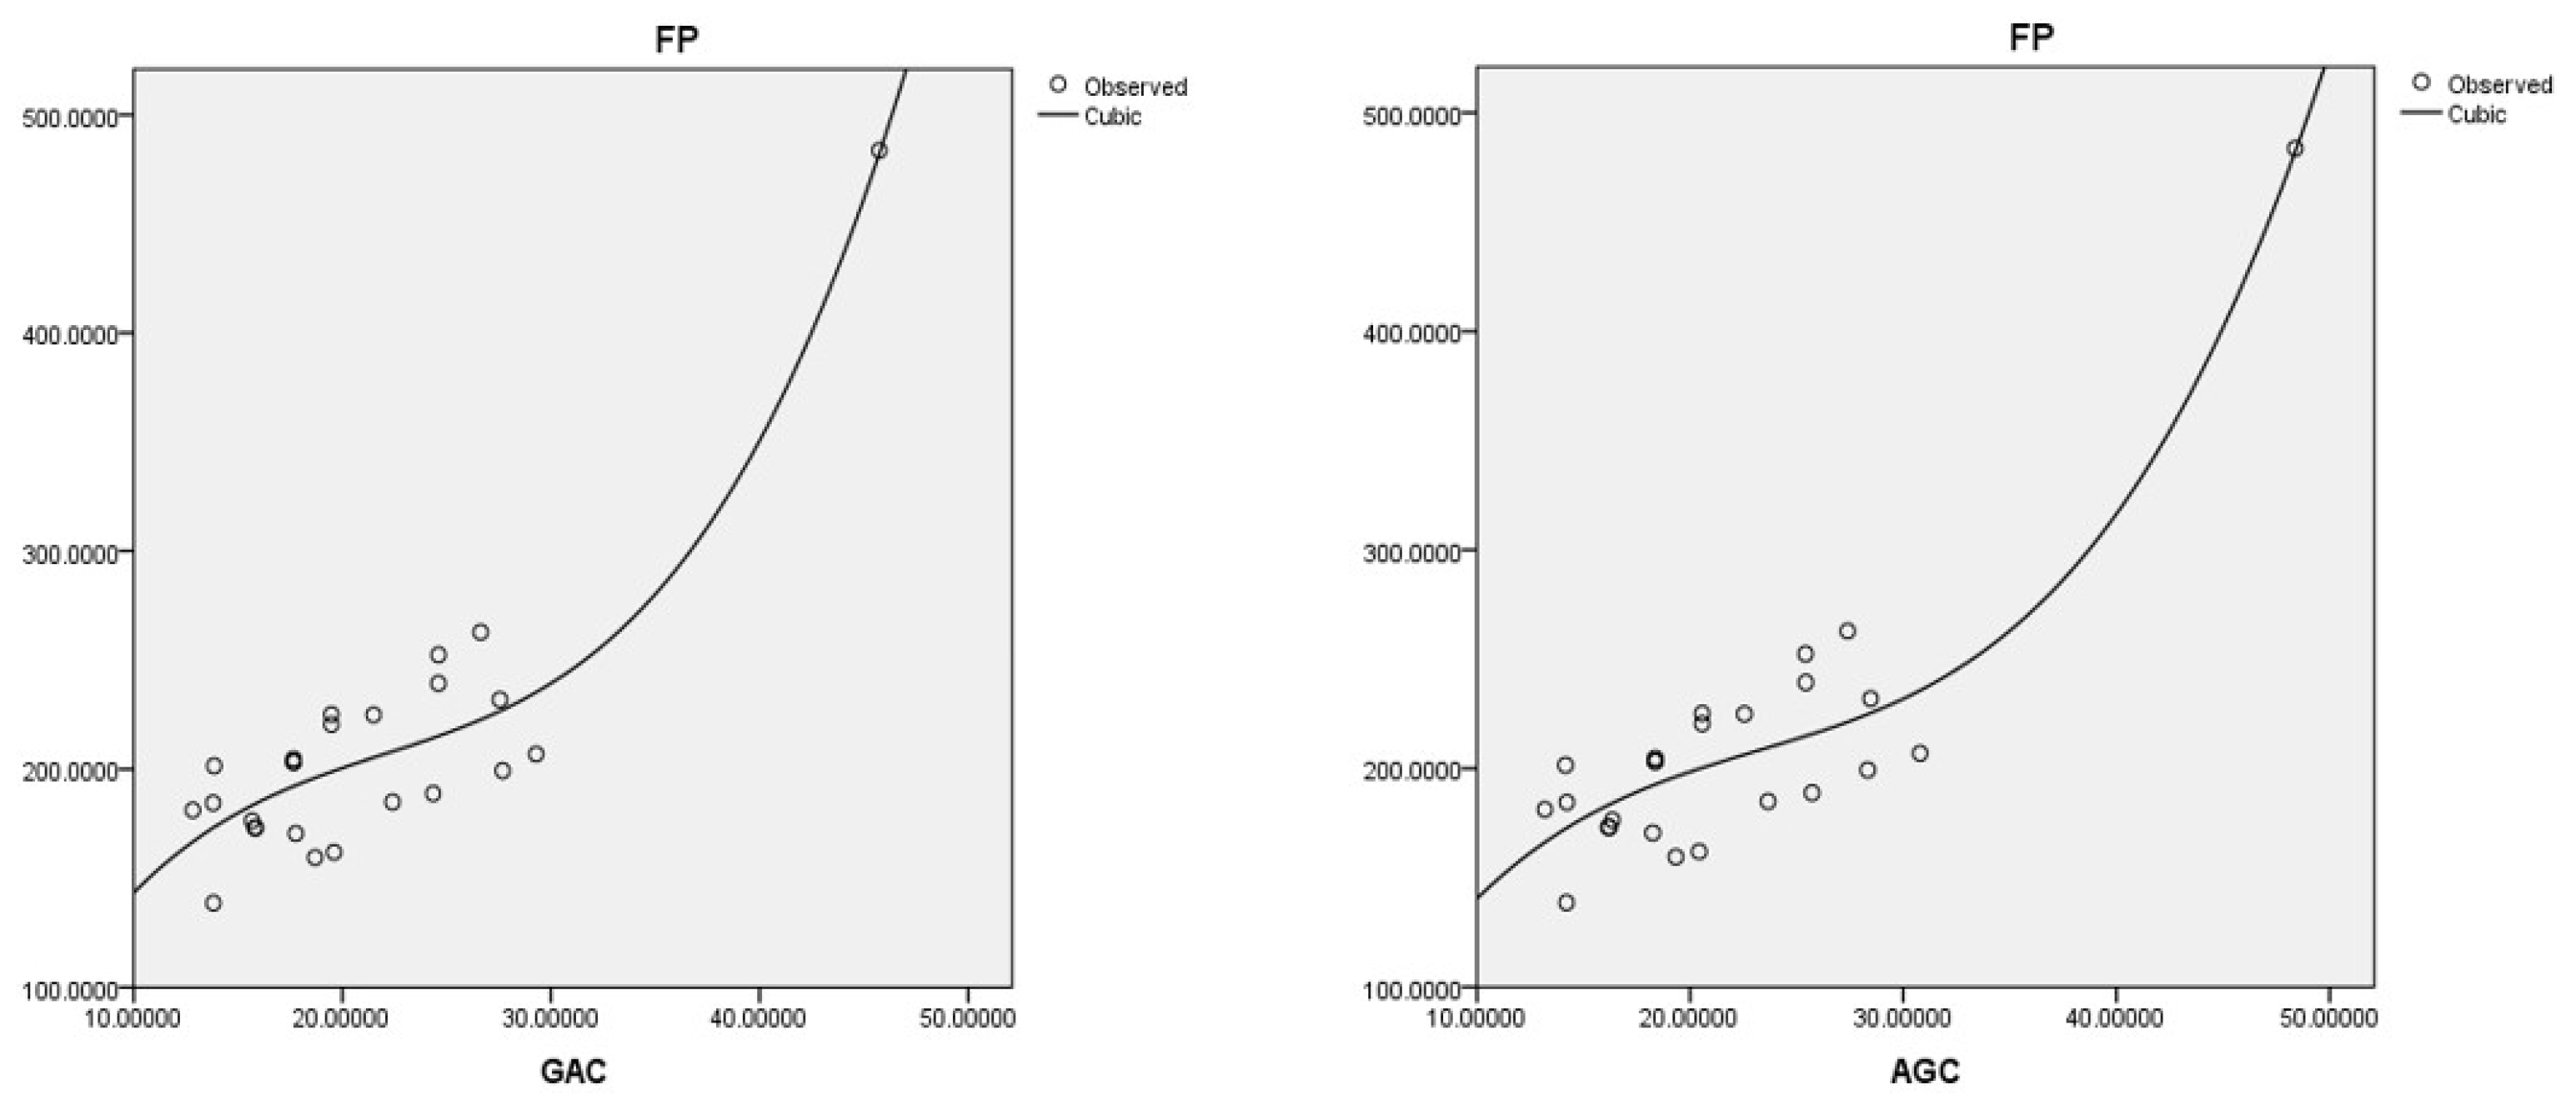
Table 10, the cubic regression model, which incorporates third-degree terms, provides the highest level of precision. It was particularly effective in capturing intricate dependencies on flash point (FP) and molar volume (MV), where higher-order interactions between molecular descriptors are evident. Based on its advanced fit for such properties, the cubic model suggests that some physicochemical traits are influenced by complex interactions that are only captured by higher-order models.
Gradually moving from linear to cubic regressions provides a deeper understanding of drug characteristics. They provide crucial insight into drug efficacy and stability, which is essential for designing optimized anti-cancer drugs. Advances in statistical techniques make it possible to comprehend and predict pharmaceutical behaviors more accurately. This methodology enhances drug development by exploring molecular descriptors and drug properties. It demonstrates the importance of applying advanced statistical tools to pharmaceutical research to improve drug efficacy and patient outcomes by predicting and refining drug properties based on molecular descriptors.
2.1.3. Regression Models for FP, MR, MV, and P
The best cubic regression model is obtained with the geometric-arithmetic connection index:
This model is based on the arithmetic–geometric connection index:
Coumarins and their related compounds represent the best overall model for anti-cancer drugs. They are shown in
Figure 2.
The best cubic regression model is obtained with the sum-connectivity connection index:
The best linear and quadratic regression model is obtained with the sum-connectivity connection index:
Coumarins and their related compounds represent the best overall model for anti-cancer drugs, as shown in
Figure 3.
The best cubic regression model is obtained with the sum-connectivity connection index:
The best linear and quadratic regression model is obtained with the sum-connectivity connection index:
Coumarins and their related compounds represent the best overall model for anti-cancer drugs.
The best cubic, linear, and quadratic regression model is obtained with the sum-connectivity connection index, as follows:
Coumarins and their related compounds represent the best overall model for anti-cancer drugs.
The regression models are shown in
Figure 5.
Although applying these results in drug discovery pipelines demands a separate study, we recall a seminal work by Estrada et al. [
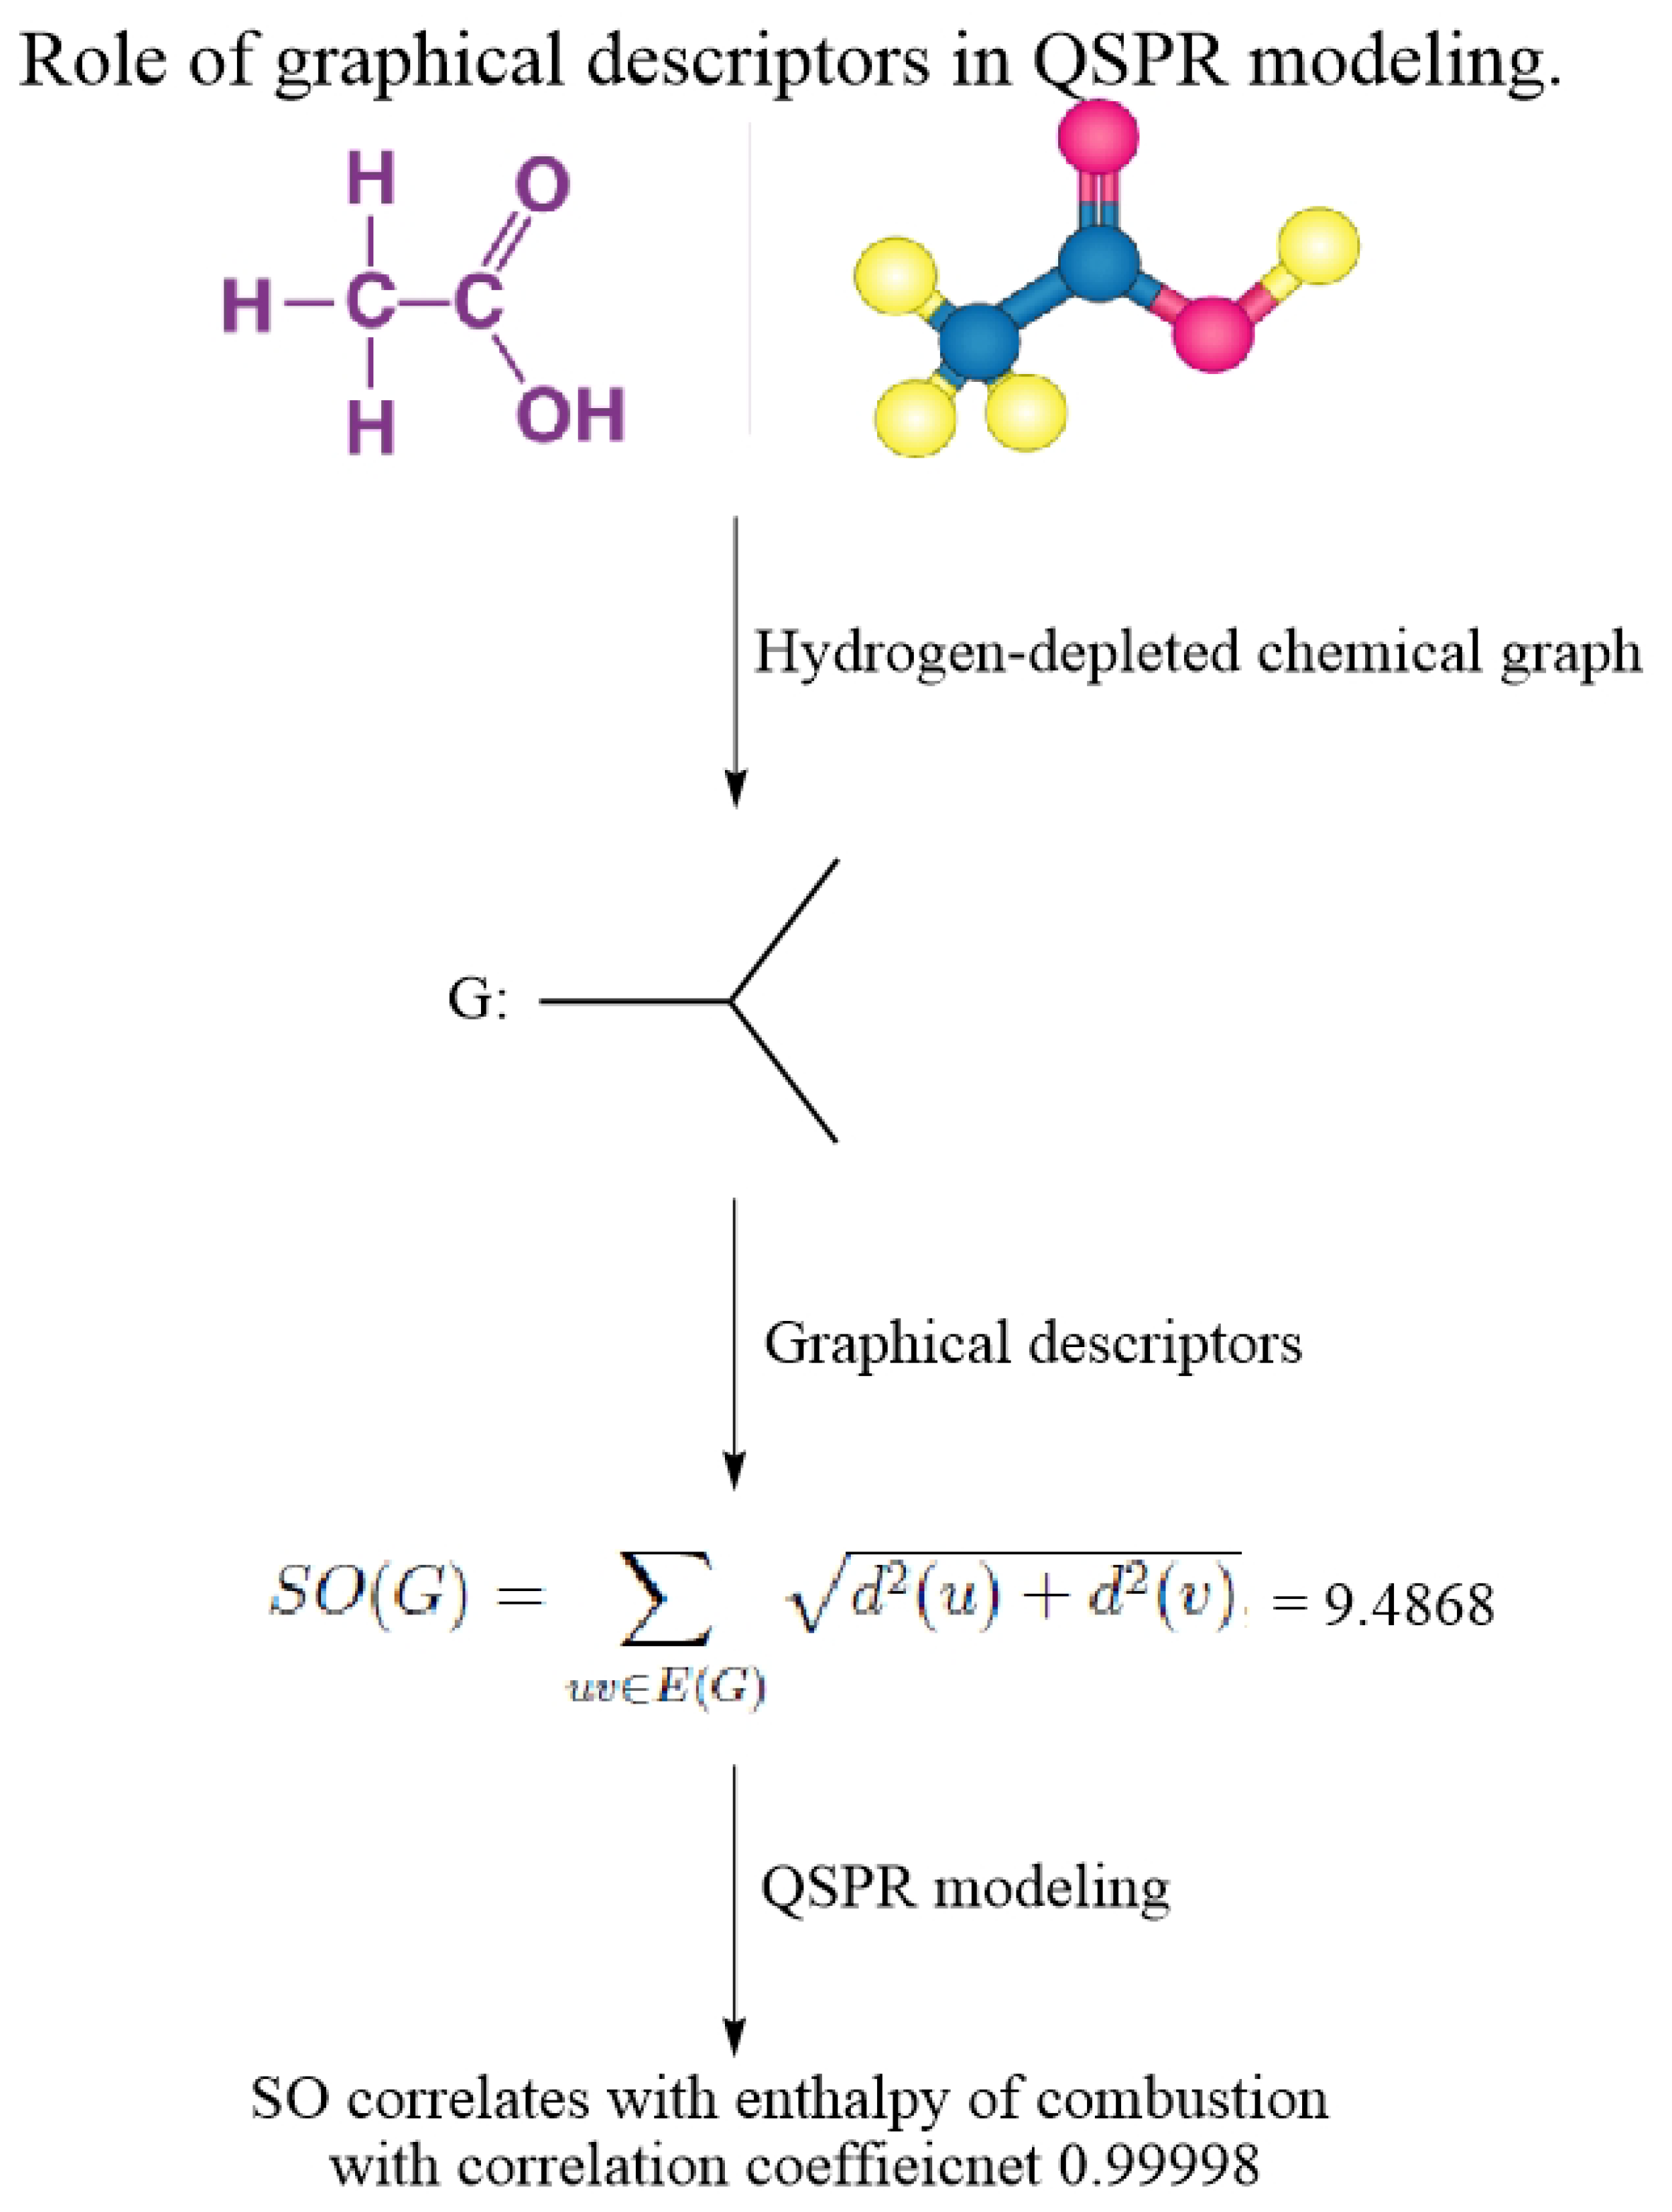
45], which addresses this gap of structure–property modeling by graphical descriptors and drug discovery research. The reader is referred to this work for an illustration of the role of graphical descriptors in drug discovery research.
3. Materials and Methods
3.1. Mathematical Preliminaries
A graph is a pair in which is the vertex set and . The valency/degree of a vertex is defined as . The distance/geodesic between two vertices has the definition , where is the length (number of edges traversing) by the path (chain of vertices connecting x to z). Based on the geodesic, we define the connection of vertex as , i.e., the number of vertices at distance two from x.
A graphical invariant is said to be connection-based if it is structured on the vertices’ connection. The next subsection surveys all the existing connection invariants. Some new connection-based indices have also been put forward.
Connection-Based Graphical Invariants
Based on the connection of vertices, the first two connection-based graphical descriptors were proposed by Ali and Trinajstić [
46]. They defined the first Zagreb connection index as follows:
They also introduced a degree-connection-based descriptor called the modified first Zagreb connection index. It is defined as
Ali et al. [
47] studied
of certain T-sum graphs. Ali and Trinajstić [
46] also studied the applicability of these descriptors in cheminformatics. Immediately after its conception, Ducoffe et al. [
48] derived extremal graphs corresponding to
. Tang et al. [
49] in 2019 put forward the second Zagreb connection index as follows:
They proved some results corresponding to
for certain derived graphs, such as semi-total point/line graph etc. Cao et al. [
50] studied molecular graphs with respect to some operation for Zagreb connection indices. Javaid et al. [
41] delivered the multiplicative version of two Zagreb connection invariants. They are defined as follows:
Moreover, these multiplicative Zagreb connection invariants were further investigated for wheel-related graphs.
Note that Diudea et al. ([
8], Chapter 4) presented a rationale to be followed while proposing a graphical descriptor. It includes a list of the following desirable attributes for constructing a graphical descriptor:
- 1.
Direct structural interpretation;
- 2.
Good correlation with at least one property;
- 3.
Good discrimination of isomers;
- 4.
Locally defined;
- 5.
Generalizable to higher analogs;
- 6.
Linearly independent;
- 7.
Simplicity;
- 8.
Not trivially related to other indices;
- 9.
Efficiency of construction;
- 10.
Based on familiar structural concepts;
- 11.
Show a correct size dependence;
- 12.
Gradual change with gradual change in structures.
We observed that most of the existing connection-based graphical descriptors failed to comply with these aforementioned attributes. For instance, the modified first Zagreb connection index
and the two multiplicative Zagreb connection indices
fail to comply with attributes such as numbers 4, 5, and 6. Building upon this limitation, we introduce novel connection graphical indices efficiently complying with the theoretical foundation delivered by Diudea et al. ([
8], Chapter 4).
Note that connection-based descriptors are introduced based on their degree-based counterparts; see [
46]. Following this, we further enhanced this study by proposing connection descriptors based on other degree-based graphical invariants. Note that the references cited here are regarding the corresponding degree-based graphical invariants.
The following expression delivers the Randić [
51] connection index
of
.
For
, the general Randić [
52] connection index
of
has the following mathematical formula:
Note that
.
Next, we put forward the sum-connectivity [
53] connection index
and the general sum-connectivity [
54] connection index
where
. Note that
.
The atom-bond connectivity [
55] connection index
possesses the defining structure:
Next, we introduce the augmented Zagreb [
56] connection index
as follows:
The geometric–arithmetic [
57] and the arithmetic–geometric [
58] connection index has the mathematical expression
and
respectively.
The reduced Randić [
59] connection
and the reduced reciprocal Randić [
60] connection index
are defined as
and
respectively.
Finally, the Sombor [
61] connection index
is defined as
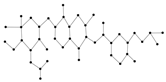
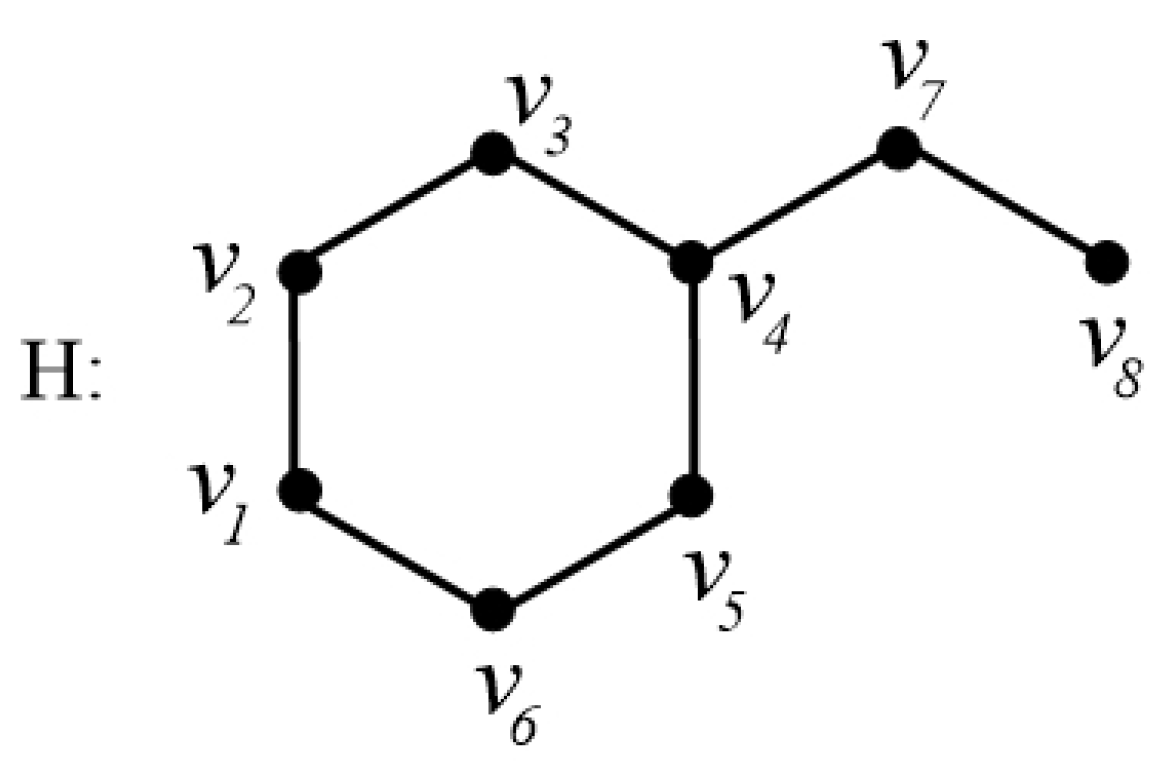
In order to explain these connection-based indices, we consider the example of a chemical graph
H in
Figure 6.
The graph
H in
Figure 6 has order 8. The connection
of the vertex
, for instance, is calculated as
That is, there are three vertices
which are at distance 2 from
. Thus, we have
. In a similar fashion, by calculating the connections of all the vertices of
H, let us calculate the connection index
as follows:
For graph
H in
Figure 6, its AZI index can be calculated as follows:
Figure 7 explains the workflow of employing graphical descriptors in structure–property modeling.
Next, we deliver computational details applied in this study.
3.2. Computational Methods
This section is dedicated to presenting a computer-dependent computing technique to calculate connection-based graphical indices presented in
Section 3.1.
The method makes use of three software packages simultaneously. This includes a computational chemistry software called HyperChem (version 8.0) [
62], a mathematical platform to conduct matrix analysis, i.e., MatLab (version R2024b) [
63], and TopoCluj (version 1.1) [
64], a molecular topology platform. HyperChem is a comprehensive molecular modeling and computational chemistry software widely used in academic and industrial research. Its functionalities span various aspects of molecular modeling, including molecular mechanics, quantum chemistry, molecular dynamics, and visualization. For instance, regarding molecular modeling (resp. quantum chemistry), it performs model building, 3D visualization, etc. (resp. Density Functional Theory (DFT), ab initio methods, etc.). On the other hand, for molecular mechanics (resp. spectroscopy), its ability to conduct energy minimization (resp. UV-Vis and IR spectra, NMR spectroscopy, etc.) possesses significant efficiency. TopoCluj is a specialized software designed for calculating topological descriptors from topological matrices and polynomials. These descriptors are essential in the study of molecular characteristics as well as structures, particularly in the field of computational chemistry and molecular graph theory. MATLAB (short for “Matrix Laboratory”) is an interactive user-friendly environment and a high-level programming language delivered by MathWorks, primarily used for algorithmic development, data analysis, numerical visualization, and numerical computing.
Next, we provide a rationale for selecting the three platforms, i.e., HyperChem, MATLAB, and TopoCluj:
User-friendly interface for building and optimizing molecular structures.
Real-time visualization of molecular properties and transformations.
Efficient quantum mechanics and molecular mechanics calculations, which are particularly useful for cheminformatics applications.
MATLAB: MATLAB was chosen for its advanced numerical computing and matrix operations, which are essential for processing topological descriptors. Compared to alternatives like Python 3.13.2 (NumPy, SciPy) or R 4.4.2, MATLAB R2024b offers:
Highly optimized built-in matrix operations, crucial for computing large-scale graph-based descriptors.
Statistical and regression modeling capabilities, enabling precise correlation analysis.
Seamless integration with other scientific tools, ensuring flexibility in extending the analysis.
Dedicated algorithms for computing topological descriptors, reducing computational complexity.
Efficient processing of molecular graphs, making it highly suited for cheminformatics applications.
Compatibility with standard cheminformatics workflows, ensuring consistency in descriptor computations.
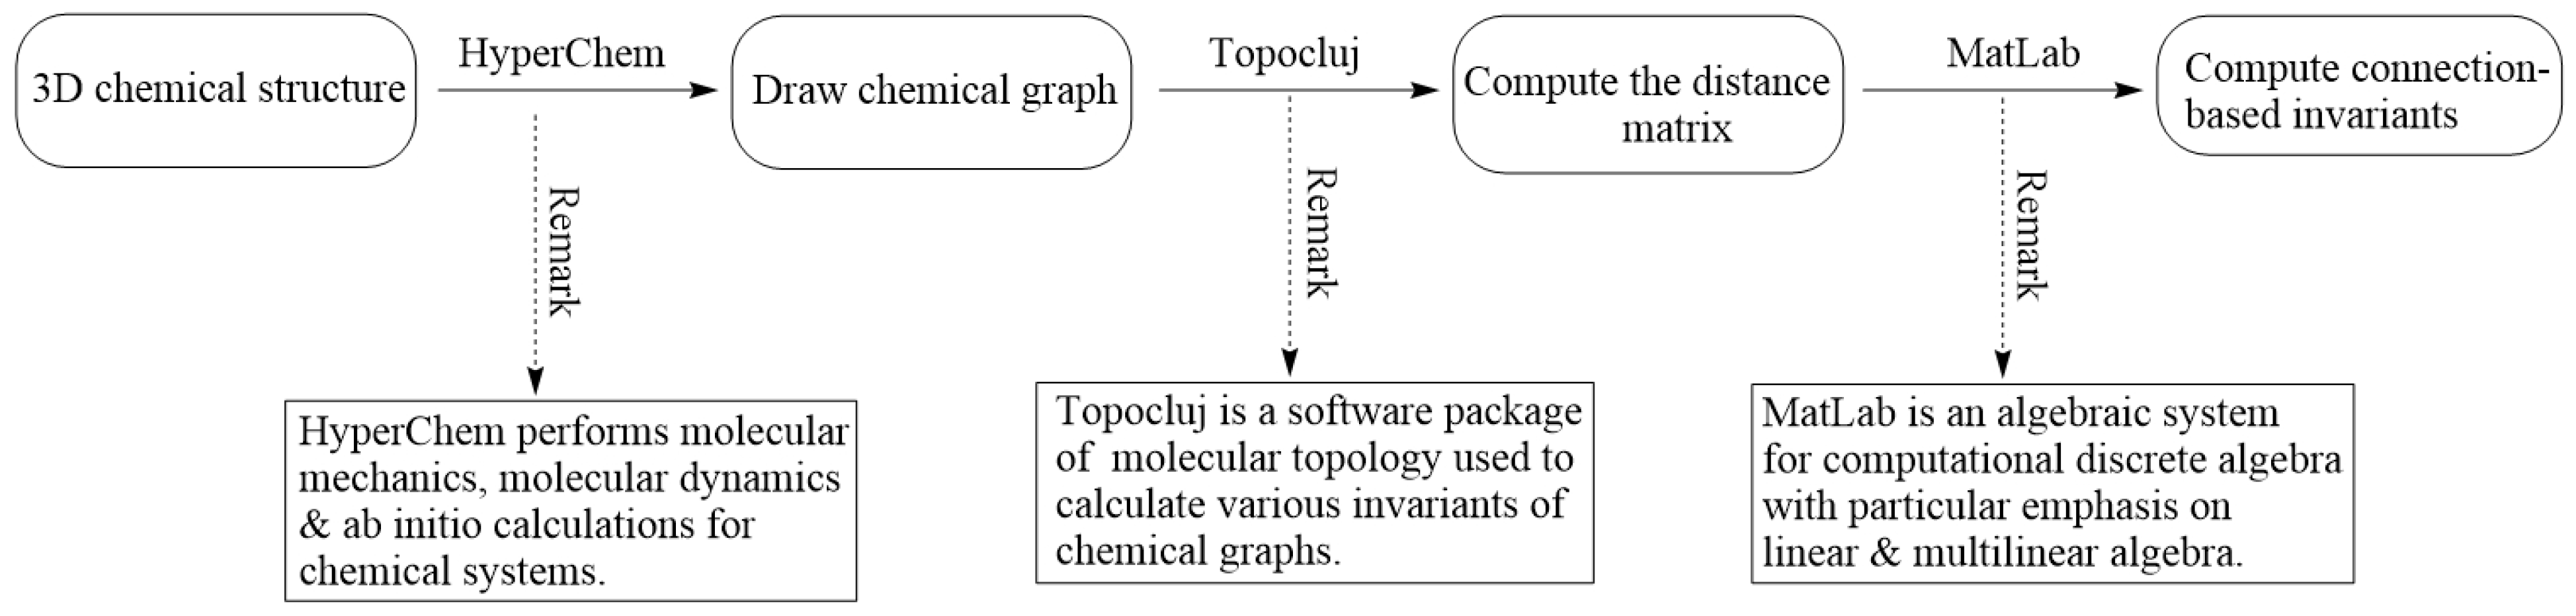
Here, we deliver our proposed 3-step computational method to compute connection-related descriptors for a given molecular graph :
- Step 1
Use the HyperChem drawing module to construct a 3D molecular graph of . It delivers a file with the .hin extension.
- Step 2
Feed the .hin file to TopoCluj to compute the distance matrix of and generate the .m file corresponding to the .hin file.
- Step 3
Compute all connection-related descriptors (from
Section 3.1) by inputting .m to MatLab and employing our code written in MatLab.
Our step-by-step computational method is depicted in
Figure 8.
We have made our MatLab code public by employing GitHub platform. Click the
GitHub link in order to access all the data.
3.3. Data Analysis
This section delivers all the data, their usage, and implications in structure–property modeling.
The first step is to select test properties as representatives of physicochemical properties. Following the seminal work of Gutman and Tošović [
19], the normal boiling point
and standard heat-of-formation
were selected as test physicochemical characteristics. The selection of
is justified, as it represents van der Waals/intramolecular-type reciprocations. Moreover, the justification for opting
is that the standard heat-of-formation delivers representation for thermochemical characteristics. Note that
of a substance is the temperature at which its vapor pressure equals atmospheric pressure (1 atmosphere or 101.3 kPa) at sea level. Each substance has a unique normal boiling point depending on its molecular properties. Moreover,
is the change in enthalpy when one mole of a compound is formed from its constituent elements in their standard states under standard conditions (usually 298 K and 1 atm pressure).
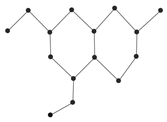
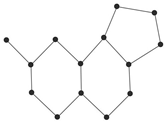
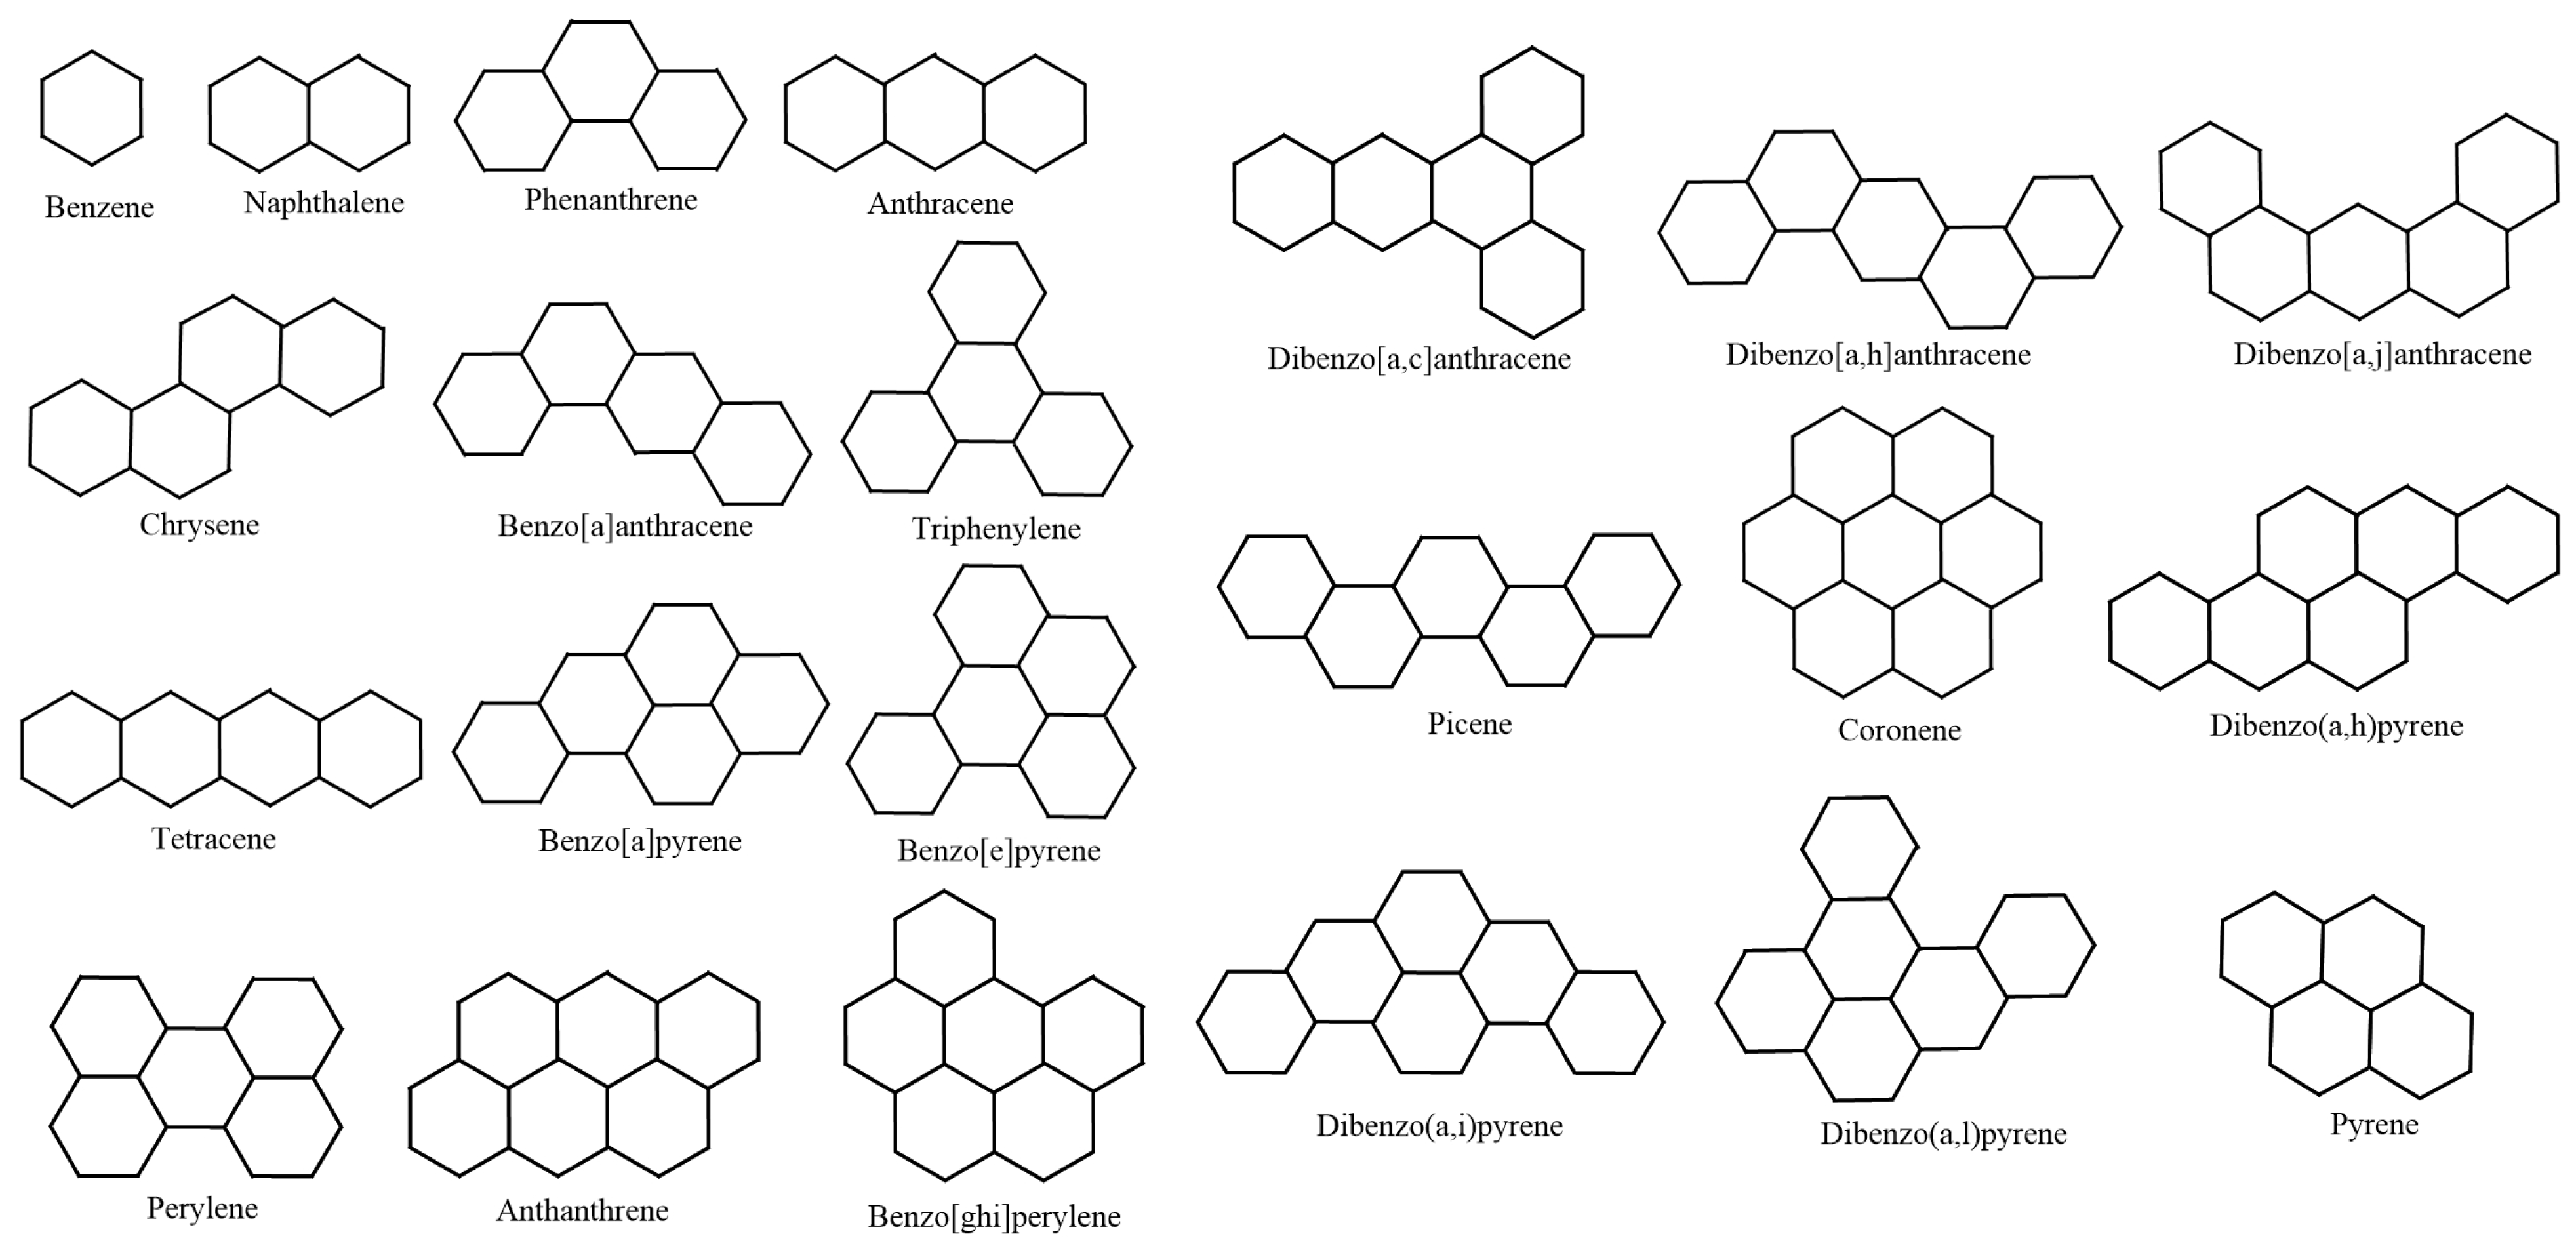
Next, as representatives of benzenoid hydrocarbons (BHs), we select 22 lower BHs as our test molecules. This has previously been performed by Hayat and Khan [
65] and Hayat et al. [
22]. Note that selecting lower BHs for this kind of testing is motivated by Lučić et al. [
66], who considered 30 lower BHs for determining the predictive ability of two degree-based graphical descriptors for the total
-electronic energy of BHs. We have considered the lower 22 derivatives because of the limitation of public availability of the experimental data of
and
. Hayat and Khan selected lower 22 BHs in their comparative analysis to test the quality of eigenvalue-related degree descriptors. In addition, Hayat et al. [
22] opted for 22 lower BHs to investigate the prediction ability of distance-related graph-theoretic invariants for physicochemical characteristics of BHs. The close correlation values of both
and
for the initial 22 members of BHs strengthen the justification for their selection in this study. Moreover, we find the number 22 sufficient in order to validate our statistical inferences. The experimental data of
and
for some BHs were retrieved from NIST’s standard data repository [
67], while we consulted Allison and Burgess [
7], Dias [
68], and Nikolić et al. [
69] for the remaining BHs.
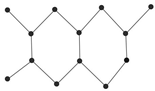
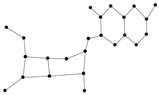
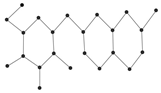
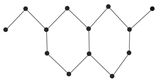
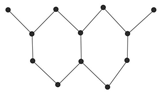
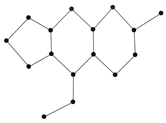
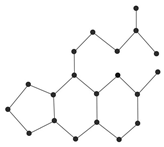
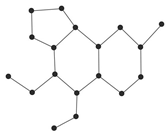
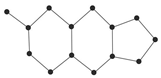
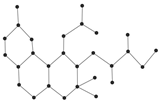
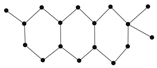
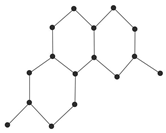
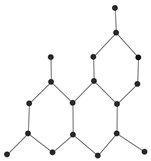
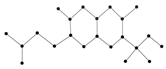
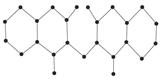
Figure 9 showcased the graphical structures of the 22 initial members of BHs selected as test molecules. Since these are just the graphical representations of the 3D molecular structure of BHs, the aromaticity is omitted. The next step is to compute numerical values of the connection-related graphical invariants in
Section 3.1. In order to do that, the computational method explained in
Section 3.2 has been employed. Moreover,
Table 11 delivers experimental values of both
and
for lower 22 BHs. The implementation of the proposed method in
Section 3.2 for the first/second Zagreb and multiplicative Zagreb connection invariants delivers the data in Columns 4–7. Although we omit the data for the other connection invariants, it is noteworthy to say that those indices can be computed similarly.
The final step of this section is to employ the multiple linear correlation (MLC) between a given connection index
and the two chosen PCPs, i.e.,
and
. We compute
, i.e., the multiple linear correlation between
,
, and a connection invariant
by using the data in
Table 11. The data analysis toolpack of MS Excel is utilized for this computation.
Table 12 delivers the data of MLC values. Note that the general sum-connectivity
and Randić
connection indices has a generic parameter
. Thus, for a meaningful analysis, we select
as test values of
.
In the next section, we deliver a detailed analysis of the data in
Table 12 and mention the top five best connection-based graphical invariants for predicting PCPs of BHs, meanwhile mentioning the ones that do not deserve further attention from the researchers.


