Article

Progressive Ocular Axial Elongation and Retinal Ganglion Cell Degeneration in Mice with Elastic Fiber Disorder

1
Vanderbilt Eye Institute, Vanderbilt University Medical Center, 2311 Pierce Avenue, Nashville, TN 37232, USA
2
Department of Molecular Physiology and Biophysics, Vanderbilt University, Nashville, TN 37232, USA
*
Author to whom correspondence should be addressed.
Int. J. Mol. Sci. 2025, 26(18), 9221; https://doi.org/10.3390/ijms26189221
Submission received: 5 August 2025 / Revised: 12 September 2025 / Accepted: 19 September 2025 / Published: 21 September 2025

Abstract

We previously reported ocular phenotypes of 1-year-old 129S1/SvlmJ lysyl oxidase-like 1 null (Loxl1−/−) mice. Here we sought to characterize age-dependent changes in C57BL/6J Loxl1−/− mice in a longitudinal fashion. Retinal ganglion cell (RGC) function was assessed by electroretinography (ERG), and optic nerves were evaluated by histological analysis. Ocular biometric measurements were obtained by optical coherence tomography (OCT). We detected reduced RGC function, revealed by decreased amplitude and increased latency of ERG positive scotopic threshold responses (pSTRs) in Loxl1−/− mice compared to age-matched wt mice. In addition, there is significant inter-eye asymmetry of RGC function, as well as age-related RGC function loss observed only in Loxl1−/− mice. Histologically, we observed enlarged optic nerve areas in Loxl1−/− mice compared to wt mice. Significant ocular biometric differences between two groups were detected, most notably, age-related axial elongation of the globe, accompanied by deepening of anterior chamber depth (ACD). Though eyes elongate with age in both groups, this is more pronounced in Loxl1−/− mice, and the elongation of the globe correlated with decreased RGC function. The correlation of age-related reduction in RGC function with globe axial elongation may have implications for the association of axial myopia with glaucoma and aging in humans.

1. Introduction

Glaucoma is a leading cause of irreversible blindness due to progressive degeneration of RGCs and their axons. While the final pathway is apoptosis of RGCs, the initial site of damage occurs at the optic nerve head (OHN) [1]. Deformation of the ONH may lead to axon transport deficits, RGC functional loss, and eventual cell death [2]. Many risk factors for glaucoma have been identified, and the association between myopia and glaucoma has been increasingly recognized [3]. Although the precise mechanism for such an association remains unknown, a plausible hypothesis linking these two conditions is aberrant connective tissue remodeling of the ocular shell, resulting in globe elongation in axial myopia and ONH biomechanical changes in glaucoma [4].
One particular form of glaucoma, exfoliation glaucoma (XFG), is caused by exfoliation syndrome (XFS), which is a systemic connective tissue disorder affecting many organs including the eyes [5]. A landmark genome-wide association study identified genomic variants of LOXL1 associated with XFS/XFG [6]. LOXL1 is a member of the lysyl oxidase family, which is composed of lysyl oxidase (LOX) and lysyl oxidase-like 1-4 (LOXL1-4), all of which play important roles in the maintenance of extracellular matrix-rich tissue [7]. Specifically, LOXL1 is essential for crosslink formation in elastin and collagen [8]. Previous studies using LOXL1-knockout mice (Loxl1−/−) revealed characteristic findings of elastic fiber disorder, such as pelvic organ prolapse (POP) and laxity of the skin, which established Loxl1−/− mice as a rodent model for investigating elastic fiber maintenance and homeostasis [9]. We recently investigated ocular phenotypes of Loxl1−/− mice on the 129S1/SvImJ background at 1 year of age using multimodal technologies, including spectral domain optical coherence tomography (SD-OCT), transmission electron microscopy (TEM), and atomic force microscopy (AFM) [10]. We discovered that these mice had biometric changes in the anterior segment of the eye and enlarged optic nerves with stiffer posterior sclera that correlated with enlarged collagen fibril diameter, reduced elastin deposition, and irregular elastic fiber morphology. In this current study, we report characterization of ocular features of our newly backcrossed Loxl1−/− mice on the C57BL/6J genetic background. Our findings with 1-year-old Loxl1−/− mice on the C57BL/6J background were consistent with our previous report [10]. In addition, we followed Loxl1−/− mice on the C57BL/6J background longitudinally from 4 to 16 months of age. We discovered progressive globe elongation correlating with RGC degeneration compared with age-matched wt mice, providing further evidence of the association between axial myopia and glaucoma.

2. Results

2.1. Loxl1−/− Mice Have Expanded Optic Nerves

In experimental rodent glaucoma models with elevated intraocular pressure (IOP), optic nerve expansion occurs earlier than loss of retinal ganglion cells (RGCs) [11,12]. We have previously reported this phenotype in microfibril-deficient mice without elevated IOP [13,14] and in 1-year-old Loxl1−/− mice on the 129S1/SvImJ background [10]. Therefore, in this study, we evaluated the optic nerves of C57BL/6J Loxl1−/− mice using our established protocols. As shown in Figure 1A, consistent with our previous findings with 129S1/SvImJ mice, 1-year-old Loxl1−/− mice on the C57BL/6J background had expanded optic nerves compared with wt mice. Additionally, this phenomenon was seen in C57BL/6J mice as young as 4 months old. To determine if the expanded optic nerve precedes loss of axons, as shown in other glaucoma models with elevated IOP, we counted axons using two methodologies, manual counting (Figure 1B) and automated counting with AxoNet2.0. By manual counting, we did not detect loss of axons in Loxl1−/− mice at either 4 or 12 months of age when compared with wt mice (Figure 1B), although axon density trended towards being significantly reduced in Loxl1−/− mice (Figure 1C) at 12 months old, likely driven by the larger nerve areas. Similar results were obtained by automated counting with Axonet 2.0. These findings indicate that reduced axon density is not due to RGC axon loss but is rather due to optic nerve expansion.

2.2. Loxl1−/− Mice Have Reduced RGC Function

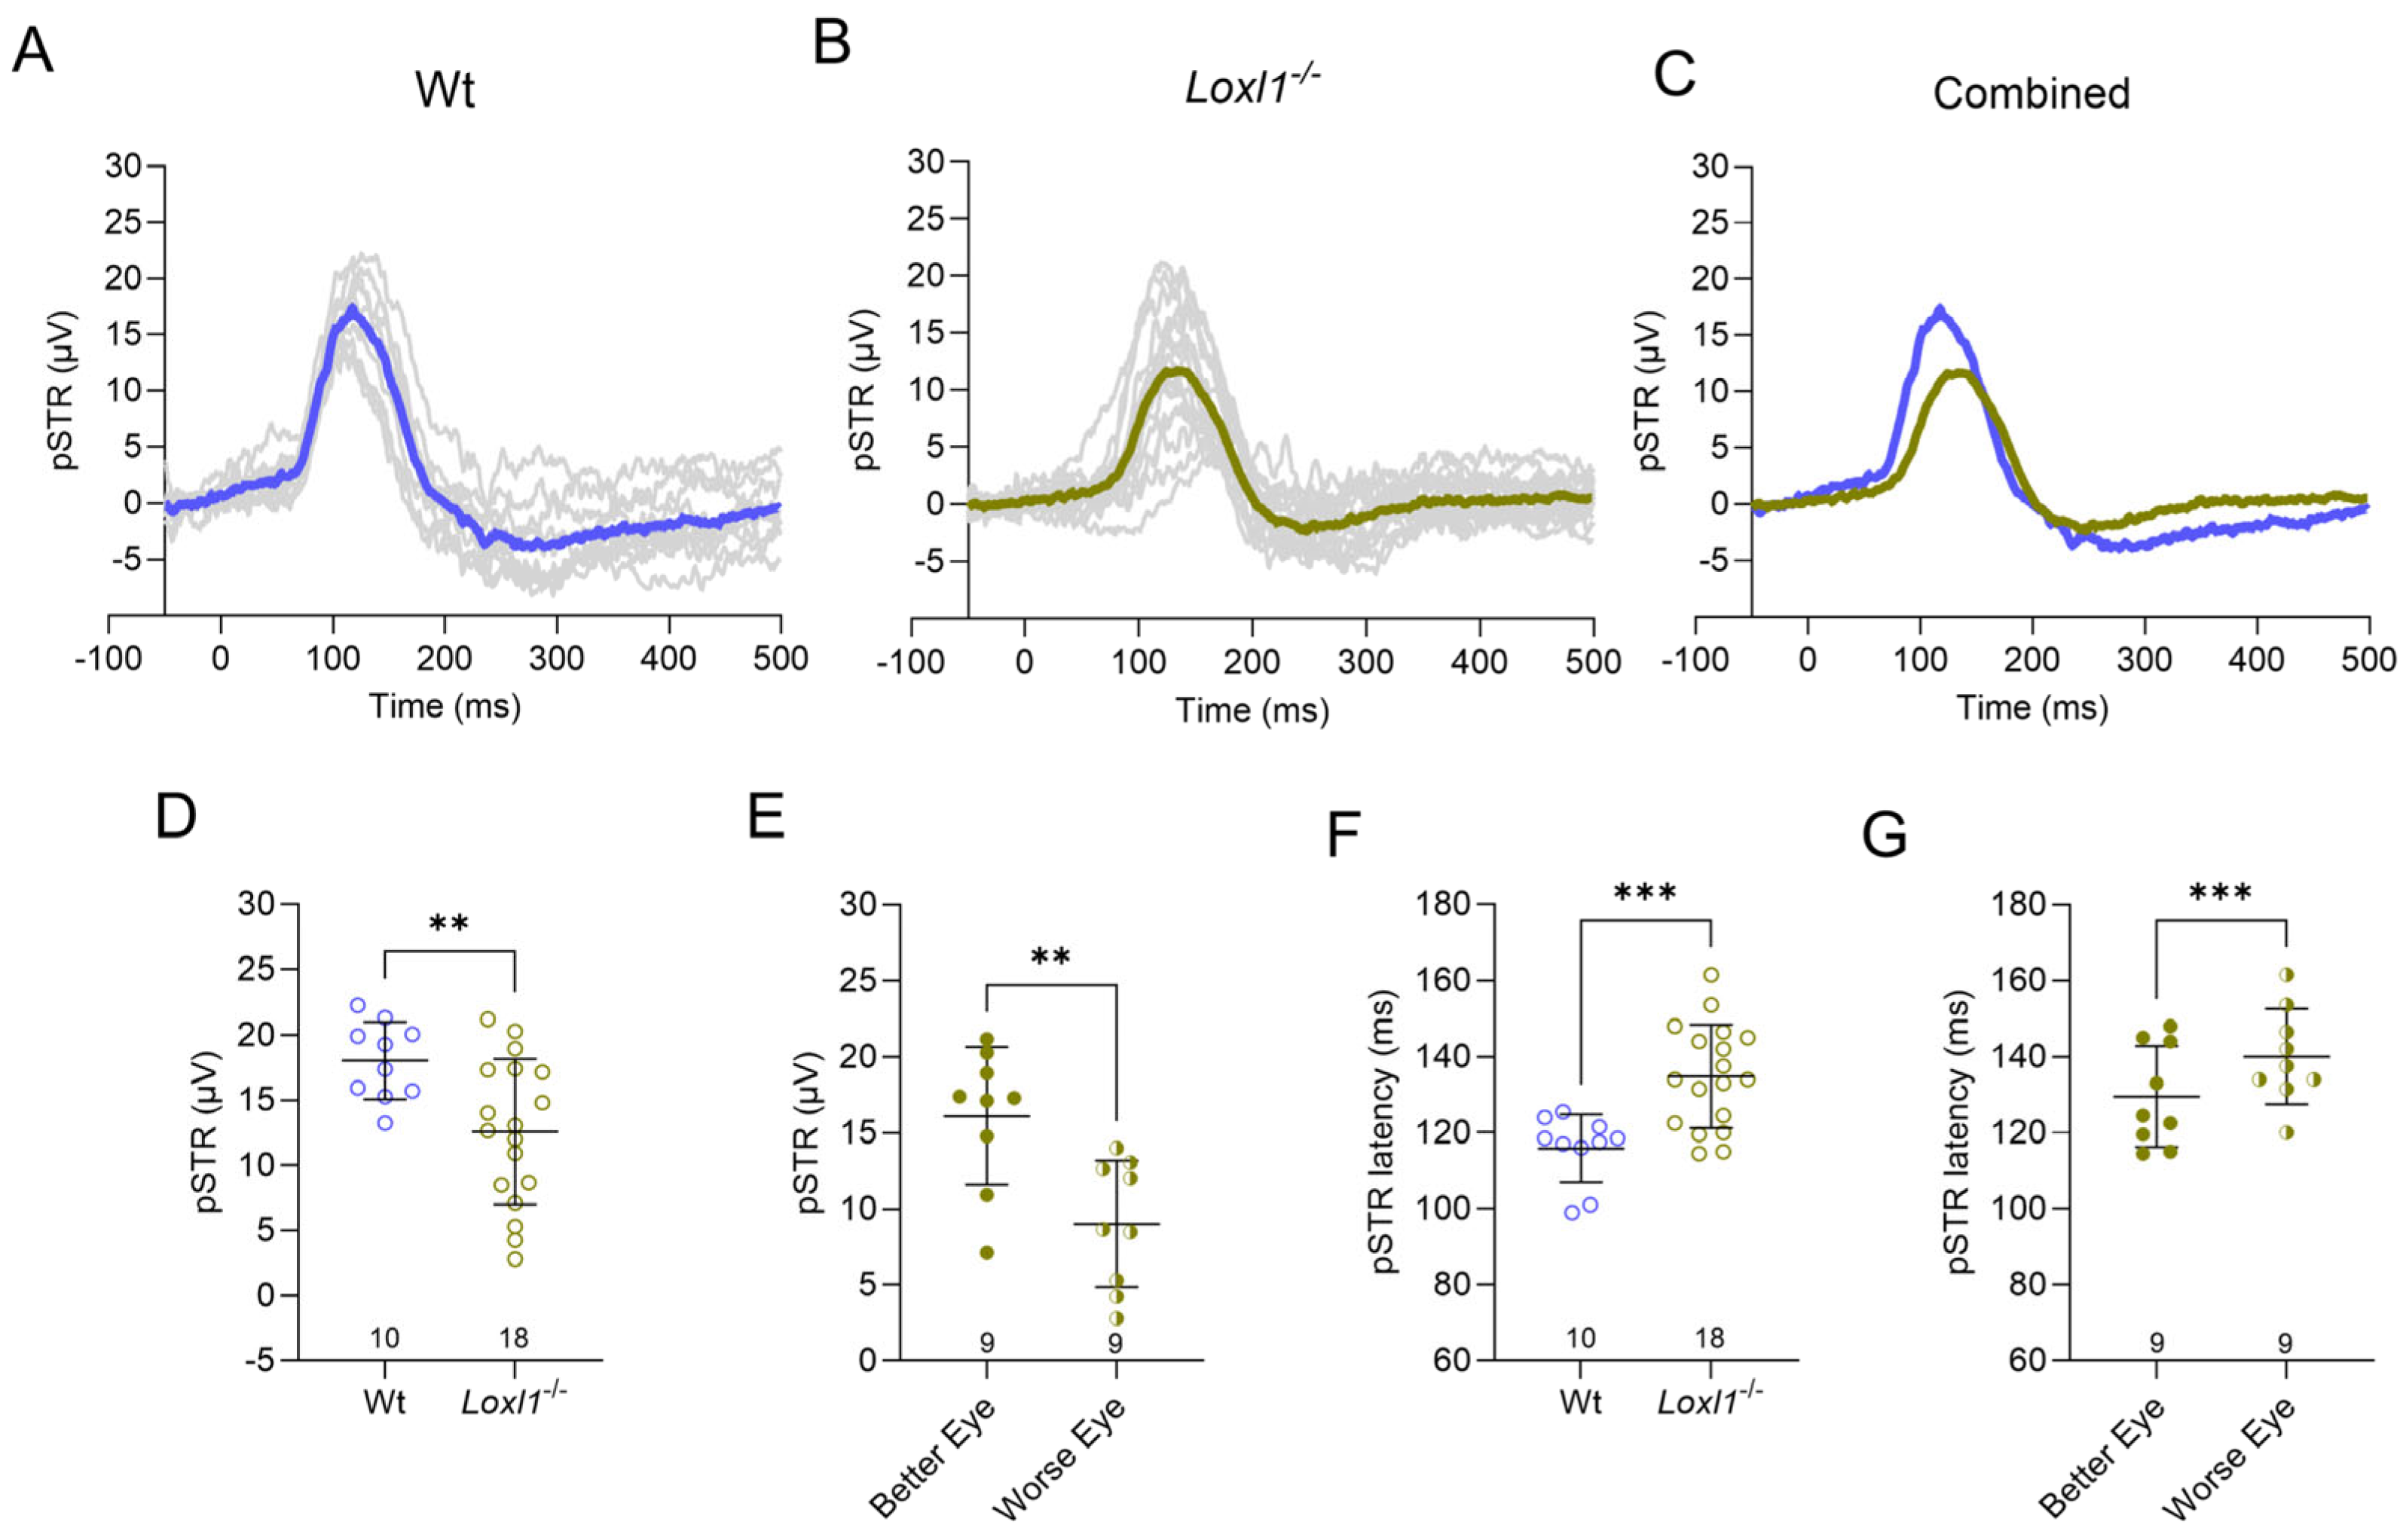
RGC dysfunction in glaucoma has been shown to be reversible by aggressive lowering of IOP, resulting in improved visual field parameters in human glaucoma patients [15]. This provided the premise for us to examine RGC function in Loxl1−/− mice, even though there was no detectable loss of axons at 1 year of age. We performed scotopic ERGs in Loxl1−/− and wt mice (Figure 2A–C). ERG waveforms were stimulated by flashes at a low stimulus intensity of −5 log cd·s/m2 to elicit the positive scotopic threshold response (pSTR), which is a representation of RGC function [13,16]. Loxl1−/− mice have a significantly reduced pSTR amplitude (Figure 2D) as well as a significant increase in pSTR latency compared to wt mice at 12 months of age (Figure 2F), suggesting RGC functional deficit preceding RGC axon loss.
In addition, asymmetry between the two eyes in each individual glaucoma patient is a known phenomenon, especially in early stages of the disease [17]. We observed significant differences between the Loxl1−/− and wt groups, as well as a large variation in both pSTR amplitude and latency in Loxl1−/− mice (Figure 2D,F). Therefore, we analyzed asymmetries by comparing the better performing eye to the worse performing eye in both Loxl1−/− and wt mice. In Figure 2E, the better eye is defined as the eye with the higher pSTR amplitude, and the better eye in Figure 2G is defined as the eye with shorter latency from the stimulus. Interestingly, we detected significant differences between the better eye and worse eye for both pSTR amplitude and latency (Figure 2E,G), which were not observed in wt mice, consistent with glaucomatous RGC damage.

2.3. Loxl1−/− Mice Have Accelerated Age-Related Decline of RGC Function

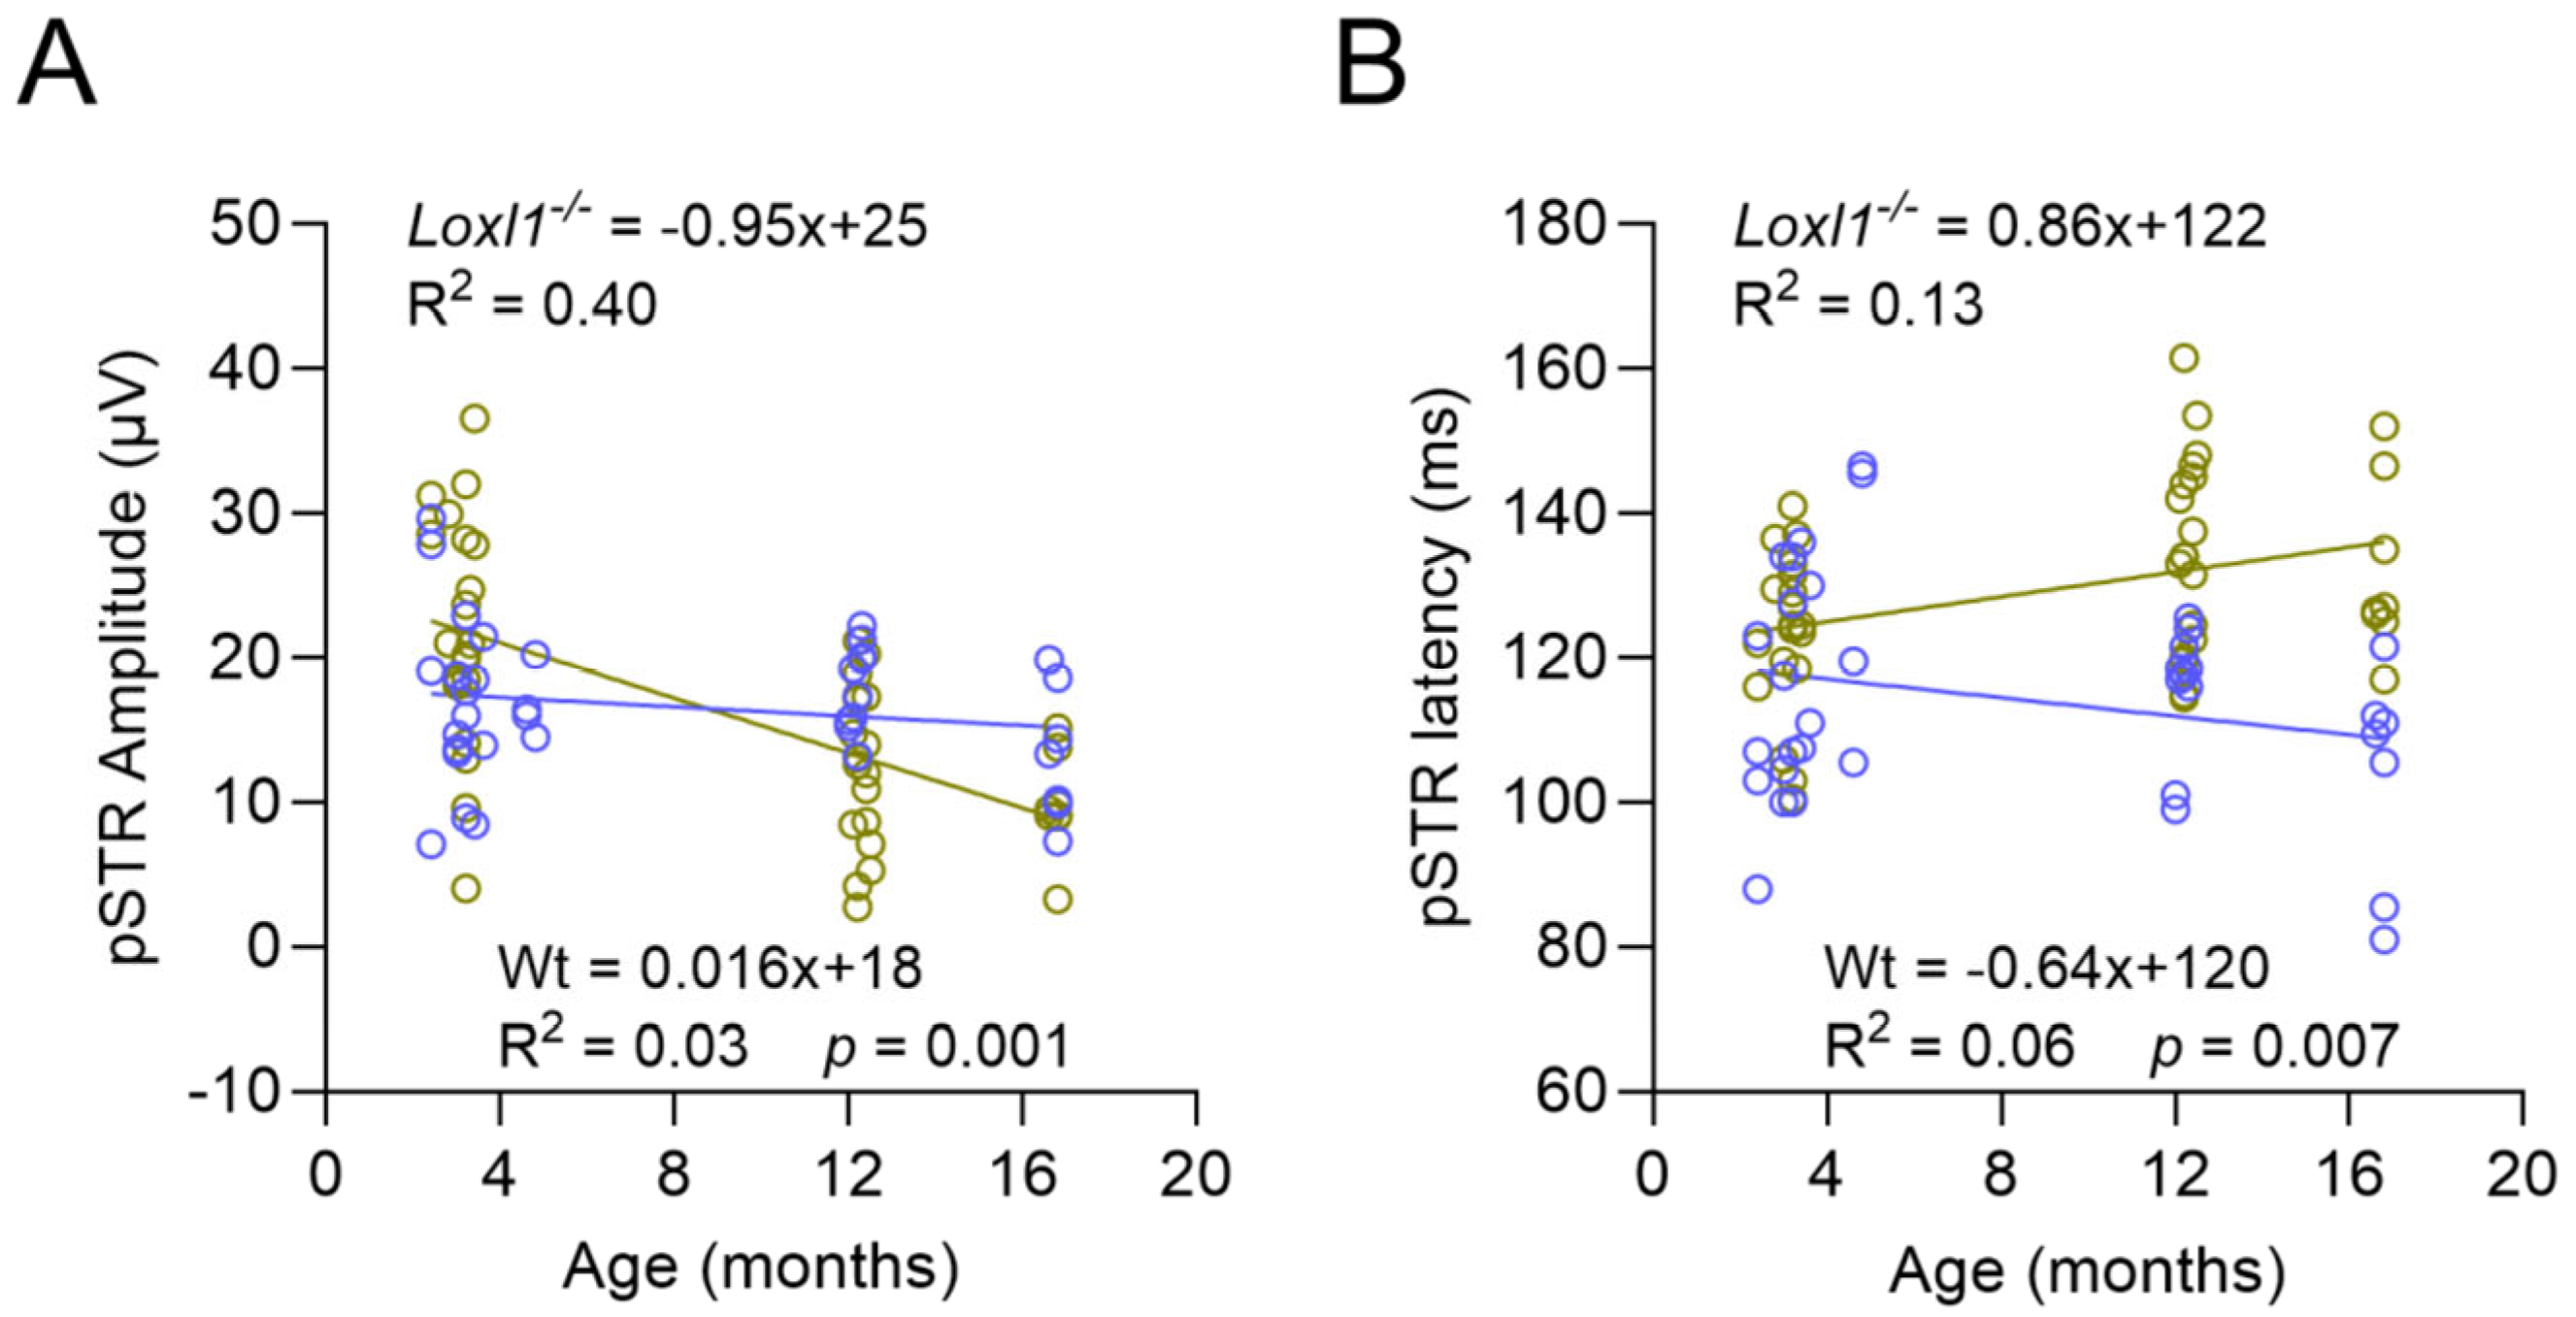
Glaucoma is an age-related neurodegenerative disease characterized by loss of RGCs [18]. We next examined if the reduced RGC function in Loxl1−/− mice was age-related. We aged our C57BL/6J cohort to 16 months and measured pSTR in Loxl1−/− and wt mice at 4, 12, and 16 months of age. Loxl1−/− showed significantly greater age-related reduction in pSTR amplitude (p = 0.001) and prolonged latency (p = 0.007) compared with wt mice (Figure 3), indicating the acceleration of age-related decline of RGC function.

2.4. Loxl1−/− Mice Have Significant Anterior Segment Biometric Changes

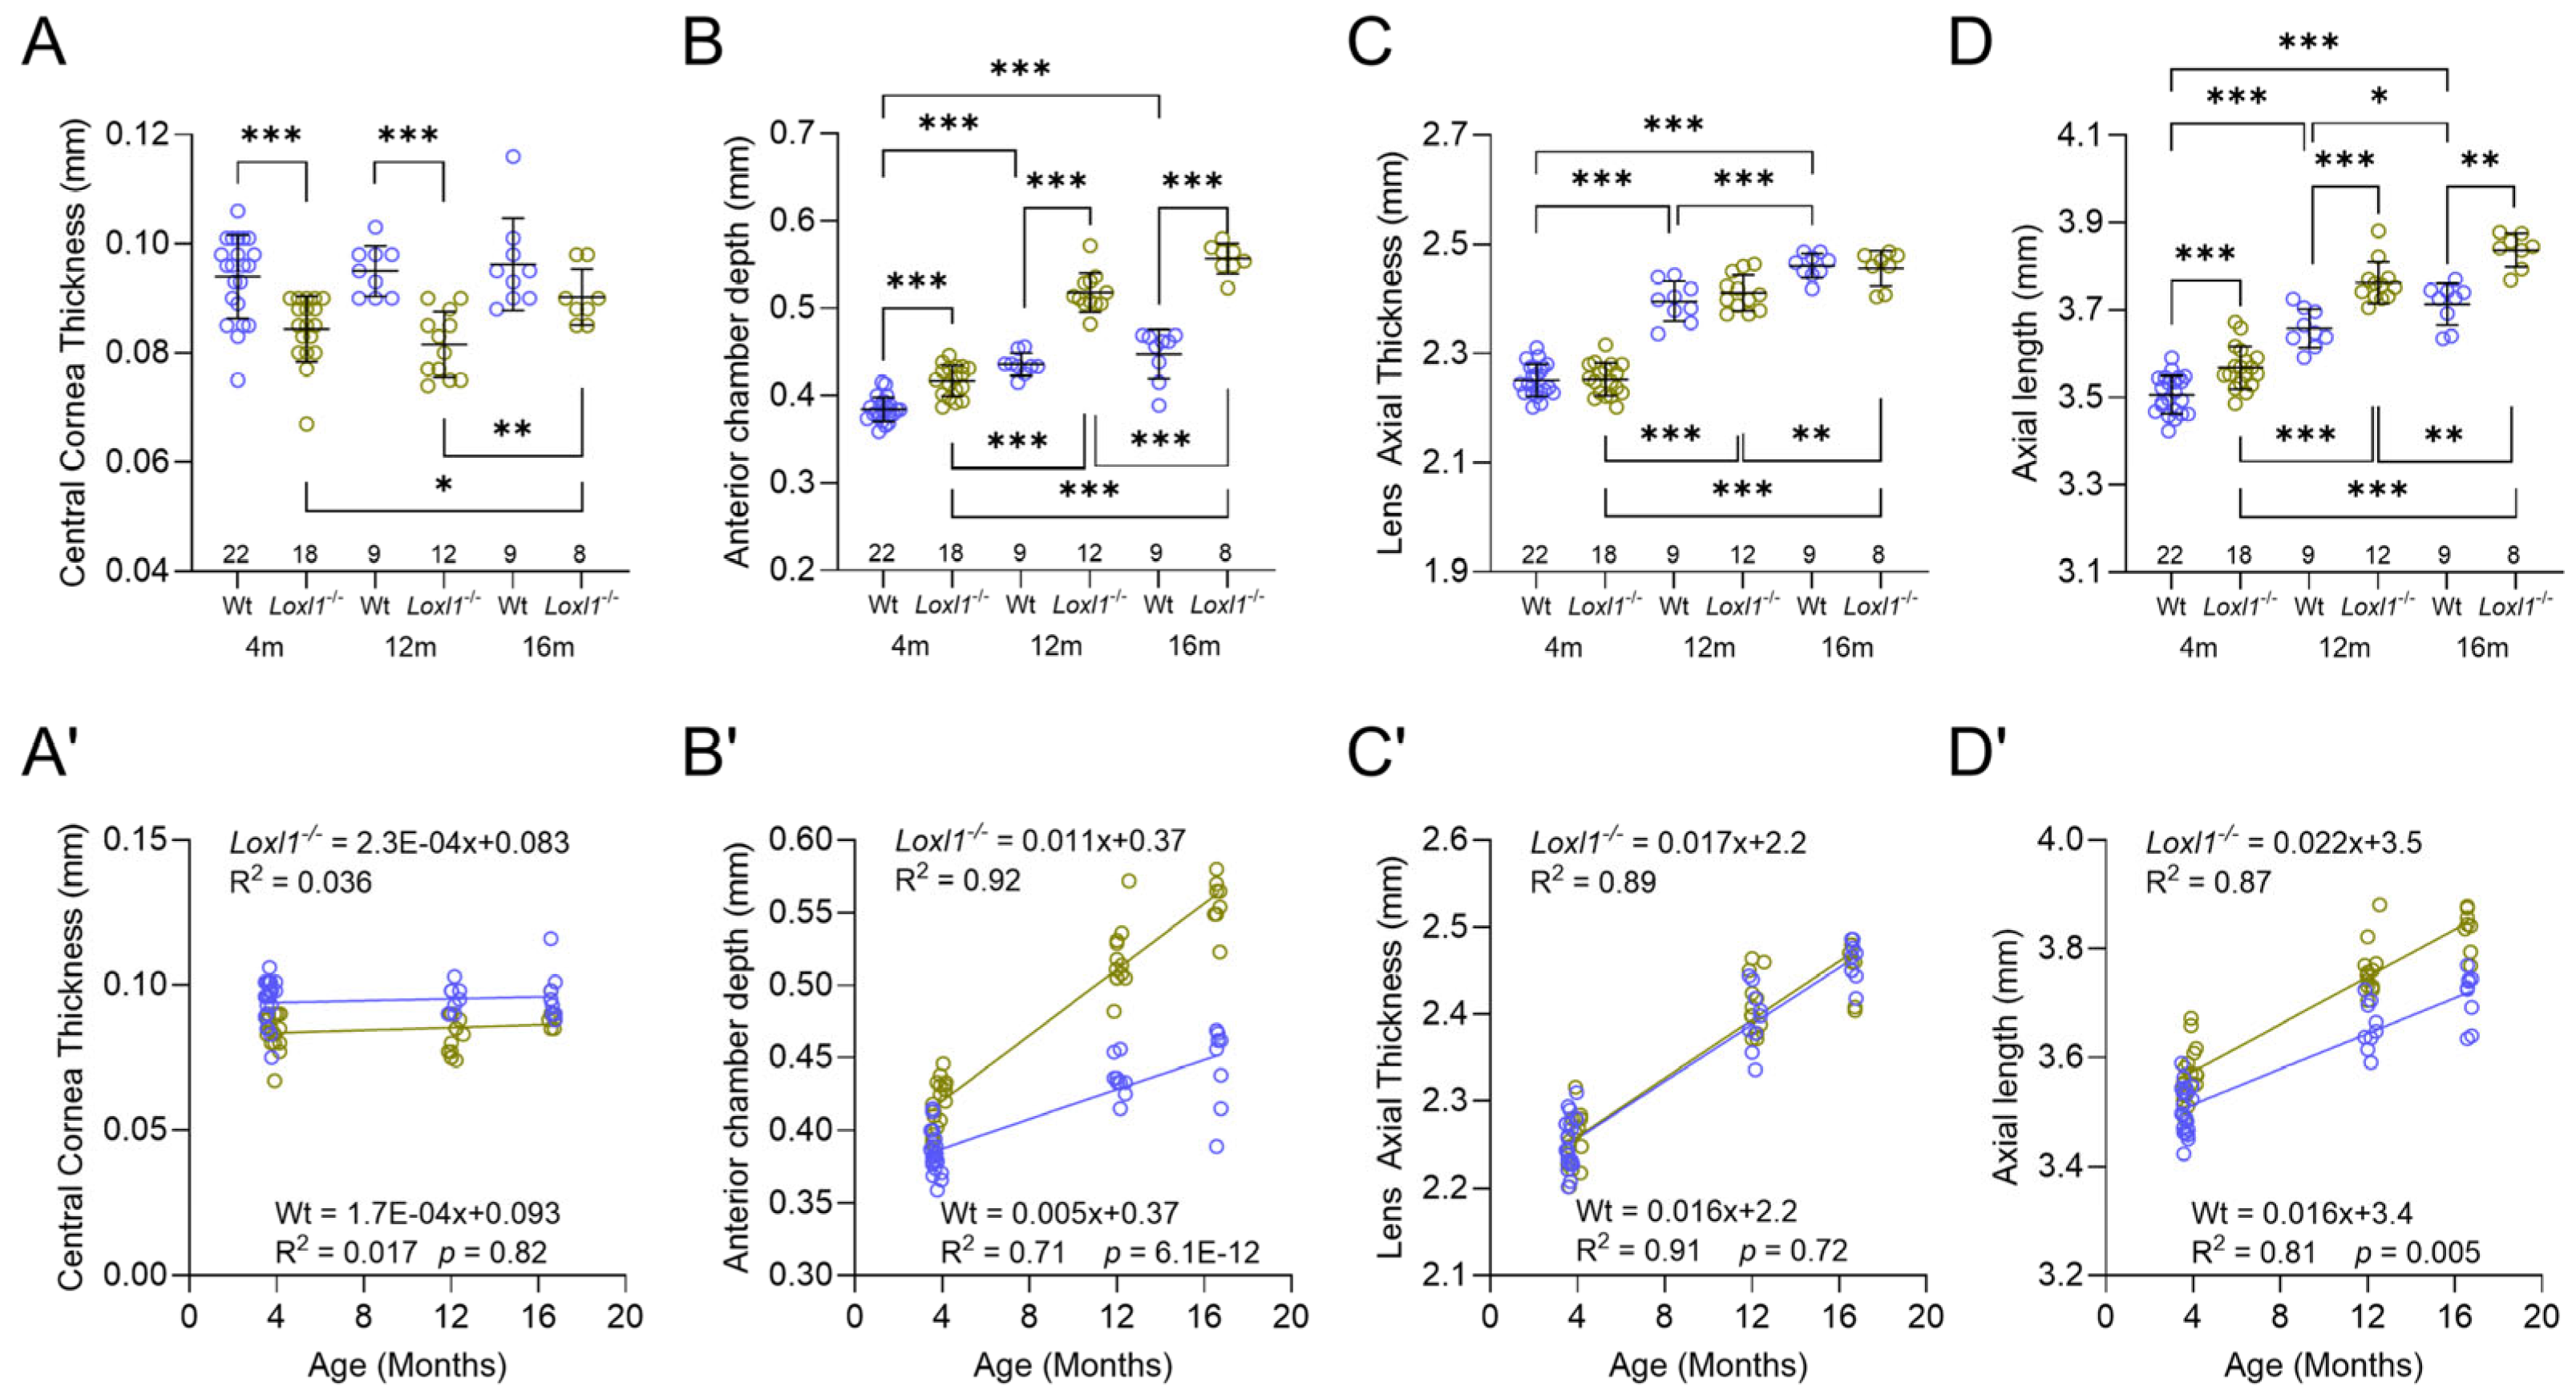
Previously, with 1-year-old mice on the 129S1/SvImJ background, we found that central cornea thickness (CCT) and ACD were significantly different in Loxl1−/− compared to wt mice, although no change was noted in AL [10]. Subsequently, as shown in our separate publication, with 4-month-old mice on the C57BL/6J background, all three parameters (CCT, ACD, and AL) were significantly different when comparing Loxl1−/− to wt mice [19]. In this current study, we increased the number of 4-month-old mice and confirmed the previously published findings. More importantly, we followed those mice longitudinally to 12 months and 16 months of age. We observed significant differences in Loxl1−/− compared to wt mice in CCT and ACD, except in CCT at 16 months (Figure 4). We did not observe body weight differences between Loxl1−/− and wt mice. It is interesting that CCT thinning was observed as early as 4 months of age in Loxl1−/− compared to wt mice and maintained statistical difference to 12 months of age. No age-related change in CCT was observed in wt mice throughout (Figure 4A); however, an increase in CCT at 16 months compared with 4 and 12 months of age was seen in Loxl1−/− mice. Loxl1−/− mice also had deeper ACD compared with wt mice (Figure 4B), consistent with the axial myopia phenotype in human patients. The Loxl1−/− ACD also showed statistically significant age-related deepening compared to wt mice (Figure 4B’). Both Loxl1−/− and wt mice showed age-related increases in lens thickness (Figure 4C), resembling human patients, but there was no difference between groups at any age (Figure 4C’).
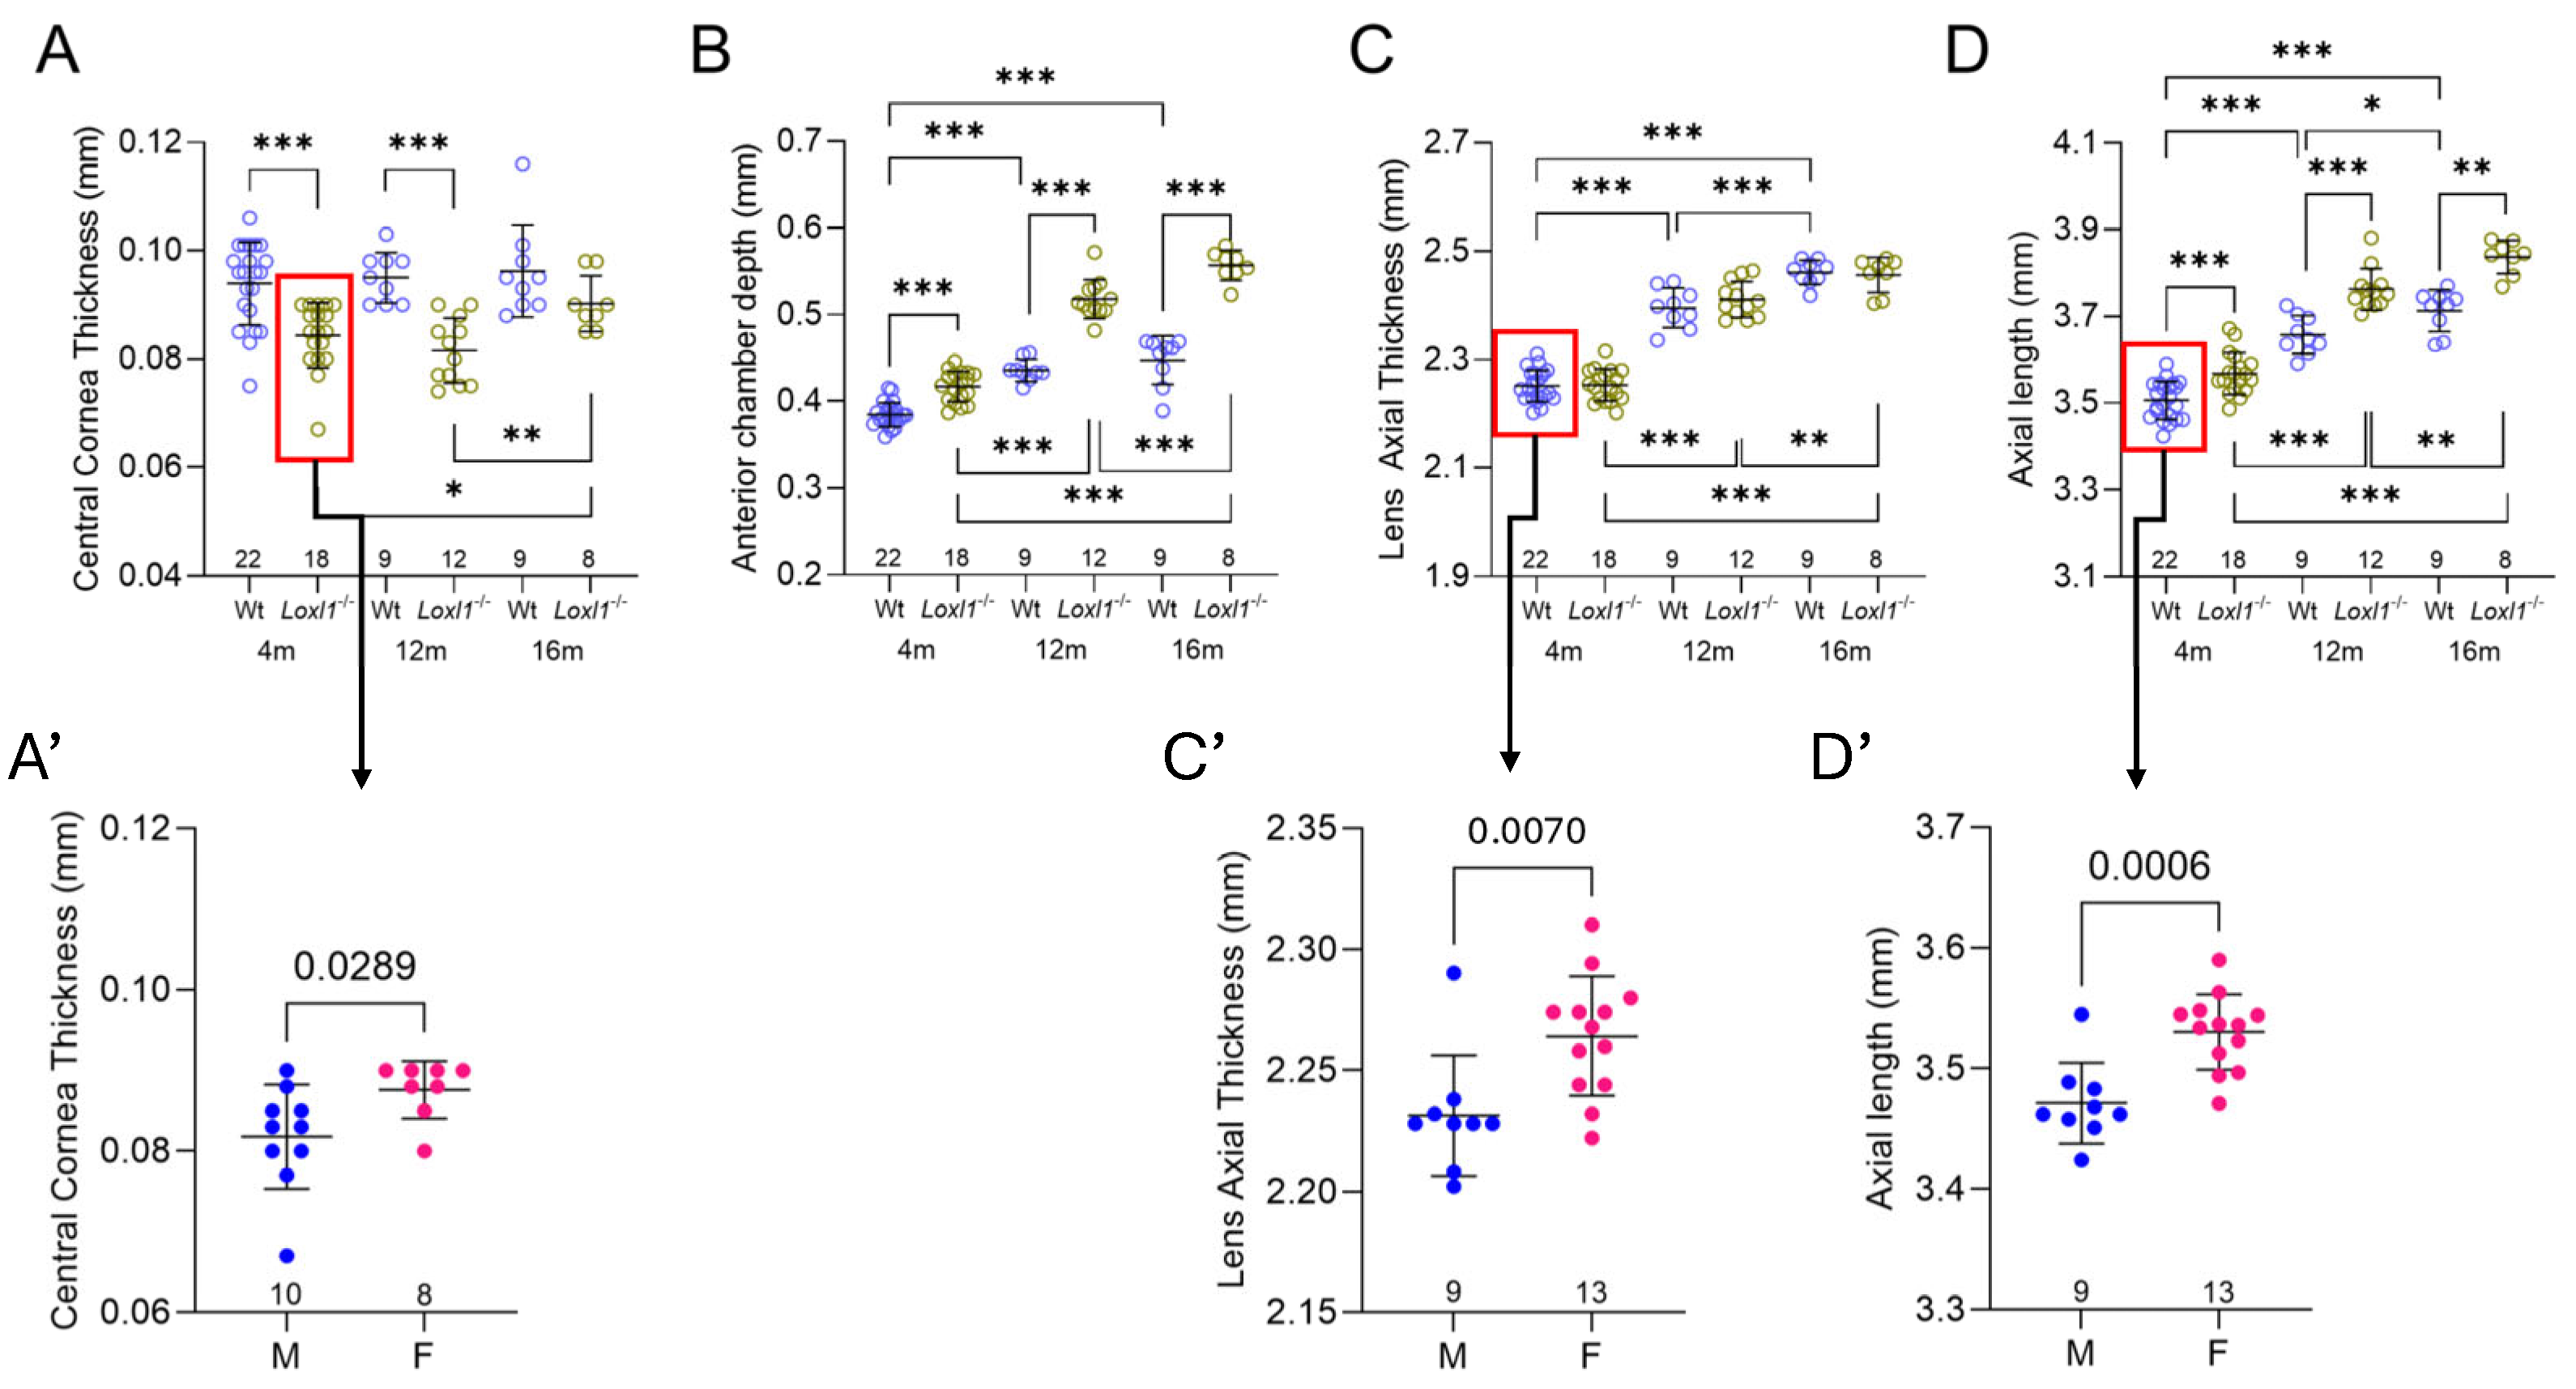
It is well-known that ocular biometric measurements differ between males and females in humans [20]. We therefore analyzed all OCT measurements, including CCT, ACD, LT, and AL in male and female mice at 4 months old separately, given the sufficiently large number of mice at this age in each group. Interestingly, we detected thinner CCT in Loxl1−/− mice, but thicker LT and longer AL in wt mice. The other measurements showed no differences related to sex (Figure 5A’,C’,D’).

2.5. Loxl1−/− Mice Have Globe Elongation, Which Is Correlated with Decreased RGC Function

In addition to the anterior segment biometry findings presented above, we also observed statistically significant globe elongation, shown as increased AL in Loxl1−/− compared to wt mice at all three ages (Figure 4D). Age-related globe elongation was also shown, with this effect more pronounced in Loxl1−/− than in wt mice (Figure 4D’), demonstrated as a statistically steeper slope of the linear regression (p = 0.005). Consistent with biometric findings in myopic human eyes [21], the significant age-related increase in AL in Loxl1−/− mice was accompanied by significantly deeper age-related ACD (Figure 4B’,D’).
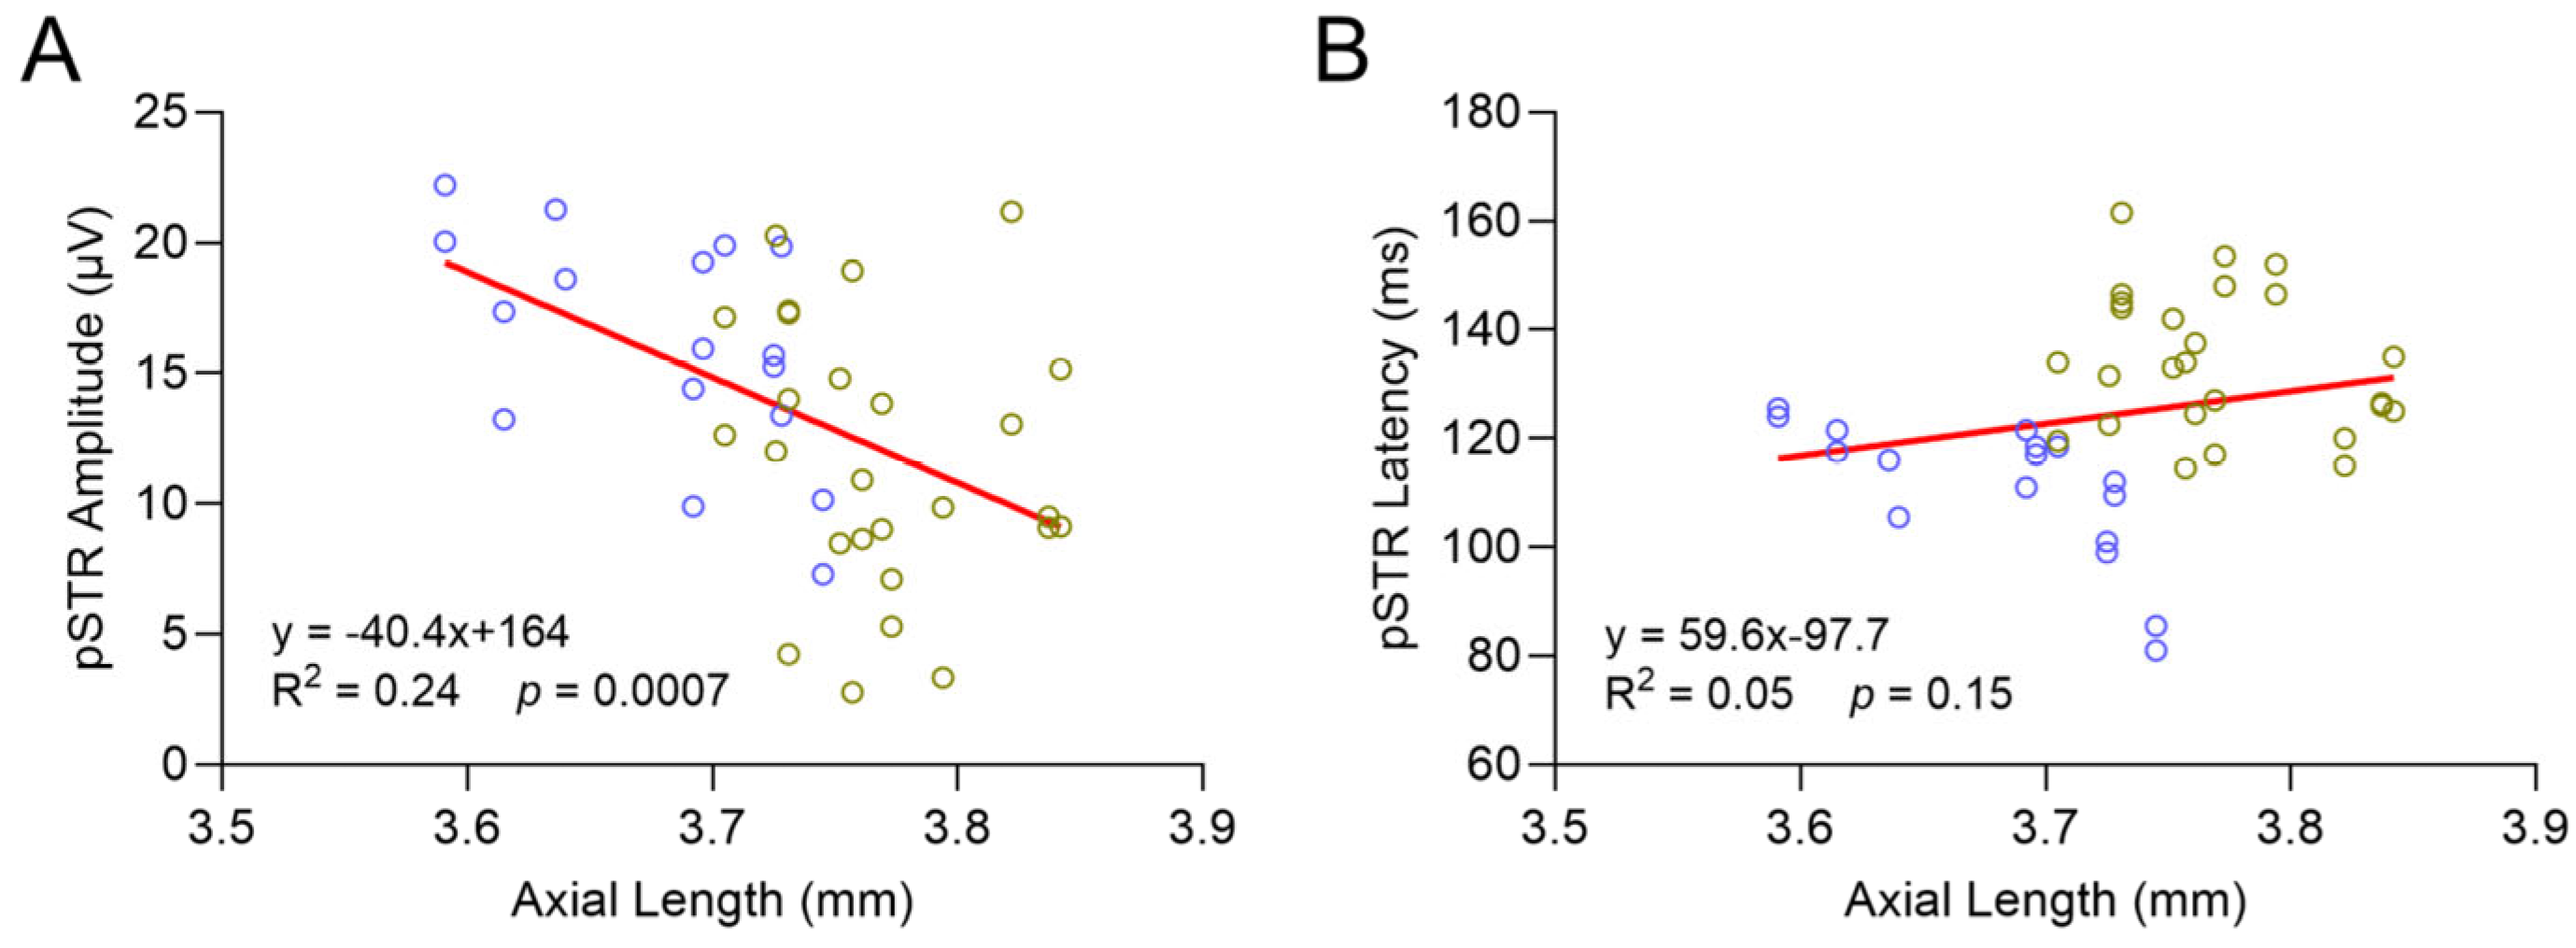
The association between axial myopia and glaucoma has been well demonstrated in human patients. To test this hypothesis in a rodent model, we next investigated the correlation between globe elongation and RGC function (Figure 6). Overall, analysis of combined 12- and 16-month-data from both genotypes showed that increased AL was correlated with decreased pSTR amplitude (p = 0.0007). Latency was not correlated with globe elongation (p = 0.15).

2.6. No Changes in IOP or Visual Acuity (VA) in Loxl1−/−Mice

IOP, measured by a rebound tonometer at 4, 12, and 16 months of age, was not different between the Loxl1−/− and wt mice, and over time IOP remained constant (Figure 7A). Visual acuity was assessed for the same age groups using the OptoDrum. There were no differences between genotypes in VA at any age, nor were there age-related changes (Figure 7B).

3. Discussion

The first Loxl1-knockout mice were created in a landmark study by Liu et al. over 2 decades ago, in which the investigators provided strong evidence of elastic fiber defects in the urogenital tract, lungs, and skin of Loxl1−/− mice [9]. We obtained these Loxl1−/− mice from Dr. Tiansen Li and investigated their genetic background by genome scan SNP analysis in collaboration with The Jackson Laboratory. The results of the scan were consistent with the Loxl1−/− mice being on the 129S1/SvImJ background. Our initial study characterized their ocular phenotypes and ultrastructural and biomechanical features in comparison with background-matched wt controls [10]. Wiggs et al. also reported ocular phenotypes of Loxl1−/− mice from the same source as we obtained ours, but their comparison was made with C57BL wt mice [22]. Alteration of phenotypes induced by genetic background in mice is common, and this phenomenon was particularly reported in Loxl1−/− mice on C57BL/6 vs. 129S genetic backgrounds [23]. To avoid this confounding factor, we backcrossed 129S1/SvlmJ Loxl1−/− mice to C57BL/6J mice for 10 generations. All comparisons in the present study were made with age- and background-matched wt controls. In addition, to our knowledge, this is the first longitudinal follow up of Loxl1−/− mice at 4, 12, and 16 months of age.
In the current study, we detected reduced retina function, as evidenced by ERG experiments showing decreased amplitudes and increased latencies of the pSTR, which is generated by RGCs [16,24], in Loxl1−/− mice at 12 months of age (Figure 2). To fully take advantage of the longitudinal nature of this study, we analyzed the trend of pSTR over time in both Loxl1−/− and wt mice (Figure 3). Loxl1−/− mice showed progressive decline of RGC function, demonstrated by age-related reductions in pSTR amplitude and prolonged latency, and both were significant in comparison to wt mice. It is noteworthy that glaucoma is an age-related disease, and the hallmark is loss of RGC function leading to RGC soma apoptosis and eventually irreversible loss of vision [25]. Our longitudinal findings of age-related reductions in RGC function in Loxl1−/− mice recapitulates the human glaucoma phenotype. Furthermore, asymmetry of optic nerve damage in glaucoma is a well-recognized clinical feature [26]. Sullivan-Mee et al., in a prospective, cross-sectional cohort study, reported diagnostic precision of retina structural asymmetry parameters for identifying early primary open-angle glaucoma [27]. In the Ocular Hypertension Treatment Study (OHTS), the investigators found that, when threshold asymmetry of visual field between eyes existed, the eye with lower thresholds had a significantly greater risk of the development of glaucoma [17]. To investigate the inter-eye difference in RGC function, we compared better eyes vs. worse eyes and detected significant asymmetry for both pSTR amplitude and latency in Loxl1−/− mice, but not in wt mice, further supporting a glaucomatous phenotype of Loxl1−/− mice.
We previously reported that 129S1/SvImJ Loxl1−/− mice had enlarged optic nerves at 12 months old, an early sign of glaucoma in rodents [10]. Consistently, we also observed enlarged optic nerve at both 4 and 12 months of age in C57BL/6J Loxl1−/− mice. Although the total axon numbers of Loxl1−/− and wt mice were similar at 12 months of age, the axon density was borderline reduced in Loxl1−/− mice, likely due to their enlarged optic nerves, all of which indicate a mild glaucoma phenotype. It is worth noting that optic disk size in relation to glaucoma development has been controversial, as Jonas et al. showed glaucomatous optic nerve fiber loss independent of optic disk size [28], whereas another study by the same group of investigators showed that smaller disk size is a risk factor for glaucoma development [29], likely due to differences in patient population. Using a subset of patients with ocular hypertension from OHTS participants, Weinreb et al. previously demonstrated that larger optic disk size, measured by OCT, was significantly associated with the development of glaucoma [30]. One recent study by Nishida et al. revealed that larger optic disk size is associated with faster retinal nerve fiber thinning in glaucoma [31]. The findings of larger optic nerve size in Loxl1−/− mice, especially that their enlarged optic nerves precede detectable RGC functional loss, not only supports the notion that larger optic nerve size is an early sign of glaucomatous nerve damage, but it may also suggest mechanistic causality. It is import to note that the most significant risk factor for glaucoma is elevated IOP [25]. The mild nature of this glaucoma phenotype in Loxl1−/− mice is not surprising given the fact that the Loxl1−/− mice did not have elevated IOP at any age. It is conceivable that Loxl1−/− mice will present worsening glaucoma phenotypes if their IOP is experimentally elevated, which is a subject for future investigation. If proven true, it will lend further support to the notion proposed by Burgoyne et al. that a higher pressure gradient across the lamina cribrosa in the ONH in larger optic disks exerts more stress, leading to axonal damage in glaucoma [1].
The predominant role of LOXL1 and other LOX family members is to regulate elastin and collagen crosslinking [8]. LOXL1-deficient mice have loose skin and POP due to elastic fiber defects [9]. We previously showed that Loxl1−/− mice on the 129S1/SvImJ background had thin central corneas, deep anterior chamber depths, and enlarged optic nerves that correlated with reduced elastin and morphological changes in collagen fibrils in the peripapillary sclera [10]. Several connective tissue diseases, such as Marfan syndrome and osteogenesis imperfecta, result in thin corneas [32,33]. The finding of thin corneas in Loxl1−/− mice revealed in this study is in line with ocular findings of connective tissue disease overall. Moreover, our OCT data also revealed deepening of the ACD in Loxl1−/− mice at all three ages. Although age-related deepening is seen in wt mice, it is more pronounced in Loxl1−/− mice (Figure 4B’). We also observed age-related thickening of the lens in both Loxl1−/− and wt mice, but no difference between groups at any age was seen. This indicates that Loxl1−/− mice did not have microspherophakia, a phenotype seen in other connective tissue diseases [34]. We offer two possible explanations for the significantly increased ACD in Loxl1−/− mice compared with wt mice. First, it could be the result of posterior movement of the lens due to compromised lens zonular fibers. This phenotype resembles ectopia lentis, a hallmark diagnostic feature in Marfan syndrome [35]. The most prominent component of the lens zonular fibers are fibrillins, but a proteomic study in human and bovine lens zonules also identified LOXL1 [36]. The lack of LOXL1 in our model could account for compromised zonular fibers that manifest as a deeper ACD. One of the hallmarks of XFS is the dislocation of the lens due to compromised zonular fibers [37], providing evidence of Loxl1−/− mice as an appropriate model to understand connective tissue diseases, including ocular manifestation of XFS.
The second explanation is related to the increased AL in Loxl1−/− mice. The most significant finding of Loxl1−/− mice in this study is progressive globe elongation. Consistent with a previous report, globe size increases with age, as shown in wt C57BL/6J mice [38]. However, it is notable that the Loxl1−/− mice had longer ALs than wt mice at all three ages, and the increased ACD in Loxl1−/− mice is related to increased AL, as commonly seen in myopic human eyes [21]. More significantly, the age-related increase in AL in Loxl1−/− mice was statistically significant compared to wt mice, as shown in Figure 4D,D’. The progressive globe elongation correlates with a progressive reduction in RGC function (Figure 5). The correlation of axial myopia and glaucoma has been extensively investigated, and myopia has been well recognized as a significant risk factor for glaucoma development and progression [3,39,40,41], including in a recent dose–response meta-analysis [42]. While we could not conclude the causality of the lack of LOXL1 in either axial myopia or glaucoma, the correlation of axial elongation and reduced RGC function further supports the notion of Loxl1−/− mice as an excellent rodent model to understand the association between glaucoma and myopia.

4. Materials and Methods

4.1. Animals

All animal experiments were performed in accordance with the Association for Research in Vision and Ophthalmology statement for the Use of Animals in Ophthalmic and Vision Research and with approval by the Institutional Animal Care and Use Committee of Vanderbilt University (M1800053-02; 14 March 2024). Loxl1−/− mice obtained from Dr. Tiansen Li [9], confirmed by genome scan SNP analysis (The Jackson Laboratory, Bar Harbor, ME, USA) to be on the 129S1/SvImJ background, were backcrossed to the C57BL/6J background over 10 generations. Animals were housed in a facility operated by the Vanderbilt University Division of Animal Care, with a 12 h light cycle and ad libidum access to standard mouse chow and water. The light cycle was kept consistent through their life span, except during the overnight dark adaption period prior to electroretinogram experiments. Loxl1+/− mice were bred to produce cohorts of Loxl1−/− experimental animals and wild-type (wt, Loxl1+/+) contemporaneous littermates which served as controls. As previously described [9,19], a genotyping service was provided by Transnetyx (Memphis, TN, USA) to identify Loxl1+/+ and Loxl1−/− mice, which was validated by PCR reaction on ear-clip DNA using primers S32 (5′-ACA CGT CGG TGC TGG GAT CA-3′), D5 (5′-CTT TCG TAA ACC AGT ATG AGA ACT ACG ATC-3′), and N5 (5′-CGA GAT CAG CCT CTG TTC CAC-3′) (IDT, Coralville, IA, USA).
A total of 125 mouse eyes were included in the experiments, and the number of sub-sets of eyes for each experiment in each genotype and age group are indicated in Figure 1, Figure 2, Figure 4 and Figure 6.

4.2. Intraocular Pressure (IOP) Measurements

Mice were anesthetized with 2.5% isoflurane in 95% O2/5% CO2 delivered at 1.5 L/min by an inhalation anesthesia system (Vet Equip, Livermore, CA, USA). IOP was measured using a TonoLab rebound tonometer (iCare, Franconia, NH, USA), with measurements completed within two minutes of loss of consciousness induced by isoflurane to avoid anesthetic effects [43] and at the same time of day (between 3 p.m. and 4 p.m.) to avoid diurnal fluctuations [44]. Three average readings, each consisting of the mean of six consecutive error-free readings, were averaged to obtain a single IOP value per eye. One eye was reported per mouse.

4.3. Visual Acuity via Optomotor Reflex

Photopic visual acuity of mice was assessed using the OptoDrum (Stria.Tech, Tübingen, Germany). Mice were placed, unrestrained, on an elevated platform centered among four adjoining LCD screens on which alternating black and white vertical stripes at 100% contrast traveled in either a clockwise or counterclockwise direction at temporal frequency of 12°/s. The spatial frequency (cycles/degree) of the presented stimulus was altered by adjustment of stripe widths. Visual acuity was determined as the lowest spatial frequency that elicited the optomotor reflex (head tracking). Mice were acclimated in the testing arena for five minutes before initiation of testing. Tests were performed once for each mouse, and results from each eye were considered independently.

4.4. Spectral Domain Ocular Coherence Tomography (SD-OCT)

SD-OCT was carried out as previously described [45]. Mice were anesthetized with ketamine/xylazine (100/7 mg/kg). One eye from each mouse was visualized using the Bioptigen Envisu R2200 SD-OCT system using a “mouse retina” lens (Leica Microsystems, Wetzlar, Germany). The pupil was dilated with 1% tropicamide and the mouse was placed in the mouse holder. Genteal Tears Lubricant Eye Gel (Alcon, Fort Worth, TX, USA), wiped across the whiskers and eye, was applied to keep whiskers and eye lashes away from the light path and to keep the eye moist. Mouse position was adjusted until Purkinje lines were perpendicular and parallel to the visual axis and centered on the corneal surface. Axial length (AL) was determined by the acquisition of a series of three central B-scan images to determine (1) the distance from the outer retinal pigment epithelium to the posterior surface of the lens [vitreous cavity (VC) + retina]; (2) the distance from the outer corneal surface to the anterior surface of the lens (central cornea thickness [CCT] + anterior chamber depth [ACD]); (3) half of the lens axial thickness (half lens), determined by an image in which the lens was optically folded in half. AL was defined as equal to (VC + retina) + (CCT+ ACD) + 2 (half lens). Measurements were determined using the digital caliper function of the InVivoVue Software version LAS X 5.3.1 (Leica Microsystems). Image acquisition was completed before lens opacity or corneal damage appeared [46]. Upon completion of imaging, mice were injected with atipamezole (1 mg/kg; Patterson Veterinary, Greeley, CO, USA) to reverse anesthesia and to prevent xylazine-induced corneal damage [47].

4.5. Scotopic Flash Electroretinograms (ERGs)

Scotopic flash ERGs were performed using the Celeris system (Diagnosis, Lowell, MA, USA). Mice were dark-adapted overnight and prepared for recordings under dim red illumination. Mice were anesthetized with ketamine/xylazine/urethane (28/11.2/560 mg/kg), placed on the Celeris system, and had a ground electrode inserted subcutaneously at the flank. Pupils were dilated with 1% tropicamide for 5 min. Genteal Tears Lubricant Eye Gel (Alcon) was applied in the same fashion as for OCT. Dim stimulator electrodes were placed in contact with the corneas. Mice were stimulated with white flashes of 4 ms duration, ranging in intensity from −5 to −2 log cd·s/m2 and ERGs were recorded as the average response to multiple consecutive flashes at each intensity (100 flashes at −5 to −4 log cd·s/m2, 30 flashes at −2 log cd·s/m2). Recordings included a 100 ms pre-stimulus baseline with data collected up to 500 ms after stimuli onset. Results from each eye were considered independently. ERG data from the Espion software V6.68.2 (Diagnosis) were exported into Microsoft Excel (Microsoft, Redmond, WA, USA) for analysis. Positive scotopic threshold response (pSTR) was determined by the peak amplitude of the waveform to baseline. The a-wave amplitude was determined by the peak amplitude of the trough to baseline. The b-wave amplitude was calculated from the a-wave trough to the b-wave peak. Latencies were determined as the time intervals from stimulus onset to peak/trough.

4.6. Optic Nerve Histology and Analysis

Mice were euthanized by carbon dioxide inhalation, then cardiac perfused with 10 mL of phosphate-buffered saline (PBS) followed by 20 mL of 4% paraformaldehyde (PFA) in PBS. Optic nerves (ONs) were cut at the optic chiasm and proximal to the globe, post-fixed in 4% PFA and 1% glutaraldehyde in PBS, and stored for 1–3 months. ONs were post-fixed in 2% osmium and embedded in epoxy resin (Embed 812/Araldite resin, Electron Microscopy Sciences) as previously described [13]. The length of the optic nerve stump remaining attached to the eye was measured using a digital caliper (Instant Read-Out Digital Calipers, Electron Microscopy Sciences, Hatfield, PA, USA). To normalize the distance from the eye at which the optic nerve sections were taken, ON blocks were trimmed so that the stump length plus the cut in distance along the optic nerve was 1.5 mm from the globe. Using an ultra-microtome (Leica EM UC7, Wetzlar, Germany), 1 μm thick cross sections were cut and stained with paraphenylenediamine (PPD), which darkly stains axoplasm of degenerating axons [48], and mounted with Permount Mounting Medium (Thermo Fisher Scientific, Waltham, MA, USA). Mosaic images of stained optic nerve cross sections were acquired with an oil immersion 100X/1.45NA objective with an SLR DS-Ri2 camera on a Nikon upright microscope using NIS-elements software 6.10.01 (Nikon, Tokyo, Japan). ON area was determined by drawing a polygon around the nerve, excluding the pia mater, using Fiji (version 2.9.0) [49]. ON axons were manually counted [50] and analyzed using AxoNet2.0 [51].

4.7. Statistical Analysis

Experiments were conducted in a masked fashion. Statistical analyses including Welch’s two-tailed t-test and linear regression were performed using GraphPad Prism version 9.0 (GraphPad Software, San Diego, CA, USA). Data are presented as mean ± standard deviation (SD). p-values and the number of data points (n) are indicated in the figures and figure legends.

Author Contributions

Conceptualization, S.I., J.K., and R.W.K.; methodology, S.I., J.K., and R.W.K.; software, S.I., J.K., and R.W.K.; validation, S.I., J.K., and R.W.K.; formal analysis, S.I., J.K., and R.W.K.; investigation, S.I., J.K., and R.W.K.; resources, R.W.K.; data curation, S.I., J.K., and R.W.K.; writing—original draft preparation, S.I. and R.W.K.; writing—review and editing, S.I., J.K., and R.W.K.; visualization, S.I., J.K., and R.W.K.; supervision, R.W.K.; project administration, R.W.K.; funding acquisition, R.W.K. All authors have read and agreed to the published version of the manuscript.

Funding

This study received funding from NEI grant R01EY020894 (R.W.K.), Vanderbilt Vision Research Center (P30EY008126), and the Departmental Unrestricted Award from Research to Prevent Blindness, Inc.

Institutional Review Board Statement

The study was conducted in accordance with the Declaration of Helsinki and approved by the Institutional Animal Care and Use Committee of Vanderbilt University (protocol code M1800053-02 and date of approval 14 March 2024).

Informed Consent Statement

Not applicable.

Data Availability Statement

The raw data supporting the conclusions of this article will be made available by the authors on request.

Conflicts of Interest

The authors declare no competing financial interests. The authors declare that this study received funding from the Departmental Unrestricted Award from Research to Prevent Blindness, Inc. The funder had no involvement.

References

  1. Burgoyne, C.F.; Crawford Downs, J.; Bellezza, A.J.; Francis Suh, J.-K.; Hart, R.T. The Optic Nerve Head as a Biomechanical Structure: A New Paradigm for Understanding the Role of IOP-Related Stress and Strain in the Pathophysiology of Glaucomatous Optic Nerve Head Damage. Prog. Retin. Eye Res. 2005, 24, 39–73. [Google Scholar] [CrossRef]
  2. Coudrillier, B.; Pijanka, J.K.; Jefferys, J.L.; Goel, A.; Quigley, H.A.; Boote, C.; Nguyen, T.D. Glaucoma-Related Changes in the Mechanical Properties and Collagen Micro-Architecture of the Human Sclera. PLoS ONE 2015, 10, e0131396. [Google Scholar] [CrossRef]
  3. Marcus, M.W.; de Vries, M.M.; Montolio, F.G.J.; Jansonius, N.M. Myopia as a Risk Factor for Open-Angle Glaucoma: A Systematic Review and Meta-Analysis. Ophthalmology 2011, 118, 1989–1994.e2. [Google Scholar] [CrossRef]
  4. Grytz, R.; Yang, H.; Hua, Y.; Samuels, B.C.; Sigal, I.A. Connective Tissue Remodeling in Myopia and Its Potential Role in Increasing Risk of Glaucoma. Curr. Opin. Biomed. Eng. 2020, 15, 40–50. [Google Scholar] [CrossRef]
  5. Elhawy, E.; Kamthan, G.; Dong, C.Q.; Danias, J. Pseudoexfoliation Syndrome, a Systemic Disorder with Ocular Manifestations. Hum. Genom. 2012, 6, 22. [Google Scholar] [CrossRef] [PubMed]
  6. Thorleifsson, G.; Magnusson, K.P.; Sulem, P.; Walters, G.B.; Gudbjartsson, D.F.; Stefansson, H.; Jonsson, T.; Jonasdottir, A.; Jonasdottir, A.; Stefansdottir, G.; et al. Common Sequence Variants in the LOXL1 Gene Confer Susceptibility to Exfoliation Glaucoma. Science 2007, 317, 1397–1400. [Google Scholar] [CrossRef] [PubMed]
  7. Csiszar, K. Lysyl Oxidases: A Novel Multifunctional Amine Oxidase Family. Prog. Nucleic Acid. Res. Mol. Biol. 2001, 70, 1–32. [Google Scholar] [CrossRef]
  8. Vallet, S.D.; Ricard-Blum, S. Lysyl Oxidases: From Enzyme Activity to Extracellular Matrix Cross-Links. Essays Biochem. 2019, 63, 349–364. [Google Scholar] [CrossRef] [PubMed]
  9. Liu, X.; Zhao, Y.; Gao, J.; Pawlyk, B.; Starcher, B.; Spencer, J.A.; Yanagisawa, H.; Zuo, J.; Li, T. Elastic Fiber Homeostasis Requires Lysyl Oxidase–like 1 Protein. Nat. Genet. 2004, 36, 178–182. [Google Scholar] [CrossRef]
  10. Wareham, L.K.; Kuchtey, J.; Wu, H.-J.; Krystofiak, E.; Wu, Y.; Reinhart-King, C.A.; Kuchtey, R.W. Lysyl Oxidase-like 1 Deficiency Alters Ultrastructural and Biomechanical Properties of the Peripapillary Sclera in Mice. Matrix Biol. Plus 2022, 16, 100120. [Google Scholar] [CrossRef]
  11. Pazos, M.; Yang, H.; Gardiner, S.K.; Cepurna, W.O.; Johnson, E.C.; Morrison, J.C.; Burgoyne, C.F. Expansions of the Neurovascular Scleral Canal and Contained Optic Nerve Occur Early in the Hypertonic Saline Rat Experimental Glaucoma Model. Exp. Eye Res. 2016, 145, 173–186. [Google Scholar] [CrossRef]
  12. Cooper, M.L.; Crish, S.D.; Inman, D.M.; Horner, P.J.; Calkins, D.J. Early Astrocyte Redistribution in the Optic Nerve Precedes Axonopathy in the DBA/2J Mouse Model of Glaucoma. Exp. Eye Res. 2016, 150, 22–33. [Google Scholar] [CrossRef]
  13. Wu, H.-J.; Hazlewood, R.J.; Kuchtey, J.; Kuchtey, R.W. Enlarged Optic Nerve Axons and Reduced Visual Function in Mice with Defective Microfibrils. eNeuro 2018, 5, ENEURO.0260-18.2018. [Google Scholar] [CrossRef] [PubMed]
  14. Wu, H.-J.; Krystofiak, E.; Kuchtey, J.; Kuchtey, R.W. Enhanced Optic Nerve Expansion and Altered Ultrastructure of Elastic Fibers Induced by Lysyl Oxidase Inhibition in a Mouse Model of Marfan Syndrome. Am. J. Pathol. 2024, 194, 1317–1328. [Google Scholar] [CrossRef] [PubMed]
  15. Caprioli, J.; de Leon, J.M.; Azarbod, P.; Chen, A.; Morales, E.; Nouri-Mahdavi, K.; Coleman, A.; Yu, F.; Afifi, A. Trabeculectomy Can Improve Long-Term Visual Function in Glaucoma. Ophthalmology 2016, 123, 117–128. [Google Scholar] [CrossRef] [PubMed]
  16. Saszik, S.M.; Robson, J.G.; Frishman, L.J. The Scotopic Threshold Response of the Dark-Adapted Electroretinogram of the Mouse. J. Physiol. 2002, 543, 899–916. [Google Scholar] [CrossRef]
  17. Levine, R.A.; Demirel, S.; Fan, J.; Keltner, J.L.; Johnson, C.A.; Kass, M.A.; the Ocular Hypertension Treatment Study Group. Asymmetries and Visual Field Summaries as Predictors of Glaucoma in the Ocular Hypertension Treatment Study. Investig. Ophthalmol. Vis. Sci. 2006, 47, 3896–3903. [Google Scholar] [CrossRef]
  18. Weinreb, R.N.; Leung, C.K.S.; Crowston, J.G.; Medeiros, F.A.; Friedman, D.S.; Wiggs, J.L.; Martin, K.R. Primary Open-Angle Glaucoma. Nat. Rev. Dis. Primer 2016, 2, 1–19. [Google Scholar] [CrossRef]
  19. Kuchtey, R.W.; Insignares, S.; Yang, T.S.; Kuchtey, J. In Search of Mouse Models for Exfoliation Syndrome. Am. J. Ophthalmol. 2024, 267, 271–285. [Google Scholar] [CrossRef]
  20. Zhang, H.; Zhou, J.; Yang, L.; Zhang, X.; Shi, W.; Yang, H.; Zhang, G.; She, J.; Li, H. Sex Differences in Ocular Biometric Measurements: A Twin Study. Front. Med. 2022, 9, 936738. [Google Scholar] [CrossRef]
  21. Miao, A.; Tang, Y.; Zhu, X.; Qian, D.; Zheng, T.; Lu, Y. Associations between Anterior Segment Biometry and High Axial Myopia in 3438 Cataractous Eyes in the Chinese Population. BMC Ophthalmol. 2022, 22, 71. [Google Scholar] [CrossRef] [PubMed]
  22. Wiggs, J.L.; Pawlyk, B.; Connolly, E.; Adamian, M.; Miller, J.W.; Pasquale, L.R.; Haddadin, R.I.; Grosskreutz, C.L.; Rhee, D.J.; Li, T. Disruption of the Blood–Aqueous Barrier and Lens Abnormalities in Mice Lacking Lysyl Oxidase-Like 1 (LOXL1). Investig. Ophthalmol. Vis. Sci. 2014, 55, 856–864. [Google Scholar] [CrossRef] [PubMed]
  23. Suarez, M.F.; Schmitt, H.M.; Kuhn, M.S.; Watkins, T.; Hake, K.M.; Weisz, T.; Flynn, E.J., III.; Elliott, M.H.; Hauser, M.A.; Stamer, W.D. Genetic Background Determines Severity of Loxl1-Mediated Systemic and Ocular Elastosis in Mice. Dis. Model. Mech. 2023, 16, dmm050392. [Google Scholar] [CrossRef] [PubMed]
  24. Bui, B.V.; Fortune, B. Ganglion Cell Contributions to the Rat Full-Field Electroretinogram. J. Physiol. 2004, 555, 153–173. [Google Scholar] [CrossRef]
  25. Weinreb, R.N.; Aung, T.; Medeiros, F.A. The Pathophysiology and Treatment of Glaucoma: A Review. JAMA 2014, 311, 1901–1911. [Google Scholar] [CrossRef]
  26. Armaly, M.F. Cup/disc Ratio in Early Open-Angle Glaucoma. Doc. Ophthalmol. 1969, 26, 526–533. [Google Scholar] [CrossRef]
  27. Sullivan-Mee, M.; Ruegg, C.C.; Pensyl, D.; Halverson, K.; Qualls, C. Diagnostic Precision of Retinal Nerve Fiber Layer and Macular Thickness Asymmetry Parameters for Identifying Early Primary Open-Angle Glaucoma. Am. J. Ophthalmol. 2013, 156, 567–577.e1. [Google Scholar] [CrossRef]
  28. Jonas, J.B.; Fernández, M.C.; Naumann, G.O.H. Correlation of the Optic Disc Size to Glaucoma Susceptibility. Ophthalmology 1991, 98, 675–680. [Google Scholar] [CrossRef]
  29. Jonas, J.B.; Schmidt, A.M.; Müller-Bergh, J.A.; Schlötzer-Schrehardt, U.M.; Naumann, G.O. Human Optic Nerve Fiber Count and Optic Disc Size. Investig. Ophthalmol. Vis. Sci. 1992, 33, 2012–2018. [Google Scholar]
  30. Weinreb, R.N.; Zangwill, L.M.; Jain, S.; Becerra, L.M.; Dirkes, K.; Piltz-Seymour, J.R.; Cioffi, G.A.; Trick, G.L.; Coleman, A.L.; Brandt, J.D.; et al. Predicting the Onset of Glaucoma. Ophthalmology 2010, 117, 1674–1683. [Google Scholar] [CrossRef]
  31. Nishida, T.; Pham, V.Q.; Moghimi, S.; Girkin, C.A.; Fazio, M.A.; Liebmann, J.M.; Zangwill, L.M.; Weinreb, R.N. Optic Disc Size and Circumpapillary Retinal Nerve Fiber Layer Thinning in Glaucoma. Ophthalmol. Glaucoma 2025, 8, 343–350. [Google Scholar] [CrossRef]
  32. Sultan, G.; Baudouin, C.; Auzerie, O.; De Saint Jean, M.; Goldschild, M.; the Marfan Study Group; Pisella, P.-J. Cornea in Marfan Disease: Orbscan and In Vivo Confocal Microscopy Analysis. Investig. Ophthalmol. Vis. Sci. 2002, 43, 1757–1764. [Google Scholar]
  33. Correia Barão, R.; Santos, M.; Marques, R.E.; Quintas, A.M.; Guerra, P. Keratoconus Tomographic Indices in Osteogenesis Imperfecta. Graefes Arch. Clin. Exp. Ophthalmol. 2023, 261, 2585–2592. [Google Scholar] [CrossRef]
  34. Guo, D.; Liu, L.; Yang, F.; Young, C.A.; Zheng, D.; Jin, G. Characteristics and Genotype–Phenotype Correlations in ADAMTS17 Mutation–Related Weill–Marchesani Syndrome. Exp. Eye Res. 2023, 234, 109606. [Google Scholar] [CrossRef]
  35. Loeys, B.L.; Dietz, H.C.; Braverman, A.C.; Callewaert, B.L.; Backer, J.D.; Devereux, R.B.; Hilhorst-Hofstee, Y.; Jondeau, G.; Faivre, L.; Milewicz, D.M.; et al. The Revised Ghent Nosology for the Marfan Syndrome. J. Med. Genet. 2010, 47, 476–485. [Google Scholar] [CrossRef]
  36. De Maria, A.; Wilmarth, P.A.; David, L.L.; Bassnett, S. Proteomic Analysis of the Bovine and Human Ciliary Zonule. Investig. Ophthalmol. Vis. Sci. 2017, 58, 573–585. [Google Scholar] [CrossRef] [PubMed]
  37. Ritch, R.; Schlötzer-Schrehardt, U. Exfoliation Syndrome. Surv. Ophthalmol. 2001, 45, 265–315. [Google Scholar] [CrossRef]
  38. Tang, T.; Ren, C.; Cai, Y.; Li, Y.; Wang, K.; Zhao, M. Lifelong Changes in the Choroidal Thickness, Refractive Status, and Ocular Dimensions in C57BL/6J Mouse. Investig. Ophthalmol. Vis. Sci. 2024, 65, 26. [Google Scholar] [CrossRef] [PubMed]
  39. Boland, M.V.; Quigley, H.A. Risk Factors and Open-Angle Glaucoma: Classification and Application. J. Glaucoma 2007, 16, 406. [Google Scholar] [CrossRef] [PubMed]
  40. Jonas, J.B.; Bikbov, M.M.; Kazakbaeva, G.M.; Wang, Y.X.; Xu, J.; Nangia, V.; Nangia, P.V.; Panda-Jonas, S. Positive and Negative Associations of Myopia with Ocular Diseases in Population-Based Studies. Ophthalmology 2024, 131, 1427–1435. [Google Scholar] [CrossRef]
  41. Huh, M.G.; Jeong, Y.; Shin, Y.I.; Kim, Y.K.; Jeoung, J.W.; Park, K.H. Assessing Glaucoma Severity and Progression in Individuals with Asymmetric Axial Length: An Intrapatient Comparative Study. Ophthalmology 2025, 132, 39–51. [Google Scholar] [CrossRef]
  42. Ha, A.; Kim, C.Y.; Shim, S.R.; Chang, I.B.; Kim, Y.K. Degree of Myopia and Glaucoma Risk: A Dose-Response Meta-Analysis. Am. J. Ophthalmol. 2022, 236, 107–119. [Google Scholar] [CrossRef] [PubMed]
  43. Ding, C.; Wang, P.; Tian, N. Effect of General Anesthetics on IOP in Elevated IOP Mouse Model. Exp. Eye Res. 2011, 92, 512–520. [Google Scholar] [CrossRef] [PubMed]
  44. Dalvin, L.A.; Fautsch, M.P. Analysis of Circadian Rhythm Gene Expression With Reference to Diurnal Pattern of Intraocular Pressure in Mice. Investig. Ophthalmol. Vis. Sci. 2015, 56, 2657–2663. [Google Scholar] [CrossRef]
  45. Wu, H.-J.; Mortlock, D.P.; Kuchtey, R.W.; Kuchtey, J. Altered Ocular Fibrillin Microfibril Composition in Mice With a Glaucoma-Causing Mutation of Adamts10. Investig. Ophthalmol. Vis. Sci. 2021, 62, 26. [Google Scholar] [CrossRef]
  46. Bermudez, M.A.; Vicente, A.F.; Romero, M.C.; Arcos, M.D.; Abalo, J.M.; Gonzalez, F. Time Course of Cold Cataract Development in Anesthetized Mice. Curr. Eye Res. 2011, 36, 278–284. [Google Scholar] [CrossRef]
  47. Koehn, D.; Meyer, K.J.; Syed, N.A.; Anderson, M.G. Ketamine/Xylazine-Induced Corneal Damage in Mice. PLoS ONE 2015, 10, e0132804. [Google Scholar] [CrossRef] [PubMed]
  48. Sadun, A.A.; Smith, L.E.; Kenyon, K.R. Paraphenylenediamine: A New Method for Tracing Human Visual Pathways. J. Neuropathol. Exp. Neurol. 1983, 42, 200–206. [Google Scholar] [CrossRef]
  49. Schindelin, J.; Arganda-Carreras, I.; Frise, E.; Kaynig, V.; Longair, M.; Pietzsch, T.; Preibisch, S.; Rueden, C.; Saalfeld, S.; Schmid, B.; et al. Fiji: An Open-Source Platform for Biological-Image Analysis. Nat. Methods 2012, 9, 676–682. [Google Scholar] [CrossRef]
  50. Inman, D.M.; Sappington, R.M.; Horner, P.J.; Calkins, D.J. Quantitative Correlation of Optic Nerve Pathology with Ocular Pressure and Corneal Thickness in the DBA/2 Mouse Model of Glaucoma. Investig. Ophthalmol. Vis. Sci. 2006, 47, 986–996. [Google Scholar] [CrossRef]
  51. Goyal, V.; Read, A.T.; Ritch, M.D.; Hannon, B.G.; Rodriguez, G.S.; Brown, D.M.; Feola, A.J.; Hedberg-Buenz, A.; Cull, G.A.; Reynaud, J.; et al. AxoNet 2.0: A Deep Learning-Based Tool for Morphometric Analysis of Retinal Ganglion Cell Axons. Transl. Vis. Sci. Technol. 2023, 12, 9. [Google Scholar] [CrossRef] [PubMed]
Figure 1. Loxl1−/− mice have enlarged optic nerves compared with wt mice. (A) At 12 months old, Loxl1−/− mice had enlarged optic nerve cross-sectional areas compared with wt mice at both 4 and 12 months of age (4 m: 106 ± 5.7 µm2 (Loxl1−/−) vs. 94.4 ± 6.3 µm2 (wt); 12m: 123 ± 8.4 µm2 (Loxl1−/−) vs. 109 ± 9.9 µm2 (wt); ** p < 0.01, *** p < 0.001). (B) No decrease in total axon count was seen in Loxl1−/− mice. (C) There was a borderline decrease in axon density in Loxl1−/− mice at 12 months old (p = 0.07). Genotypes and ages of mice are denoted under the horizontal axis, and number of eyes in each grouping are indicated above the horizontal axis.
Ijms 26 09221 g001
Figure 2. Loxl1−/− mice have reduced RGC function compared with wt mice at 12 months of age. Positive scotopic threshold response (pSTR) ERG waveforms of individual mice (gray traces in (A,B)) and average waveforms (blue trace in (A) and green trace in (B)) in response to flash intensities of −5 log cd·s/m2 are shown. The decreased amplitude and increased latency of pSTR in Loxl1−/− mice (green) compared with wt mice (blue) is demonstrated in (C). The statistically significant reduction in pSTR amplitude and increase in latency in Loxl1−/− compared with wt mice are quantified in (D,F). Loxl1−/− eye asymmetry is shown in (E,G). Genotype is indicated at the top of (A,B), and the number in each group is indicated above the horizontal axis in (D,E). ** p < 0.01, *** p < 0.001.
Ijms 26 09221 g002
Figure 3. Loxl1−/− mice have age-related progressive reduction in RGC function compared with wt mice. The average amplitude (A) and latency (B) of pSTR at 4-, 12-, and 16-month-old wt (blue in (A,B)) and Loxl1−/− (green in (A,B)) mice. Linear regressions (equations for Loxl1−/− on the top and wt on the bottom of the graph in (A,B)) reveal progressive reductions in pSTR amplitude (A) and increased latency (B) in Loxl1−/− mice, whereas wt mice remain relatively stable. The magnitudes of age-related change in both pSTR amplitude and latency are significantly different between Loxl1−/− and wt mice (p = 0.001 for pSTR amplitude in A and p = 0.007 for pSTR latency in (B)).
Ijms 26 09221 g003
Figure 4. Age-related biometric changes in Loxl1−/− and wt mice. Differences between wt (blue) and Loxl1−/− mice (green) in CCT (A), ACD (B), lens axial thickness (LAT) (C), and AL (D) are shown in mice at 4, 12, and 16 months of age. Most measurements between the 3 ages are significantly different (* p < 0.05, ** p < 0.01, *** p < 0.001). Linear regressions (equations for Loxl1−/− on the top and wt on the bottom of the graph in (A’D’)) reveal relatively stable CCT (A’) in both wt and Loxl1−/− mice, whereas progressive deepening of ACD (B’), thickening of LAT (C’), and elongation of AL (D’) occurs in both groups. The magnitudes of age-related change in both ACD and AL are significantly different between Loxl1−/− and wt mice (p = 6.1 × 10⁻¹² for ACD in (B’) and p = 0.005 for AL in (D’)).
Ijms 26 09221 g004
Figure 5. Biometric measurement differences related to sex. The differences between male (blue) and female (pink) mice are statistically significant for CCT (p = 0.0289 in (A’)) in Loxl1−/− mice (green circles shown in (A’)), LT (p = 0.007 in (C’)) in wt mice (blue circles shown in (C’)), and AL (p = 0.0006 in (D’)) in wt mice (blue circles shown in (D’)). (A), (B), (C) and (D) are identical to (A), (B), (C) and (D) in Figure 4, respectively. * p < 0.05, ** p < 0.01, *** p < 0.001.
Ijms 26 09221 g005
Figure 6. Increased axial length (AL) elongation was correlated with decreased pSTR amplitude. Analysis of combined 12- and 16-month-data from both genotypes (wt: blue; Loxl1−/−: green) shows significant correlation of decreased pSTR amplitude with increased AL ((A); p = 0.0007), but no significant correlation between pSTR latency with globe elongation ((B); p = 0.15).
Ijms 26 09221 g006
Figure 7. No change over time or between genotypes in IOP or visual acuity. IOP of wt (blue) and Loxl1−/− (green) mice is similar at all 3 ages and remains relatively constant (A). Visual acuity, measured by optomotor reflex, remains similar between groups at all 3 ages and relatively stable throughout (B). Genotypes and ages of mice are denoted under the horizontal axes and the number of eyes in each genotype and age group are indicated above the horizontal axes.
Ijms 26 09221 g007
Disclaimer/Publisher’s Note: The statements, opinions and data contained in all publications are solely those of the individual author(s) and contributor(s) and not of MDPI and/or the editor(s). MDPI and/or the editor(s) disclaim responsibility for any injury to people or property resulting from any ideas, methods, instructions or products referred to in the content.