Article

Genome-Wide Identification of the KAN Gene Family and Expression Profiles During the Fruit Developmental Stages in Prunus mume

by
Minglu Li
,
Xiao Huang
,
Ximeng Lin
,
Ziqi Wang
,
Feng Gao
and
Zhihong Gao
*
Laboratory of Fruit Tree Biotechnology, College of Horticulture, Nanjing Agricultural University, Nanjing 210095, China
*
Author to whom correspondence should be addressed.
These authors contributed equally to this work.
Int. J. Mol. Sci. 2025, 26(18), 9121; https://doi.org/10.3390/ijms26189121
Submission received: 23 June 2025 / Revised: 8 September 2025 / Accepted: 15 September 2025 / Published: 18 September 2025
(This article belongs to the Section Molecular Plant Sciences)

Abstract

KANADI (KAN) transcription factors are pivotal regulators of lateral organ polarity establishment in plants. Although extensively studied in herbaceous plants, the role of KAN genes in woody plant development remains unclear. This study conducts the first comprehensive analysis of 26 PmKAN genes in Prunus mume, elucidating their evolutionary trajectories, structural configurations, tissue-specific expression patterns and potential roles in root and fruit development. Phylogenetic analysis of four Rosaceae species and Arabidopsis thaliana clustered these PmKANs into five subfamilies, with conserved motif patterns supporting this classification. Chromosomal localization revealed that all PmKAN members are distributed across eight chromosomes, with tandem duplications events and syntenic relationships indicating functional diversification driven by gene family expansion. Cis-regulatory element analysis identified light-responsive, hormone-associated, stress-related, and developmental motifs, suggesting PmKAN genes are involved in regulating plant physiological processes and development. The qRT-PCR analysis revealed tissue-specific expression heterogeneity among PmKAN genes, with markedly elevated expression particularly observed in roots and fruits. Further expression profiling across fruit developmental stages suggests potential stage-specific functional divergence of PmKAN genes during fruit development. This study provides a theoretical foundation for further investigating the evolutionary relationships and molecular regulatory mechanisms of the PmKAN gene family.

1. Introduction

The KANADI gene family, belonging to the GARP subfamily of transcription factors under the MYB superfamily, exhibits highly conserved characteristic domains [1]. Initially identified in the model plant Arabidopsis thaliana, this family comprises four members (AtKAN1-4) characterized by a genomic structure containing six exons and a single open reading frame (ORF) of 403 amino acids (predicted molecular weight: 45.8 kDa), featuring a 56-amino acid GARP conserved domain with two histidine residues [1,2]. Subsequent investigations have revealed KAN orthologs in diverse plant species including Zea mays [3], Oryza sativa [4], Nicotiana benthamiana [5], and Populus trichocarpa [6]. The evolutionarily conserved GARP domain facilitates critical biological processes such as chloroplast differentiation, cytokinin signalling transduction, phosphorus metabolism, and organ polarity establishment [7]. At the same time, recent studies have documented the existence of this gene family in spore-bearing plants like ferns [8,9], current research predominantly focuses on herbaceous model species. However, functional characterization in woody plants remains largely unexplored, representing a significant knowledge gap in understanding the full spectrum of KANADI gene functions across plant taxa.
Previous studies indicate that the KANADI (KAN) genes are specifically expressed in the distal differentiation zone of lateral organs and in the phloem tissues of the vascular system during early plant development [10,11]. These genes regulate polarity establishment by maintaining abaxial identity while suppressing adaxial characteristics [2]. The Arabidopsis thaliana genome harbours four functionally redundant KAN paralogs (KAN1-4), where single-gene mutants display negligible phenotypic deviations, whereas double or triple mutants exhibit severe abaxial polarity defects. For instance, KAN1/KAN2 double mutants develop narrow leaves with abaxial protrusions and adaxialised floral organs, while KAN1/KAN2/KAN3 triple mutants produce mature leaves with multi-planar expansion, forming elongated blades with fan-shaped distal regions [1,12]. These observations confirm substantial functional redundancy within the Arabidopsis thaliana KAN family. In the monocots, the rice KAN ortholog SHALLOT-LIKE1 (SLL1) localizes specifically to leaf abaxial domains. SLL1 loss-of-function mutants exhibit abaxial polarity loss, triggering mesophyll cell apoptosis alongside ectopic adaxial features such as chloroplast overaccumulation and enhanced photosynthesis. In contrast, SLL1 overexpression enhances phloem development, suppresses palisade tissue formation, and induces dwarfism with leaf curling [4]. Similarly, maize MILKWEED POD1 (MWP1) regulates dorsoventral polarity, as evidenced by the pronounced abaxialisation in dominant mwp-R gain-of-function mutants [13].
The KANADI gene family is well-established as a critical regulator of polarity establishment in vegetative organs such as leaves and roots, while its roles in other developmental traits remain under investigation. Molecular studies demonstrate that KANADI transcription factors directly bind target loci to regulate abaxial identity. For instance, OsKANADI1 in rice (Oryza sativa) interacts with promoters of grain size-related genes, suggesting regulatory roles in seed morphogenesis [14]. Mechanistic investigations reveal OsKANADI1 binds the intronic region of OsARF3a, synergizing with tasiR-ARFs pathways to maintain OsARF3a expression levels for proper lemma development [15]. Recent findings show Oskan1 mutants exhibit constitutive semi-dwarfism with shortened internodes. Molecular profiling identifies OsKAN1 as a transcriptional repressor of OsYAB5, forming a functional OsKAN1-YAB5 complex that suppresses OsGA2ox6 expression, thereby reducing bioactive gibberellin levels and inhibiting cell elongation [16]. Current research on the KAN gene family has primarily focused on herbaceous plants, while studies on its role in the growth and development of woody plants remain limited, with the underlying molecular mechanisms still poorly understood.
Prunus mume (P. mume) is a member of the Rosaceae (Prunus L.) fruit tree native to southwestern China, and has been cultivated in East Asia (including Japan) for over seven millennia. Its fruits contain substantial amounts of minerals and bioactive compounds, demonstrating significant pharmaceutical and commercial potential [17]. Recent advancements in molecular biology and bioinformatics have enabled genome-wide identification and functional characterization of plant genes [18,19]. Although extensive studies on KAN genes have been conducted in various species, a systematic analysis of this gene family in P. mume remains unexplored. In this study, we employed a combination of bioinformatic approaches to identify and characterize the KAN gene family in P. mume. Furthermore, qRT-PCR was utilized to analyze the tissue-specific expression patterns of PmKAN genes. This work aims to establish a foundation for further investigation into the biological functions of these genes.

2. Results

2.1. Identification of KAN Family Members in P. mume Genome

Using IQ-TREE, a phylogenetic tree was constructed from the amino acid sequences of 97 KAN genes. This dataset comprised 26, 4, 19, 25, and 23 KAN genes from P. mume, A. thaliana, F. vesca, P. salicina, and P. armeniaca, respectively. Based on sequence similarity, these proteins, including the 26 PmKANs from P. mume, were categorized into five groups (Figure 1). The distribution of PmKAN genes varied across these subgroups: Group I, II, and V contained the highest number (7 representatives each), while Group III had the fewest (2 representatives). All PmKAN family members clustered closely with homologous genes from the other three Rosaceae species, indicating a close evolutionary relationship and suggesting potential functional conservation.
Through systematic filtering using PlantTFDB to eliminate duplicate sequences and those lacking DNA-binding domains (DBD), 26 KAN family members (PmKAN1PmKAN26) were identified in P. mume, as catalogued in Table 1. Comprehensive physicochemical profiling revealed significant molecular divergence: amino acid lengths spanned 240 residues (PmKAN10/15) to 496 residues (PmKAN18/26), with molecular weights ranging from 26.7 kDa (PmKAN10) to 54.3 kDa (PmKAN26). The isoelectric points (pI) ranged from 5.09 for PmKAN16 to 9.16 for PmKAN2. About 61.54% (16/26) had a pI above 7.0, showing that most PmKAN proteins are basic in nature. Instability index values went from 37.42 for PmKAN20 to 75.71 for PmKAN13. Aliphatic index values varied from 56.94 for PmKAN26 to 81.03 for PmKAN7.
Hydrophobicity analysis (GRAVY scores: −1.06 to −0.352) confirmed that 96.2% (25/26) of PmKANs were hydrophilic (<−0.5), with only PmKAN7 (−0.352) exhibiting amphipathic properties. Collectively, these findings demonstrate that most P. mume KAN proteins are alkaline, hydrophilic, and structurally unstable. Sequence alignment of 30 KAN proteins (26 from P. mume and 4 from A. thaliana) revealed the conserved presence of a canonical GARP domain (Figure 2).

2.2. Secondary Structure Analysis of PmKAN Protein

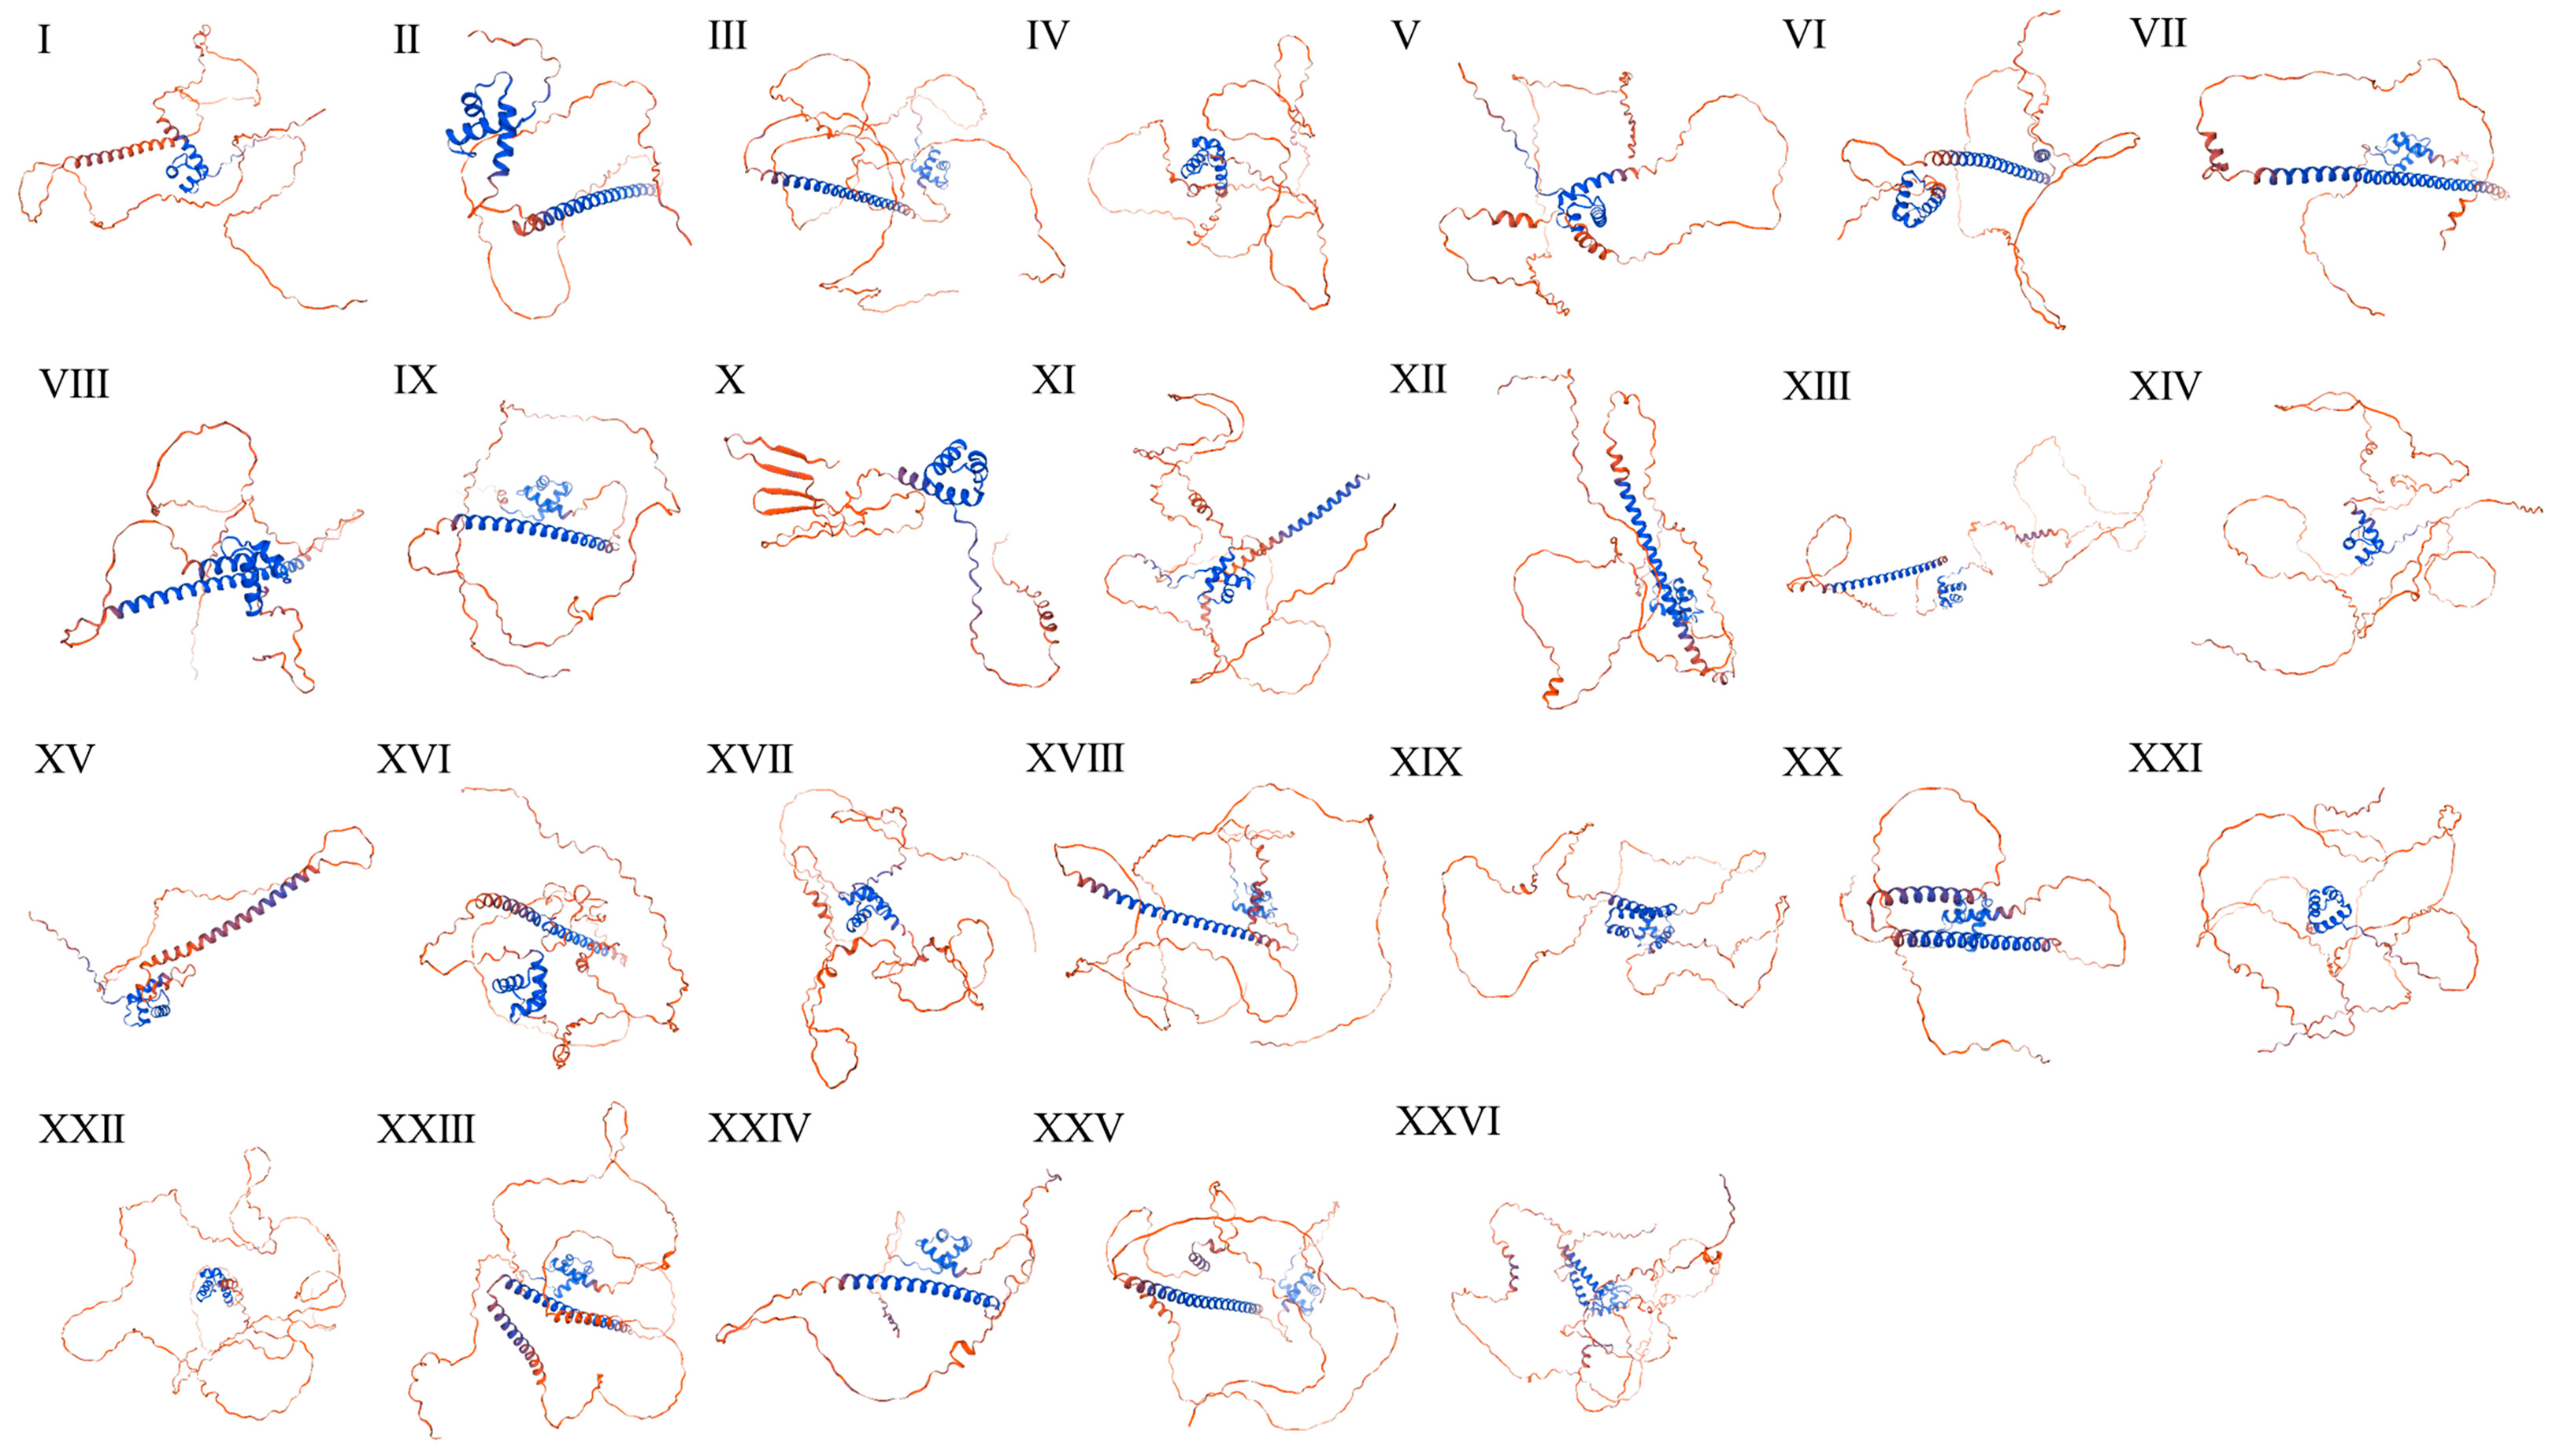
Secondary structure analysis of P. mume KANADI proteins (Table 2) identified five structural elements: coil regions, 310 helices, α helix, random coils, β Strand and β turn. Coil regions (68.49~90.85%) and α helices (6.81~28.62%) dominated the structural composition, while other elements each accounted for <5%. The prediction of tertiary structures for 26 KANADI proteins using SWISS-MODEL revealed conserved structural architectures dominated by coil regions and α helices, consistent with secondary structure predictions (Figure 3). Significantly, proteins within the same subfamily exhibited similar secondary structure proportions and partial structural homology, though conformational variations were observed. These structural divergences, potentially arising from differences in element length and spatial arrangement, may underlie functional differentiation.

2.3. Gene Structures, Protein Conserved Domain and Motif Compositions of PmKAN Proteins

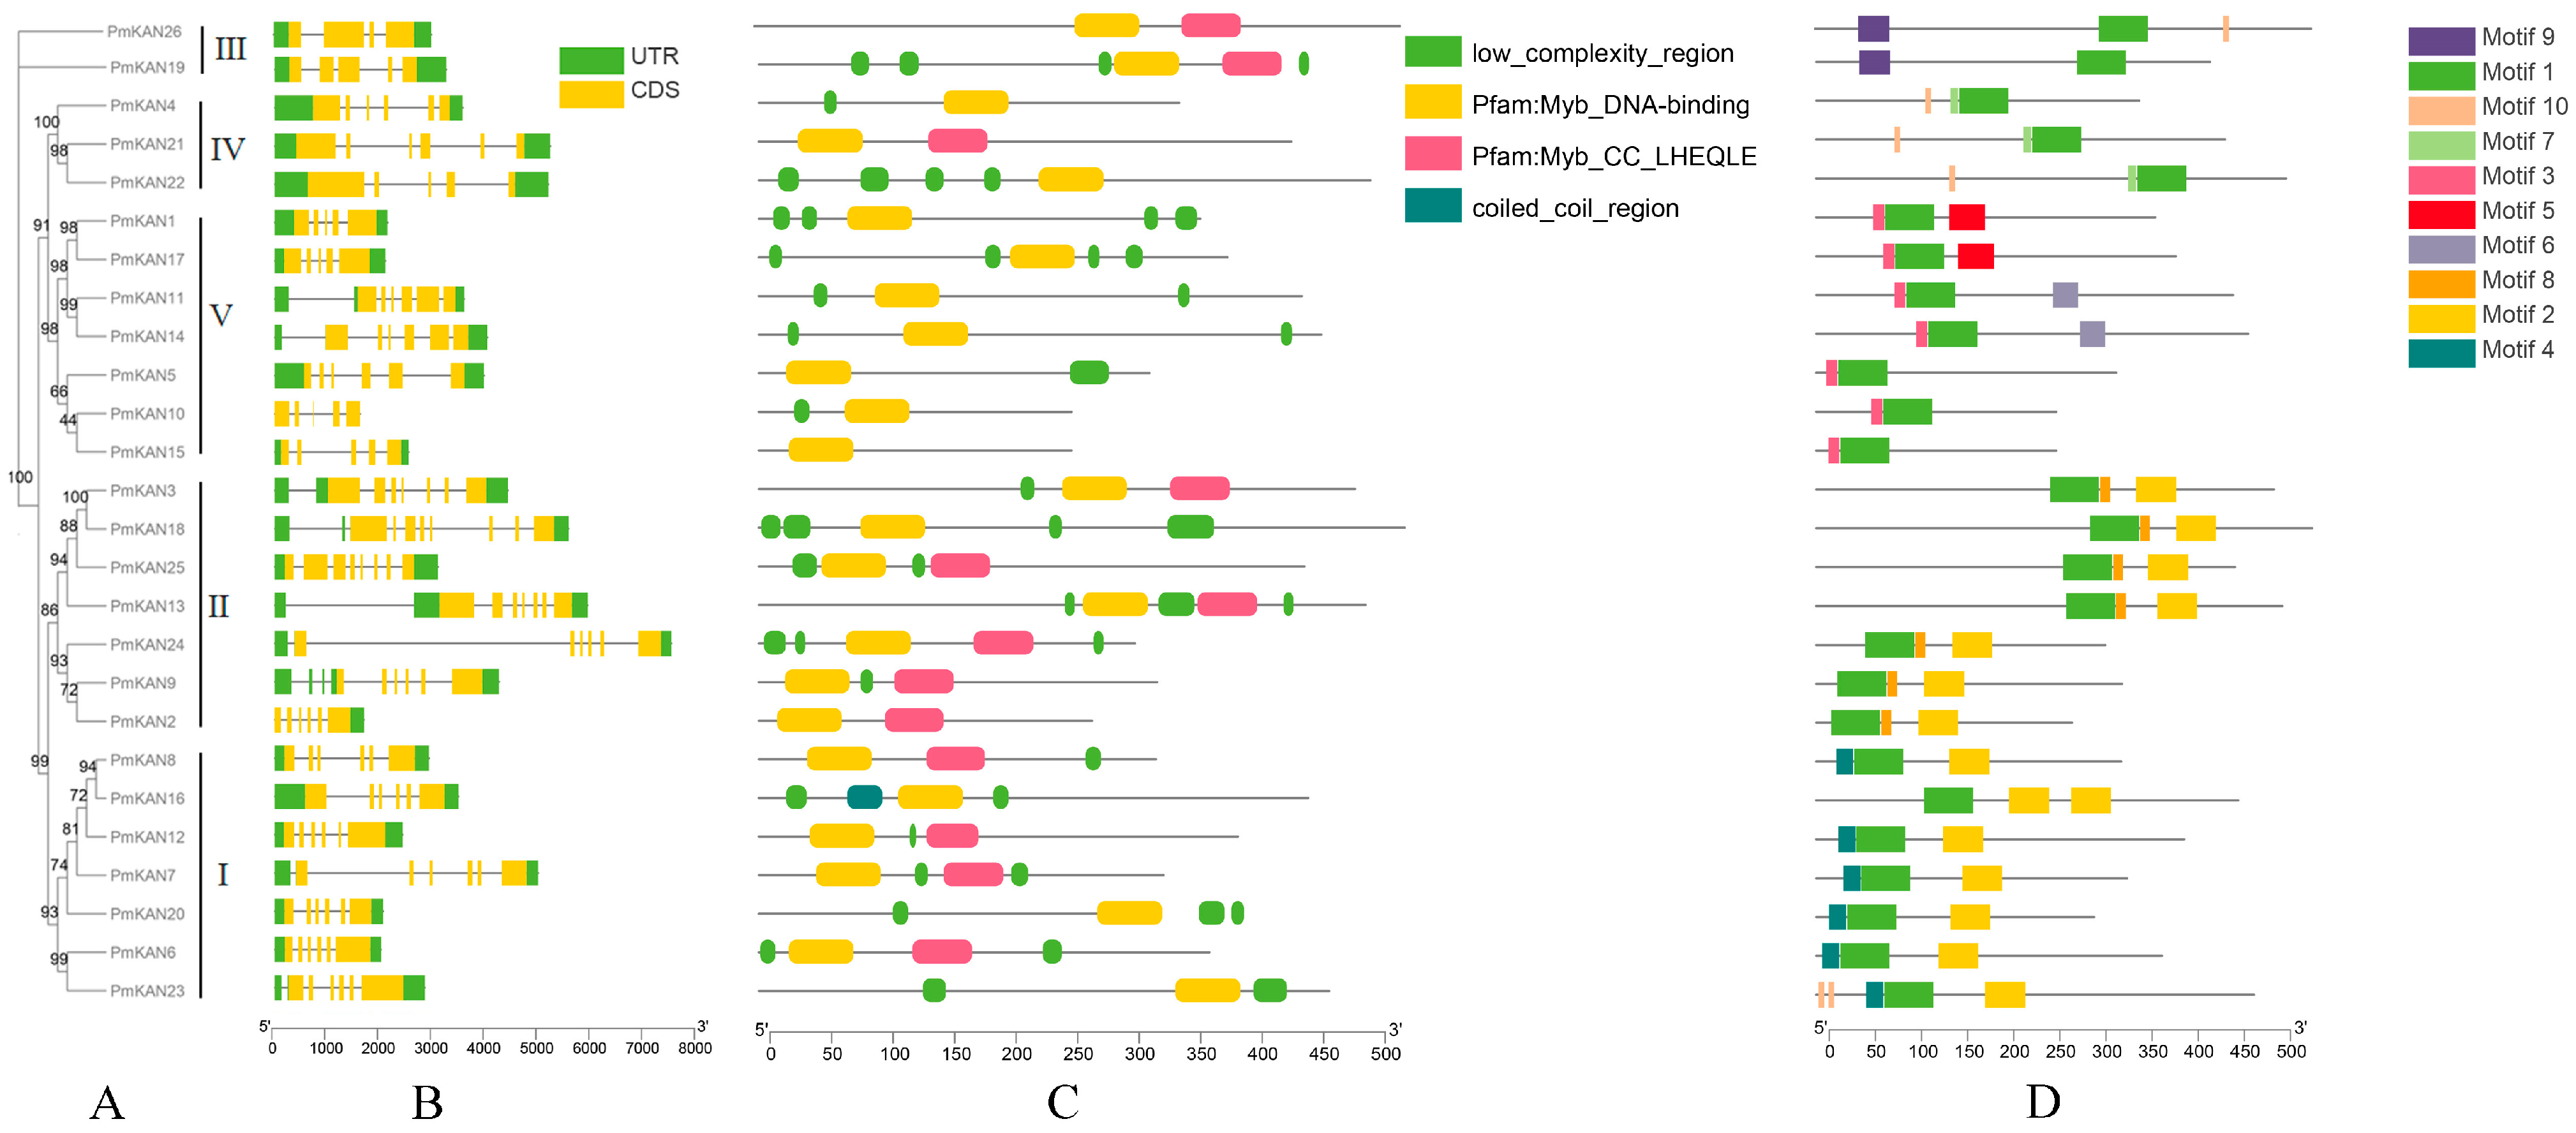
To investigate the structural diversity of KAN genes in P. mume, we performed an analysis of the gene structure (Figure 4). Structural analysis of PmKAN genes (Figure 4B) revealed exon numbers ranging from 4 to 8. While PmKAN26 contained four exons, PmKAN18 and PmKAN25 possessed a maximum of eight. Fifteen members (PmKAN4, PmKAN21, PmKAN11, PmKAN14, PmKAN5, PmKAN24, PmKAN2, PmKAN9, PmKAN8, PmKAN16, PmKAN7, PmKAN12, PmKAN20, PmKAN6, and PmKAN23), constituting over half of the family, exhibited six exons. Seven-exon configurations were observed in PmKAN3 and PmKAN13. Most PmKAN members maintained both 5′UTR and 3′UTR regions critical for mRNA stability and microRNA interaction, except PmKAN2, which lacked the 5′UTR. Remarkably, PmKAN10 displayed intron-less architectures, suggesting evolutionary conservation.
Domain characterization demonstrated that, as members of the MYB gene family, all PmKAN members contain the Myb-DNA-binding conserved domains (Figure 4C). Class I and II members additionally harboured Myb-CC_LHEQLE domains, with coiled-coil regions exclusively present in PmKAN16. MEME/TBtools analyses identified ten conserved motifs (motif1–motif10) within 500 amino acid sequences (Figure 4D). Most PmKAN genes contained 2–5 motifs, showing no direct correlation between exon structure and subfamily classification. However, phylogenetic analysis showed that certain motif patterns were conserved. Motif1 was found in all proteins. Motif9 was specific to Class III (PmKAN19 and PmKAN26), motif10 was found in Class IV (PmKAN4, PmKAN21, and PmKAN22), and motif3 was typical of Class V (PmKAN1, PmKAN17, PmKAN11, PmKAN14, PmKAN5, PmKAN10, and PmKAN15). Classes II and IV shared similar motif patterns, suggesting a close evolutionary link, while Classes I, III, and V had distinct patterns, pointing to different evolutionary paths.

2.4. Chromosomal Distributions Analysis of PmKAN Genes

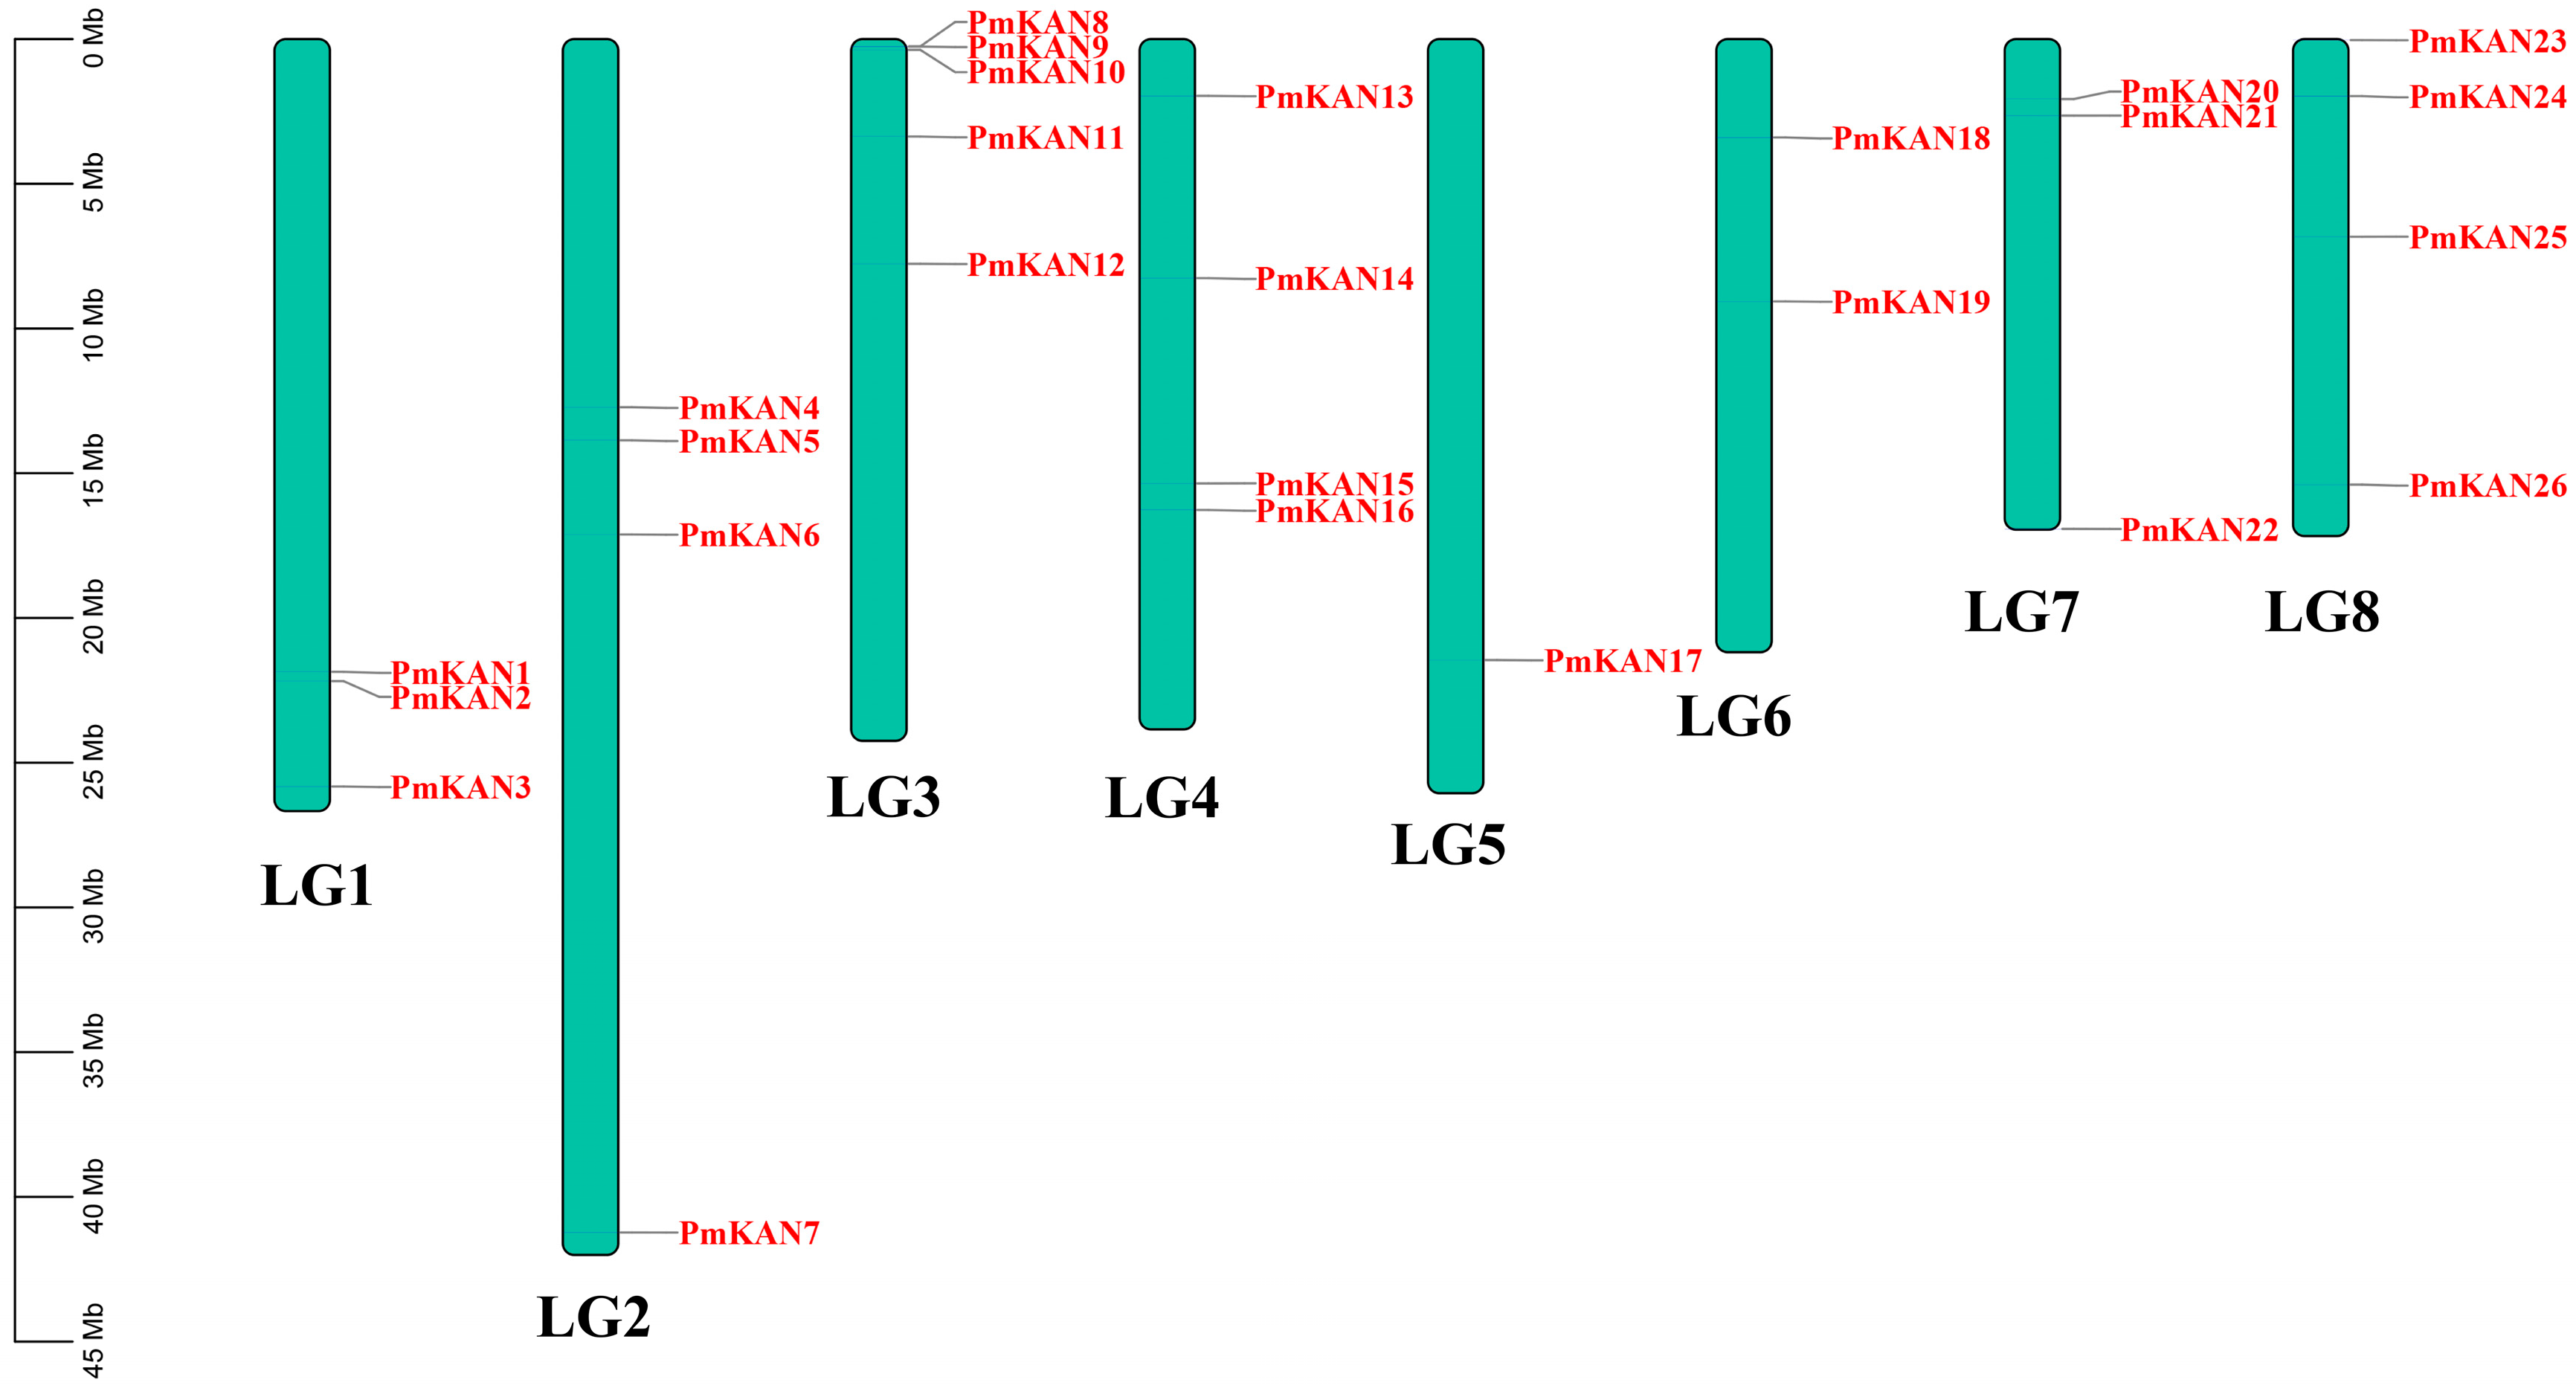
Chromosomal localisation significantly influences gene functional dynamics. Our analysis revealed uneven distribution of 26 PmKAN genes across eight chromosomes in P. mume (Figure 5). Chromosome 3 exhibited the highest gene density with five loci, followed by chromosomes 2/4/8 (four genes each), chromosomes 1 and 7 (three each), chromosome 6 (two), and chromosome 5 containing a single locus. Three duplication types (whole-genome, segmental, tandem) were identified, with tandem duplications defined as chromosomal regions ≤ 200 kb containing ≥ 2 genes. And we find a tandem duplication cluster (PmKAN810) on chromosome 3, which suggests evolutionary expansion through genomic duplication events.
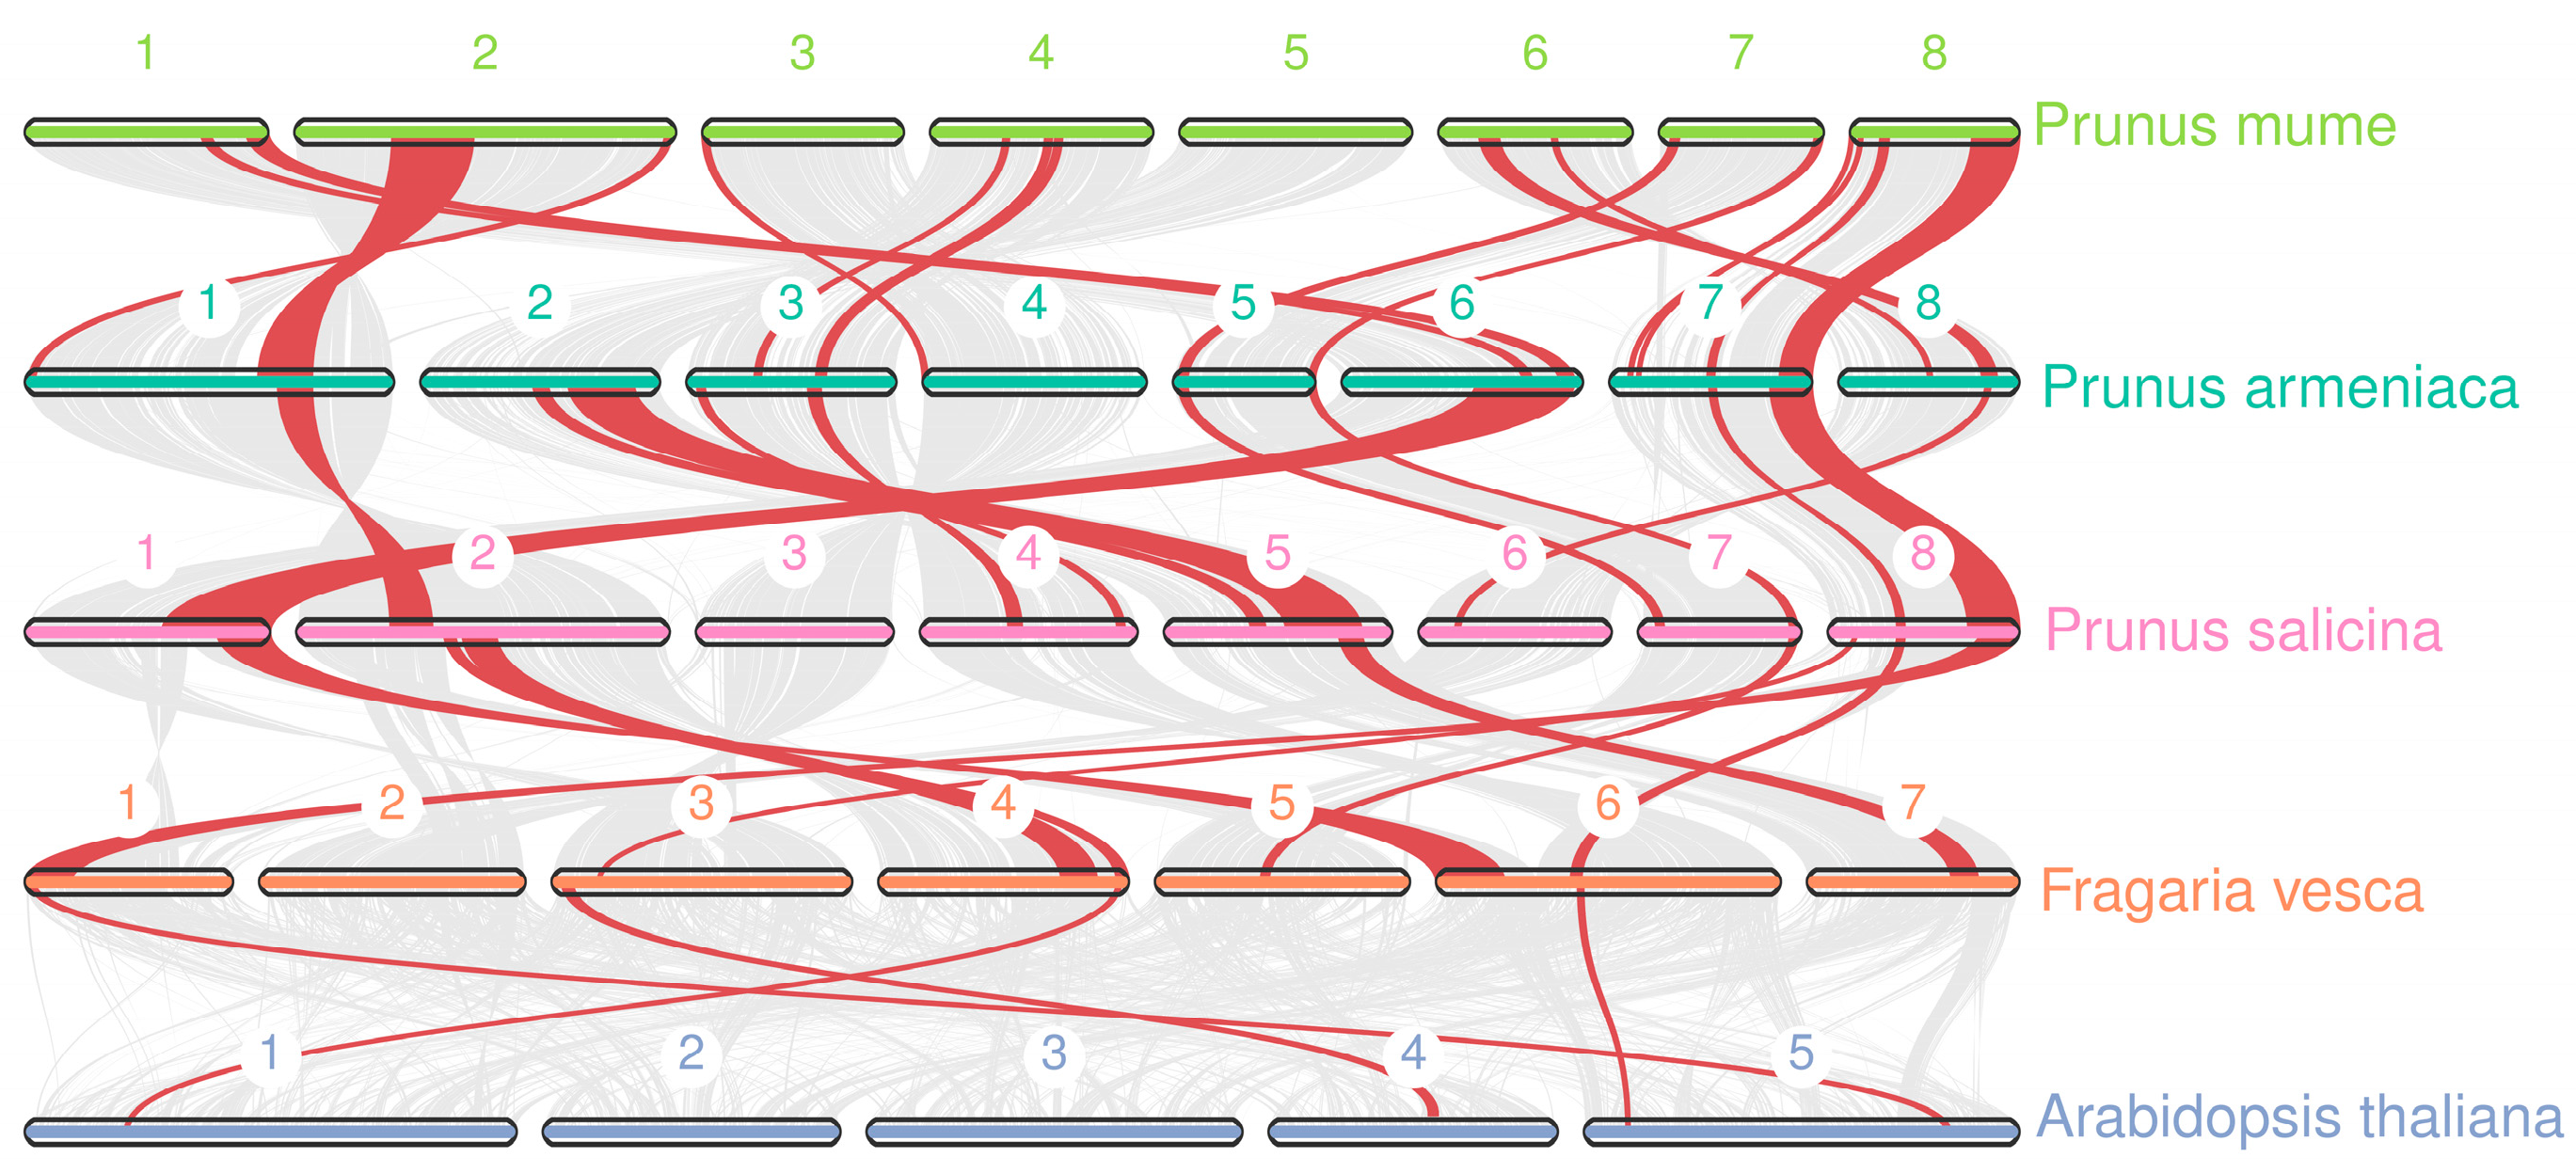
This study first employed MCScanX software to conduct intragenomic analysis of PmKAN genes and interspecies comparisons with Arabidopsis thaliana KAN homologs. The intragenomic analysis identified two tandem duplication pairs (PmKAN3/PmKAN18 and PmKAN11/PmKAN14), belonging to Groups II and V, respectively (Figure 6). Subsequently, to further investigate the duplication mechanisms of PmKAN genes, we performed genomic synteny analysis between P. mume and its close relatives (P. armeniaca, P. salicina, F. vesca) as well as the outgroup species A. thaliana (Figure 7). Extensive syntenic blocks were observed among Rosaceae species compared to A. thaliana, particularly within the Prunus genus (P. mume, P. salicina, P. armeniaca), indicating conserved genomic architecture and close evolutionary relatedness. The syntenic regions in Rosaceae typically harboured multiple KAN paralogs, whereas the corresponding regions in A. thaliana usually contained only a few KAN orthologs. This pattern suggests that the KAN gene family underwent extensive expansion in the common ancestor of Rosaceae. Whole-genome duplication (WGD) events are inferred as the predominant mechanism driving this expansion, with a substantial number of the duplicated KAN genes subsequently retained through selective pressure within the Rosaceae lineage.

2.5. Cis-Acting Element Analysis in PmKAN Promoter Region

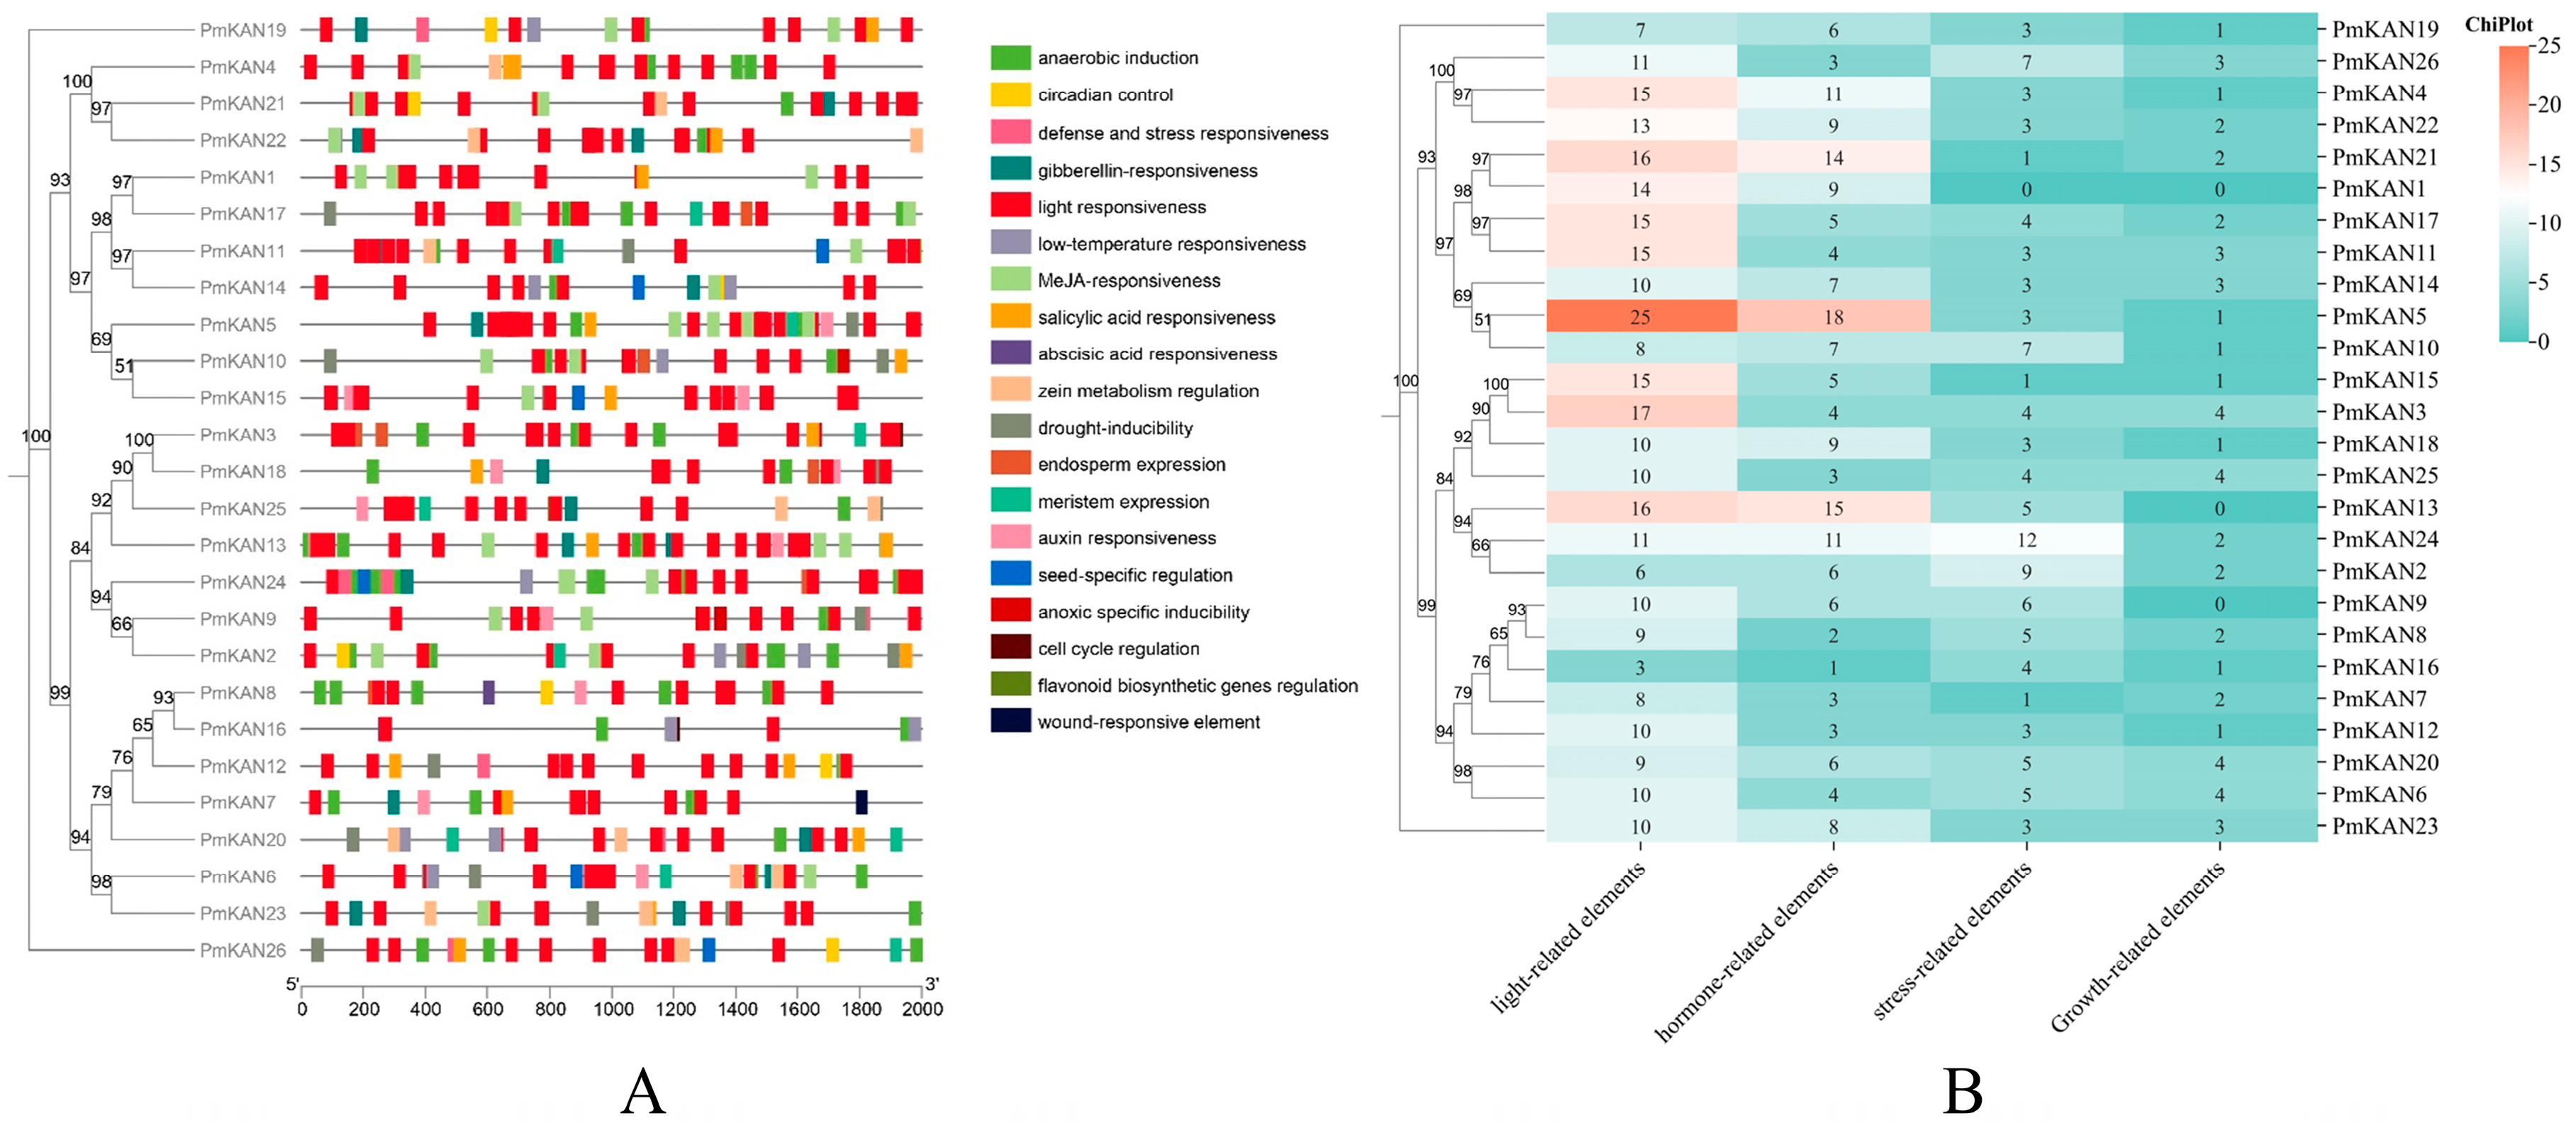
Transcriptional regulation in plants is critically mediated by cis-regulatory elements within promoter regions. To elucidate the transcriptional mechanisms of PmKAN genes, we analysed 2000 bp upstream sequences of 26 PmKAN coding regions. Four functional categories of cis-acting elements were identified (Figure 8): light-response-related elements constituted the most abundant group with 303 entities, representing 47.42% of total regulatory components. Phytohormone-associated motifs ranked second, comprising 179 elements including 66 abscisic acid responsiveness, 64 MeJA responsiveness, 19 salicylic acid responsiveness, 17 gibberellin responsiveness, and 13 auxin responsiveness types. Stress-related elements totalled 107 units, spanning anaerobic/drought/low-temperature inducible, defense and stress activated, wound-responsive and anoxic specific inducibility. Development-related components were the least represented category with 50 elements functionally linked to meristem expression, seed-specific regulation, circadian control, and flavonoid biosynthetic genes regulation. Significantly, PmKAN5 displayed the highest cis-element density among family members with 47 regulatory units, whereas PmKAN7 and PmKAN16 uniquely possessed fewer than 15 elements each. These results underscore the multifaceted regulatory potential of PmKAN genes in plant growth and metabolism.

2.6. Expression Analysis of PmKAN Genes in Different Tissues

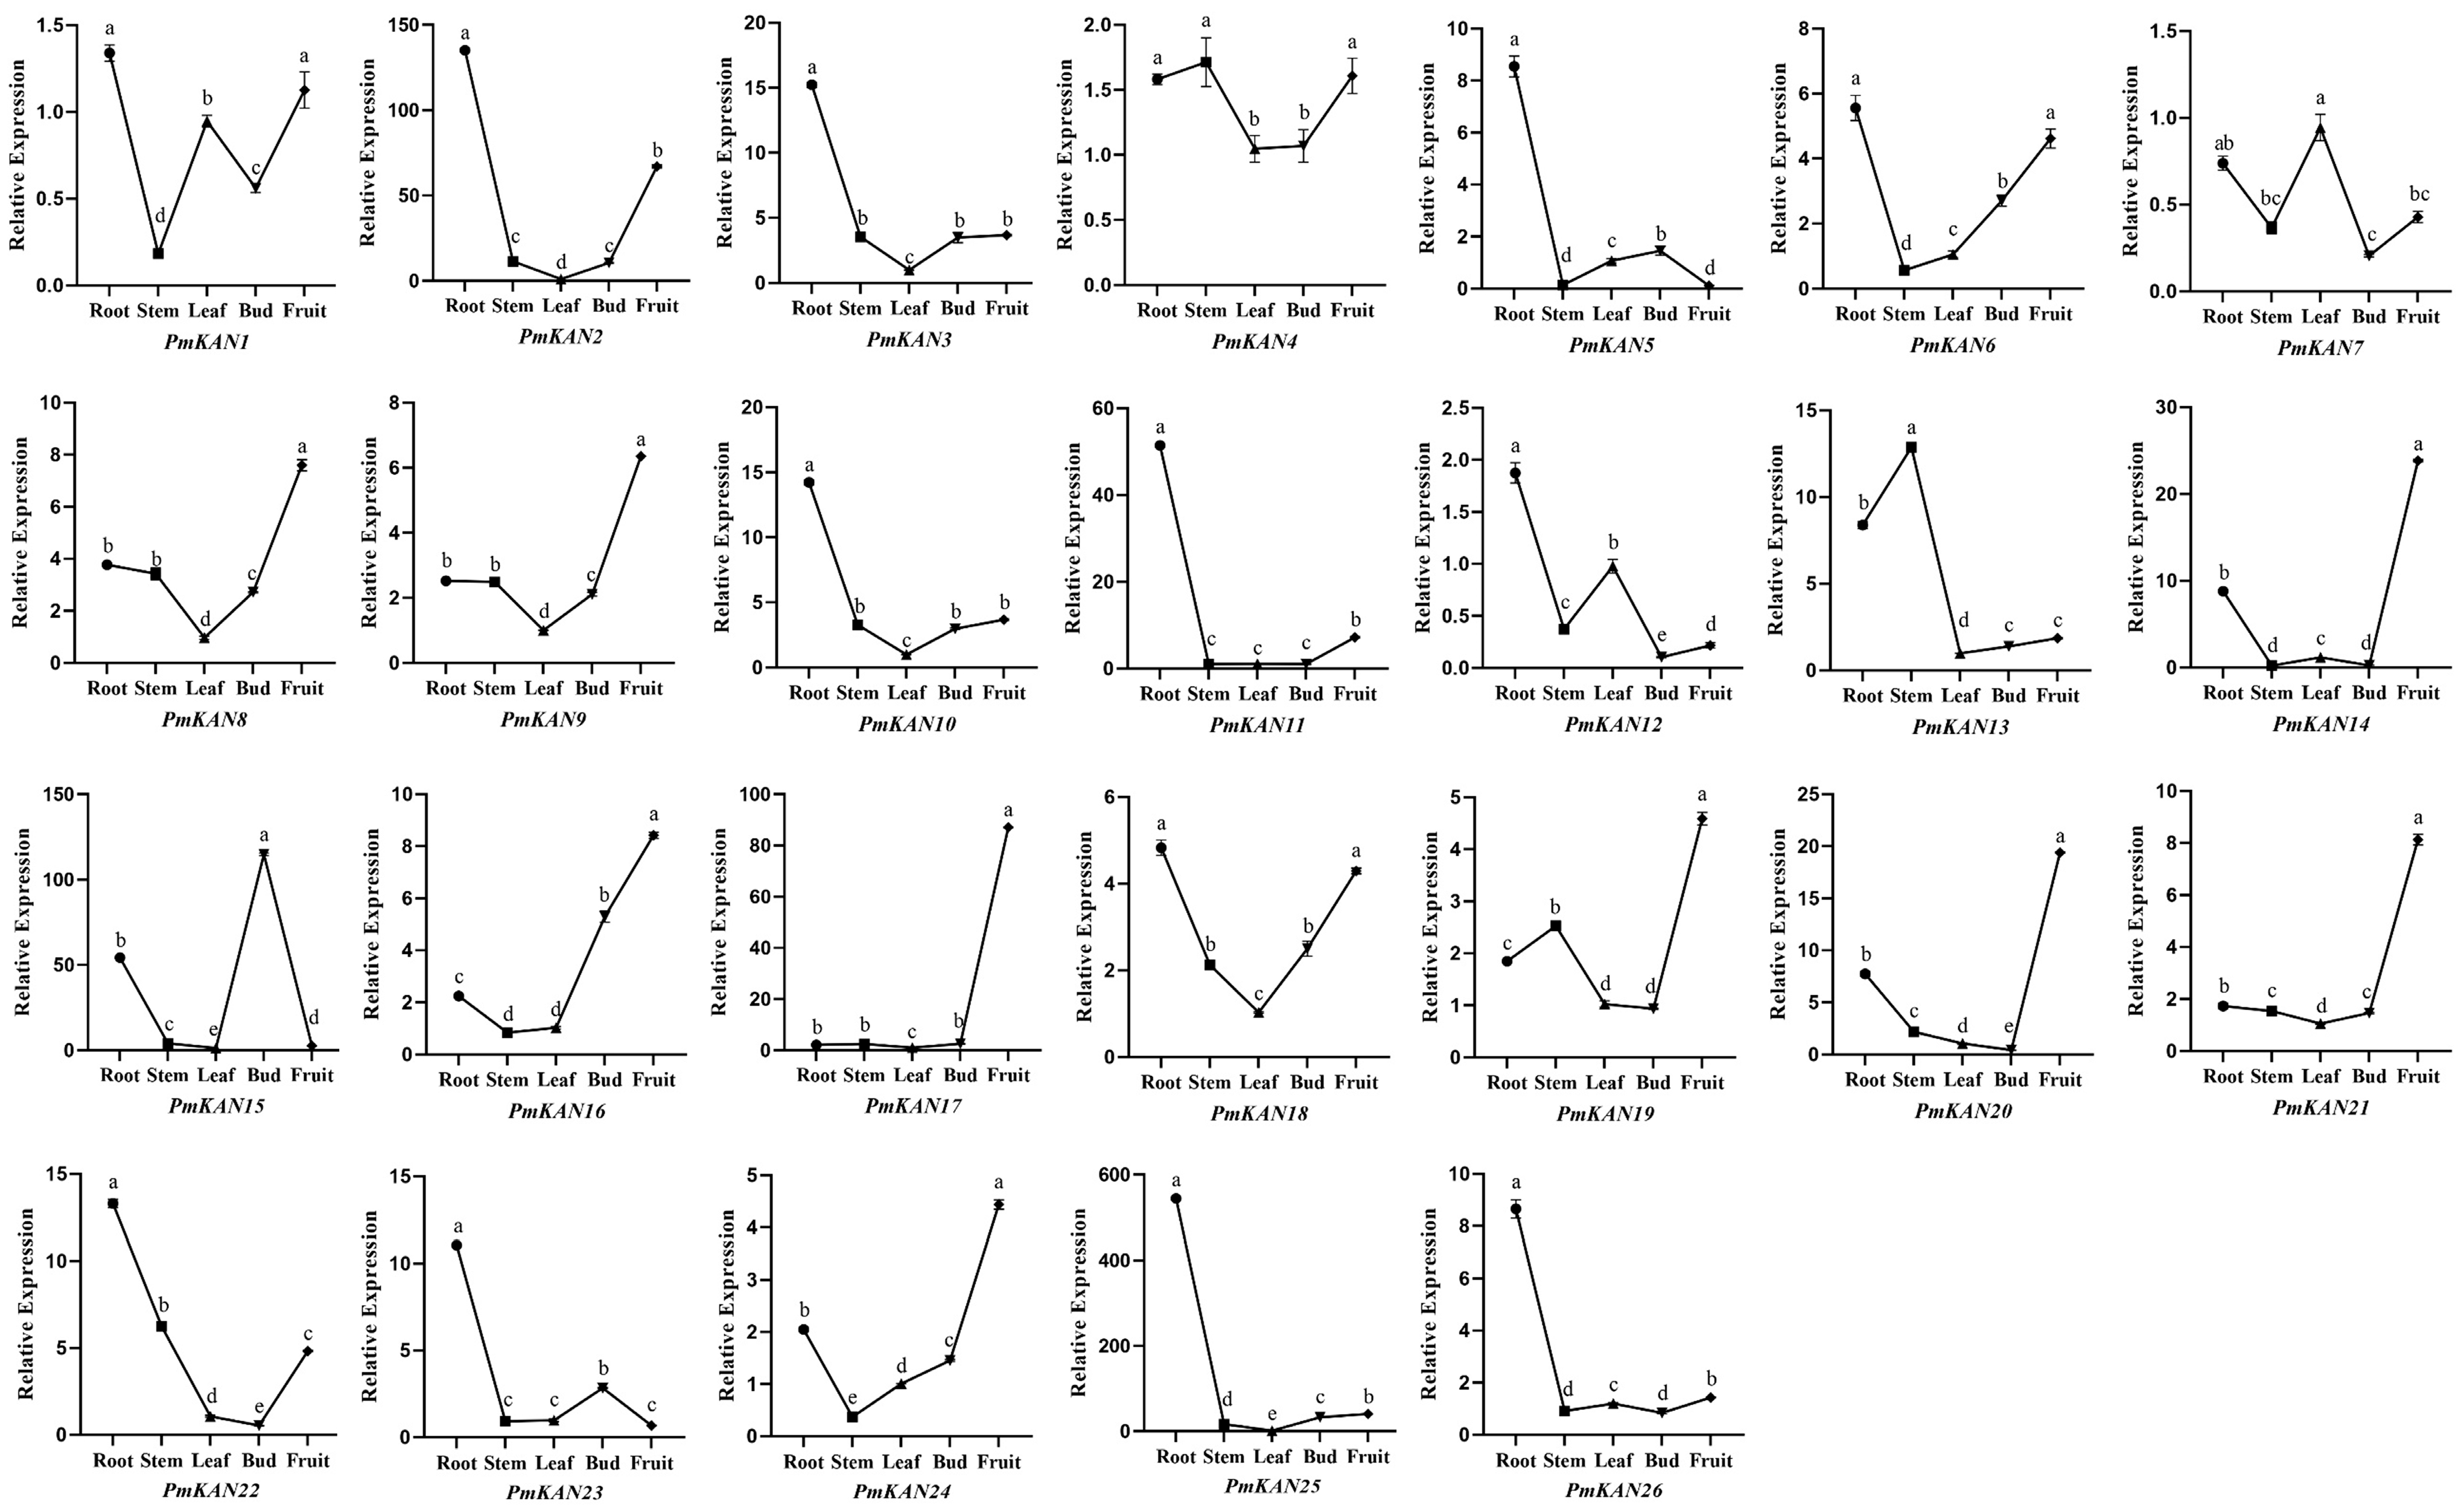
To further investigate the tissue-specific expression patterns of the 26 PmKAN genes, we examined their expression levels in root, stem, leaf, bud, and fruit tissues using qRT-PCR (Figure 9). The results revealed that the root contained the highest number of genes with elevated expression, totaling 13 genes (PmKAN1, PmKAN2, PmKAN3, PmKAN5, PmKAN6, PmKAN10, PmKAN11, PmKAN12, PmKAN18, PmKAN22, PmKAN23, PmKAN25, and PmKAN26). Nine genes showed high expression in fruit (PmKAN8, PmKAN9, PmKAN14, PmKAN16, PmKAN17, PmKAN19, PmKAN20, PmKAN21, and PmKAN24), while two genes were highly expressed in stem (PmKAN4 and PmKAN13). Only one gene each exhibited high expression in leaf (PmKAN7) and bud (PmKAN15). These findings indicate that PmKAN genes display distinct tissue-specific expression patterns, suggesting they may play specialized roles in different tissues of P. mume.

2.7. Expression Analysis at Different Developmental Stages of Fruit

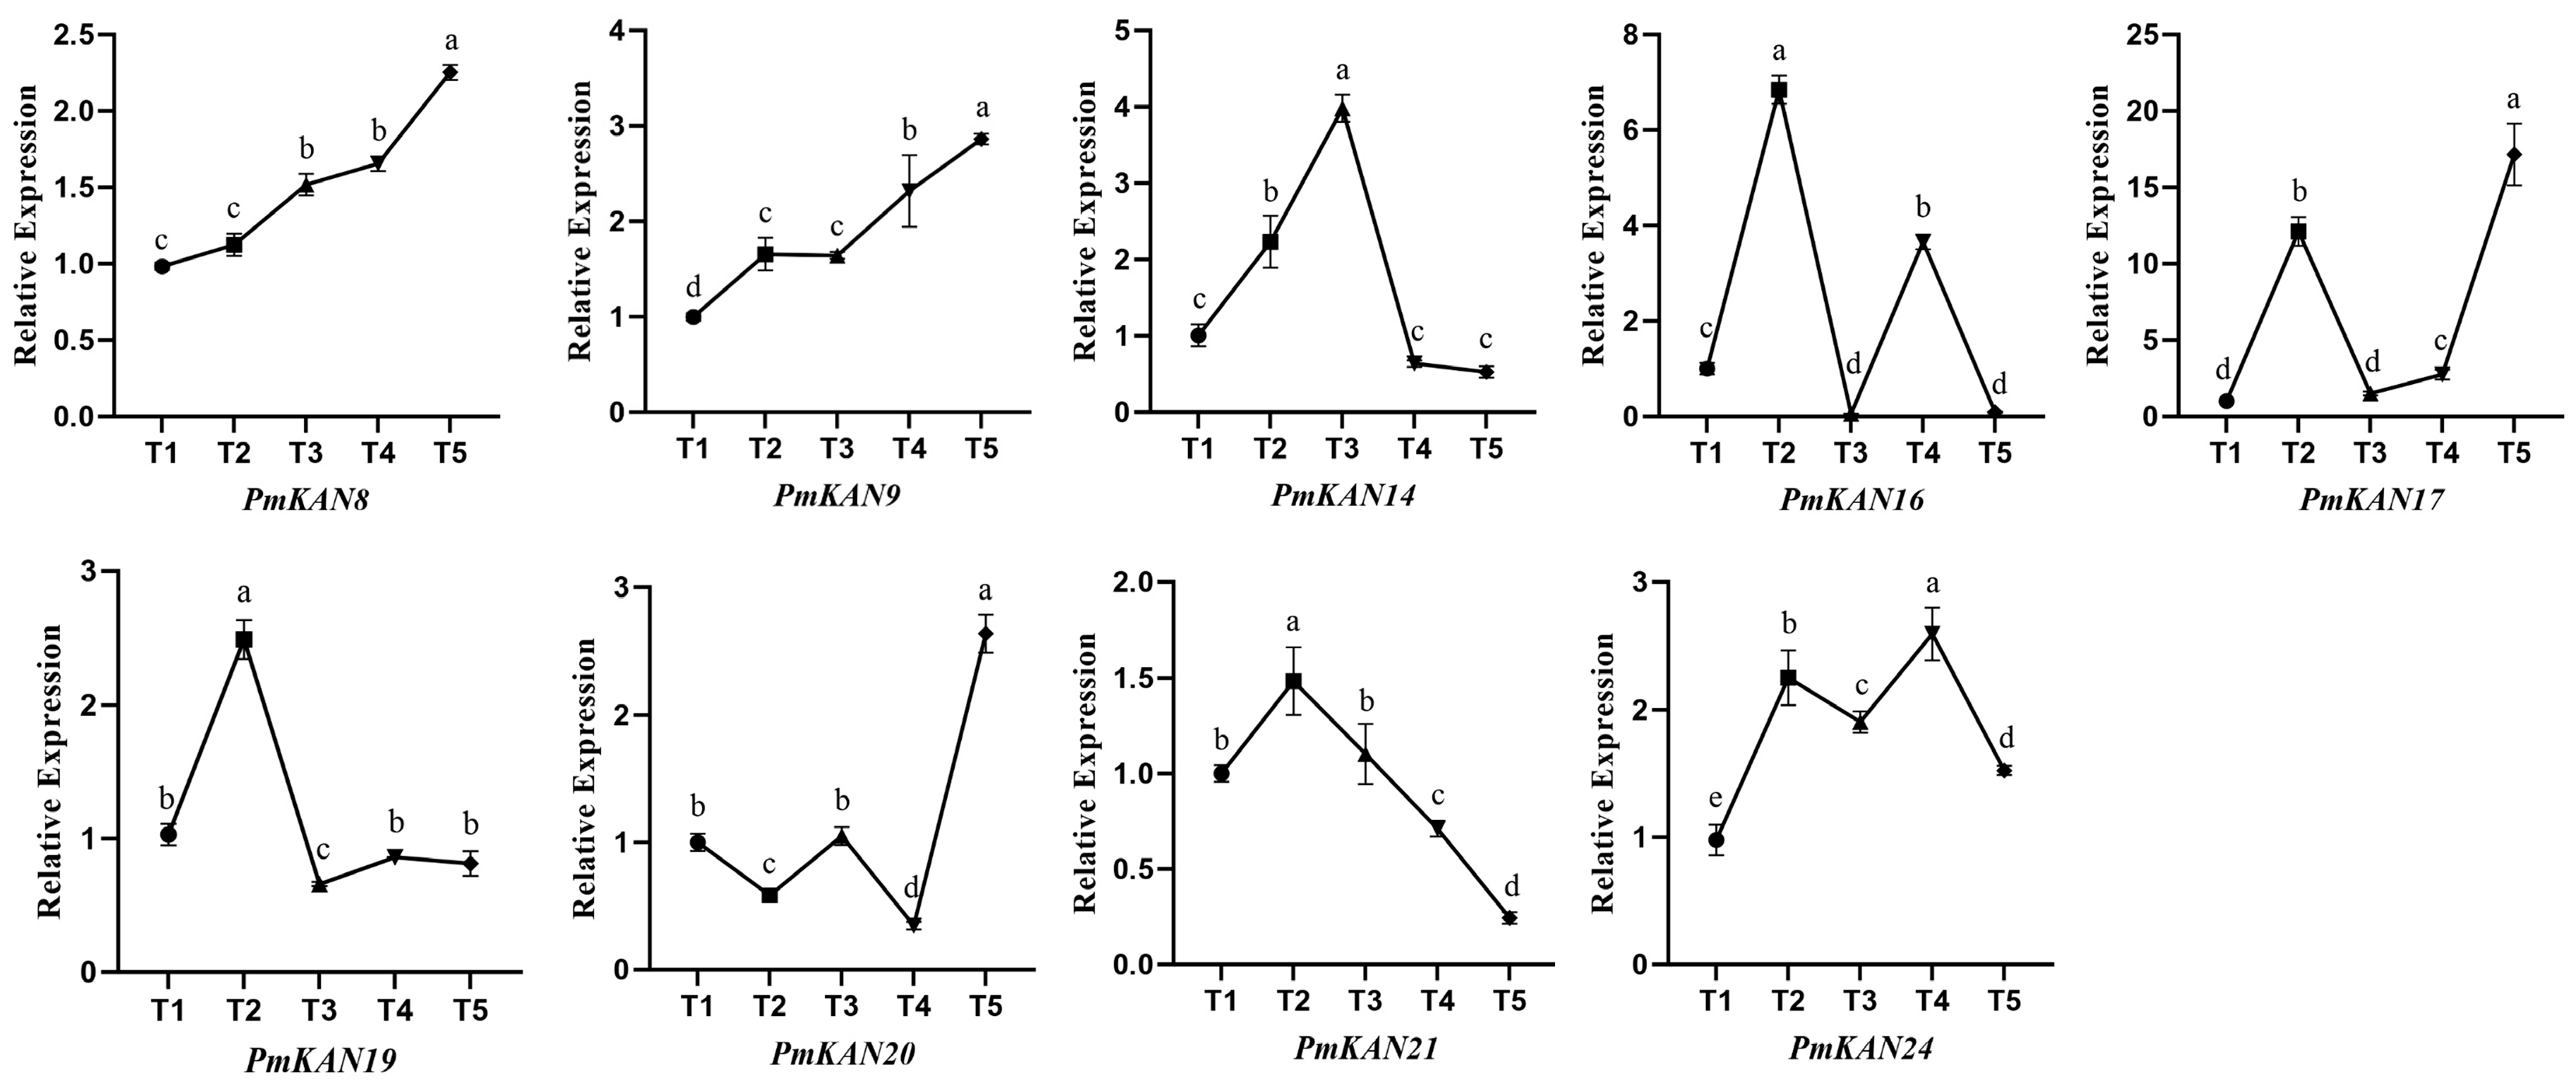
Analysis of gene expression levels across different tissues indicated that a considerable number of highly expressed genes within the PmKAN family were enriched in root and fruit tissues. Previous studies on KAN genes have highlighted their crucial regulatory roles in the polar development of lateral organs such as roots and leaves [2,10,11]; however, their functions in reproductive organs like fruits remain largely unexplored. Therefore, this study further examined the expression levels of nine genes highly expressed in fruit (PmKAN8, PmKAN9, PmKAN14, PmKAN16, PmKAN17, PmKAN19, PmKAN20, PmKAN21, and PmKAN24) across five key developmental stages of P. mume: fruit set phase (T1), primary expansion phase (T2), endocarp lignification phase (T3), secondary expansion phase (T4), and maturation phase (T5) (Figure 10).
The results revealed that the expression of PmKAN8 and PmKAN9 generally increased throughout development, peaking at the maturation stage. Concurrently, PmKAN17 and PmKAN20 also reached their highest expression levels at this same stage, albeit following different expression patterns. In contrast, PmKAN14 was significantly upregulated during the pit hardening period. PmKAN16 and PmKAN24 exhibited bimodal expression patterns, with peaks occurring during the two rapid growth phases. PmKAN19 and PmKAN21 were highly expressed at T2 but declined thereafter. In summary, distinct expression patterns of PmKAN genes were observed across fruit developmental stages, suggesting their potential involvement in diverse regulatory mechanisms underlying different phases of fruit development.

3. Discussion

The KANADI transcription factor family, classified within the GARP subclass under the MYB-like, serves as a key regulator of lateral organ polarity establishment in plants. While systematic characterization of KAN homologs has been identified in several flowering plants—including A. thaliana with four members [2], Nicotiana benthamiana with eight [5], Populus trichocarpa with eight [4], and Medicago truncatula with five [20]—studies on their functions in woody perennial plants are still limited. Phylogenetic analysis of four Rosaceae species (P. mume, P. armeniaca, P. salicina, F. vesca) and the outgroup A. thaliana revealed significant expansion of the KAN gene family during Rosaceae evolution. Specifically, 26 KAN genes were identified in the P. mume genome, with substantial numbers also detected in other Rosaceae species (23 in P. armeniaca, 25 in P. salicina, and 19 in F. vesca). This expansion pattern suggests the occurrence of genomic duplication events in Rosaceae, a conclusion further supported by subsequent synteny analysis. Prior studies have demonstrated that whole-genome duplication events facilitated rapid diversification of Rosaceae species following major geological–climatic events [21]. Furthermore, studies have demonstrated that AtKAN genes participate in plant growth and development [4,22,23,24], exhibiting functional redundancy [1,12]. Phylogenetic analysis of KAN genes in this study revealed that PmKAN4, PmKAN21, and PmKAN22 cluster with the four Arabidopsis AtKAN genes, suggesting potential functional similarity and redundancy among these three P. mume genes, which merits further investigation. The clustering of other PmKAN genes into distinct subgroups indicates divergence during P. mume evolution, as also suggested by the duplication events identified through chromosomal localization and synteny analysis.
Substantial physicochemical divergence was observed among PmKAN paralogs, with molecular weights ranging from 26.7 to 54.3 kDa and isoelectric points (pI) spanning 5.09~9.16, with differences may arise from real biological differentiation (e.g., functional evolution, structural variation) and these differentiation results further support the idea that KAN genes undergo species-specific adaptation, possibly driven by different environmental conditions and selection pressures. Temporal expression profiling across fruit developmental stages revealed dynamic regulatory patterns, providing critical insights into their roles in organogenesis. These findings establish a foundation for functional dissection of KAN-mediated regulatory networks in woody fruit species.
Secondary and tertiary structural analyses revealed conserved architectural features among KAN subfamily members, predominantly comprising coil regions and α-helix domains. A similar phenomenon was found in the structure prediction of the NAC proteins of P. mume, where each subfamily could elect a protein representative of the structural features of that subfamily, which possessed similar structural domains [25]. Conserved motif profiling identified analogous patterns within phylogenetic clades, consistent with putative functional conservation as documented in prior studies [6]. Differences in exon and intron structure within the PmKAN gene family showed clear patterns, with similar structures within each subfamily and variation between individual genes. This suggests that different PmKAN genes may have developed specialised functions. The chromosomal localisation analysis revealed that 26 PmKAN members are distributed across eight chromosomes, with three genes (PmKAN8, PmKAN9 and PmKAN10) demonstrating tandem duplication events. The presence of intragenomic syntenic PmKAN gene pairs, coupled with interspecies genomic synteny analysis across A. thaliana, P. mume, F. vesca, P. salicina, and P. armeniaca, provides evidence for extensive gene duplication events in Rosaceae species. This mechanism fundamentally explains the substantial divergence in KAN gene numbers between these four Rosaceae species and A. thaliana. The Rosaceae-specific expansion of the KAN family implies its potential functional diversification in lineage-specific biological processes, such as complex floral organogenesis, fruit development regulation, and secondary growth formation. Statistical analyses further support the contribution of whole-genome duplication (WGD) to Rosid diversification [21,26]. Morphologically, certain WGD events correlate with key trait innovations, exemplified by the evolution of ovarian structures in the apple tribe (Maleae, Rosaceae) [21]. Following their most recent WGD, Maleae species developed a new type of fleshy fruit consisting of a fusion of the calyx and ovary (e.g., apple and pear) [26]. These taxa exhibit unique morphological characteristics and represent critical taxonomic units, indicating WGD’s role in driving clade-specific phenotypic innovation. The KAN gene expansion revealed in this study offers genomic insights into Rosaceae’s adaptive evolution. Future investigations should address the functional significance of PmKAN genes retained after WGD events in shaping floral and fruit diversification in P. mume.
Bioinformatic analysis of cis-regulatory elements in PmKAN promoters revealed that all 26 family members contained a high density of cis-regulatory elements associated with growth and development, light responsiveness, hormonal regulation, and stress adaptation. Previous studies have established KANADI transcription factors as critical regulators of organ polarity in leaves and pistils [2,27], leaf morphogenesis [4,13], and shoot apical meristem development [28,29,30], functioning through intricate interactions with phytohormones including auxin (IAA), gibberellins (GAs), and abscisic acid (ABA) [24,31,32,33,34]. Recent mechanistic insights from rice demonstrate that the OsKAN1OsYAB5 protein complex directly regulates OsGA2ox6 expression to modulate bioactive gibberellin levels, thereby controlling plant height [16]. Combining our results and these previous studies suggest that PmKAN genes may orchestrate developmental processes and morphogenetic events through hormonal signalling pathways and metabolic regulation. However, the precise molecular mechanisms underlying KAN-mediated developmental regulation, particularly in woody species, remain poorly understood and present a pivotal research frontier for plant developmental biology.
The expression patterns of PmKAN genes across various tissues, as revealed by qRT-PCR analysis, exhibited distinct variation, consistent with findings reported for KAN families in other plant species [1,2,6]. Notably, among the 26 PmKAN genes, a significant number displayed markedly elevated expression in root (13 genes) and fruit (9 genes), implying their potential biological roles in these organs and warranting further functional investigation. Additionally, genes with relatively low expression levels may also encode transcriptional repressors, negative regulators of signaling pathways, or other critical regulatory molecules, and should not be overlooked in subsequent studies.
Previous studies on the KAN gene family have primarily focused on vegetative tissues—such as roots, stems, and leaves [6,20]—while research into their roles in reproductive organ development remains relatively limited. In rice, SLL1 alleles (ah2/sll1) exhibit grain size defects through promoter binding of size-related genes, with mutants showing impaired cell cycle progression and proliferation [14]. Si [15] identified an OsKANADI1 allele functioning as an extragenic suppressor of the temperature-sensitive osrdr6-1 mutant, which exhibited compromised tasiRNA biogenesis and lemma polarity. The osrdr6-1 hf1 double mutant displayed reduced grain size compared to both osrdr6-1 and wild-type ZH11. As a key abaxial determinant, OsKANADI1 transcriptionally activates the tasiR-ARFs pathway to maintain OsARF3a expression levels, thereby regulating lemma morphogenesis. These studies also provided additional evidence for future comprehensive research on the regulation of plant growth and development by the KAN gene family.
As a key reproductive organ of P. mume, the fruit is highly valued for its distinctive acidity and nutritional richness. However, research on P. mume fruit remains limited, and the role of KAN genes in this fruit has not yet been explored. In this study, expression profiling across different tissues identified nine genes (PmKAN8, PmKAN9, PmKAN14, PmKAN16, PmKAN17, PmKAN19, PmKAN20, PmKAN21, and PmKAN24) with high expression levels in fruit. Their expression dynamics were further examined during five critical developmental stages: fruit set phase (T1), primary expansion phase (T2), endocarp lignification phase (T3), secondary expansion phase (T4), and maturation phase (T5). RT-qPCR results revealed distinct expression patterns of these PmKAN genes across the developmental phases, suggesting that different PmKAN genes may play specialized roles at specific stages of fruit development. In conclusion, the molecular mechanisms through which KAN family genes regulate fruit development remain to be elucidated, warranting further in-depth investigation.

4. Materials and Methods

4.1. Plant Materials

Plant materials were obtained from the National Field GeneBank for P. mume in Baima, Lishui, Nanjing, Jiangsu Province, China (Geographic coordinates 31°55′ N, 115°15′ E), using the cultivar ‘Xinnongxiaomei’. Roots, stems, leaves, buds, and mature fruits were simultaneously collected from one-year-old shoots of ten-year-old trees during February to May 2025. In a separate collection, fruit samples representing five distinct developmental stages were obtained (Figure 11): fruit set phase (T1), primary expansion phase (T2), endocarp lignification phase (T3), secondary expansion phase (T4), and maturation phase (T5). The experiment included three independent biological replicates. All specimens were immediately flash-frozen in liquid nitrogen and stored at −80 °C in ultra-low freezers for subsequent analyses.

4.2. Identification of PmKAN Family Members

Protein sequences and annotation files for P. mume were retrieved from NCBI (https://www.ncbi.nlm.nih.gov/, accessed: 20 October 2022). The PFAM (http://pfam.xfam.org/, accessed: 20 April 2024) database provided the KAN Hidden Markov Model (HMM) profile for screening candidate protein sequence data in the local P. mume proteome (E-value < 10−5) [19]. The Fragaria vesca genome reference is derived from octoploid cultivated strawberry [35], while the genomes of Prunus salicina and Prunus armeniaca were obtained from the online website (https://www.rosaceae.org/, accessed: 1 June 2025). In addition, the Arabidopsis AtKAN1 sequence (TAIR, https://www.arabidopsis.org/, accessed: 21 April 2024) was used as a probe to search the P. mume protein database online using BlastP (https://ftp.ncbi.nlm.nih.gov/blast/executables/blast+/LATEST/, accessed: 26 April 2024). Protein sequences obtained by both methods were utilized for co-screening. TBtools (v2.0) facilitated sequence extraction and domain validation through InterPro (http://www.ebi.ac.uk/interpro/, accessed: 6 May 2024) and SMART with chromosomal mapping data concurrently acquired [36], with detailed steps refer to Zhang et al. [37]. Phylogenetic reconstruction was performed using the maximum likelihood (ML) method with IQ-TREE software (v2.3) [38]. The best-fit model for tree construction, JTT+F+R5, was selected using ModelFinder [39]. Bootstrap support values (1000 replicates) were calculated, and the resulting topology was visualized using iTOL (https://itol.embl.de/, accessed: 6 October 2024). The 26 identified KAN homologs, designated PmKAN1-PmKAN26 based on chromosomal positions, underwent physicochemical characterization through ProtParam (https://web.expasy.org/protparam/, accessed: 22 October 2022), determining molecular weight, isoelectric point (pI), and GRAVY index. Referring to NetSurfP-3.0 [40] to predict the secondary protein structure of PmKANs with default parameters; the tertiary structure was constructed using the online website SWISS-MODEL (https://swissmodel.expasy.org/interactive, accessed: 20 June 2024) to build the structure model.

4.3. Analysis of Structure and Conserved Motifs of PmKAN Gene in P. mume

The gene structure diagrams of PmKAN family members were generated using the GSDS tool (https://gsds.gao-lab.org/) [41]. Conserved motifs were predicted by analysing PmKAN protein sequences with the MEME Suite (http://meme-suite.org/tools/meme, accessed: 22 October 2022), with motif lengths restricted to 6–50 residues and the number of motifs set to 10 based on structural domain integrity. Default parameters were retained for all other settings. Visualization of motif distributions was performed in TBtools using default configurations.

4.4. Chromosomal Location and Syntenic Analysis

The genomic localization of PmKAN genes was mapped using the P. mume.gtf annotation file and PmKAN gene list as input data in TBtools. Tandem and segmental duplication events within the PmKAN family were detected using MCScanX (https://github.com/wyp1125/MCScanX, accessed: 21 July 2024), implemented with default parameters for evolutionary divergence analysis. The MCScanX analysis involves constructing a gene family protein database with diamond, executing diamond blastp alignment (E-value = 1 × 10⁻¹⁰), and performing collinearity analysis of KANs in P. mume using MCScanX, as well as collinearity analysis between KAN genes of P. mume and Arabidopsis.

4.5. Analysis of Cis-Acting Elements in PmKAN Gene Upstream Promoter Region

The 2000 bp genomic sequences upstream of PmKAN transcription start sites were extracted from P. mume for cis-acting element analysis, and plant material was obtained from young leaves of annual branches of ten-year-old fruit trees. Putative regulatory elements were predicted using PlantCARE (http://bioinformatics.psb.ugent.be/webtools/plantcare/html/, accessed: 17 May 2024) [42], followed by functional categorization. To resolve evolutionary relationships, protein sequences were aligned using the MAFFT (v7.0) [43], and a maximum likelihood (ML) phylogenetic tree was reconstructed with IQ-TREE. The optimal substitution model (VT+F+R4) was selected via ModelFinder (v2.0) and applied to ML inference. The IQ-TREE is employed to improve the Bootstrap parameter, set at 1000.

4.6. Quantitative qRT-PCR Analysis of PmKAN Genes

RNA was extracted using the Tiangen RNA extraction kit (DP441) (Beijing, China) from various tissues (root, stem, leaf, bud, and fruit) of the ‘Xinnongxiaomei’ cultivar of P. mume, with each sample weighing 50–100 mg. First-strand cDNA synthesis was carried out with the PrimeScript RT reagent Kit with gDNA Eraser (Perfect Real Time) (Takara, Beijing, China) following manufacturer specifications. Subsequent quantitative PCR analysis was conducted on the QuantStudio 5 Flex platform (Applied Biosystems, Waltham, MA, USA) employing SYBR Green chemistry. The 20 μL reaction system comprised 10 μL SYBR Green qPCR Supermix (AG11701; Accurate Biology, Hunan, Changsha, China), 1 μL each of forward and reverse primers (10 μM), 1 μL cDNA template (5 ng/μL), and 7 μL nuclease-free water. Thermal cycling parameters consisted of initial denaturation at 95 °C for 3 min, followed by 40 cycles of 95 °C denaturation (15 s) and 60 °C combined annealing/extension (30 s). Fluorescence acquisition occurred during the annealing/extension phase, with subsequent melting curve verification. Relative gene expression was calculated using 2−ΔΔCt method, with values normalised to the actin reference gene. The primer sequences used are listed in Table 3. Three biological samples, each with three technical repeats, were used to ensure reliable results [44].

5. Conclusions

This study identified 26 KAN family genes in P. mume using bioinformatic approaches. Phylogenetic classification clustered these PmKAN genes into five subfamilies, with members within each subfamily sharing conserved motif patterns and protein structures, suggesting functional conservation. Evolutionary analysis incorporating P. mume, related species (P. armeniaca, P. salicina, F. vesca), and the outgroup A. thaliana revealed whole-genome duplication events in Rosaceae that drove substantial KAN gene expansion, potentially facilitating trait diversification and adaptive evolution. Promoter analysis and expression profiling indicated PmKAN genes are involved in developmental and metabolic regulation, highlighting the need for further functional characterization. The qRT-PCR analysis revealed predominant expression of PmKAN genes in root and fruit tissues. Further investigation of the fruit enriched genes suggests their potential involvement in stage specific regulatory functions during fruit development. In conclusion, genome-wide identification of the KAN family facilitates understanding of the evolution and function of this gene family in P. mume, establishes a molecular framework for studying its role in Rosaceae plants, and provides important expression evidence and clues for deciphering the functional differentiation of PmKAN genes in P. mume.

Author Contributions

Conceptualization, X.H., Z.G. and M.L.; Data curation, M.L. and X.H.; Formal analysis, M.L., X.H. and X.L.; Methodology, M.L., X.H., X.L., Z.W. and F.G.; Project administration, Z.G.; Software, X.H., M.L. and X.L.; Supervision, Z.G.; Writing—original draft, M.L.; Writing—review & editing, Z.G. All authors have read and agreed to the published version of the manuscript.

Funding

This research was supported by the National Natural Science of China (32372670), the Fundamental Research Funds for the Central Universities (KYZZ2025006) and the Priority Academic Program Development of Jiangsu Higher Education Institutions (PAPD).

Institutional Review Board Statement

Not applicable.

Informed Consent Statement

Not applicable.

Data Availability Statement

Data is contained within the article.

Acknowledgments

We would like to thank all authors for their contribution to this study.

Conflicts of Interest

The authors declare that they have no conflicts of interest.

Abbreviations

The following abbreviations are used in this manuscript:
ABAAbscisic acid
CTKCytokinin
FPKMFragments Per Kilobase of transcript per Million mapped fragments
GAGibberellic acid
HMMHidden Markov Model
JAJasmonic acid
KANKANADI
MeJAMethyl jasmonate
MEMEMultiple Em for Motif Elicitation
MLMaximum Likelihood
NCBINational Center for Biotechnology Information
ORFOpen Reading Frame
P. mumePrunus mume Sieb. et Zucc.
PFAMProtein Family Database
SASalicylic acid
WGDWhole-Genome Duplication

References

  1. Eshed, Y.; Baum, S.F. Establishment of polarity in lateral organs of plants. Curr. Biol. 2001, 11, 1251–1260. [Google Scholar] [CrossRef] [PubMed]
  2. Kerstetter, R.A.; Bollman, K. KANADI regulates organ polarity in Arabidopsis. Nature 2001, 411, 706–709. [Google Scholar] [CrossRef]
  3. Henderson, D.C.; Zhang, X. RAGGED SEEDLING2 is required for expression of KANADI2 and REVOLUTA homologues in the maize shoot apex. Genesis 2006, 44, 372–382. [Google Scholar] [CrossRef]
  4. Zhang, G.H.; Xu, Q. SHALLOT-LIKE1 is a KANADI transcription factor that modulates rice leaf rolling by regulating leaf abaxial cell development. Plant Cell 2009, 21, 719–735. [Google Scholar] [CrossRef]
  5. Juanhong, W.; Qi, D. Cloning and expression analysis of KANADI gene in Nicotiana benthamiana. J. Agric. Biotechnol. 2013, 21, 1328–1336. [Google Scholar]
  6. Niu, M.; Zhang, H. Genome-Wide Analysis of the KANADI Gene Family and Its Expression Patterns under Different Nitrogen Concentrations Treatments in Populus trichocarpa. Phyton-Int. J. Exp. Bot. 2023, 92, 2001–2015. [Google Scholar] [CrossRef]
  7. Ahmad, R.; Liu, Y. GOLDEN2-LIKE Transcription Factors Regulate WRKY40 Expression in Response to Abscisic Acid. Plant Physiol. 2019, 179, 1844–1860. [Google Scholar] [CrossRef] [PubMed]
  8. Zumajo-Cardona, C.; Vasco, A. The Evolution of the KANADI Gene Family and Leaf Development in Lycophytes and Ferns. Plants 2019, 8, 313. [Google Scholar] [CrossRef]
  9. Zumajo-Cardona, C.; Ambrose, A.B. Phylogenetic analyses of key developmental genes provide insight into the complex evolution of seeds. Mol. Phylogenetics Evol. 2020, 147, 106778. [Google Scholar] [CrossRef] [PubMed]
  10. Kelley, D.R.; Arreola, A. ETTIN (ARF3) physically interacts with KANADI proteins to form a functional complex essential for integument development and polarity determination in Arabidopsis. Development 2012, 139, 1105–1109. [Google Scholar] [CrossRef] [PubMed]
  11. McAbee, J.M.; Hill, T.A. ABERRANT TESTA SHAPE encodes a KANADI family member, linking polarity determination to separation and growth of Arabidopsis ovule integuments. Plant J. 2006, 46, 522–531. [Google Scholar] [CrossRef]
  12. Eshed, Y.; Izhaki, A. Asymmetric leaf development and blade expansion in Arabidopsis are mediated by KANADI and YABBY activities. Development 2004, 131, 2997–3006. [Google Scholar] [CrossRef]
  13. Candela, H.; Johnston, R. The milkweed pod1 gene encodes a KANADI protein that is required for abaxial/adaxial patterning in maize leaves. Plant Cell 2008, 20, 2073–2087. [Google Scholar] [CrossRef] [PubMed]
  14. Ren, D.; Cui, Y. AH2 encodes a MYB domain protein that determines hull fate and affects grain yield and quality in rice. Plant J. 2019, 100, 813–824. [Google Scholar] [CrossRef] [PubMed]
  15. Si, F.; Yang, C. Control of OsARF3a by OsKANADI1 contributes to lemma development in rice. Plant J. 2022, 110, 1717–1730. [Google Scholar] [CrossRef]
  16. He, Q.; Wu, H. OsKANADI1 and OsYABBY5 regulate rice plant height by targeting GIBERELLIN 2-OXIDASE6. Plant Cell 2024, 37, koae276. [Google Scholar] [CrossRef] [PubMed]
  17. Chu, M.Y.; Fang, J.G. Culture of Prunus mume. J. Beijing For. Univ. 2001, 3, 47–49. [Google Scholar]
  18. Lin, X.; Zhou, P. Genome-Wide Identification of the ALMT Gene Family in Nine Rosaceae Species and Functional Analysis Associated with Organic Acid Accumulation in Prunus mume. Horticulturae 2024, 10, 1305. [Google Scholar] [CrossRef]
  19. Wei, L.; Wang, W. Genome-wide identification of the CsPAL gene family and functional analysis for strengthening green mold resistance in citrus fruit. Postharvest Biol. Technol. 2023, 196, 112178. [Google Scholar] [CrossRef]
  20. Wang, M.M. Functional Study of KANADI in Compound Leaf Development in Medicago truncatula. Ph.D. Thesis, Shandong University, Jinan, China, 2021. [Google Scholar]
  21. Zhao, Y.; Yu, D. Nuclear phylogenomics provide evidence to clarify key morphological evolution and whole-genome duplication across rosids. J. Integr. Plant Biol. 2025, 1–27. [Google Scholar] [CrossRef]
  22. Leon-Kloosterziel, K.M.; Keijzer, C.J. A Seed Shape Mutant of Arabidopsis That Is Affected in Integument Development. Plant Cell 1994, 6, 385–392. [Google Scholar] [CrossRef]
  23. Ilegems, M.; Douet, V. Interplay of auxin, KANADI and Class III HD-ZIP transcription factors in vascular tissue formation. Development 2010, 137, 975–984. [Google Scholar] [CrossRef]
  24. Ishibashi, N.; Kanamaru, K. ASYMMETRIC-LEAVES2 and an ortholog of eukaryotic NudC domain proteins repress expression of AUXIN-RESPONSE-FACTOR and class 1 KNOX homeobox genes for development of flat symmetric leaves in Arabidopsis. Biol. Open 2012, 1, 197–207. [Google Scholar] [CrossRef]
  25. Yao, D.; Ni, X. Identification and Tissue Expression Analysis of NAC Gene Family in Prunus mume. J. Nucl. Agric. Sci. 2019, 33, 14. [Google Scholar]
  26. Wang, B.; Xiao, Y. Gene Duplication and Functional Diversification of MADS-Box Genes in Malus × domestica following WGD: Implications for Fruit Type and Floral Organ Evolution. Int. J. Mol. Sci. 2024, 25, 8962. [Google Scholar] [CrossRef] [PubMed]
  27. Pires, H.R.; Monfared, M.M. ULTRAPETALA trxG genes interact with KANADI transcription factor genes to regulate Arabidopsis gynoecium patterning. Plant Cell 2014, 26, 4345–4361. [Google Scholar] [CrossRef]
  28. Xie, Y.; Straub, D. Meta-Analysis of Arabidopsis KANADI1 Direct Target Genes Identifies a Basic Growth-Promoting Module Acting Upstream of Hormonal Signaling Pathways. Plant Physiol. 2015, 169, 1240–1253. [Google Scholar] [CrossRef]
  29. Bhatia, N.; Åhl, H. Quantitative analysis of auxin sensing in leaf primordia argues against proposed role in regulating leaf dorsoventrality. Elife 2019, 8, e39298. [Google Scholar] [CrossRef]
  30. Ram, H.; Sahadevan, S. An integrated analysis of cell-type specific gene expression reveals genes regulated by REVOLUTA and KANADI1 in the Arabidopsis shoot apical meristem. PLoS Genet. 2020, 16, e1008661. [Google Scholar] [CrossRef]
  31. Izhaki, A.; Bowman, J.L. KANADI and class III HD-Zip gene families regulate embryo patterning and modulate auxin flow during embryogenesis in Arabidopsis. Plant Cell 2007, 19, 495–508. [Google Scholar] [CrossRef] [PubMed]
  32. Pekker, I.; Alvarez, J.P. Auxin response factors mediate Arabidopsis organ asymmetry via modulation of KANADI activity. Plant Cell 2005, 17, 2899–2910. [Google Scholar] [CrossRef]
  33. Hawker, N.P.; Bowman, J.L. Roles for Class III HD-Zip and KANADI genes in Arabidopsis root development. Plant Physiol. 2004, 135, 2261–2270. [Google Scholar] [CrossRef] [PubMed]
  34. Singh, A.; Roy, S. Phytohormonal crosstalk modulates the expression of miR166/165s, target Class III HD-ZIPs, and KANADI genes during root growth in Arabidopsis thaliana. Sci. Rep. 2017, 7, 3408. [Google Scholar] [CrossRef]
  35. Zhou, Y.; Xiong, J. The telomere-to-telomere genome of Fragaria vesca reveals the genomic evolution of Fragaria and the origin of cultivated octoploid strawberry. Hortic. Res. 2023, 10, 101–109. [Google Scholar] [CrossRef] [PubMed]
  36. Chen, C.; Chen, H. TBtools: An Integrative Toolkit Developed for Interactive Analyses of Big Biological Data. Mol. Plant 2020, 13, 1194–1202. [Google Scholar] [CrossRef]
  37. Zhang, Q.; Chen, W. The genome of Prunus mume. Nat. Commun. 2012, 3, 1318. [Google Scholar] [CrossRef]
  38. Nguyen, L.T.; Schmidt, H.A. IQ-TREE: A fast and effective stochastic algorithm for estimating maximum-likelihood phylogenies. Mol. Biol. Evol. 2015, 32, 268–274. [Google Scholar] [CrossRef]
  39. Kalyaanamoorthy, S.; Minh, B.Q. ModelFinder: Fast model selection for accurate phylogenetic estimates. Nat. Methods 2017, 14, 587–589. [Google Scholar] [CrossRef] [PubMed]
  40. Høie, M.H.; Kiehl, E.N. NetSurfP-3.0: Accurate and fast prediction of protein structural features by protein language models and deep learning. Nucleic Acids Res. 2022, 50, W510–W515. [Google Scholar] [CrossRef]
  41. Wang, Y.; Liu, H. Genome-wide analysis of VQ motif-containing proteins in Moso bamboo (Phyllostachys edulis). Planta 2017, 246, 165–181. [Google Scholar] [CrossRef]
  42. Lescot, M.; Déhais, P. PlantCARE, a database of plant cis-acting regulatory elements and a portal to tools for in silico analysis of promoter sequences. Nucleic Acids Res. 2002, 30, 325–327. [Google Scholar] [CrossRef] [PubMed]
  43. Katoh, K.; Standley, D.M. MAFFT multiple sequence alignment software version 7: Improvements in performance and usability. Mol. Biol. Evol. 2013, 30, 772–780. [Google Scholar] [CrossRef] [PubMed]
  44. Li, H.; Wang, L. Phytohormone and integrated mRNA and miRNA transcriptome analyses and differentiation of male between hermaphroditic floral buds of andromonoecious Diospyros kaki Thunb. BMC Genom. 2021, 22, 203. [Google Scholar] [CrossRef] [PubMed]
Figure 1. Phylogenetic analysis of KAN proteins from Prunus mume and four other plant species.
Ijms 26 09121 g001
Figure 2. Amino acid sequence comparison of KAN in P. mume and A. thaliana. Colors indicate the proportion of homologous sequence similarity (black: 100%; pink: ≥75%; green: ≥50%; yellow: ≥33%); sequences with similarity below 33% are shown without background color. The underlined region indicates the conserved GARP domain.
Ijms 26 09121 g002
Figure 3. Predicted tertiary structure of PmKAN proteins in Prunus mume. Blue regions represent α-helices, and red regions represent random coils. Note: I to XXVI represent KAN1 to KAN26, respectively.
Ijms 26 09121 g003
Figure 4. The conserved protein domains, gene structures and conserved motifs of PmKAN genes are based on phylogenetic relationships. (A) Phylogenetic tree. Maximum likelihood phylogenetic tree constructed using full-length KAN protein sequences from P. mume and related species. (B) The PmKAN structures. The gene elements sizes were comparable to their sequence lengths, and the exons (coding sequences, CDS) depicted as yellow rectangles and untranslated regions (UTRs) shown as green rectangles. (C) Protein conserved domains. (D) The PmKAN conserved motifs. The conserved motifs of the PmKANs and the 10 motifs are displayed in different colours.
Ijms 26 09121 g004
Figure 5. Chromosomal locations of PmKAN genes on P. mume chromosomes. The scale on the left represents the length of the chromosome. The chromosome numbers are on each chromosome.
Ijms 26 09121 g005
Figure 6. The distribution of the PmKAN genes on the chromosomes and syntenic relationships. Chromosomal coordinates (megabase scale) are displayed with yellow numeric identifiers. Paralogous gene pairs exhibiting segmental duplication are connected via red linkage curves.
Ijms 26 09121 g006
Figure 7. Synteny analysis of KAN genes between P. mume and other plants. The red line showed the KAN syntenic gene pairs. The numbers represent the chromosome numbers of each species.
Ijms 26 09121 g007
Figure 8. Analysis of cis-acting elements in promoters of PmKAN genes. (A) The 2000 bp sequences upstream of the 26 PmKAN genes were analysed with PlantCARE. (B) Types and quantities of cis-acting elements in the promoter region of the PmKAN genes.
Ijms 26 09121 g008
Figure 9. Expression levels of PmKAN genes in five different tissues. The x-axis represents different tissue types, while the y-axis indicates the relative expression level of the target gene mRNA. Values are shown as mean ± SE (n = 3). Different lowercase letters indicate significant differences (p < 0.05) in the expression of KAN genes among various tissues of P. mume.
Ijms 26 09121 g009
Figure 10. Expression analysis of the PmKAN genes in different periods of fruit development. The x-axis represents different periods, while the y-axis indicates the relative expression level of the target gene mRNA. Values are shown as mean ± SE (n = 3). Different lowercase letters indicate significant differences (p < 0.05) in the expression of KAN genes among various development stages of fruit.
Ijms 26 09121 g010
Figure 11. Fruit growth and development in ‘Xinnongxiaomei’. (T1) Fruit set phase, (T2) primary expansion phase, (T3) endocarp lignification phase, (T4) secondary expansion phase, (T5) maturation phase.
Ijms 26 09121 g011
Table 1. Characterization of KAN gene family in P. mume.
Sequence IDGene IDProtein IDNumber
of Amino
Acid
Molecular Weight (Da)Theoretical pIInstability
Index
Aliphatic IndexGrand Average of Hydropathicity
PmKAN1LOC103341420XP_008243158.133938,330.287.2254.7766.17−0.996
PmKAN2LOC103342254XP_008244092.225628,978.039.1654.7878.55−0.628
PmKAN3LOC103318708XP_008218346.145851,491.825.0960.6962.14−0.941
PmKAN4LOC103320783XP_008220727.132335,643.638.3840.9063.72−0.729
PmKAN5LOC103321009XP_008220974.130033,444.138.8662.0662.43−0.782
PmKAN6LOC103321568XP_008221605.134638,907.837.6846.6774.62−0.810
PmKAN7LOC103324237XP_008224497.131133,616.206.1152.4281.03−0.352
PmKAN8LOC103324390XP_008224659.130533,185.516.5044.1471.97−0.551
PmKAN9LOC103324391XP_008224662.130633,843.006.2258.4673.66−0.744
PmKAN10LOC103324465XP_008224747.124026,712.188.2551.9075.96−0.642
PmKAN11LOC103324956XP_008225297.141748,261.838.8460.7758.39−1.06
PmKAN12LOC103325588XP_008226001.136840,994.318.5555.8965.49−0.787
PmKAN13LOC103327465XP_008228027.146651,018.805.5875.7169.10−0.688
PmKAN14LOC103328312XP_008228924.143249,087.788.7052.4568.56−0.811
PmKAN15LOC103328941XP_016649340.124027,684.776.6048.9760.92−0.890
PmKAN16LOC103329105XP_008229756.142247,845.565.0952.0877.16−0.646
PmKAN17LOC103332813XP_008233790.136040,640.076.7749.1461.17−0.946
PmKAN18LOC103334420XP_016650539.149654,847.795.4461.4270.58−0.626
PmKAN19LOC103335407XP_008236633.139444,002.277.6158.7162.64−0.831
PmKAN20LOC103336798XP_008238120.127831,421.018.3037.4262.12−0.981
PmKAN21LOC103336839XP_008238177.140945,952.917.3970.1565.82−0.796
PmKAN22LOC103338908XP_008240401.147052,192.556.7854.3757.94−0.829
PmKAN23LOC103338947XP_008240441.143849,015.827.3649.7469.06−0.817
PmKAN24LOC103339100XP_008240600.128931,469.297.6953.8465.78−0.792
PmKAN25LOC103339429XP_008240946.241947,156.137.6670.7964.25−0.819
PmKAN26LOC103341001XP_008242700.149654,334.027.1562.6856.94−0.882
Table 2. Prediction of secondary structure of KAN protein in P. mume.
Protein NameCoil Regions310 Helix (%)Alpha Helix (%)Random Coil (%)Beta Strand (%)Beta Turn (%)
PmKAN186.140.8810.620.880.880.59
PmKAN270.700.7826.561.950.000.00
PmKAN382.530.6615.940.870.000.00
PmKAN487.000.9310.220.621.240.00
PmKAN586.001.0011.001.000.330.67
PmKAN672.830.5825.431.160.000.00
PmKAN768.490.6428.621.930.320.00
PmKAN869.840.6626.891.970.660.00
PmKAN971.240.9826.141.630.000.00
PmKAN1080.421.2513.331.672.500.83
PmKAN1188.970.728.390.720.720.48
PmKAN1278.260.5420.111.090.000.00
PmKAN1380.900.0017.381.720.000.00
PmKAN1490.050.697.410.690.690.46
PmKAN1582.080.8313.332.080.830.83
PmKAN1672.750.7125.120.950.470.00
PmKAN1786.390.8310.000.831.390.56
PmKAN1881.250.4017.341.010.000.00
PmKAN1973.101.0223.351.271.270.00
PmKAN2068.710.7227.702.160.720.00
PmKAN2189.980.737.820.000.980.49
PmKAN2290.850.646.810.430.850.43
PmKAN2377.630.4620.551.140.230.00
PmKAN2469.900.6927.342.080.000.00
PmKAN2579.240.4818.851.430.000.00
PmKAN2679.840.6017.140.811.610.00
Table 3. Primer sequences used in qRT-PCR.
Gene NameForward Primer (5′→3′)Reverse Primer (5′→3′)
PmKAN 1TTCTCGCGGATCATCAAGGCGAGGTTTGTTACCTGAAGCTGG
PmKAN 2ACTTACGACGTTGCACCGAATCGTTTTCCACAGAAGGCAA
PmKAN 3GCAGAAGGCACAAGAAACCGGGCTGGGTACCAGACTCAAC
PmKAN 4CCGCAATCAAATGGCACCAAACAAGGACAATAATGCGCACAC
PmKAN 5CCTTCTGAGTATGACCAGCGAAGGCAATAGAGGTGACGCAG
PmKAN 6TGGAAGTGCAGAGGAAACTTCAAGAACTCTGGGTTTGTTGGCA
PmKAN 7GCATGAGCAGCTGGAGGTTAGGTGGTTTTTGGTCATGCGG
PmKAN 8GTCAGCTTGGCGGTTCATCTCATCGCCCATTTCCTTCCCT
PmKAN 9GCGACTGCACGAGCAATTAGAGAGCCAGGTGCTTCTGAAC
PmKAN 10GCTGCTATGTCTCTCTGGGCCTGCACTCACTAGCGACACA
PmKAN 11ACTTGCCTCAATCCTTCTTCCACTCTCCCCTTTCACCGCATC
PmKAN 12GAGGTTGCTTTCCGAGCCTATTTTCGGTTTGCCTTGACGA
PmKAN 13TCATCAGCTGGTGTATCGCCGGTGGCTCAGATTCACTGCT
PmKAN 14GTCTTGTCAAGTCGTGTAAGCCGCAAAAGCAAGGACTAAAATGC
PmKAN 15CAAAAGAGGAAGCAGCAGGCTCAGTTGCAGACCACGACAG
PmKAN 16CCTCCTAGGCCTGGACAGTTCACGAATAACTCCCCCAGCA
PmKAN 17CTTAGGTGTTGCTCCTGCACTTAATTTGCCTCTGCCCAGC
PmKAN 18GGGGGTATCTGCAGCAATGTGACACCTGTTGGGAGTCAGG
PmKAN 19AATAGGGCTGCTGGAAGAGCTTATCTTCCTTCCTCGCCGC
PmKAN 20CGGACTTGGGAGTTGCTTCTGGTGATCAATTTGTCGTTTTGGC
PmKAN 21AGGAGTGAGAGAGTAGAGCTTGGCGCTGGACTACCACTCTTC
PmKAN 22GGAGGGGCTGACTTTCATGGACAAGAGGAACATGAGGGCG
PmKAN 23GGAGTAGCCTCTGCATTGGAAACCAGCTAGGAGGAGCAGA
PmKAN 24GAAAAGCCCAACGCCTTCTGGACGAAGCGGTCATGGAGAT
PmKAN 25AGCACTTTCATATTGCCGAGGTGAGCTGCTTCCCTTGTTCTT
PmKAN 26GGTTGACGGTTTGACCAACGATGTTTCATGCTGCCAGTGC
PmACTINTGAAGCATACACCTATGATGATGAAGCTTTGACAGCACCAGTAGATTCC
Disclaimer/Publisher’s Note: The statements, opinions and data contained in all publications are solely those of the individual author(s) and contributor(s) and not of MDPI and/or the editor(s). MDPI and/or the editor(s) disclaim responsibility for any injury to people or property resulting from any ideas, methods, instructions or products referred to in the content.