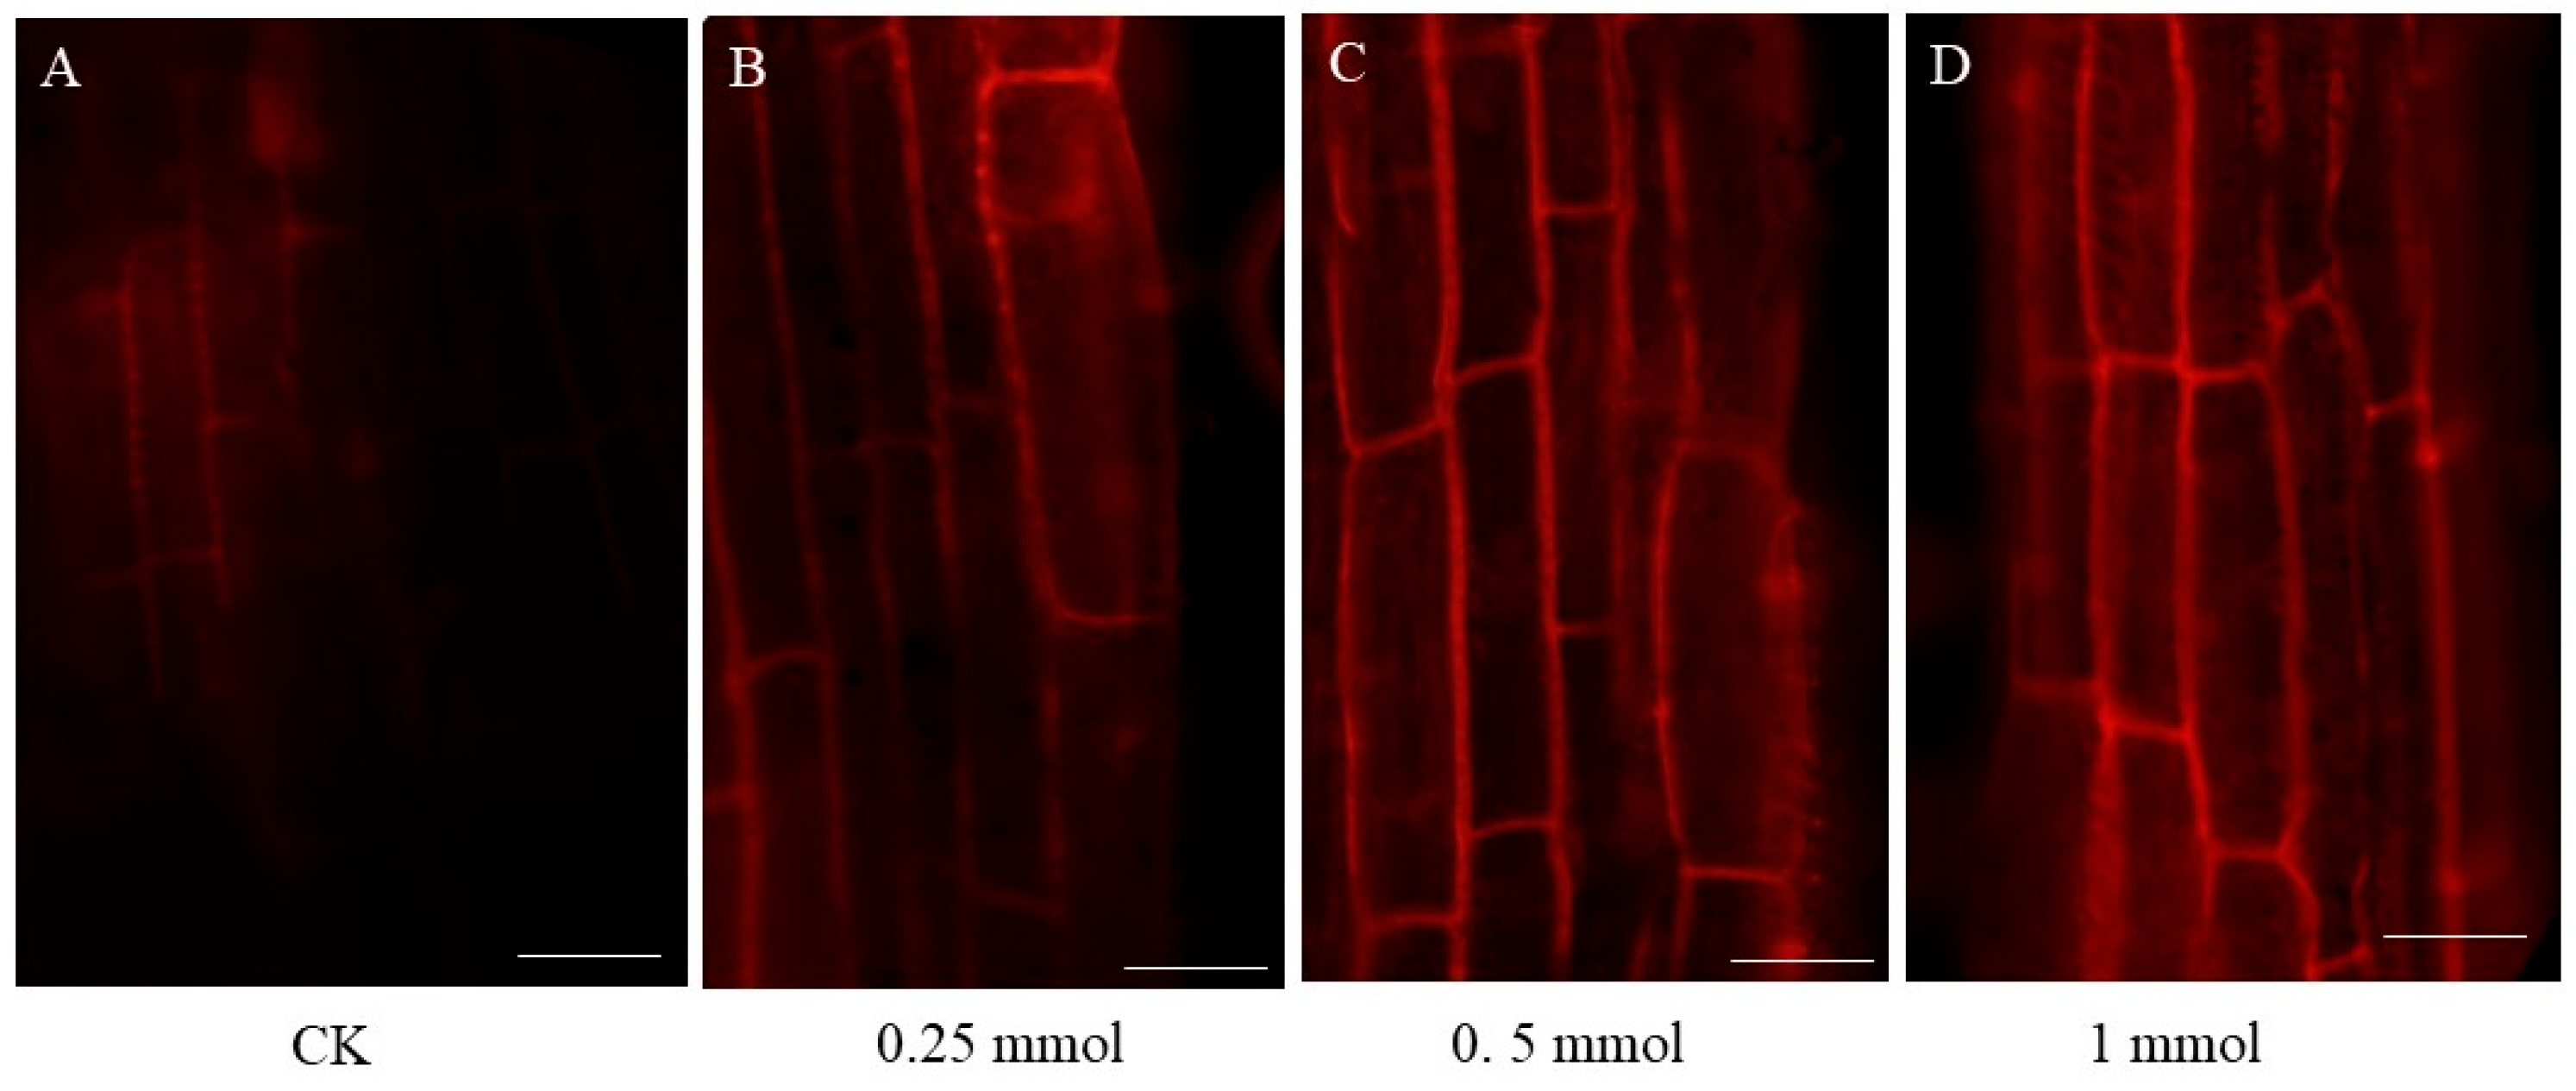
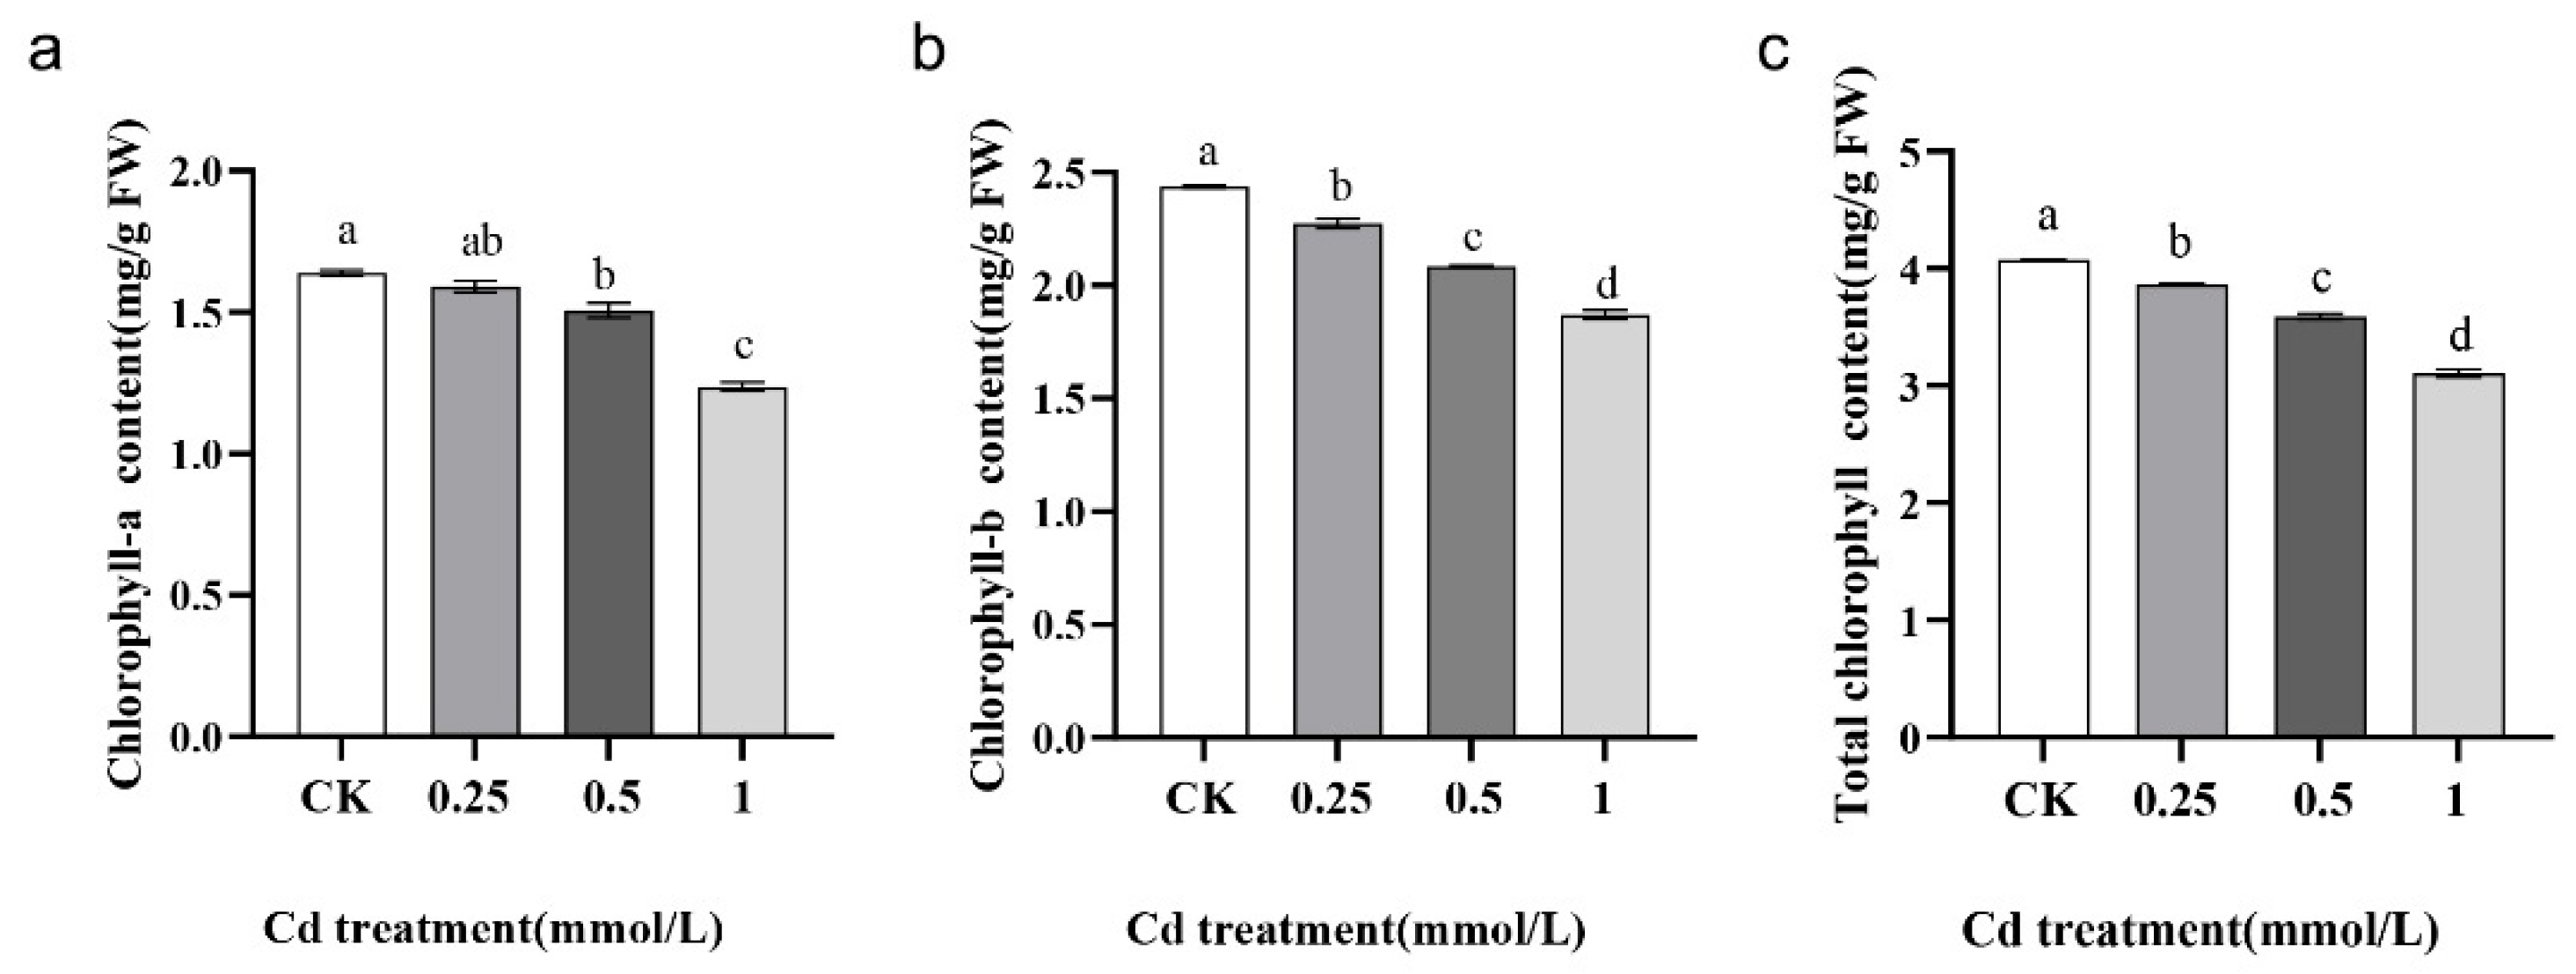
Correction: Yang et al. Transcriptome Profiling, Physiological and Biochemical Analyses Reveal Comprehensive Insights in Cadmium Stress in Brassica carinata L. Int. J. Mol. Sci. 2024, 25, 1260
Reference
- Yang, T.; Pang, B.; Zhou, L.; Gu, L.; Wang, H.; Du, X.; Wang, H.; Zhu, B. Transcriptome Profiling, Physiological and Biochemical Analyses Reveal Comprehensive Insights in Cadmium Stress in Brassica carinata L. Int. J. Mol. Sci. 2024, 25, 1260. [Google Scholar] [CrossRef]


Disclaimer/Publisher’s Note: The statements, opinions and data contained in all publications are solely those of the individual author(s) and contributor(s) and not of MDPI and/or the editor(s). MDPI and/or the editor(s) disclaim responsibility for any injury to people or property resulting from any ideas, methods, instructions or products referred to in the content. |
© 2025 by the authors. Licensee MDPI, Basel, Switzerland. This article is an open access article distributed under the terms and conditions of the Creative Commons Attribution (CC BY) license (https://creativecommons.org/licenses/by/4.0/).
Share and Cite
Yang, T.; Pang, B.; Zhou, L.; Gu, L.; Wang, H.; Du, X.; Wang, H.; Zhu, B. Correction: Yang et al. Transcriptome Profiling, Physiological and Biochemical Analyses Reveal Comprehensive Insights in Cadmium Stress in Brassica carinata L. Int. J. Mol. Sci. 2024, 25, 1260. Int. J. Mol. Sci. 2025, 26, 9091. https://doi.org/10.3390/ijms26189091
Yang T, Pang B, Zhou L, Gu L, Wang H, Du X, Wang H, Zhu B. Correction: Yang et al. Transcriptome Profiling, Physiological and Biochemical Analyses Reveal Comprehensive Insights in Cadmium Stress in Brassica carinata L. Int. J. Mol. Sci. 2024, 25, 1260. International Journal of Molecular Sciences. 2025; 26(18):9091. https://doi.org/10.3390/ijms26189091
Chicago/Turabian StyleYang, Tinghai, Biao Pang, Lizhou Zhou, Lei Gu, Hongcheng Wang, Xuye Du, Huinan Wang, and Bin Zhu. 2025. "Correction: Yang et al. Transcriptome Profiling, Physiological and Biochemical Analyses Reveal Comprehensive Insights in Cadmium Stress in Brassica carinata L. Int. J. Mol. Sci. 2024, 25, 1260" International Journal of Molecular Sciences 26, no. 18: 9091. https://doi.org/10.3390/ijms26189091
APA StyleYang, T., Pang, B., Zhou, L., Gu, L., Wang, H., Du, X., Wang, H., & Zhu, B. (2025). Correction: Yang et al. Transcriptome Profiling, Physiological and Biochemical Analyses Reveal Comprehensive Insights in Cadmium Stress in Brassica carinata L. Int. J. Mol. Sci. 2024, 25, 1260. International Journal of Molecular Sciences, 26(18), 9091. https://doi.org/10.3390/ijms26189091


