Article

APOE Genotyping in Cognitive Disorders: Preliminary Observations from the Greek Population

by
Athanasia Athanasaki
1,†,
Ioanna Tsantzali
1,†,
Christos Kroupis
2,
Aikaterini Theodorou
1,
Fotini Boufidou
3,
Vasilios C. Constantinides
3,
John S. Tzartos
1,
Socrates J. Tzartos
4,
Georgios Velonakis
5,
Christina Zompola
1,
Amalia Michalopoulou
1,
Panagiotis G. Paraskevas
1,
Anastasios Bonakis
1,
Sotirios Giannopoulos
1,
Paraskevi Moutsatsou
2,
Georgios Tsivgoulis
1,6,
Elisabeth Kapaki
3 and
George P. Paraskevas
1,3,*
1
2nd Department of Neurology, School of Medicine, National and Kapodistrian University of Athens, “Attikon” General University Hospital, 12462 Athens, Greece
2
Department of Clinical Biochemistry, School of Medicine, National and Kapodistrian University of Athens, “Attikon” General University Hospital, 12462 Athens, Greece
3
1st Department of Neurology, School of Medicine, National and Kapodistrian University of Athens, Neurochemistry and Biological Markers Unit, “Eginition” Hospital, 11528 Athens, Greece
4
Tzartos Neuro Diagnostics, 11523 Athens, Greece
5
2nd Department of Radiology, National and Kapodistrian University of Athens, Research Unit of Radiology, “Attikon” General University Hospital, 12462 Athens, Greece
6
Department of Neurology, University of Tennessee Health Science Center, Memphis, TN 38163, USA
*
Author to whom correspondence should be addressed.
These authors contributed equally to this work.
Int. J. Mol. Sci. 2025, 26(15), 7410; https://doi.org/10.3390/ijms26157410 (registering DOI)
Submission received: 30 June 2025 / Revised: 28 July 2025 / Accepted: 29 July 2025 / Published: 1 August 2025
(This article belongs to the Special Issue Molecular Mechanisms of Alzheimer’s Disease)

Abstract

Alzheimer’s disease (AD) is the most common cause of cognitive decline. Among the various susceptibility genes, the gene of apolipoprotein E (APOE) is probably the most important. It may be present in three allelic forms, termed ε2, ε3 and ε4, and the most common genotype is the ε3/ε3. Recently, it has been observed that subjects with the ε4/ε4 genotype may show near-full penetrance of AD biology (pathology and biomarkers), leading to the suggestion that ε4 homozygosity may represent a distinct genetic type of AD. The aim of the present study was to investigate the role of ε4 homozygosity or heterozygosity in the presence or absence of the AD biomarker profile in patients with cognitive disorders in the Greek population. A total of 274 patients were included in the study. They underwent APOE genotyping and cerebrospinal fluid (CSF) biomarker profiling. The presence of ε4 was associated with a lower age of symptom onset and decreased amyloid biomarkers (irrespective to AD or non-AD profiles), and predicted the presence of an AD profile by a positive predictive value approaching 100%. In conclusion, the ε4 allele has a significant effect on the risk and clinical parameters of cognitive impairment and AD in the Greek population, while the ε4/ε4 genotype may be highly indicative of the (co)existence of AD in cognitively impaired patients.

1. Introduction

Alzheimer’s disease (AD) is the most common cause of cognitive decline, usually presenting as a hippocampal amnestic disorder [1]. Atypical clinical phenotypes may occur, including logopenic or other language presentations, posterior cortical atrophy, corticobasal syndrome and frontal presentations, whilst cases mixed with cerebrovascular disease or Lewy body pathology are not uncommon [2,3]. Pathologic hallmarks include extracellular amyloid deposition and intraneuronal deposition of hyperphosphorylated tau protein, as well as microglia activation, neuroinflammation and synaptic and neuronal loss [4]. Since the amyloid and tau pathological/biochemical processes are reflected in the cerebrospinal fluid (CSF) or can be assessed by positron emission tomography (PET), the use of such biomarkers has been incorporated in recent research or diagnostic criteria and classifications [5,6,7,8]. In the CSF, Alzheimer’s disease is characterized by reduced levels of amyloid beta (Aβ) with 42 amino acids (Aβ42), whilst controlling Aβ42 for the levels of Aβ with 40 amino acids (Aβ40) in the form of the Aβ42/Aβ40 ratio may better reflect the amyloid process. Concomitantly, the levels of phosphorylated tau protein, such as tau phosphorylated at threonine 181 (τP181), are increased. Thus, amyloid positivity (A+), defined as reduced CSF levels of Aβ42, or, preferably, reduced Aβ42/Aβ40 and tau positivity (T+), defined as increased levels of τP181, formulate the CSF profile of AD, typified as A+T+ [5] or A+T1+ (since τP181 increases very early in the AD process, as a result of amyloidogenesis) [6]. In this context, AD may be viewed as a biological [6] or clinical–biological entity [7], with the presence (or absence) of AD being diagnosed according to the abovementioned biomarker profile, irrespective of the clinical phenotype (typical or atypical) and the severity of symptoms (mild cognitive impairment or dementia). Although it has been proposed that A+ may suffice for the diagnosis of AD [6], many authorities suggest relying on the A+T+ profile and, in the case of A+T or AT+ profiles, using other alternative methods, such as amyloid PET [3,9]. Another alternative method may be the use of the hybrid τP181/Aβ42 ratio [6].
Among the various susceptibility genes, the gene of apolipoprotein E (APOE) at chromosome 19 is probably the most important [10]. It may be present in three allelic forms, termed ε2, ε3 and ε4, and the most common genotype in the general population (including the Greek population) is ε3/ε3 [11], which is accompanied by a lifetime risk for developing AD of ~10% [12]. The presence of the ε4 allele is considered a major genetic risk factor for the development of AD, adversely affecting Aβ production, fibrilization, accumulation and clearance; tau hyperphosphorylation, aggregation and spread; neuroinflammation; and the function of neural networks [4,10]. Vascular mechanisms, including cerebral amyloid angiopathy (CAA), may also be involved [13]. This action of ε4 occurs in a “dose-dependent” manner, and it has been estimated that ε4 heterozygosity increases the lifetime risk for AD to ~30% and ε4 homozygosity increases it to ~65%, concomitantly decreasing the age of symptom onset [12]. On the other hand, ε2 has a protective role and decreases the risk of AD [14]. However, accumulating evidence suggests that the ε4/ε2 genotype may be similar to ε4/ε3, showing increased neurodegeneration, yet with a relatively slower rate of progression [15].
Recently, it has been observed that subjects with the ε4/ε4 genotype may show near-full penetrance of AD biology (pathology and biomarkers) with an approximate age of symptom onset of 65 years, leading to the suggestion that ε4 homozygosity may represent a distinct genetic type of AD (somehow similar to autosomal-dominant AD or Down syndrome) [16]. Then, the question arises as to whether ε4/ε4 has a more “deterministic” role, in contrast to ε4 heterozygosity, which is a risk factor. The aim of the present study was to investigate the role of ε4 homozygosity or heterozygosity in the presence or absence of the AD CSF biomarker profile in patients with cognitive disorders in the Greek population.

2. Results

A total of 274 participants presenting with cognitive disorders were included in the study, and their demographic, clinical and CSF biomarker data are presented in Table 1. No difference in gender was observed across ε4 homozygotes, ε4 heterozygotes and non-ε4 carriers (χ2 test 1.033, p = 0.597), or across ε4 homozygotes, ε4 heterozygotes, and ε3/ε3 and combined ε3/ε2 plus ε2/ε2 groups (χ2 test 1.037, p = 0.792). No differences were observed in respect to education, Mini Mental State Examination (MMSE) scores and Addenbrooke’s Cognitive Examination—Revised version (ACE-R) scores. Both ε4 homozygotes and ε4 heterozygotes showed significantly higher scores for Entorhinal Cortex Atrophy (ERICA) as compared to non-ε4 carriers, but comparable Medial Temporal Atrophy (MTA) scores.

2.1. APOE and Age of Disease (Symptom) Onset

Patients with the ε3/ε3 genotype presented with a significantly older age and age of disease onset as compared to ε4 heterozygotes, whilst the latter did not differ significantly compared to ε4 homozygotes. By visual inspection of the cumulative frequency of age at disease onset (Figure 1), it is obvious that, for patients carrying at least one ε4 allele, this is shifted towards earlier ages (~10 years earlier) in patients with AD biomarker profiles, but also in patients with non-AD profiles. In AD, the peak of age of onset in ε4 homozygotes occurs 5 years earlier compared to in ε4 heterozygotes and 10 years earlier compared to in patients with no ε4 allele. In individuals with non-AD profiles, the peak frequency in heterozygotes occurs ~10 years earlier compared to in individuals with the absence of ε4.

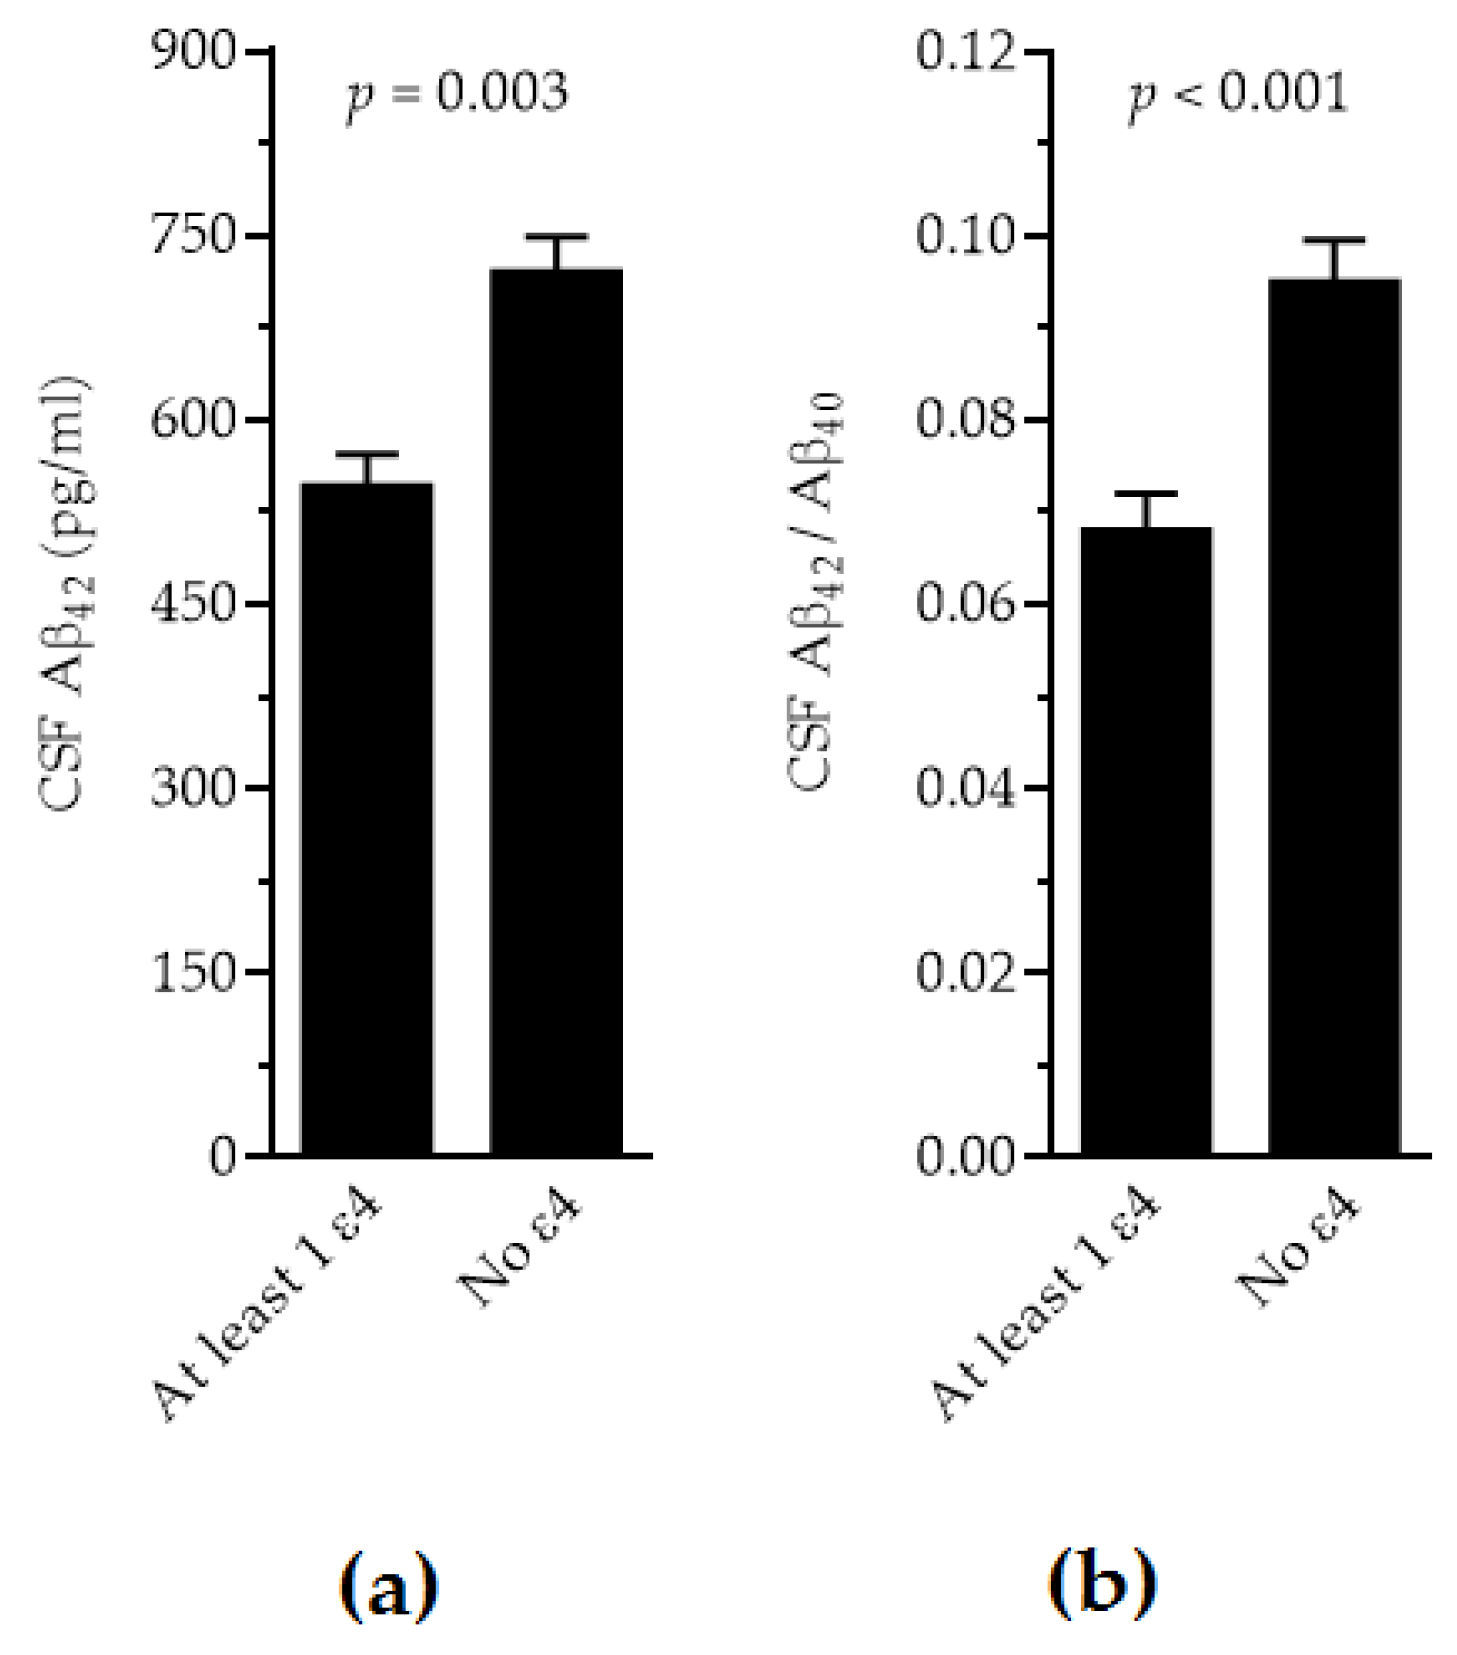
2.2. APOE and CSF Biomarkers

Differences were noted in respect to CSF biomarker levels. Since assessments were conducted in three different laboratories with different cut-off values, general analysis of covariance models with age as a covariate and laboratory, sex and APOE genotype as co-factors was performed for all biomarkers, in order to control for the above parameters. Except for Aβ40, all models showed significant results, with lower Aβ42 (p < 0.001) and Aβ42/Aβ40 levels (p < 0.0001) and higher τP181 (p < 0.001), total tau (τT) (p = 0.02) and τP181/Aβ42 (p < 0.001) levels in patients with at least one ε4 allele vs. patients with the absence of ε4. A significant effect of laboratory was also observed (p < 0.0001).
When the disease type (AD vs. non-AD profiles) was introduced in the models additionally, all biomarkers showed significant differences by disease type (p < 0.0001, except for Aβ40 with p = 0.04) and by laboratory (p < 0.001). For τP181, τT and the τP181/Aβ42 ratio, the significant differences by APOE genotype were lost. However, for Aβ42 levels and the Aβ42/Aβ40 ratio, significantly lower levels were observed in individuals with the presence of ε4 vs. the absence of ε4 (Figure 2, p = 0.003 and p < 0.001, respectively). Sex and age did not affect any of the models significantly.

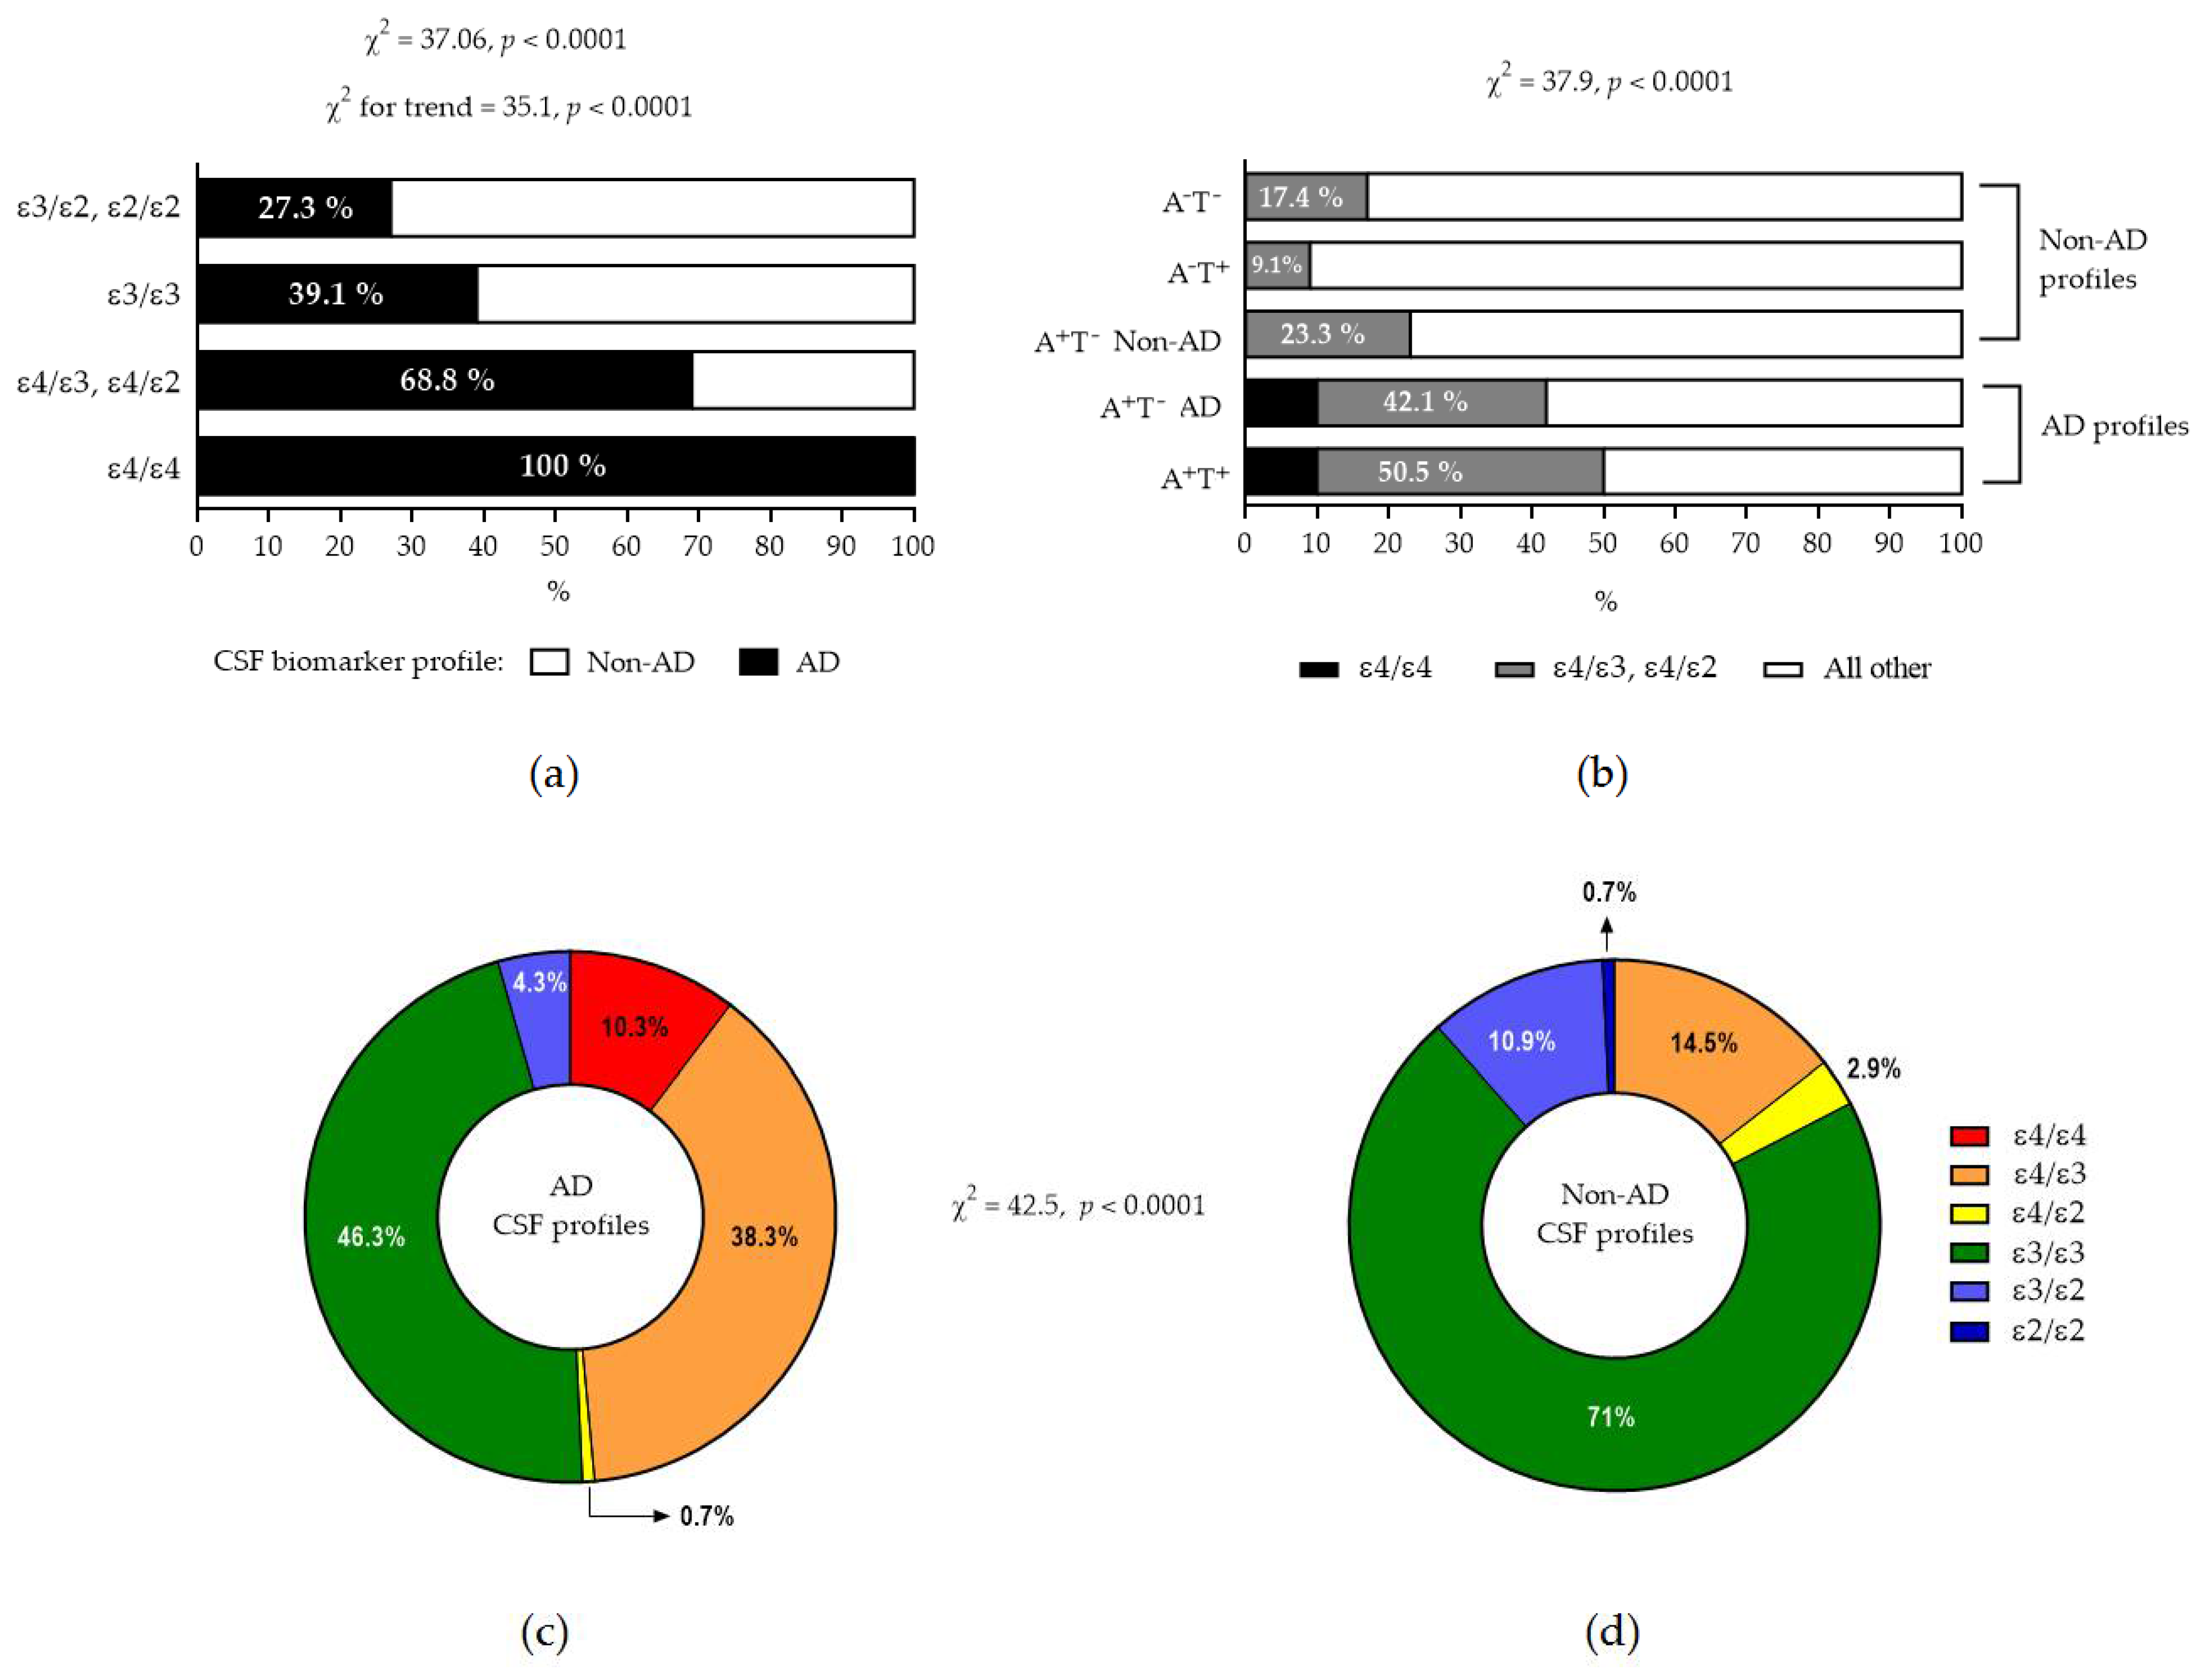
2.3. APOE and Biomarker Profiles

Based on the CSF biomarker assessments, CSF profiling of patients was conducted according to the AT(N) classification system [5] (Table 2). For those with the A+T profile, the τP181/Aβ42 ratio was used [6] and, when increased, these patients were considered as having AD and were added to those with the A+T+ profile. On the other hand, a normal τP181/Aβ42 ratio was considered to be evidence of AD absence, and such patients were classified as non-AD patients. None of the typical non-AD profiles (AT+ and AT) showed abnormal levels of the τP181/Aβ42 ratio.
A statistically significant increasing frequency of AD biomarker profiles can be observed when moving from ε3/ε2 and ε2/ε2 to ε3ε3, then to ε4 heterozygosity, and finally to ε4 homozygosity (Figure 3a, p < 0.0001). Conversely, the presence of ε4 was significantly more frequent in patients with AD biomarkers as compared to patients with non-AD profiles, and, in addition, ε4 homozygosity was observed only in AD profiles (Figure 3b–d, p < 0.0001).
Simple Fisher’s exact tests showed significant results for the prediction of the AD biomarker profile according to the APOE genotype (Table 3). Odds ratios for AD were high, accompanied by relatively low sensitivities, but specificities were high. For ε4 homozygocity, the specificity and positive predictive values approached 1 (100%), although the negative predictive values lower.
In order to confirm the above results by better testing predictive ability and controlling for the possible effects of sex and education, we performed two logistic regression models (first: ε4 presence vs. ε4 absence; second: ε4 homozygosity, ε4 heterozygosity and combined ε3/ε2 and ε2/ε2 vs. the “neutral” ε3/ε3 as a reference) (Table 4). Sex (but not education) affected the models significantly. Again, the odds ratios for ε4 presence were high, especially for ε4 homozygosity, with the results of both the logistic regression and the simple Fisher’s exact tests approaching or exceeding 38.

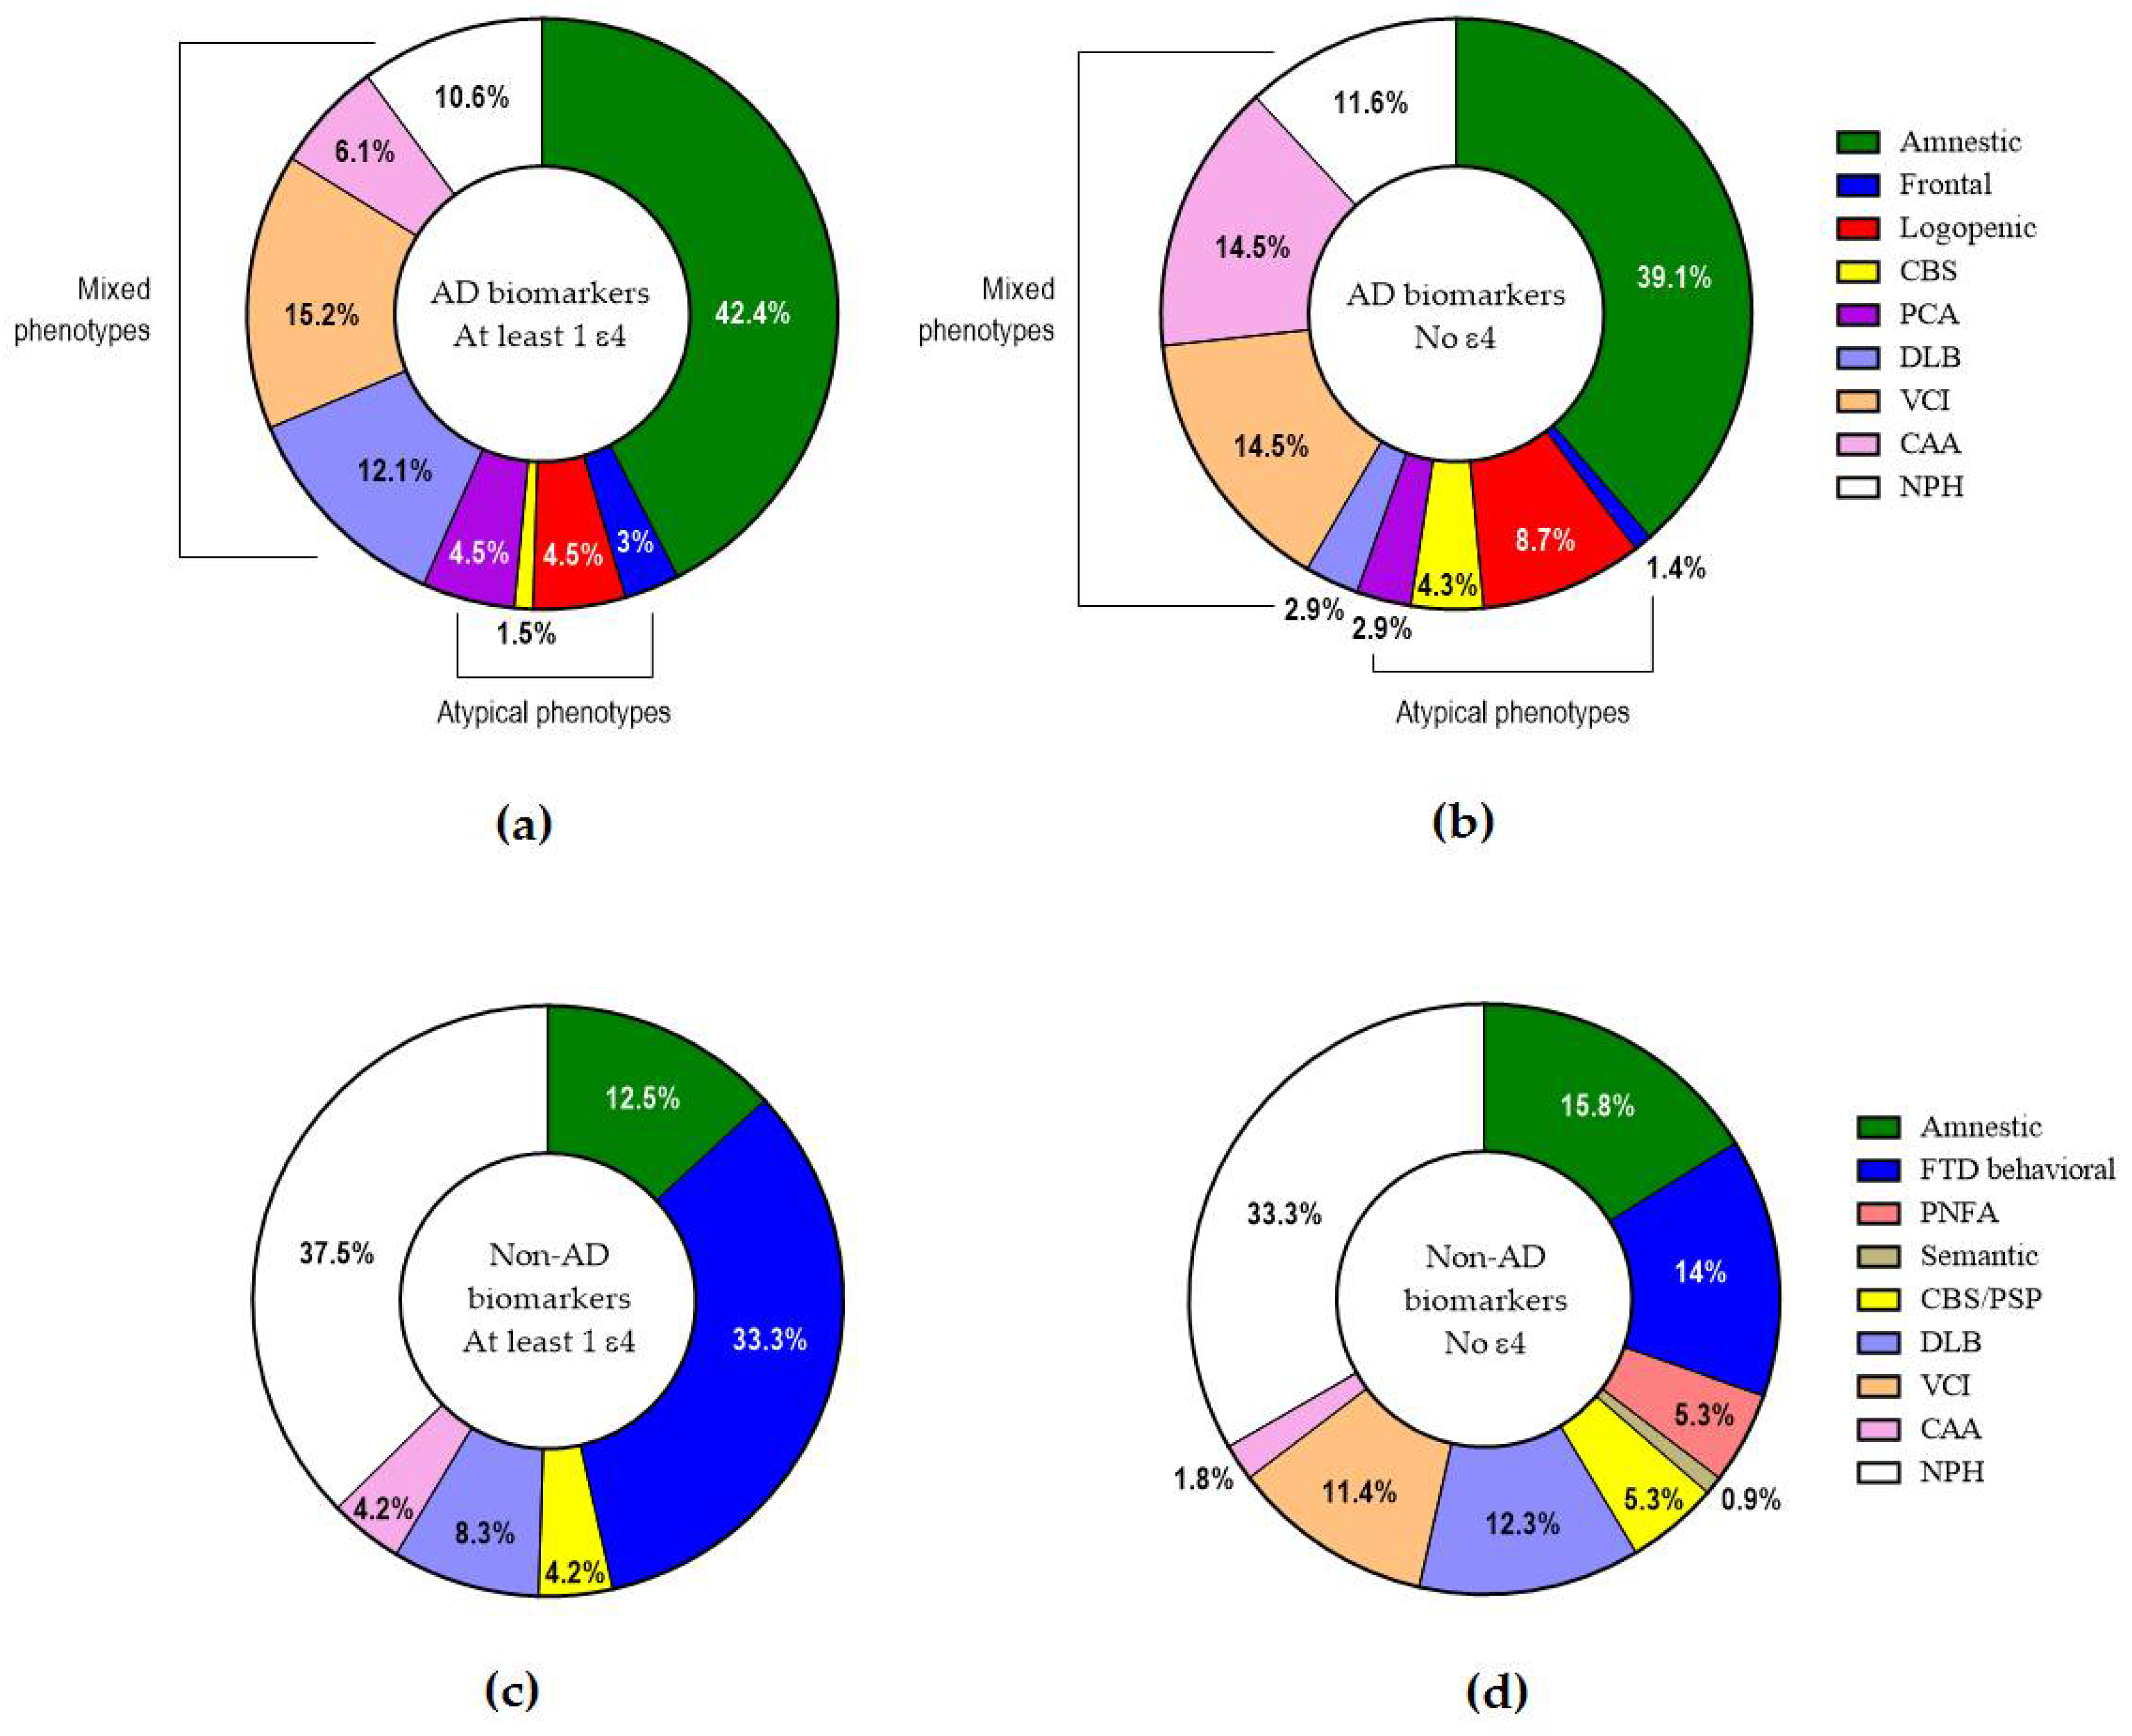
2.4. APOE and Clinical Phenotypes

The frequencies of the various clinical phenotypes/presentations (Figure 4) did not show any significant differences in respect to the presence or absence of ε4. Within AD, the presence or absence of ε4 did not differ among typical, atypical or mixed presentations.

3. Discussion

In this study, the A+T+ profile was used as a diagnostic tool of AD [5,9,17]. On the other hand, the A+T profile may be heterogeneous, and it has been observed that some AD patients may present with normal or marginal τP-181 levels, especially in the case of atypical or mixed presentations [18,19,20,21]. In such cases, an abnormal level of the hybrid τP-181/Aβ42 ratio may be helpful as an indication of AD presence [6,22]. Thus, A+T patients with an increased τP-181/Aβ42 ratio were also considered to have AD, and they were added to those with the A+T+ profile. However, it is recognized that some A+T patients differ in many clinical, neuropsychological and genetic aspects compared to individuals with AD [23,24], and may belong to a different group [25]. Thus, an A+T profile with a normal τP-181/Aβ42 ratio may be considered suggestive of amyloid pathology (Alzheimer’s neuropathological change, Alzheimer’s continuum), but not Alzheimer’s disease [5], and such patients were added to the other non-AD profiles (AT+ and AT).
The main finding of the present study was that all of our cognitively impaired patients with the ε4/ε4 genotype proved to have AD according to their CSF biomarker profile, irrespective of the phenotype, and vice versa, homozygosity was present only in AD patients. The positive predictive value of 100% makes almost certain the (co)existence of AD in an ε4/ε4 person developing cognitive impairment. Although this observation is partly in accordance with the suggestion that ε4 homozygocity may represent a distinct genetic form of AD [16], we must keep in mind that the present study was conducted as a cross-sectional study of already-symptomatic patients, and did not examine how many ε4 homozygotes will develop AD during their lifetime. Furthermore, although the specificity of ε4 homozygocity for AD presence is 100% with a narrow 95% confidence interval, this is not true for the positive predictive value. The latter is 100%, (Table 3), but the relatively wide 95% confidence interval (77–100%) may indicate that AD might not be present in all ε4/ε4 patients. Indeed, it has been shown that ε4 homozygosity becomes “deterministic” only with the coexistence of loss-of-function SORL1 mutations [7,26].
We also observed that in AD, ε4 homozygosity seemed to have a peak incidence of symptom onset that was 5 and 10 years earlier compared to that for ε4 heterozygosity and ε4 absence. This is similar to other observations [27]. The cumulative incidence of age of symptom onset for ε4 presence seemed to be shifted towards earlier ages compared to that for ε4 absence; however, there was no clear-cut difference between ε4 homozygosity and heterozygosity, and the mean age of onset between these two groups was comparable. This could be attributed to the low number of patients in the ε4/ε4 group and/or to other risk factors present in the studied population. However, this shift towards earlier ages in the presence of ε4 was also observed in non-AD patients, indicating that ε4 may exert an effect in other causes of cognitive impairment. Indeed, ε4 may be a risk factor or modifier for dementia with Lewy bodies (DLB), vascular cognitive impairment (VCI), cerebral amyloid angiopathy (CAA) and, possibly, even for the frontotemporal dementia-amyotrophic lateral sclerosis complex [13,28,29,30,31,32,33,34].
We also observed that ε4 presence is associated with abnormal amyloid and tau biomarkers compared to ε4 absence, and this has been reported previously [10] with the aid of positron emission tomography [35,36]. However, we observed that, when controlling for the type of dementing disease, only amyloid-related markers were adversely affected by ε4, indicating an independent effect of ε4 on brain amyloidogenesis.
There are some limitations to the present study. (a) The number of patients was relatively low, but this is an inherent problem in one-center studies. Subsequently, the limited percentage of ε4 homozygotes, despite it being comparable with that for larger cohorts [16], constrains the generalizability and the statistical power for this subgroup. (b) The results of the present study should be viewed with caution in terms of population characteristics, since all patients were of Greek ancestry, and no data were available for other ethnicities. (c) Despite maximal effort for accurate biomarker-based diagnosis (including participation in external quality control programs), all of our patients are still alive, and no pathological verification (which is the gold standard for AD diagnosis) is available. Furthermore, the presence of some neurodegenerative co-pathologies cannot be excluded. Biomarkers do suggest the presence or absence of AD, but they cannot clarify whether AD is the most important of the co-pathologies which could be present [3]. (d) Polymorphisms/mutations in other genes known to affect the risk of AD [1,4] were not studied, notably SORL1and TREM2, which are of great importance as risk genes. (e) The effects of cardiovascular risk factors [37] such as hypertension, diabetes and dyslipidemia were not investigated. (f) The cross-sectional design of the presented study limits the capacity to identify disease progression over time, underscoring the necessity of longitudinal data. Thus, the present study should be considered as a pilot study, the observations should be considered preliminary and the results should be interpreted with caution. Further studies are needed that include a larger number of participants and take into account other mutations in risk genes and the effect of cardiovascular risk factors.
In conclusion, ε4 homozygosity seems to be strongly related to AD and to predict its presence. Some effects, especially on the age of onset of cognitive impairment and on amyloidogenesis, may be independent of the presence or absence of AD.

4. Materials and Methods
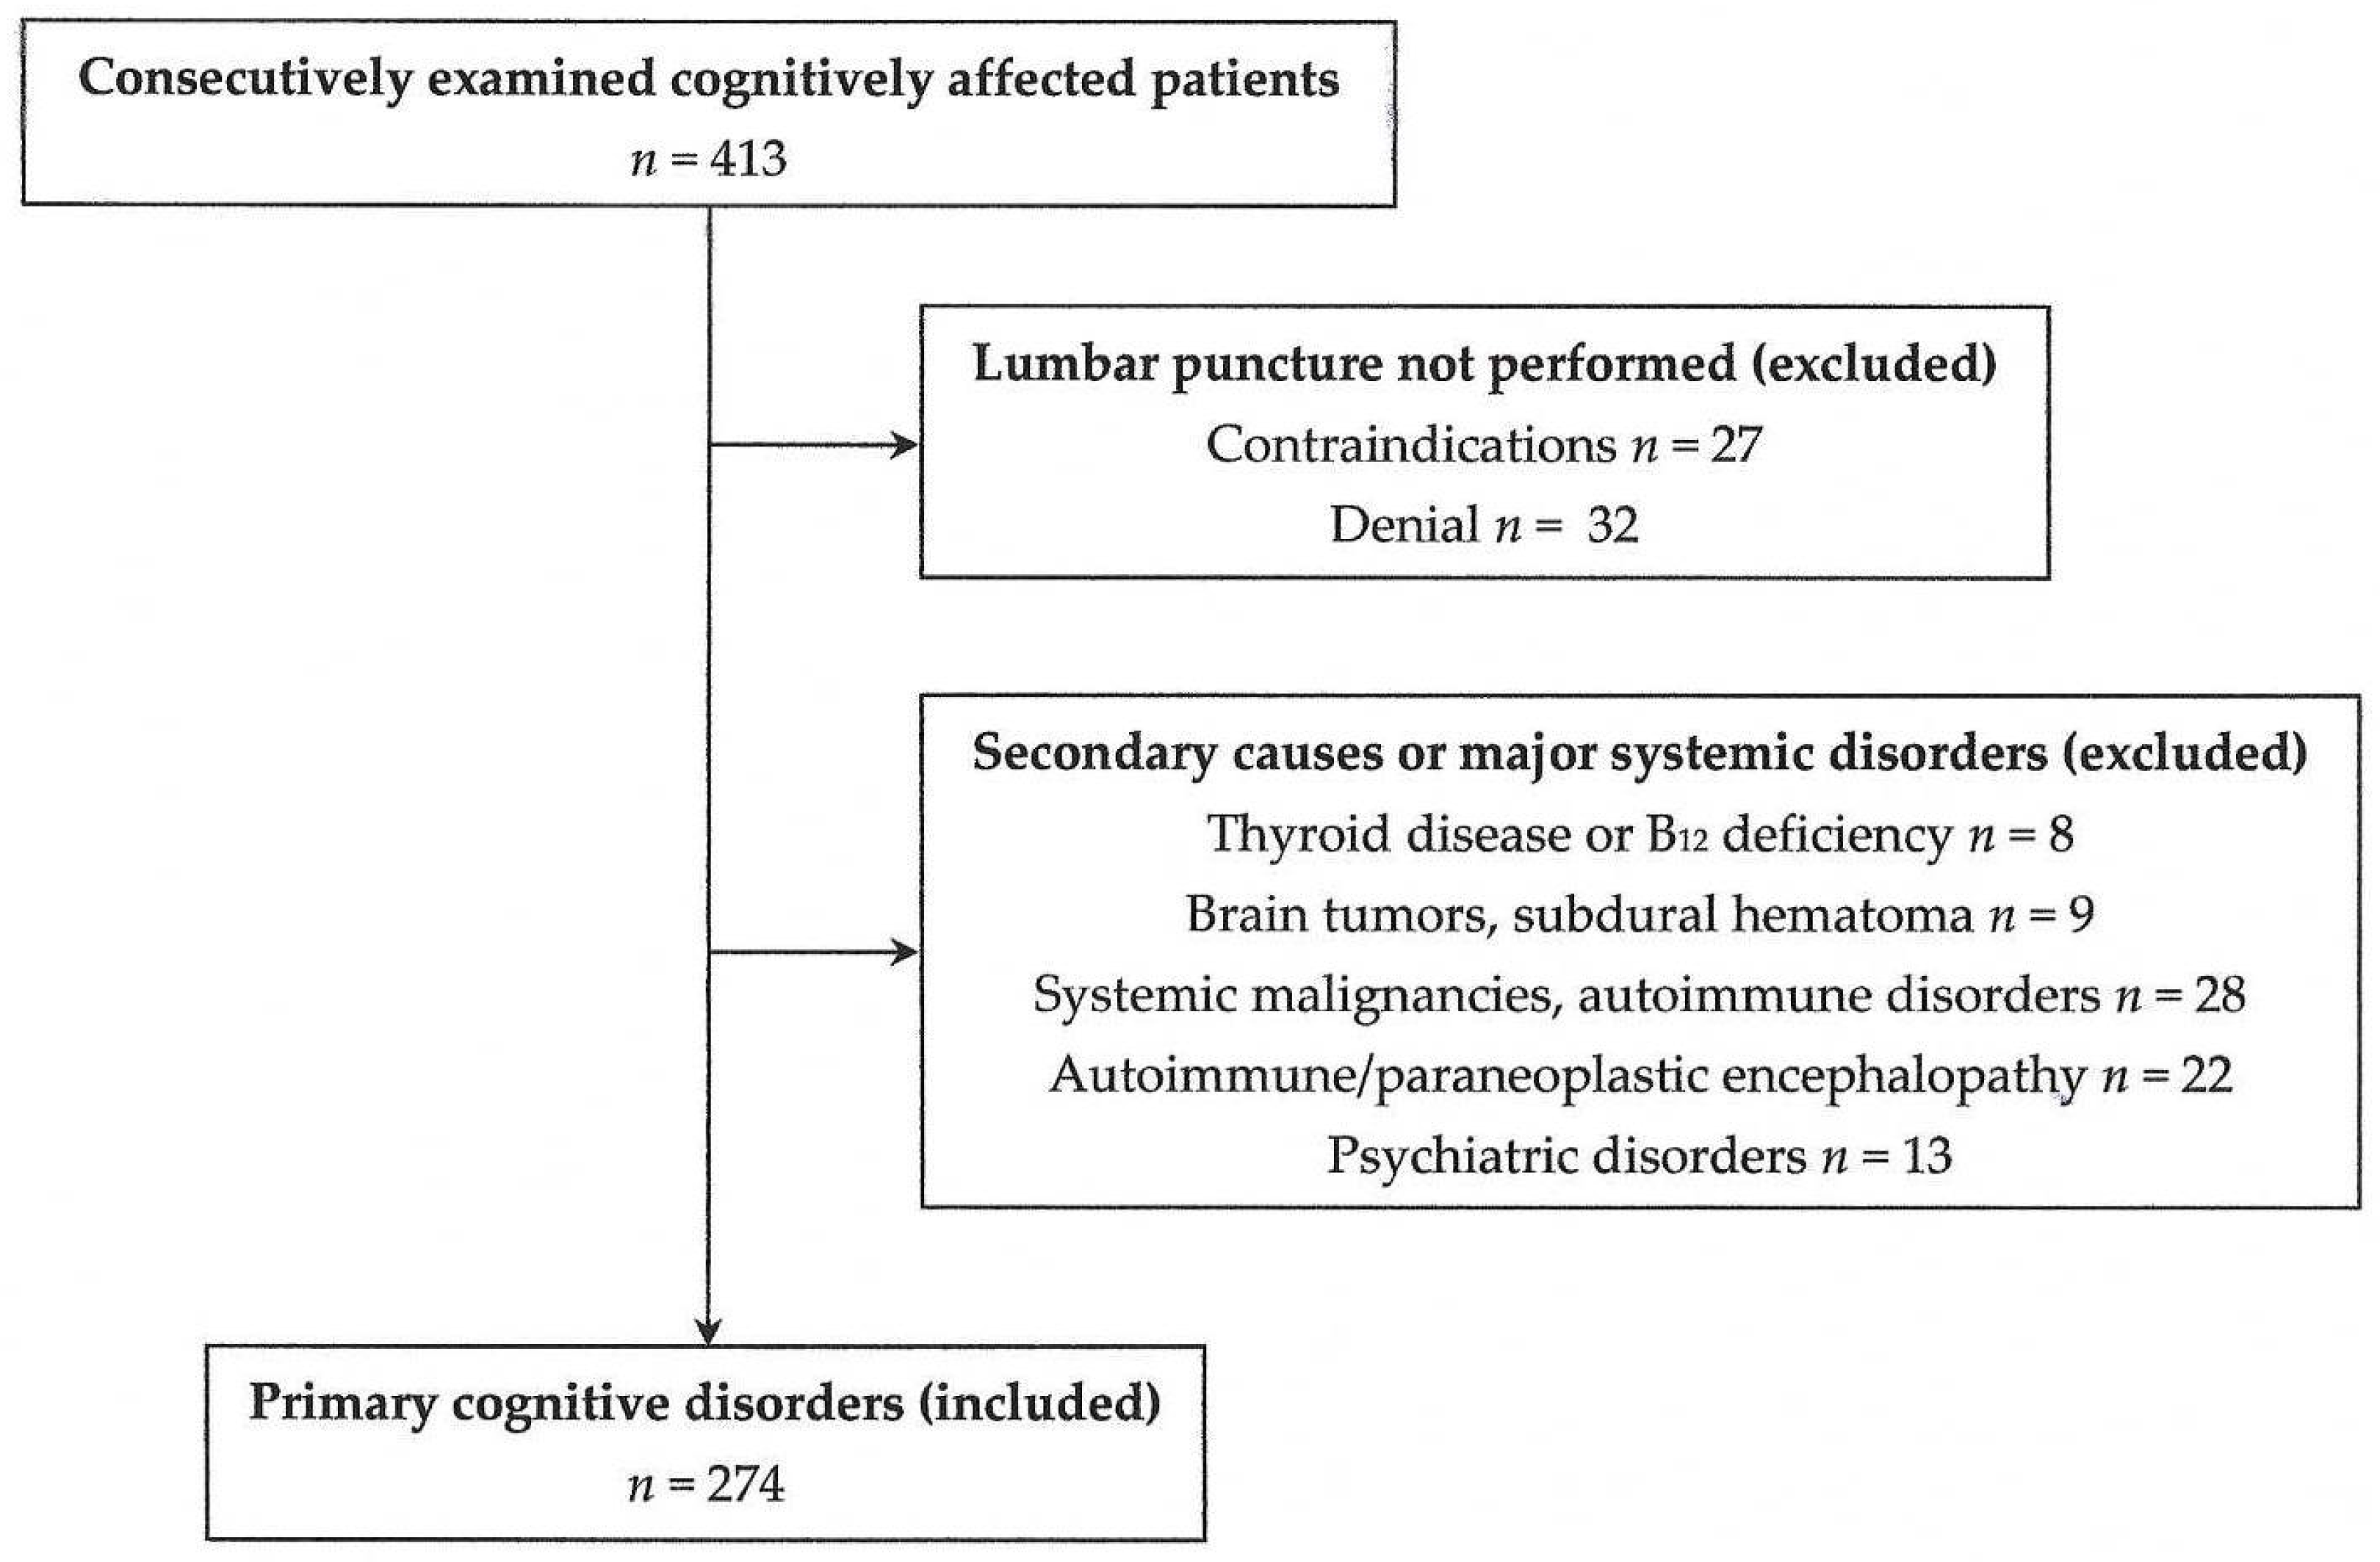
4.1. Study Design

All patients were consecutively examined in the outpatient clinic and hospitalized in the 2nd Department of Neurology between May 2021 and December 2024. The study was cross-sectional and received the approval of the Ethics Committee and the Scientific Board of “Attikon” Hospital (project identification codes of approval: 157, 16 March 2021 and A13, 7 April 2021, respectively), and it was conducted in accordance with the ethical guidelines of the 1964 Declaration of Helsinki. Written informed consent was provided by all participants and/or their next of kin.
The criterion for inclusion was the presence of a primary cognitive disorder due to a neurodegenerative or vascular brain disorder. Normal-pressure hydrocephalus was also included, since it may coexist and interact with AD or other primary disorders. For diagnosis, internationally accepted criteria/guidelines were used [2,3,5,7,38,39,40,41,42,43,44,45,46]
The criteria for exclusion were as follows: (a) the presence of a major systemic disorder (including malignancies and autoimmune disorders) or major psychiatric disorder (including chronic schizophrenia and mood disorder); (b) the presence of secondary causes of cognitive impairment, such as a central nervous system infection (including neurosyphilis), tumors, subdural hematoma or autoimmune/paraneoplastic encephalopathy; (c) the presence of vitamin B12 deficiency or hypothyroidism (allowed if restored for at least 6 months); (d) a history of stroke within the last 6 months; and (e) denial or contraindications for lumbar puncture, including anticoagulation or a low platelet count.
Since this was intended to be a pilot study, data until the end of December 2024 were collected for preliminary observations, without the prior use of power analysis (Figure 5). In addition, no control group was used, since the study aimed to examine the role of the APOE genotype within cognitively impaired patients, and not to make comparisons with the general population.

4.2. Patient Clinical Approach

Initially, a detailed history and complete physical and neurological examination results, as well as neuropsychological testing results, were recorded for all patients. The Mini Mental State Examination (MMSE) [47] and Addenbrooke’s Cognitive Examination—Revised version (ACE-R) [48], both of which are validated in Greece [49,50], were used for estimating the degree of cognitive decline. Routine 3-Tesla magnetic resonance imaging (MRI) scans with 3D T1W images were performed, and Medial Temporal lobe Atrophy (MTA) [51] and Entorhinal Cortex Atrophy (ERICA) [52] visual scores were used as crude estimates of atrophy of the hippocampal formation and the (trans)entorhinal cortex, respectively.

4.3. Lumbar Puncture and CSF Biomarker Assessments

Following overnight fasting, lumbar puncture was performed at the L4–L5 interspace using a standard, 21–22G, Quincke-type needle, and CSF was collected in polypropylene tubes, handled and stored as previously described [53]. The classical CSF biomarkers, Aβ42, Aβ40, τP-181 and total tau (τT), were assessed in 3 laboratories in Athens, Greece, according to locality.
Laboratory 1 (Neurochemistry and Biological Markers Unit of the 1st Department of Neurology, “Eginition” Hospital) assessed CSF samples from 135 patients, using double sandwich enzyme-linked immunosorbent assay (ELISA) in an automated Euroimmun Analyzer I (Euroimmun, Lübeck, Germany), performed with commercially available kits (EUROIMMUN Beta-Amyloid (1–42) ELISA, EUROIMMUN Beta-Amyloid (1–40) ELISA, EUROIMMUN pTau(181) ELISA and EUROIMMUN Total-Tau ELISA, respectively; Euroimmun, Lübeck, Germany), as described elsewhere [21]. The cut-off levels of abnormality for this laboratory were Aβ42 ≤ 690 pg/mL, Aβ42/Aβ40 ≤ 0.105, τP-181 60 pg/mL, τT ≥ 400 pg/mL and τP-181/Aβ42 ≥ 0.09.
Laboratory 2 (Department of Clinical Biochemistry of “Attikon” Hospital) assessed CSF samples from 107 patients using double sandwich ELISA performed with commercially available kits (“Innotest® hTau antigen”, “β- amyloid1–42”, “β- amyloid1–40”and “phospho-tau181”, respectively; Fujirebio, Gent, Belgium), according to the manufacturer’s instructions. The cut-off levels of abnormality for this laboratory were Aβ42 ≤ 520 pg/mL, Aβ42/Aβ40 ≤ 0.044, τP-181 ≥ 52 pg/mL, τT ≥ 375 pg/mL and τP-181/Aβ42 ≥ 0.068. In the event of conflicting/marginal results, the CSF was cross-tested by the new CE-IVD Roche reagents that employ the Cobas 8000 automated platform in the e801 immunochemical analyzer, with a cut-off value for abnormality of a τP-181/Aβ42 ratio > 0.023.
Laboratory 3 (Tzartos NeuroDiagnostics) assessed CSF samples from 32 patients using chemi-luminescence measured with a Lumipulse 600G automatic analyzer (Fujirebio, Gent, Belgium), as reported previously [54]. The cut-off values of abnormality for this laboratory were Aβ42 ≤ 520 pg/mL, Aβ42/Aβ40 ≤ 0.063, τP-181 ≥ 60 pg/mL, τT ≥ 360 pg/mL and τP-181/Aβ42 ≥ 0.09.
For external quality control, laboratories 1 and 3 participated in “The Alzheimer’s Association’s QC program for CSF and blood biomarkers” [55]. Laboratory 2 followed the External Quality Assessment (EQA) for both CSF biomarkers and APOE genotyping by INSTAND e.V., an ISO17043-accredited organization [56]

4.4. CSF Biomarker Profiling

Following assessments of CSF biomarkers, the profile of each patient was determined according to the AT(N) classification system [5]. The AD profile was a priori defined as A+T+ [5,9,17]. Since some patients with AD may present with normal or marginal τP-181 levels [18,19,20,21], patients with the A+T profile (as well as AT+ and AT profiles) were further tested for possible evidence of AD. Since amyloid PET studies are costly and are not reimbursed in Greece, the hybrid τP-181/Aβ42 ratio, which may helpful in doubtful cases [22], was used instead [6]. All of the AT+ and AT patients showed normal τP-181/Aβ42, suggesting a non-AD diagnosis. Some of the A+T patients showed increased τP-181/Aβ42, which was considered suggestive of AD presence. When the A+T profile was accompanied by normal τP-181/Aβ42, this was considered to be an indication of amyloid pathology in the absence of concomitant tangle pathology, placing the patient somewhere on the Alzheimer’s continuum, but not indicating the presence of Alzheimer’s disease [5].

4.5. APOE Genotyping

Genotyping of APOE was performed at the Department of Clinical Biochemistry of “Attikon” Hospital as previously described [11]. In brief, blood was collected in EDTA-containing tubes and centrifuged. Genomic DNA was extracted using the “High Pure PCR Template Kit” (Roche, Mannheim, Germany) and amplified using a “real-time qPCR kit” (TIB MolBiol, Berlin, Germany) with the “Light Cycler PCR” platform (Roche, Mannheim, Germany).

4.6. Statistical Analysis

All numerical variables were checked for normality and homogeneity of variances by Shapiro–Wilk and Leven’s tests, respectively, and parametric or nonparametric tests were used appropriately. For CSF τP-181, τT and τP-181/Aβ42, deviations from normality and/or homogeneity of variances were noted. Logarithmic transformation restored the above violations and permitted the use of ANOVA models. For dichotomous or categorical variables, χ2 or Fisher’s exact tests were used. Logistic regression models were also used for predicting AD biomarker profiles. For statistical analysis, the following software packages were used: Statistica version 8.0, 2008 (StatSoft Inc., Tulsa, OK, USA); Prism version 6.01, 2012 (GraphPad Software Inc., San Diego, CA, USA); and MedCalc ® version 12.5, 2013 (MedCalc Software, Ostend, Belgium). The level of statistical significance was set at p < 0.05.

Author Contributions

Conceptualization, I.T., A.A., F.B., C.Z., C.K., V.C.C., S.G., J.S.T., S.J.T., P.M., E.K., G.T. and G.P.P.; data curation, I.T., A.A., F.B., A.T., A.M., A.B., C.K., J.S.T., S.J.T., G.V., C.Z., P.M., P.G.P., S.G. and G.P.P.; formal analysis, I.T., V.C.C., A.M., C.K., P.M., F.B., A.T., A.A., C.Z., J.S.T., S.J.T., G.V., P.G.P., A.B., E.K., G.T. and G.P.P.; investigation, I.T., F.B., A.A., A.M., A.T., C.K., J.S.T., S.J.T., G.V., C.Z., P.G.P., A.B., E.K., G.T. and G.P.P.; methodology, I.T., A.A., V.C.C., G.V., F.B., J.S.T., S.J.T., C.K., P.M., A.T., S.G., E.K., G.T. and G.P.P.; project administration, E.K., C.K., P.M., G.T. and G.P.P.; supervision, S.G., E.K., C.K., P.M., G.T. and G.P.P.; visualization, S.G., E.K., G.T. and G.P.P.; writing—original draft, I.T., V.C.C., P.G.P., J.S.T., A.M., A.T. and G.P.P.; writing—review and editing, I.T., A.A., F.B., C.K., P.M., G.V., C.Z., A.B., S.G., J.S.T., S.J.T., E.K., G.T. and G.P.P. All authors have read and agreed to the published version of the manuscript.

Funding

E.K. received research funding from ELPEN Pharmaceutical Co. Inc. and NUTRICIA (funding numbers: 33/22-10-20 and 726/20-11-20, respectively). C.K. received reagents from Roche Diagnostics (ELKE NKUA #19635 funding).

Institutional Review Board Statement

This study was conducted in accordance with the ethical guidelines of the 1964 Declaration of Helsinki, and had the approval of the Ethics Committee and the Scientific Board of “Attikon” Hospital (project identification codes of approval: 157, 16 March 2021 and A13, 7 April 2021, respectively).

Informed Consent Statement

Informed consent was obtained from all subjects involved in the study and/or next-of-kin caregivers (depending on the severity of cognitive impairment).

Data Availability Statement

The data presented in this study are available upon request from the corresponding author. The data are not publicly available due to privacy restrictions.

Acknowledgments

We would like to thank the patients and their caregivers for their participation.

Conflicts of Interest

G.T., G.P.P., I.T, A.A., C.Z. and A.B. are clinical investigators in the “EVOKE” and “EVOKE plus” trials of semaglutide for early Alzheimer’s disease (NovoNordisk, NCT04777396 and NCT04777409, respectively). G.P.P received fees from Biogen International and from ITF Hellas, as a consultant of advisory boards. C.K. declares fees from Roche, Abbott and Snibe. S.J.T has shares in the research and diagnosis laboratory Tzartos NeuroDiagnostics. The funders had no role in the design of the study; in the collection, analyses, or interpretation of data; in the writing of the manuscript; or in the decision to publish the results.

Abbreviations

The following abbreviations are used in this manuscript:
ADAlzheimer’s disease
APOEApolipoprotein E
MMSEMini Mental State Examination
ACE-RAddenbrooke’s Cognitive Examination—Revised version
MTAMedial Temporal Atrophy score
ERICAEntorhinal Cortex Atrophy score
ANOVAAnalysis of Variance
CBSCorticobasal syndrome
FTDFrontotemporal dementia
PSPProgressive supranuclear palsy
PCAPosterior cortical atrophy
DLBDementia with Lewy bodies
VCIVascular cognitive impairment
CAACerebral amyloid angiopathy
NPHNormal-pressure hydrocephalus

References

  1. Scheltens, P.; De Strooper, B.; Kivipelto, M.; Holstege, H.; Chételat, G.; Teunissen, C.E.; Cummings, J.; van der Flier, W.M. Alzheimer’s disease. Lancet 2021, 397, 1577–1590. [Google Scholar] [CrossRef] [PubMed]
  2. Dubois, B.; Feldman, H.H.; Jacova, C.; Hampel, H.; Molinuevo, J.L.; Blennow, K.; DeKosky, S.T.; Gauthier, S.; Selkoe, D.; Bateman, R.; et al. Advancing research diagnostic criteria for Alzheimer’s disease: The IWG-2 criteria. Lancet Neurol. 2014, 13, 614–629. [Google Scholar] [CrossRef]
  3. Dubois, B.; Villain, N.; Frisoni, G.B.; Rabinovici, G.D.; Sabbagh, M.; Cappa, S.; Bejanin, A.; Bombois, S.; Epelbaum, S.; Teichmann, M.; et al. Clinical diagnosis of Alzheimer’s disease: Recommendations of the International Working Group. Lancet Neurol. 2021, 20, 484–496. [Google Scholar] [CrossRef]
  4. De Strooper, B.; Karran, E. The cellular phase of Alzheimer’s disease. Cell 2016, 164, 603–615. [Google Scholar] [CrossRef]
  5. Jack, C.R., Jr.; Bennett, D.A.; Blennow, K.; Carrillo, M.C.; Dunn, B.; Haeberlein, S.B.; Holtzman, D.M.; Jagust, W.; Jessen, F.; Karlawish, J.; et al. NIA-AA Research Framework: Toward a biological definition of Alzheimer’s disease. Alzheimers Dement. 2018, 14, 535–562. [Google Scholar] [CrossRef]
  6. Jack, C.R., Jr.; Andrews, J.S.; Beach, T.G.; Buracchio, T.; Dunn, B.; Graf, A.; Hansson, O.; Ho, C.; Jagust, W.; McDade, E.; et al. Revised criteria for diagnosis and staging of Alzheimer’s disease: Alzheimer’s Association Workgroup. Alzheimers Dement. 2024, 20, 5143–5169. [Google Scholar] [CrossRef]
  7. Dubois, B.; Villain, N.; Schneider, L.; Fox, N.; Campbell, N.; Galasko, D.; Kivipelto, M.; Jessen, F.; Hanseeuw, B.; Boada, M.; et al. Alzheimer Disease as a Clinical-Biological Construct-An International Working Group Recommendation. JAMA Neurol. 2024, 81, 1304–1311. [Google Scholar] [CrossRef] [PubMed]
  8. Frisoni, G.B.; Festari, C.; Massa, F.; Cotta Ramusino, M.; Orini, S.; Aarsland, D.; Agosta, F.; Babiloni, C.; Borroni, B.; Cappa, S.F.; et al. European intersocietal recommendations for the biomarker-based diagnosis of neurocognitive disorders. Lancet Neurol. 2024, 23, 302–312. [Google Scholar] [CrossRef] [PubMed]
  9. Villain, N.; Planche, V.; Lilamand, M.; Cordonnier, C.; Soto-Martin, M.; Mollion, H.; Bombois, S.; Delrieu, J.; French Federation of Memory Clinics Work Group on Anti-Amyloid Immunotherapies. Lecanemab for early Alzheimer’s disease: Appropriate use recommendations from the French federation of memory clinics. J. Prev. Alzheimers Dis. 2025, 12, 100094. [Google Scholar] [CrossRef]
  10. Koutsodendris, N.; Nelson, M.R.; Rao, A.; Huang, Y. Apolipoprotein E and Alzheimer’s disease: Findings, hypotheses, and potential mechanisms. Annu. Rev. Pathol. 2022, 17, 73–99. [Google Scholar] [CrossRef]
  11. Papastefanopoulou, V.; Stanitsa, E.; Koros, C.; Simoudis, A.; Florou-Hatziyiannidou, C.; Beratis, I.; Antonelou, R.; Andronas, N.; Voskou, P.; Angelopoulou, E.; et al. APOE Allele Frequency in Southern Greece: Exploring the Role of Geographical Gradient in the Greek Population. Geriatrics 2022, 8, 1. [Google Scholar] [CrossRef]
  12. Genin, E.; Hannequin, D.; Wallon, D.; Sleegers, K.; Hiltunen, M.; Combarros, O.; Bullido, M.J.; Engelborghs, S.; De Deyn, P.; Berr, C.; et al. APOE and Alzheimer disease: A major gene with semi-dominant inheritance. Mol. Psychiatry 2011, 16, 903–907. [Google Scholar] [CrossRef]
  13. Hu, H.; Wan, S.; Hu, Y.; Wang, Q.; Li, H.; Zhang, N. Deciphering the role of APOE in cerebral amyloid angiopathy: From genetic insights to therapeutic horizons. Ann. Med. 2025, 57, 2445194. [Google Scholar] [CrossRef]
  14. Li, Z.; Shue, F.; Zhao, N.; Shinohara, M.; Bu, G. APOE2: Protective mechanism and therapeutic implications for Alzheimer’s disease. Mol. Neurodegener. 2020, 15, 63. [Google Scholar] [CrossRef] [PubMed]
  15. Morrison, C.; Dadar, M.; Kamal, F.; Collins, D.L.; Alzheimer’s Disease Neuroimaging Initiative. Differences in Alzheimer’s Disease-Related Pathology Profiles across Apolipoprotein Groups. J. Gerontol. A Biol. Sci. Med. Sci. 2024, 79, 1–10 glad254. [Google Scholar]
  16. Fortea, J.; Pegueroles, J.; Alcolea, D.; Belbin, O.; Dols-Icardo, O.; Vaqué-Alcázar, L.; Videla, L.; Gispert, J.D.; Suárez-Calvet, M.; Johnson, S.C.; et al. APOE4 homozygozity represents a distinct genetic form of Alzheimer’s disease. Nat. Med. 2024, 30, 1284–1291. [Google Scholar] [CrossRef] [PubMed]
  17. Paraskevas, G.P.; Kapaki, E. Cerebrospinal Fluid Biomarkers for Alzheimer’s Disease in the Era of Disease-Modifying Treatments. Brain Sci. 2021, 11, 1258. [Google Scholar] [CrossRef]
  18. Paterson, R.W.; Toombs, J.; Slattery, C.F.; Nicholas, J.M.; Andreasson, U.; Magdalinou, N.K.; Blennow, K.; Warren, J.D.; Mummery, C.J.; Rossor, M.N.; et al. Dissecting IWG-2 typical and atypical Alzheimer’s disease: Insights from cerebrospinal fluid analysis. J. Neurol. 2015, 262, 2722–2730. [Google Scholar] [CrossRef] [PubMed]
  19. Yong, K.X.X.; Graff-Radford, J.; Ahmed, S.; Chapleau, M.; Ossenkoppele, R.; Putcha, D.; Rabinovici, G.D.; Suarez-Gonzalez, A.; Schott, J.M.; Crutch, S.; et al. Diagnosis and Management of Posterior Cortical Atrophy. Curr. Treat. Options Neurol. 2023, 25, 23–43. [Google Scholar] [CrossRef]
  20. Dubois, B.; von Arnim, C.A.F.; Burnie, N.; Bozeat, S.; Cummings, J. Biomarkers in Alzheimer’s disease: Role in early and differential diagnosis and recognition of atypical variants. Alzheimers Res. Ther. 2023, 15, 175. [Google Scholar] [CrossRef]
  21. Tsantzali, I.; Athanasaki, A.; Boufidou, F.; Constantinides, V.C.; Stefanou, M.I.; Moschovos, C.; Zompola, C.; Paraskevas, S.G.; Bonakis, A.; Giannopoulos, S.; et al. Cerebrospinal Fluid Classical Biomarker Levels in Mixed vs. Pure A+T+ (A+T1+) Alzheimer’s Disease. Biomedicines 2024, 12, 2904. [Google Scholar] [CrossRef]
  22. Paraskevas, G.P.; Kasselimis, D.; Kourtidou, E.; Constantinides, V.; Bougea, A.; Potagas, C.; Evdokimidis, I.; Kapaki, E. Cerebrospinal Fluid Biomarkers as a Diagnostic Tool of the Underlying Pathology of Primary Progressive Aphasia. J. Alzheimers Dis. 2017, 55, 1453–31461. [Google Scholar] [CrossRef]
  23. Josephs, K.A.; Weigand, S.D.; Whitwell, J.L. Characterizing Amyloid-Positive Individuals With Normal Tau PET Levels After 5 Years: An ADNI Study. Neurology 2022, 98, e2282–e2292. [Google Scholar] [CrossRef] [PubMed]
  24. Prosser, L.; Sudre, C.H.; Oxtoby, N.P.; Young, A.L.; Malone, I.B.; Manning, E.N.; Pemberton, H.; Walsh, P.; Barkhof, F.; Biessels, G.J.; et al. Biomarker pathway heterogeneity of amyloid-positive individuals. Alzheimers Dement. 2024, 20, 8503–8515. [Google Scholar] [CrossRef]
  25. Kovacs, G.G.; Katsumata, Y.; Wu, X.; Aung, K.Z.; Fardo, D.W.; Forrest, S.L.; Alzheimer’s Disease Genetics Consortium; Nelson, P.T. Amyloid-beta predominant Alzheimer’s disease neuropathologic change. Brain 2025, 148, 401–407. [Google Scholar] [CrossRef] [PubMed]
  26. Schramm, C.; Charbonnier, C.; Zaréa, A.; Lacour, M.; Wallon, D.; CNRMAJ collaborators; Boland, A.; Deleuze, J.F.; Olaso, R.; ADES consortium; et al. Penetrance estimation of Alzheimer disease in SORL1 loss-of-function variant carriers using a family-based strategy and stratification by APOE genotypes. Genome Med. 2022, 14, 69. [Google Scholar] [CrossRef]
  27. Saddiki, H.; Fayosse, A.; Cognat, E.; Sabia, S.; Engelborghs, S.; Wallon, D.; Alexopoulos, P.; Blennow, K.; Zetterberg, H.; Parnetti, L.; et al. Age and the association between apolipoprotein E genotype and Alzheimer disease: A cerebrospinal fluid biomarker-based case-control study. PLoS Med. 2020, 17, e1003289. [Google Scholar] [CrossRef]
  28. Lozupone, M.; Leccisotti, I.; Mollica, A.; Berardino, G.; Moretti, M.C.; Altamura, M.; Bellomo, A.; Daniele, A.; Dibello, V.; Solfrizzi, V.; et al. Neuropsychiatric symptoms and apolipoprotein E genotypes in neurocognitive disorders. Neural Regen. Res. 2025, 21, 1528–1541. [Google Scholar] [CrossRef]
  29. Theodorou, A.; Tsantzali, I.; Kapaki, E.; Constantinides, V.C.; Voumvourakis, K.; Tsivgoulis, G.; Paraskevas, G.P. Cerebrospinal fluid biomarkers and apolipoprotein E genotype in cerebral amyloid angiopathy. A narrative review. Cereb. Circ. Cogn. Behav. 2021, 2, 100010. [Google Scholar] [CrossRef] [PubMed]
  30. Hayes, C.A.; Thorpe, R.J., Jr.; Odden, M.C. Age-dependent interactions of APOE isoform 4 and Alzheimer’s disease neuropathology: Findings from the NACC. Acta Neuropathol. Commun. 2025, 13, 102. [Google Scholar] [CrossRef]
  31. Hou, X.; Heckman, M.G.; Fiesel, F.C.; Koga, S.; Soto-Beasley, A.I.; Watzlawik, J.O.; Zhao, J.; Valentino, R.R.; Johnson, P.W.; White, L.J.; et al. Genome-wide association analysis identifies APOE as a mitophagy modifier in Lewy body disease. Alzheimers Dement. 2025, 21, e70198. [Google Scholar] [CrossRef]
  32. Fernández-Calle, R.; Konings, S.C.; Frontiñán-Rubio, J.; García-Revilla, J.; Camprubí-Ferrer, L.; Svensson, M.; Martinson, I.; Boza-Serrano, A.; Venero, J.L.; Nielsen, H.M.; et al. APOE in the bullseye of neurodegenerative diseases: Impact of the APOE genotype in Alzheimer’s disease pathology and brain diseases. Mol. Neurodegener. 2022, 17, 62. [Google Scholar] [CrossRef]
  33. Islam, S.; Noorani, A.; Sun, Y.; Michikawa, M.; Zou, K. Multi-functional role of apolipoprotein E in neurodegenerative diseases. Front. Aging Neurosci. 2025, 17, 1535280. [Google Scholar] [CrossRef]
  34. Grimaldi, L.; Bovi, E.; Formisano, R.; Sancesario, G. ApoE: The Non-Protagonist Actor in Neurological Diseases. Genes 2024, 15, 1397. [Google Scholar] [CrossRef] [PubMed]
  35. Lim, Y.Y.; Mormino, E.C. APOE genotype and early β-amyloid accumulation in older adults without dementia. Neurology 2017, 89, 1028–1034. [Google Scholar] [CrossRef] [PubMed]
  36. Mattsson, N.; Ossenkoppele, R.; Smith, R.; Strandberg, O.; Ohlsson, T.; Jögi, J.; Palmqvist, S.; Stomrud, E.; Hansson, O. Greater tau load and reduced cortical thickness in APOE ε4-negative Alzheimer’s disease: A cohort study. Alzheimers Res. Ther. 2018, 10, 77. [Google Scholar] [CrossRef] [PubMed]
  37. Losinski, G.M.; Key, M.N.; Vidoni, E.D.; Clutton, J.; Morris, J.K.; Burns, J.M.; Watts, A. APOE4 and chronic health risk factors are associated with sex-specific preclinical Alzheimer’s disease neuroimaging biomarkers. Front. Glob. Womens Health 2025, 6, 1531062. [Google Scholar] [CrossRef]
  38. Gorno-Tempini, M.L.; Hillis, A.E.; Weintraub, S.; Kertesz, A.; Mendez, M.; Cappa, S.F.; Ogar, J.M.; Rohrer, J.D.; Black, S.; Boeve, B.F.; et al. Classification of primary progressive aphasia and its variants. Neurology 2011, 76, 1006–1014. [Google Scholar] [CrossRef]
  39. Crutch, S.J.; Schott, J.M.; Rabinovici, G.D.; Murray, M.; Snowden, J.S.; van der Flier, W.M.; Dickerson, B.C.; Vandenberghe, R.; Ahmed, S.; Bak, T.H.; et al. Consensus classification of posterior cortical atrophy. Alzheimers Dement. 2017, 13, 870–884. [Google Scholar] [CrossRef]
  40. Sachdev, P.; Kalaria, R.; O’Brien, J.; Skoog, I.; Alladi, S.; Black, S.E.; Blacker, D.; Blazer, D.G.; Chen, C.; Chui, H.; et al. Diagnostic criteria for vascular cognitive disorders: A VASCOG statement. Alzheimer Dis. Assoc. Disord. 2014, 28, 206–218. [Google Scholar] [CrossRef]
  41. McKeith, I.G.; Boeve, B.F.; Dickson, D.W.; Halliday, G.; Taylor, J.P.; Weintraub, D.; Aarsland, D.; Galvin, J.; Attems, J.; Ballard, C.G.; et al. Diagnosis and management of dementia with Lewy bodies. Fourth consensus report of the DLB Consortium. Neurology 2017, 89, 88–100. [Google Scholar] [CrossRef]
  42. Postuma, R.B.; Berg, D.; Stern, M.; Poewe, W.; Olanow, C.W.; Oertel, W.; Obeso, J.; Marek, K.; Litvan, I.; Lang, A.E.; et al. MDS clinical diagnostic criteria for Parkinson’s disease. Mov. Disord. 2015, 30, 1591–1601. [Google Scholar] [CrossRef]
  43. Rascovsky, K.; Hodges, J.R.; Knopman, D.; Mendez, M.F.; Kramer, J.H.; Neuhaus, J.; Van Swieten, J.C.; Seelaar, H.; Dopper, E.G.P.; Onyike, C.U.; et al. Sensitivity of revised diagnostic criteria for the behavioural variant of frontotemporal dementia. Brain 2011, 134, 2456–2477. [Google Scholar] [CrossRef]
  44. Höglinger, G.U.; Respondek, G.; Stamelou, M.; Kurz, C.; Josephs, K.A.; Lang, A.E.; Mollenhauer, B.; Müller, U.; Nilsson, C.; Whitwell, J.L.; et al. Clinical diagnosis of progressive supranuclear palsy: The movement disorder society criteria. Mov. Disord. 2017, 32, 853–864. [Google Scholar] [CrossRef]
  45. Armstrong, M.J.; Litvan, I.; Lang, A.E.; Bak, T.H.; Bhatia, K.P.; Borroni, B.; Boxer, A.L.; Dickson, D.W.; Grossman, M.; Hallett, M.; et al. Criteria for the diagnosis of corticobasal degeneration. Neurology 2013, 80, 496–503. [Google Scholar] [CrossRef]
  46. Nakajima, M.; Yamada, S.; Miyajima, M.; Ishii, K.; Kuriyama, N.; Kazui, H.; Kanemoto, H.; Suehiro, T.; Yoshiyama, K.; Kameda, M.; et al. Guidelines for Management of Idiopathic Normal Pressure Hydrocephalus (Third Edition): Endorsed by the Japanese Society of Normal Pressure Hydrocephalus. Neurol. Med.-Chir. 2021, 61, 63–97. [Google Scholar] [CrossRef] [PubMed]
  47. Folstein, M.F.; Folstein, S.E.; McHugh, P.R. “Mini-mental state”. A practical method for grading the cognitive state of patients for the clinician. J. Psychiatr. Res. 1975, 12, 189–198. [Google Scholar] [CrossRef] [PubMed]
  48. Mioshi, E.; Dawson, K.; Mitchell, J.; Arnold, R.; Hodges, J.R. The Addenbrooke’s Cognitive Examination Revised (ACE-R): A brief cognitive test battery for dementia screening. Int. J. Geriatr. Psychiatry 2006, 21, 1078–1085. [Google Scholar] [CrossRef] [PubMed]
  49. Fountoulakis, K.N.; Tsolaki, M.; Chantzi, H.; Kazis, A. Mini Mental State Examination (MMSE): A validation study in Greece. Am. J. Alzheimers Dis. Other Demen. 2000, 15, 342–345. [Google Scholar] [CrossRef]
  50. Konstantinopoulou, E.; Kosmidis, M.H.; Ioannidis, P.; Kiosseoglou, G.; Karacostas, D.; Taskos, N. Adaptation of Addenbrooke’s Cognitive Examination-Revised for the Greek population. Eur. J. Neurol. 2011, 18, 442–447. [Google Scholar] [CrossRef]
  51. Scheltens, P.; Leys, D.; Barkhof, F.; Huglo, D.; Weinstein, H.C.; Vermersch, P.; Kuiper, M.; Steinling, M.; Wolters, E.C.; Valk, J. Atrophy of medial temporal lobes on MRI in “probable” Alzheimer’s disease and normal ageing: Diagnostic value and neuropsychological correlates. J. Neurol. Neurosurg. Psychiatry 1992, 55, 967–972. [Google Scholar] [CrossRef] [PubMed]
  52. Enkirch, S.J.; Traschütz, A.; Müller, A.; Widmann, C.N.; Gielen, G.H.; Heneka, M.T.; Jurcoane, A.; Schild, H.H.; Hattingen, E. The ERICA Score: An MR Imaging-based Visual Scoring System for the Assessment of Entorhinal Cortex Atrophy in Alzheimer Disease. Radiology 2018, 288, 226–233. [Google Scholar] [CrossRef] [PubMed]
  53. Tsantzali, I.; Boufidou, F.; Sideri, E.; Mavromatos, A.; Papaioannou, M.G.; Foska, A.; Tollos, I.; Paraskevas, S.G.; Bonakis, A.; Voumvourakis, K.I.; et al. From Cerebrospinal Fluid Neurochemistry to Clinical Diagnosis of Alzheimer’s Disease in the Era of Anti-Amyloid Treatments. Report of Four Patients. Biomedicines 2021, 9, 1376. [Google Scholar] [CrossRef]
  54. Tzartos, J.S.; Boufidou, F.; Stergiou, C.; Kuhle, J.; Willemse, E.; Palaiodimou, L.; Tsantzali, I.; Sideri, E.; Bonakis, A.; Giannopoulos, S.; et al. Plasma P-Tau181 for the Discrimination of Alzheimer’s Disease from Other Primary Dementing and/or Movement Disorders. Biomolecules 2022, 12, 1099. [Google Scholar] [CrossRef] [PubMed]
  55. University of Gothenburg, Institute of Neuroscience and Neurophysiology, The Alzheimer’s Association’s QC Program for CSF and Blood Biomarkers. Available online: https://www.gu.se/en/neuroscience-physiology/the-alzheimers-association-qc-program-for-csf-and-blood-biomarkers (accessed on 27 June 2025).
  56. INSTAND e.V. Gesellschaft zur Förderung der Qualitätssicherung in Medizinischen Laboratorien e. V. (Düsseldorf, Germany). Available online: https://www.instand-ev.de/en/ (accessed on 27 June 2025).
Figure 1. The cumulative frequency distribution of age at disease onset according to the APOE genotype in patients with AD (a) and non-AD (b) biomarker profiles. Although shifted to the left (earlier age of onset compared to ε4 absence), there is no clear-cut difference between ε4 homozygotes and ε4 heterozygotes with AD. (c) The peak incidence of age of onset of AD becomes progressively earlier with an increasing ε4 load in individuals with AD. (d) Interestingly, the peak incidence of age of onset occurs earlier with an increasing ε4 load in non-AD patients as well.
Ijms 26 07410 g001
Figure 2. Adjusted levels of CSF Aβ42 (a) and Aβ42/Aβ40 (b) in individuals with ε4 presence vs. ε4 absence.
Ijms 26 07410 g002
Figure 3. (a) Increasing frequency of AD profile from ε4 absence to ε4 presence. Note that all ε4 homozygotes had AD biomarker profiles. (b) Increased frequency of ε4 presence in patients with AD biomarkers (the terms A+T AD and A+T Non-AD indicate A+T patients with an increased or normal τP181/Aβ42 ratio, respectively). Note that ε4/ε4 was found only in patients with AD profile. (c,d) show pie charts of relative frequencies of various APOE genotypes in AD and non-AD biomarker profiles, respectively.
Ijms 26 07410 g003
Figure 4. Clinical phenotypes/presentations in AD with at least 1 (a) or no ε4 allele (b) and in non-AD with at least 1 (c) or no ε4 allele (d).
Ijms 26 07410 g004
Figure 5. A flow chart of the participants in the present study.
Ijms 26 07410 g005
Table 1. Demographic, clinical and biochemical data of the studied population according to the various APOE genotypes.
ε4/ε4ε4/ε3ε4/ε2ε3/ε3ε3/ε2ε2/ε2p Value
n (%)14 (5.1%)72 (26.3%)5 (1.8%)161 (58.8%)21 (7.7%)1 (0.3%)
Gender (M/F)5/926/461/467/948/131/0NS *
Age (y)68.6 ± 5.268.9 ± 8.466.0 ± 14.472.1 ± 8.9 a69.9 ± 7.483.00.044
Duration (y)3.2 ± 2.03.7 ± 3.75.5 ± 0.73.6 ± 3.43.9 ± 3.61.5NS
Onset (y)65.4 ± 6.165.2 ± 8.360.4 ± 13.469.5 ± 8.3 b66.1. ± 8.781.50.0064
Education (y)11.0 ± 5.912.0 ± 4.37.5 ± 2.110.6 ± 5.09.1 ± 4.06.0NS
MMSE score19.6 ± 5.8
21 (14–23)
21.6 ± 7.3
24 (17–27)
26.5 ± 3.5
27 (24–29)
22.8 ± 5.8
24 (21–27)
22.6 ± 5.4
24 (18–26)
25NS
NS
ACE-R total score57.9 ± 18.465.0 ± 20.782.5 ± 3.566.1 ± 18.663.4 ± 20.865NS
Attention-orientation13.0 ± 3.913.7 ± 4.716.1 ± 1.214.2 ± 3.914.6 ± 3.717NS
Memory10.4 ± 4.914.2 ± 6.919.0 ± 4.214.8 ± 6.615.0 ± 7.019NS
Fluency5.2 ± 3.55.9 ± 3.69.0 ±1.45.5 ± 3.35.8 ± 3.33NS
Language17.7 ± 6.320.7 ± 5.024.0 ± 1.420.2 ± 4.917.5 ± 6.314NS
Visuospatial11.7 ± 2.810.7 ± 3.913.5 ± 2.111.6 ± 3.19.9 ± 4.212NS
MTA score3 (1.5–3)2.5 (1–3)0.5 (0–3)2 (1–3)2 (0.1–2.9)3NS
ERICA score2 (1.5–2)2 (0.5–2)1.5 (0–2)1 (1–2) c1 (0–1) c20.0016
42 (pg/mL)457 ± 143564 ± 249767 ± 384710 ± 379788 ± 4616260.003 #
40 (pg/mL)7471 ± 223510077 ± 54829988 ± 26559171 ± 52389347 ± 34336852NS #
42/Aβ400.069 ± 0.0190.069 ± 0.0320.076 ± 0.0320.093 ± 0.0470.114 ± 0.0500.091<0.001 #
τP181 (pg/mL)94.7 ± 47.3
86 (55–118)
83.9 ± 50.9
72 (46–114)
45.4 ± 20.1
39 (33–58)
61.5 ± 41.1
49 (32–81)
52.9 ± 23.2
48 (38–62)
35NS #
τT (pg/mL)520 ± 247
500 (361–626)
512 ± 391
419 (257–588)
269 ± 83.2
246 (218–320)
384 ± 285
298 (178–487)
460 ± 269
357 (268–718)
376NS #
τP181/Aβ420.21 ± 0.13
0.16 (0.12–0.26)
0.18 ± 0.13
0.16 (0.08–0.24)
0.07 ± 0.04
0.07 (0.04–0.10)
0.13 ± 0.11
0.10 (0.05–0.17)
0.12 ± 0.17
0.06 (0.05–0.10)
0.06NS #
Data for all APOE genotypes are presented as the mean ± standard deviation or the median value (25th–75th percentile). Statistical comparisons were performed between ε4 homozygotes (ε4/ε4), ε4 heterozygotes (combined ε4/ε3 and ε4/ε2 groups), the ε3/ε3 group and the combined ε3/ε2 and ε2/ε2 groups. * χ2 test; One-way ANOVA followed by Holm–Sidak’s test for multiple comparisons; Kruskal–Wallis test followed by Conover’s post hoc comparisons; a p = 0.025 vs. ε4 heterozygotes; b p = 0.0025 vs. ε4 heterozygotes; c p = 0.05 vs. e4 homozygotes and 0.05 vs. ε4 heterozygotes. # Analysis of covariance with age as a covariate and disease type (AD vs. non-AD), ε4 presence or absence, laboratory and sex as cofactors.
Table 2. Observed CSF biomarker profiles and percentages for the various APOE genotypes.
ε4/ε4ε4/ε3ε4/ε2ε3/ε3ε3/ε2ε2/ε2
n (%)14 (5.1%)72 (26.3%)5 (1.8%)161 (58.8%)21 (7.7%)1 (0.3%)
Total suggestive of AD pathology14 (100%)52 (72.2%)1 (20%)63 (39.1%)6 (28.6%)0 (0%)
A+T+12 (85.7%)46 (63.9%)1 (20%)53 (32.9%)5 (23.8%)0 (0%)
A+T with abnormal τP181/Aβ42 ratio2 (14.3%)6 (8.3%)0 (0%)10 (6.2%)1 (4.8%)0 (0%)
Total suggestive of non-AD pathology0 (0%)20 (27.8%)4 (80%)98 (60.9%)15 (71.4%)1 (100%)
A+T with normal τP181/Aβ42 ratio0 (0%)6 (8.3%)1 (20%)21 (13.1%)2 (9.5%)0 (0%)
AT+0(0%)1 (1.4%)1 (20%)16 (9.9%)3 (14.3%)1 (100%)
AT0 (0%)13 (18.1%)2 (40%)61 (37.9%)10 (47.6%)0 (0%)
Table 3. Comparison of APOE levels with ε4 presence vs. absence in AD CSF biomarker profiles vs. all other (non-AD) profiles.
p Value aOdds ratio bSensitivity bSpecificity bPPV bNPV b
At least one ε4 allele 1<0.00015.87 (3.35–10.3)0.53 (0.44–0.62)0.84 (0.77–0.89)0.74 (0.63–0.82)0.68 (0.60–0.74)
ε4/ε3 and ε4/ε2 1<0.00014.61 (2.62–8.24)0.47 (0.38–0.57)0.84 (0.77–0.89)0.69 (0.52–0.79)0.68 (0.60–0.74)
ε4/ε4 1<0.000160.7 (3.56–1035)0.19 (0.11–0.30)1.00 (0.97–1.00)1.00 (0.77–1.00)0.68 (0.60–0.74)
ε4/ε4 2<0.000138.3 (2.26–649)0.11 (0.06–0.18)1.00 (0.98–1.00)1.00 (0.77–1.00)0.57 (0.51–0.63)
a Fisher’s exact test. b Values in parentheses indicate 95% confidence interval. PPV: positive predictive value. NPV: negative predictive value. 1 vs. absence of ε4. 2 vs. absence of ε4 or ε4 heterozygosity. Values in parentheses indicate 95% confidence intervals.
Table 4. Logistic regression models taking into account the possible effect of sex and education.
p ValueOdds RatioAUC
First model: ε4 presence vs. ε4 absence
Model<0.0001 0.75 (0.68–0.81)
EducationNS0.97 (0.90–1.04)
Sex0.032.04 (1.20–3.45)
At least one ε4 allele<0.00016.31 (3.12–12.76)
Second model: others vs. ε3/ε3 as reference
Model<0.0001 0.76 (0.69–0.82)
EducationNS0.96 ((0.89–1.03)
Sex0.041.9 (1.03–3.88)
ε4/ε3 and ε4/ε20.00014.46 (2.15–9.25)
ε4/ε40.0537.7 (2.1–501)
ε3/ε2 and ε2/ε2NS0.37 (0.09–1.03)
Disclaimer/Publisher’s Note: The statements, opinions and data contained in all publications are solely those of the individual author(s) and contributor(s) and not of MDPI and/or the editor(s). MDPI and/or the editor(s) disclaim responsibility for any injury to people or property resulting from any ideas, methods, instructions or products referred to in the content.

