Article

Genome-Wide Identification and Expression Analysis of the Fructose-1,6-Bisphosphate Aldolase (FBA) Gene Family in Sweet Potato and Its Two Diploid Relatives

Crop Research Institute, Shandong Academy of Agricultural Sciences/Scientific Observing and Experimental Station of Tuber and Root Crops in Huang-Huai-Hai Region, Ministry of Agriculture and Rural Affairs, Jinan 250100, China
*
Author to whom correspondence should be addressed.
Int. J. Mol. Sci. 2025, 26(15), 7348; https://doi.org/10.3390/ijms26157348
Submission received: 25 June 2025 / Revised: 24 July 2025 / Accepted: 28 July 2025 / Published: 30 July 2025
(This article belongs to the Section Molecular Genetics and Genomics)

Abstract

Fructose-1,6-bisphosphate aldolase (FBA; EC 4.1.2.13) is a key enzyme in glycolysis and the Calvin cycle, which plays crucial roles in carbon allocation and plant growth. The FBA family genes (FBA s) have been identified in several plants. However, their presence and roles in sweet potato remain unexplored. In this study, a total of 20 FBAs were identified in sweet potato and its wild wild diploidrelatives, including seven in sweet potato (Ipomoea batatas, 2n = 6x = 90), seven in I. trifida (2n = 2x = 30), and six in I. triloba (2n = 2x = 30). Their protein physicochemical properties, chromosomal localization, phylogenetic relationship, gene structure, promoter cis-elements, and expression patterns were systematically analyzed. The conserved genes and protein structures suggest a high degree of functional conservation among FBA genes. IbFBAs may participate in storage root development and starch biosynthesis, especially IbFBA1 and IbFBA6, which warrant further investigation as candidate genes. Additionally, the FBAs could respond to drought and salt stress. They are also implicated in hormone crosstalk, particularly with ABA and GA. This work provides valuable insights into the structure and function of FBAs and identifies candidate genes for improving yield, starch content, and abiotic stress tolerance in sweet potatoes.

1. Introduction

Sweet potato (Ipomoea batatas (L.) Lam., 2n = B1B1B2B2B2B2 = 6x = 90) is classified as an autohexaploid species within the Convolvulaceae family, Ipomoea Genus, and Batatas Section. It is recognized for its high adaptability and is utilized as food, an industrial material, and a bioenergy resource [1,2,3]. In recent years, to maintain national food security, sweet potato cultivation has decreased and shifted towards marginal lands and low-quality soils [4]. Therefore, the exploration of genetic resources to enhance the yield, quality, and stress resistance of sweet potatoes is deemed of great importance for sweet potato production.
Fructose-1,6-bisphosphate aldolase (FBA; EC 4.1.2.13) is a key enzyme that catalyzes the reversible conversion of fructose-1,6-bisphosphate (FBP) into dihydroxyacetone phosphate (DHAP) and glyceraldehyde-3-phosphate (G3P) [5,6]. FBA enzymes are classified into two classes, and higher plants primarily contain Class I FBA enzymes [7,8]. Class I FBAs typically include a typical conserved TIM barrel structural domain and function as homotetramers [9,10]. In higher plants, FBA is localized in both the cytoplasm and chloroplasts, where it plays distinct roles in glycolysis and the Calvin cycle, respectively [11]. Therefore, FBA plays a significant role in plant growth and development by influencing photosynthesis, carbon assimilation, and partitioning. In previous research, the changes in FBA activity influence the photosynthesis and carbon allocation in potato, tobacco, and tomato, ultimately impacting the growth of plants [12,13,14]. In Arabidopsis, mutation of AtFBA3 limits the biosynthesis of amino acids in roots by disrupting the plastid glycolysis [15]. In tea tree oil, the expression levels of CoFBA1 and CoFBA3 genes are highly correlated with the content of tea tree oil [16]. Furthermore, numerous studies have indicated that the FBA genes are involved in responses to various stresses, such as salinity [17,18], drought [19], and temperature [14,20]. These findings highlight FBA genes as promising targets for genetic engineering to improve crop yield, quality, and stress tolerance.
Recent advances in genomics have enabled the identification and characterization of FBA gene families in various plant species, including eight in Arabidopsis thaliana [21], eight in Solanum lycopersicum [22], sixteen in Nicotiana tabacum [23], seventeen in cotton [24], nine in Solanum tuberosum [25], and five in Cucumis sativus [26]. Recently, the release of genome assemblies of cultivated sweet potato [27] and its two wild diploid relatives, Ipomoea trifida and I. triloba [28], has provided valuable genomic resources for the identification of the FBA gene family in sweet potato and its two wild diploid relatives. In this study, a total of 20 FBA genes were identified, including seven in I. batatas, seven in I. trifida, and six in I. triloba. Comprehensive analyses were performed on these FBA genes, including phylogenetic relationships, synteny mapping, gene structure evaluation, and conserved motif identification. In addition, their organ specificity and expression patterns related to storage root development, starch biosynthesis, abiotic stress, and hormone responses were examined using qRT-PCR or RNA-seq. This research demonstrates the potential of FBA genes in improving sweet potato yield, quality, and stress tolerance, providing a foundation for future research and crop improvement strategies.

2. Results

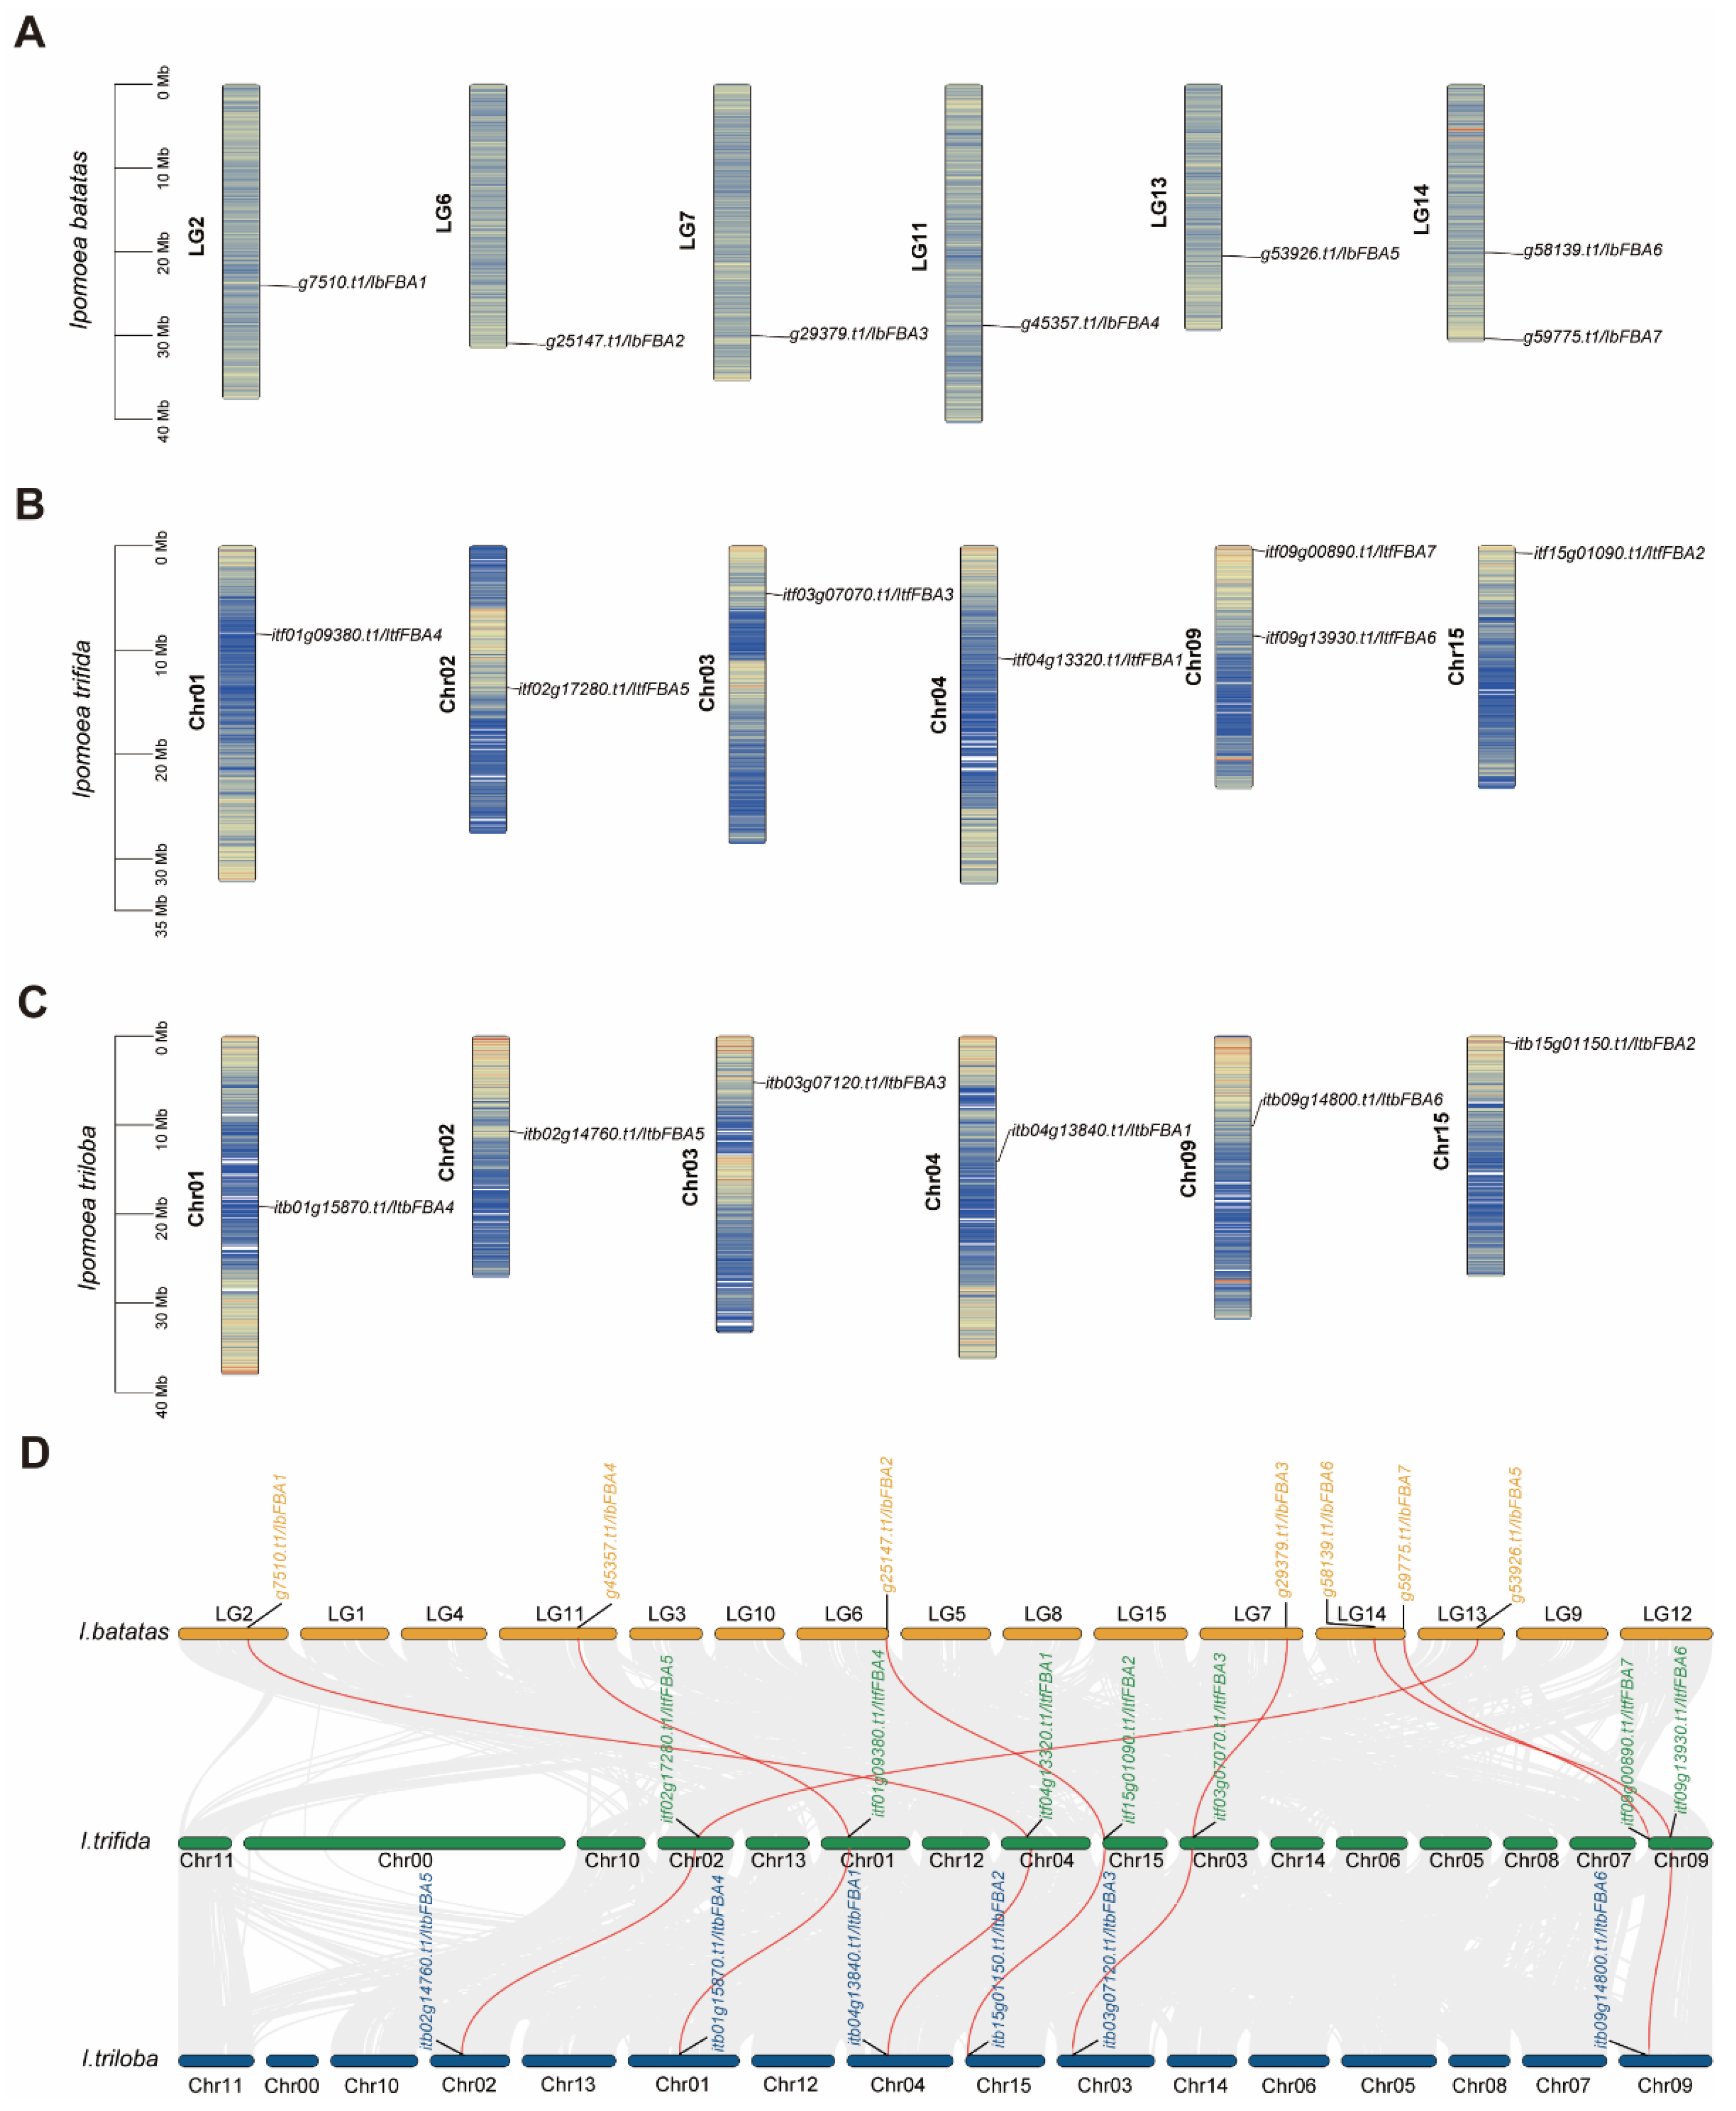
2.1. Identification of FBAs in Sweet Potato and Its Two Wild Diploid Relatives

In this study, three strategies (i.e., blastp search, hmmer search, and the CD-search database) were used to completely identify FBAs in sweet potato and its two wild diploid relatives, I. trifida and I. triloba genomes. We identified seven, seven, and six FBAs in I. batatas, I. trifida, and I. triloba, respectively. FBAs were designated as “IbFBA1–IbFBA7”, “ItfFBA1–ItfFBA7”, and “ItbFBA1–ItbFBA6” based on the chromosomal locations, respectively. Table 1 presented the specific details of FBAs, including the genome length (ranged from 1682 bp to 2902 bp), CDS length (ranged from 1047 bp to 1182 bp), the number of amino acid (ranged from 348 aa to 393 aa), protein molecular weight (ranged from 37.14 kDa to 42.49 kDa), and theoretical isoelectric point (pI, ranged from 6.86 to 8.61). The basic characteristics analysis showed that all IbFBAs were predicted to be stable with an instability index of less than 40. The grand average of hydropathicity (GRAVY) values of IbFBAs ranged from −0.336 to −0.13, indicating that they are hydrophilic proteins. Subcellular localization prediction showed that IbFBA2, IbFBA4, IbFBA5, and IbFBA6 were localized to the cytoplasm, while IbFBA1, IbFBA3, and IbFBA7 were localized to the chloroplasts (Table 1).
In I. trifida, coding sequence (CDS) lengths spanned 1074 to 1194 bp, while genomic sequences measured between 1752 and 3179 bp. Putative protein lengths varied from 357 to 397 amino acids (aa), corresponding to molecular weights (MW) of 38.23–42.66 kDa and isoelectric points (pI) ranging from 6.38 to 8.61. Primary characterization revealed all ItfFBA proteins as stable, exhibiting instability indices below 40. Grand average of hydropathicity (GRAVY) values, falling between −0.336 and −0.094, confirmed their hydrophilic nature. Subcellular localization predicted ItfFBA2, ItfFBA4, ItfFBA5, and ItfFBA6 in the cytoplasm, whereas ItfFBA1, ItfFBA3, and ItfFBA7 were assigned to chloroplasts (Table 1). For I. triloba, CDS lengths extended from 1077 bp to 1194 bp, with genomic lengths varying more broadly from 1831 bp to 4627 bp. Deduced polypeptides comprised 358 to 397 aa, yielding MWs of 38.51–42.69 kDa and pIs between 6.97 and 8.61. All ItbFBAs were similarly predicted to be stable (instability index < 40). Negative GRAVY scores affirmed the hydrophilicity of these proteins. Localization analysis indicated cytoplasmic positioning for ItbFBA2, ItbFBA4, and ItbFBA6, while ItbFBA1, ItbFBA3, and ItbFBA5 were chloroplast-targeted (Table 1).
In genomes of I. batatas, I. triloba, and I. trifida, FBAs were located on six chromosomes similarly (Figure 1). In I. batatas, two IbFBAs were mapped to LG14 and one each to LG2, LG6, LG7, LG11, and LG13 (Figure 1A). In I. trifida, FBAs were detected on Chr01 (1), Chr02 (1), Chr03 (1), Chr04(1), Chr09 (2), and Chr15 (1), and I. triloba exhibited a similar distribution of FBAs, except with a single FBA on Chr09 (Figure 1A,C). In order to further infer the evolution of FBAs, we carried out a synteny analysis among IbFBAs, ItfFBAs, and ItbFBAs. The results indicated that all ItfFBAs and ItbFBAs had one orthologous gene of IbFBAs (Figure 1D). These results showed that FBA genes were conserved in the process of evolution from diploid to hexaploid.

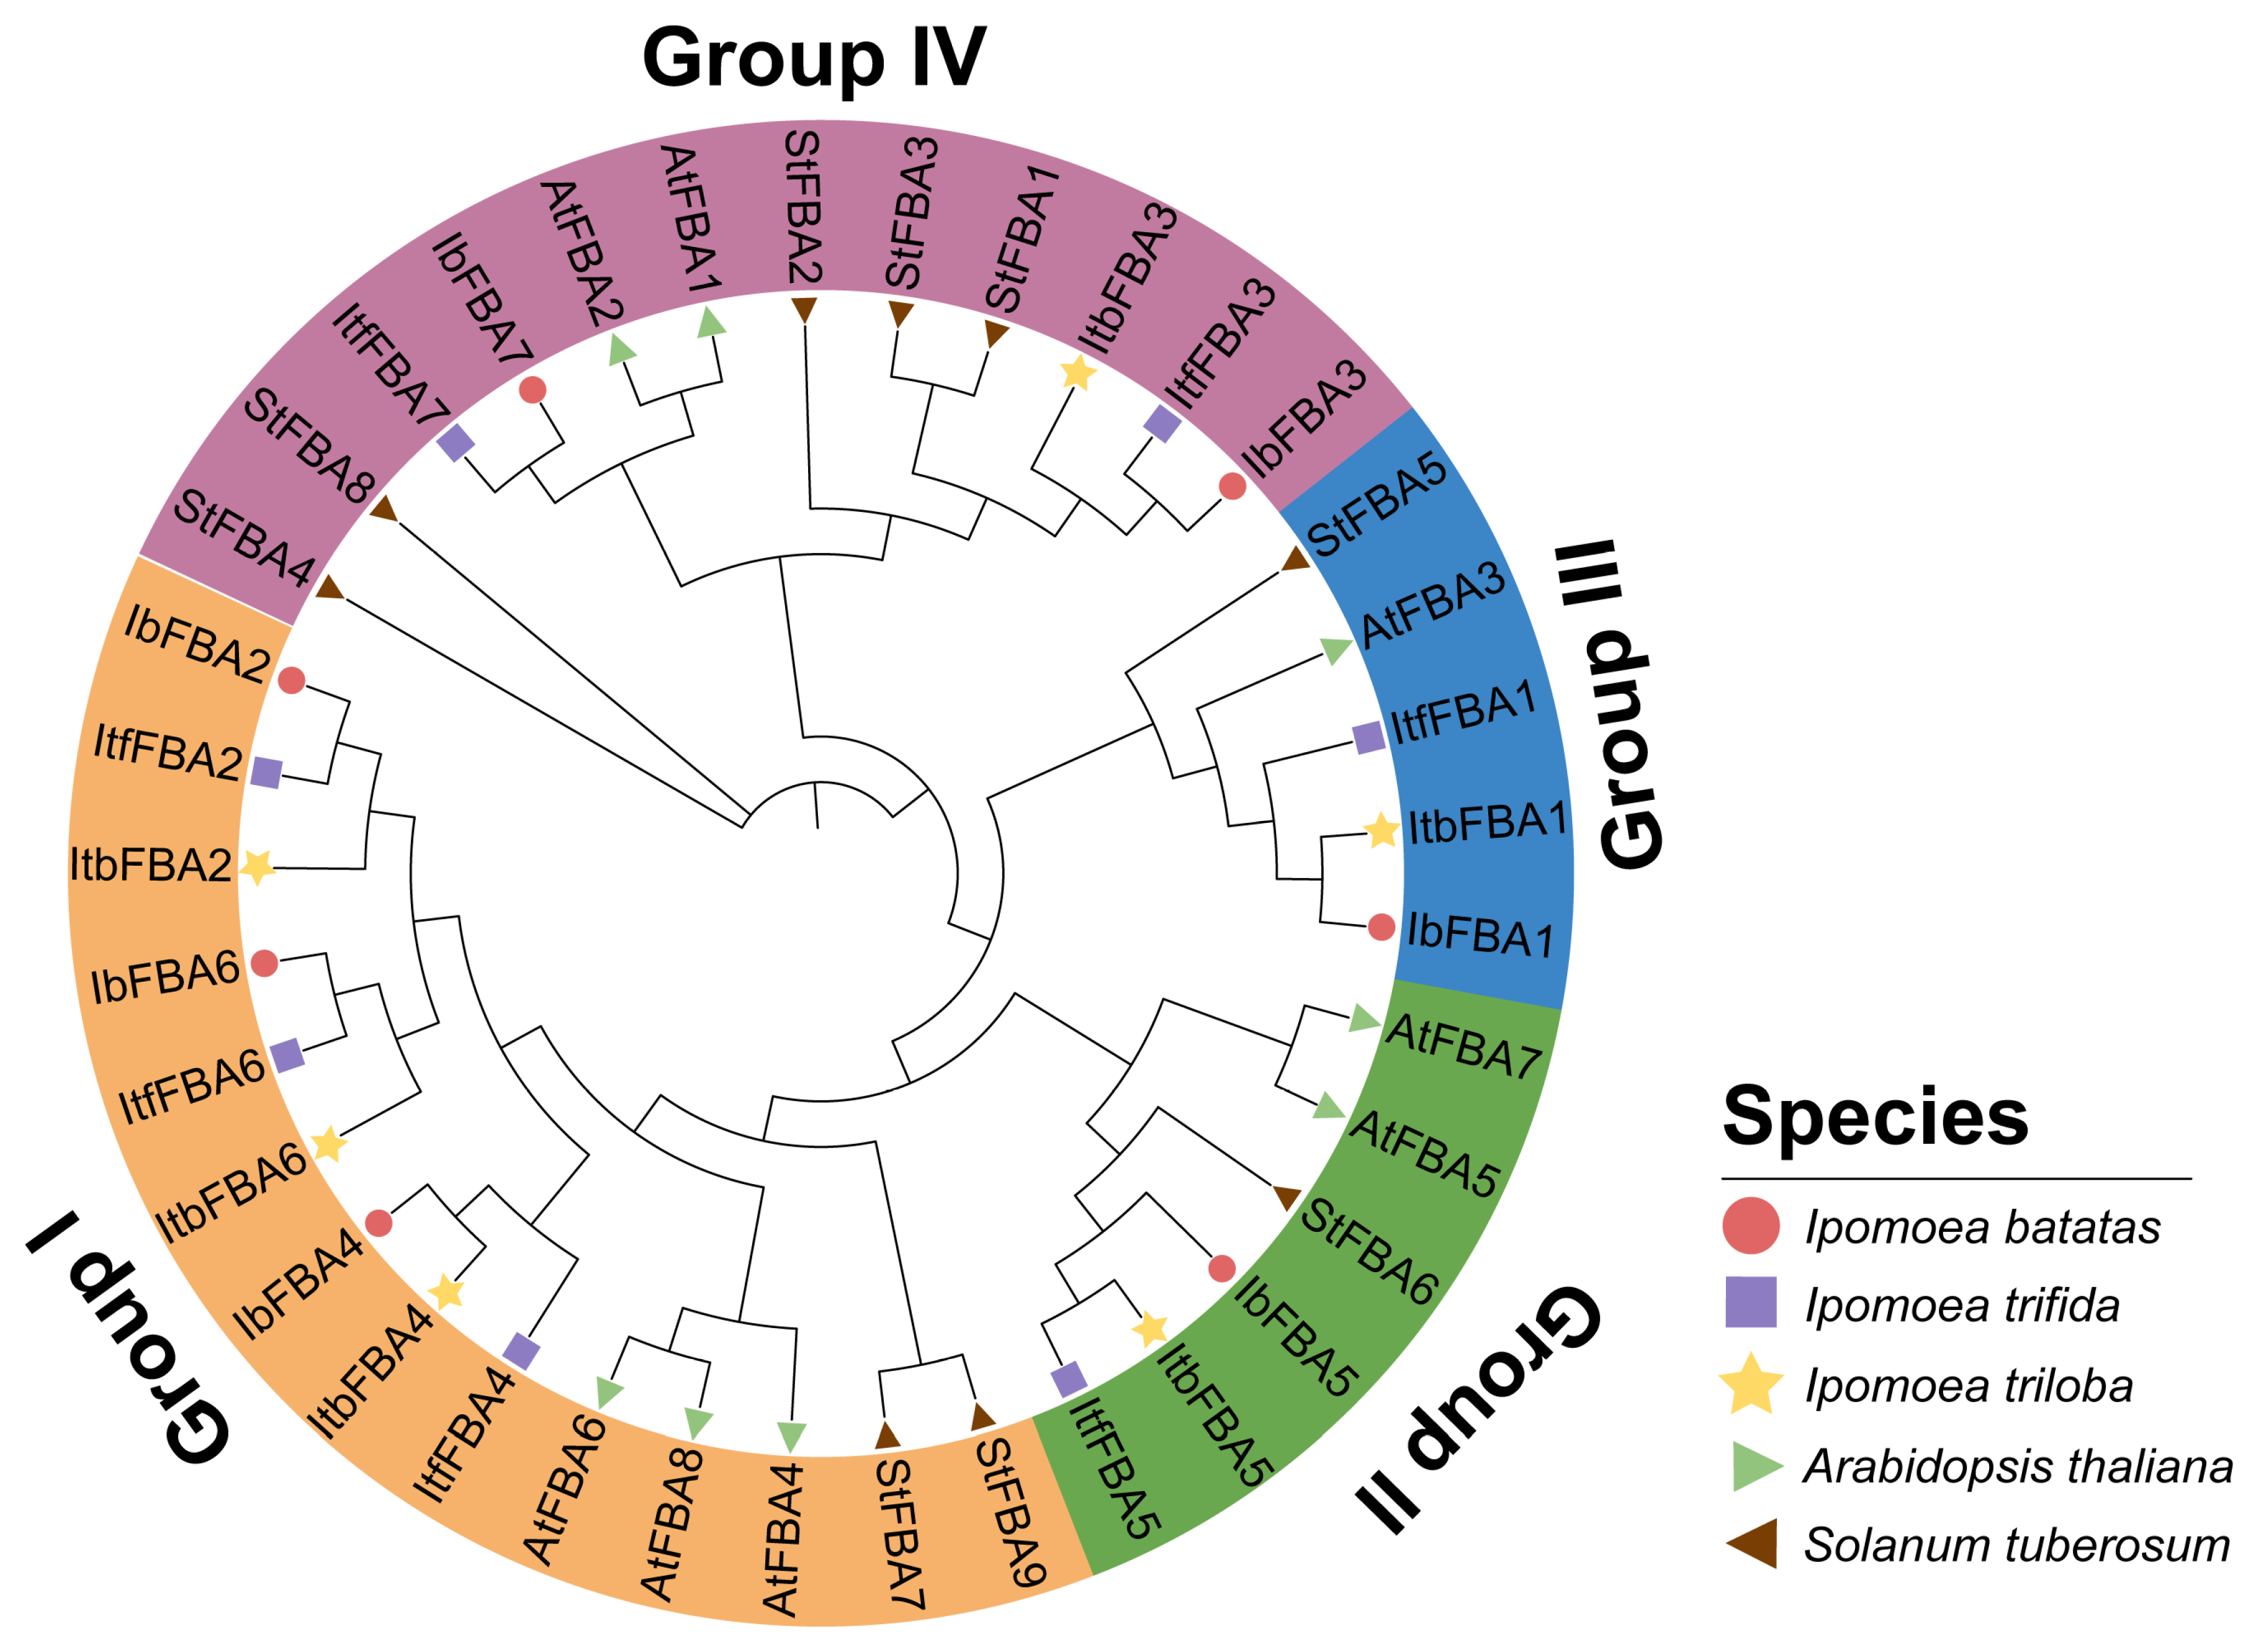
2.2. Phylogenetic Relationship Analysis of FBAs in Sweet Potato and Its Two Wild Diploid Relatives

To investigate the evolutionary relationships of FBAs in I. batatas, I. trifida, I. triloba, Arabidopsis thaliana, and Solanum tuberosum, we constructed a phylogenetic tree for 37 FBAs of these six species (i.e., 7 in I. batatas, 7 in I. trifida, 6 in I. triloba, 8 in A. thaliana, and 9 in S. tuberosum). According to the evolutionary distance, all the FBAs were divided into four groups and distributed unevenly across the phylogenetic tree branches (Figure 2). The detailed distributions of FBAs were as follows (total: I. batatas, I. trifida, I. triloba, A.thaliana, and S. tuberosum): Group I (14:3; 3, 3, 3, and 2), Group II (6:1; 1, 1, 2, and 1), Group III (12:2; 2, 1, 2, and 5) and Group IV (5:1; 1, 1, 1, 1, and 1) (Figure 2; Table S1). Notably, all IbFBAs clustered closely with their orthologs from I. triloba and I. trifida.

2.3. Conserved Motif and Exon–Intron Structure Analysis of FBAs in Sweet Potato and Its Two Wild Diploid Relatives

MEME analysis identified ten conserved motifs shared across IbFBAs, ItfFBAs, and ItbFBAs (Figure 3A and Figure S1). Exon–intron structure analysis of IbFBAs, ItbFBAs, and ItfFBAs revealed minor variations (Figure 3B). The exons numbers ranged from 3 (IbFBA4, IbFBA5, IbFBA6, ItfFBA4, ItfFBA5, ItfFBA6, ItbFBA4, ItbFBA5, and ItbFBA6) to 6 (IbFBA1, IbFBA3, ItfFBA1, ItfFBA3, ItbFBA1, and ItbFBA3). The genes in Groups III and IV included more exons than those in Groups I and II. Specifically, all homologous FBAs in sweet potato and its two wild diploid relatives shared the same number of exons. These results indicated that the FBA genes were highly conserved during the evolution of sweet potatoes.

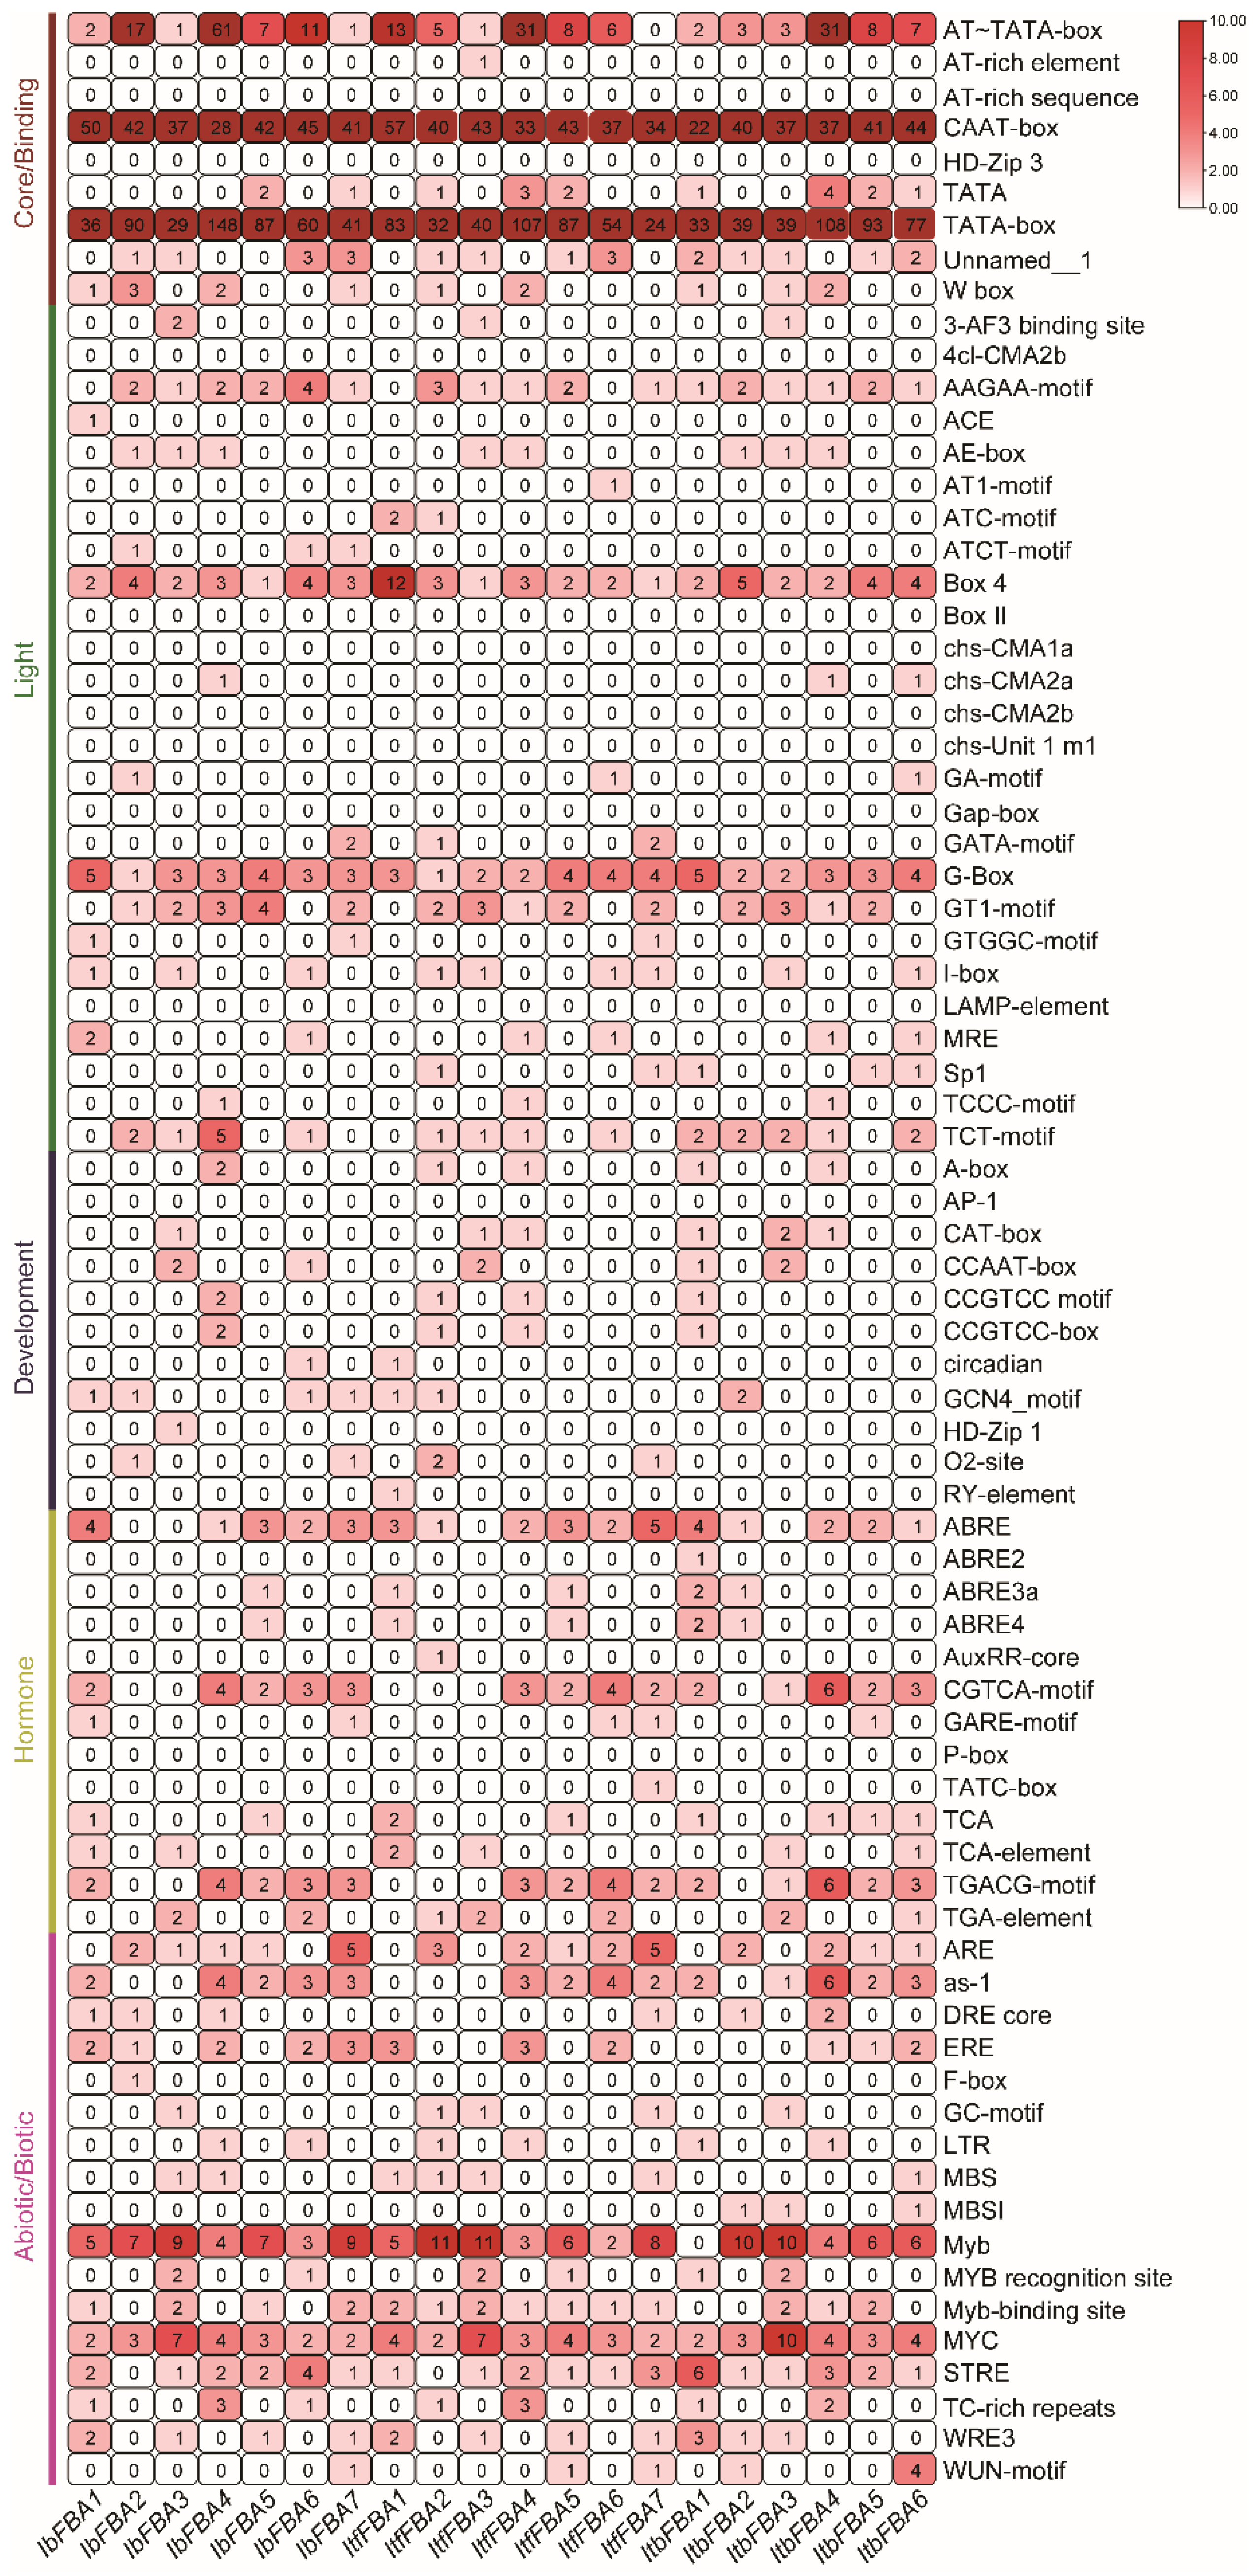
2.4. Cis-Element Analysis in the Promoters of FBAs in Sweet Potato and Its Two Wild Diploid Relatives

To elucidate the transcriptional regulation of FBAs, the 2 kb upstream promoter sequences of these genes were analyzed. Diverse cis-elements were identified and classified into five functional categories according to their roles: core/binding, light-responsive, developmental, hormone-responsive, and abiotic/biotic stress-responsive elements (Figure 4). Core/binding elements, specifically the TATA-box and CAAT-box, were ubiquitously present across all IbFBA promoters. Promoters of IbFBA2, IbFBA4, IbFBA5, and IbFBA6 additionally harbored multiple AT-TATA-boxes. Cis-acting light-response motifs, including Box 4, GT1-motif, G-box, TCT-motif, and AAGAA-motif, occurred frequently among IbFBA promoters. Development-associated elements were detected in all IbFBA promoters except IbFBA5. Furthermore, the IbFBA promoter regions contained numerous phytohormone-associated cis-motifs, encompassing abscisic acid (ABA)-responsive elements (ABRE, ABRE4, ABRE3a), gibberellin (GA)-responsive elements (GARE-motif), auxin (IAA)-responsive elements (TGA-element), and jasmonate (JA)-responsive elements (CGTCA-motif, TGACG-motif) (Figure 4). Most of the IbFBAs promoters contained abiotic/biotic elements, such as drought-responsive elements (MYB and MYC), antioxidant response elements (ARE and STRE), low-temperature-responsive elements (ERE and WRE3), and biotic-stress-responsive elements (as-1) (Figure 4). Promoters of ItfFBAs and ItbFBAs exhibited similar profiles of cis-elements (Figure 4). These findings collectively suggested FBAs’ involvement in growth/development regulation, hormone crosstalk, and stress adaptation, and the functions of FBA genes were highly conserved during the evolution of sweet potatoes.

2.5. Expression Analysis of FBAs in Sweet Potato and Its Two Wild Diploid Relatives

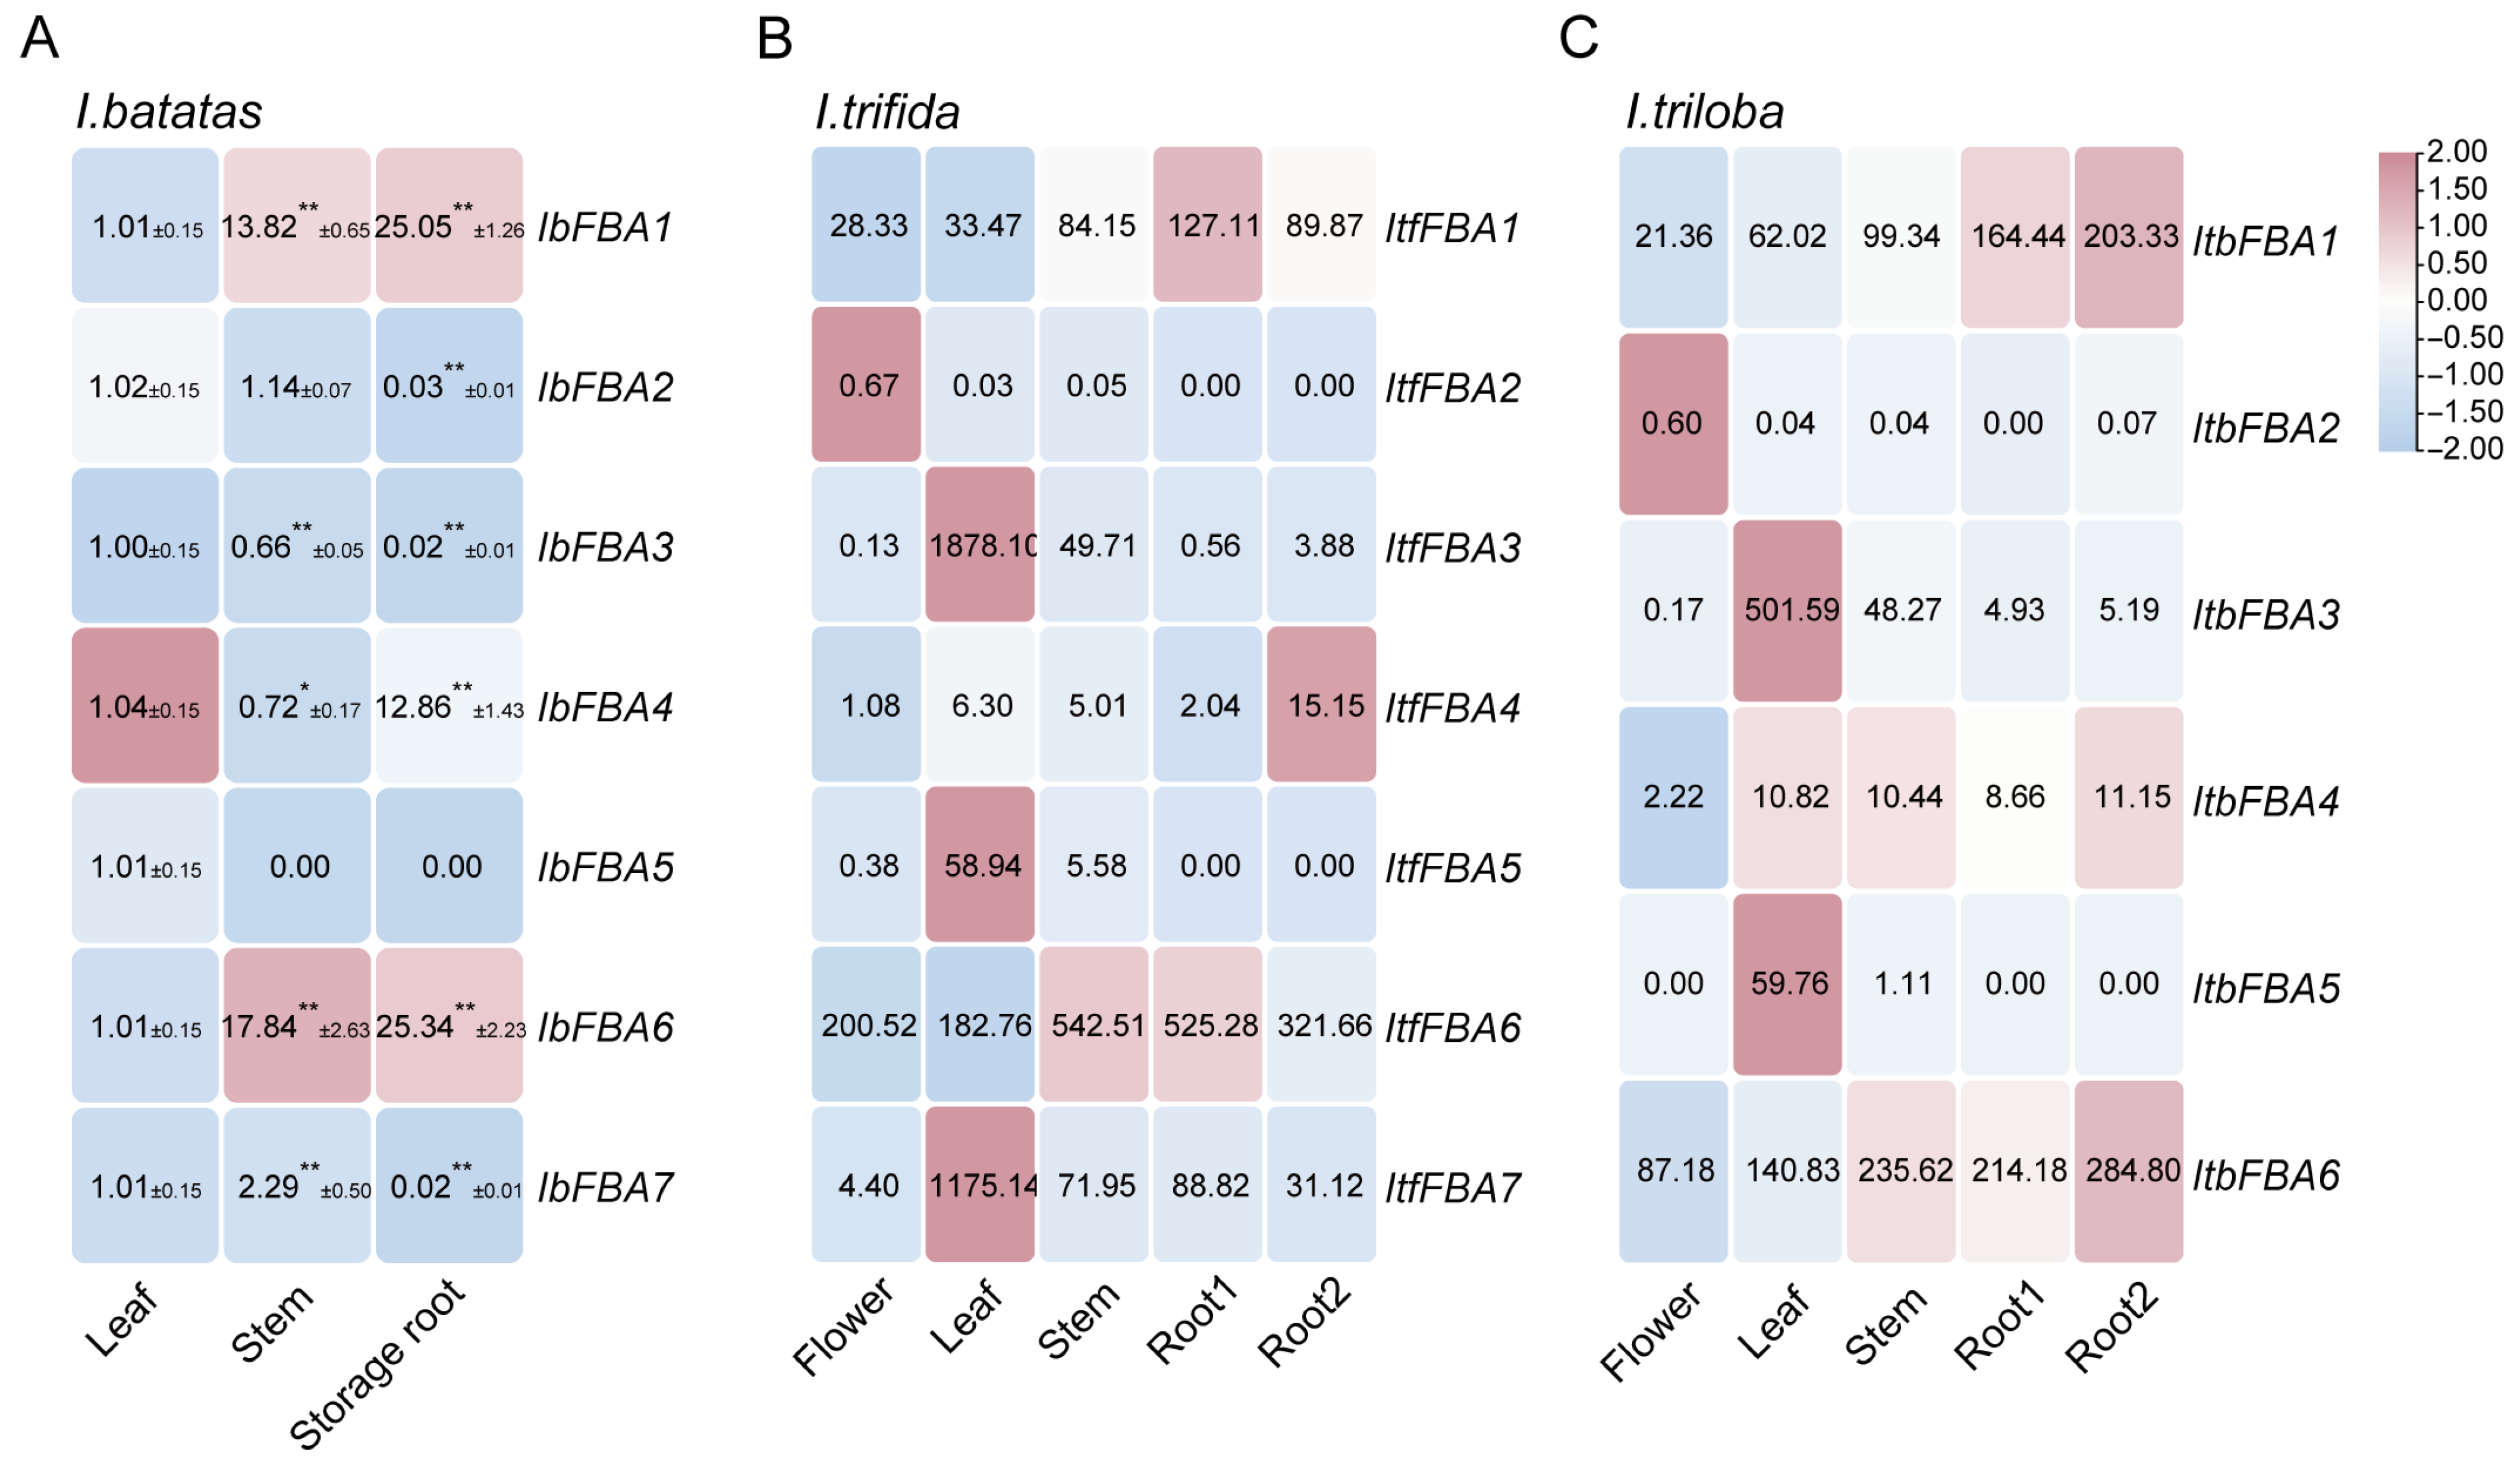
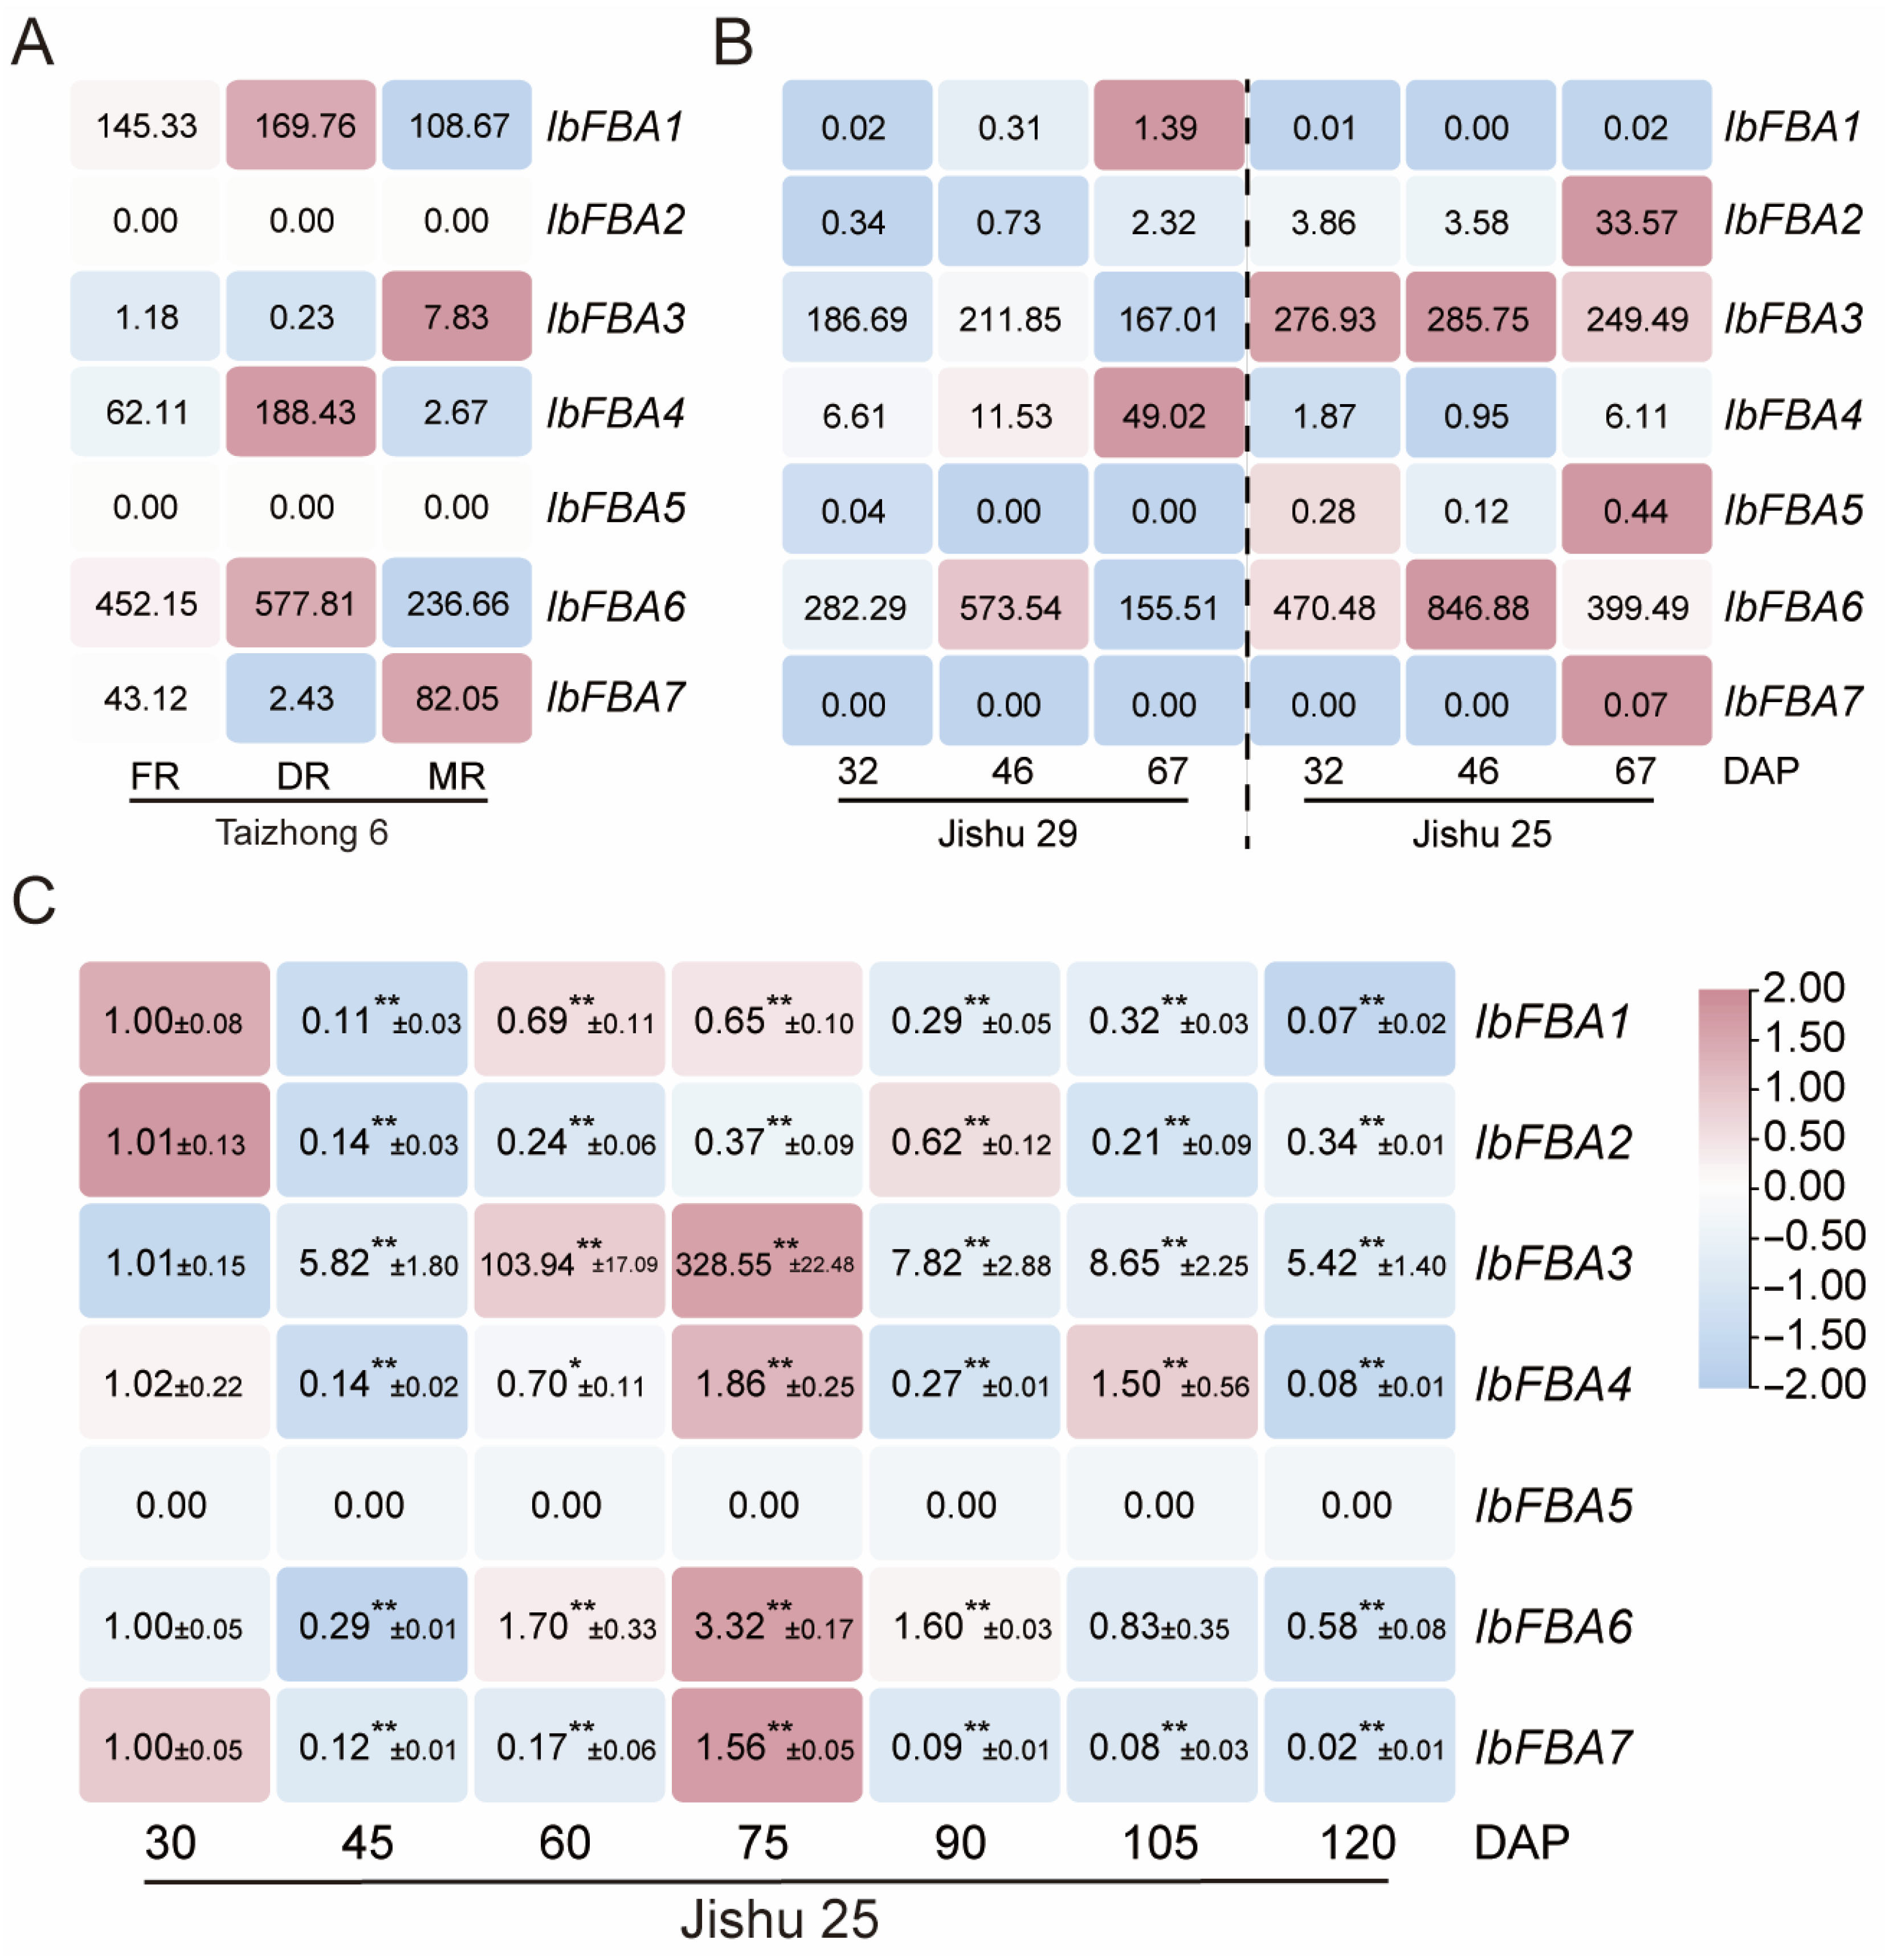
2.5.1. Expression Analysis in Various Organs

In cultivated sweet potato, we carried out qRT-PCR to calculate the expression of IbFBAs in leaf, stem, and storage roots. IbFBA1 and IbFBA6 were highly expressed in storage roots, while other IbFBAs were highly expressed in leaves (Figure 5A).
To investigate the expression profiles of ItfFBAs and ItbFBAs, transcriptomic data derived from six distinct organs (flower bud, flower, leaf, stem, root1, root2) were analyzed [28]. Within I. trifida, predominant expressions of ItfFBA1, ItfFBA2, and ItfFBA6 occurred in flower buds. Leaves exhibited elevated transcript levels for ItfFBA3, ItfFBA5, and ItfFBA7. Stem tissue showed high expression of ItfFBA6, while root1 displayed significant expression of ItfFBA1 and ItfFBA6. ItfFBA4 expression was notably high in root2 (Figure 5B). Crucially, none of the ItfFBAs were detected in floral tissues. In I. triloba, flower buds contained high transcript abundance for ItbFBA1, ItbFBA2, ItbFBA4, and ItbFBA6. Leaf-specific expression characterized ItbFBA3, ItbFBA4, and ItbFBA5. Stems featured predominant ItbFBA4 expression, and root2 showed significant expression of ItbFBA1 and ItbFBA4 (Figure 5C). Expression for all ItbFBAs was absent in both flowers and root1. Collectively, these results indicate that FBA genes exhibit diverse organ-specific expression patterns across sweet potato and its two diploid progenitor species.

2.5.2. Expression Analysis at Different Developmental Stages of Storage Roots in Sweet Potato

To investigate the potential roles of IbFBAs in storage root development of sweet potato, the expression patterns of IbFBAs were analyzed using various developmental stages (FR, fibrous roots; DR, developing storage roots; MR, mature storage roots) in the cultivar Taizhong 6, as well as data from a precocious variety (Jishu 29) and a late maturing line (Jishu 25) at different developmental stages (32, 46, and 67 day after planting (DAP)) [29,30]. In Taizhong 6, IbFBA1, IbFBA4, and IbFBA6 were highly expressed in DR and showed a low expression level in FR, while IbFBA3 and IbFBA7 showed the opposite expression pattern (Figure 6A). In Jishu 29 and Jishu 25, IbFBA3 and IbFBA6 were highly expressed in 46 DAP; IbFBA1, IbFBA2, and IbFBA4 were highly expressed in 67 DAP (Figure 6B).
We further used qRT-PCR to determine the expressions of IbFBAs at different developmental stages of storage roots (i.e., 30, 45, 60, 75, 90, 105, and 120 DAP) in the high-starch variety Jishu25. As shown in Figure 6C, IbFBA1 and IbFBA2 were highly expressed at 60 DAP (initial thickening), while IbFBA3, IbFBA4, IbFBA6, and IbFBA7 were highly expressed at 75 DAP (rapid thickening and initial starch accumulation stage) (Figure 6C). In addition, IbFBA5 remained consistently low in expression throughout sweet potato development. These results suggested that individual IbFBAs may have distinct roles in development and in starch and sugar accumulation across various stages of sweet potato storage root formation.

2.5.3. Expression Analysis in Sweet Potato Lines with Different Starch Contents

According to the previous results, IbFBAs may play significant roles in starch biosynthesis in sweet potatoes. A transcriptome analysis showed that IbFBA2, IbFBA3, and IbFBA6 were highly expressed in the high-starch-content variety Jishu 25 (Figure 6B). To further investigate the functions of IbFBAs in the starch biosynthesis of sweet potato, we analyzed the expression of IbFBAs in high-starch varieties (Jishu 25 and Jishu 36), medium-starch varieties (Jishu 26 and Yanshu 25), and low-starch varieties (Shanshu 1 and Jishu 33). Overall, IbFBAs were highly expressed in the high-starch lines. In particular, IbFBA2, IbFBA5, and IbFBA6 exhibited significantly higher expression levels in the high-starch lines compared to the medium-/low-starch lines. IbFBA1, IbFBA3, IbFBA4, and IbFBA7 did not display a clear expression trend (Figure 7).

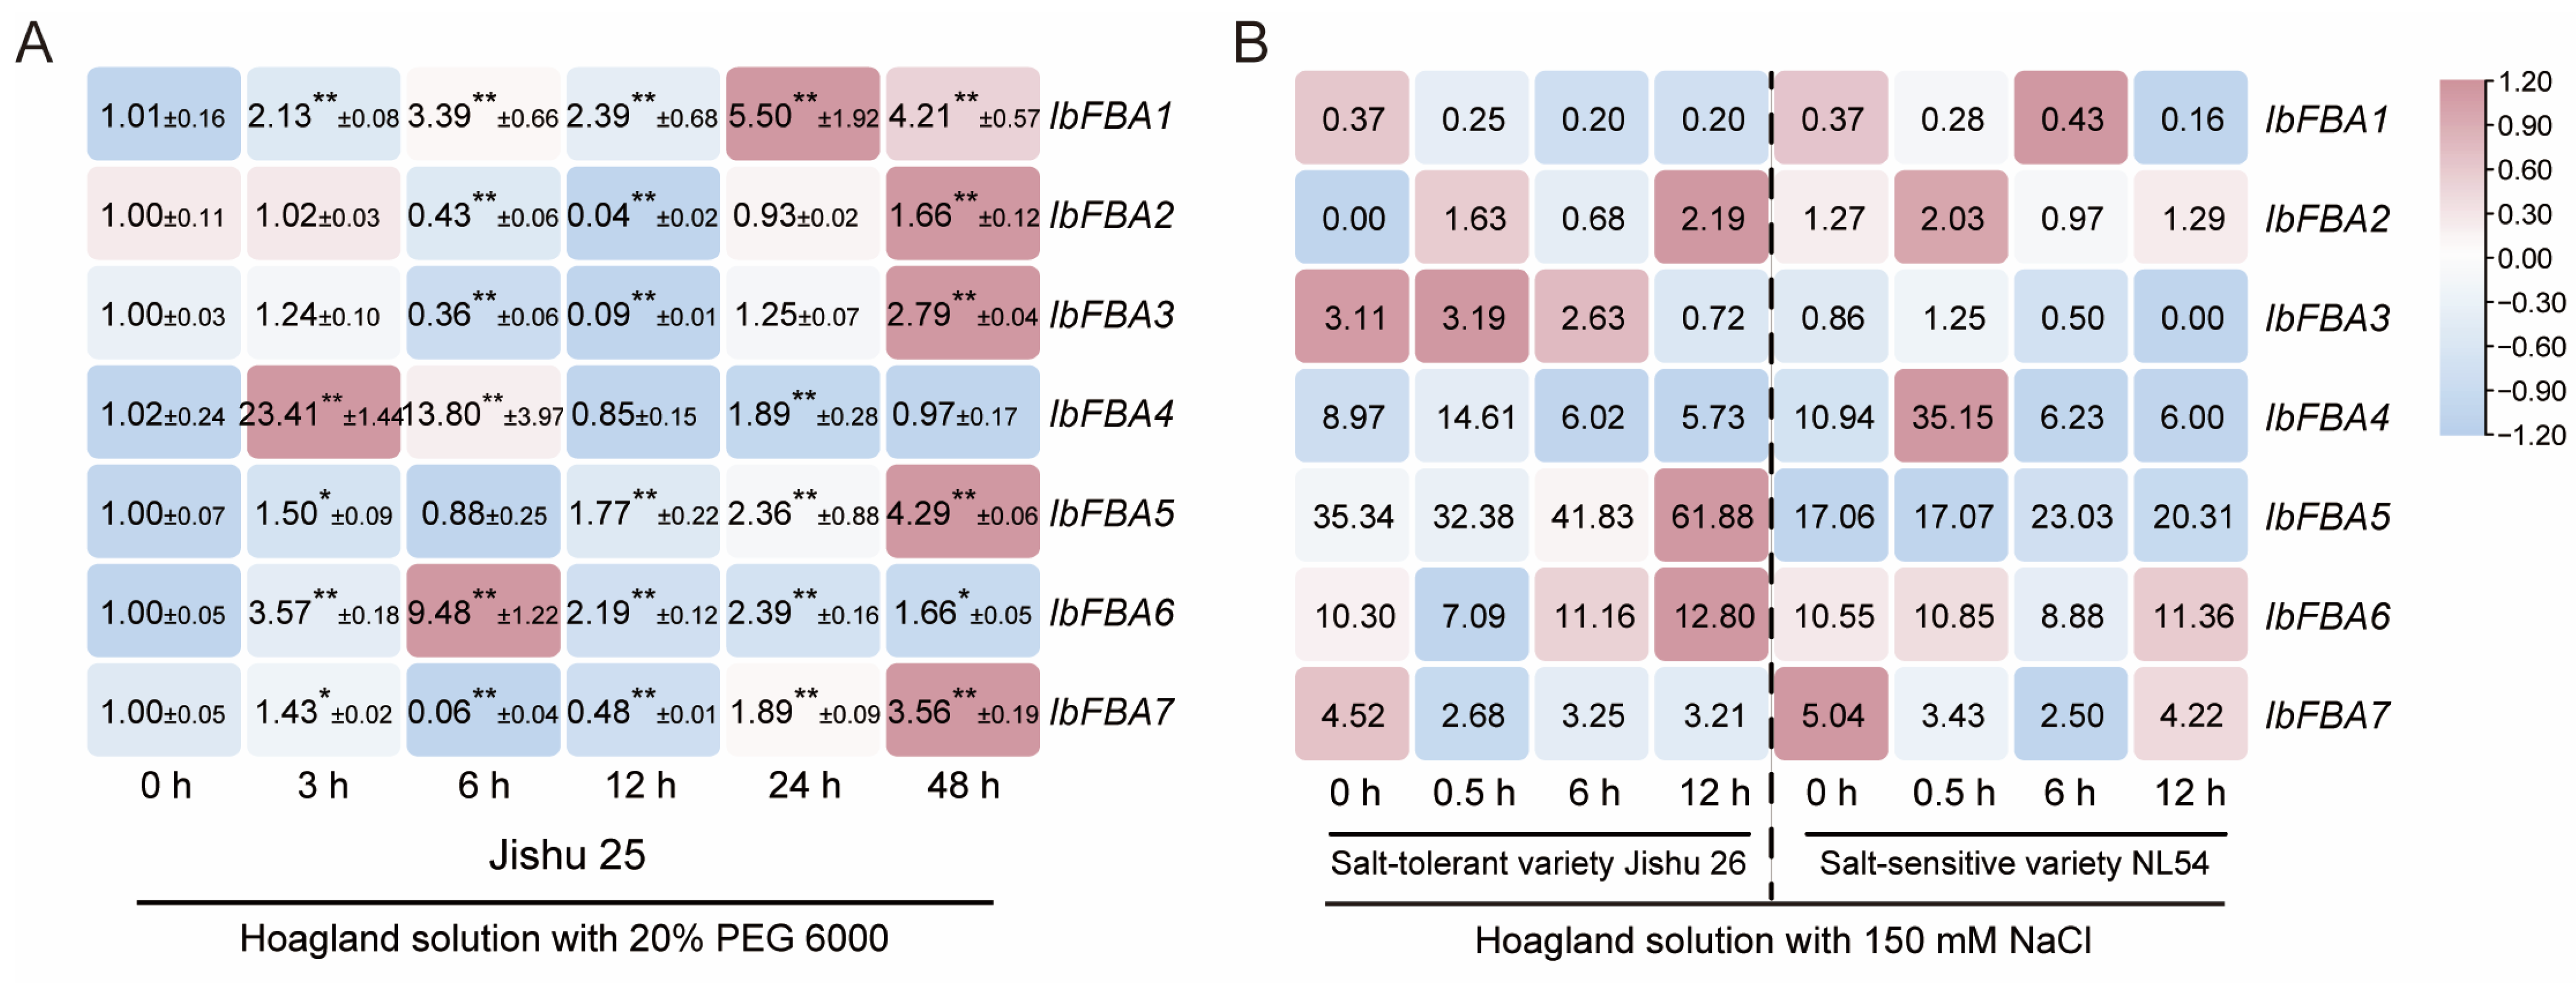
2.5.4. Expression Analysis Under Drought and Salt Stresses

To explore the prospective functions of IbFBAs in abiotic stresses (drought and salt stress) responses, we made use of the qRT-PCR from Jishu 25 subjected to PEG6000 treatment and the RNA-seq data from a salt-sensitive variety (NL54) and a salt-tolerant line (Jishu 26) subjected to NaCl stress at 0 h, 0.5 h, 6 h, and 12 h, and the expression patterns of IbFBAs were analyzed [31,32]. Under PEG6000 stress, IbFBA1, IbFBA4, IbFBA5, IbFBA6, and IbFBA7 were upregulated, while others were downregulated or did not show significant changes in Jishu 25 (Figure 8A). Under NaCl stress, IbFBA2, IbFBA4, and IbFBA5 were upregulated in both Jishu 26 and NL54, whereas IbFBA6 and IbFBA7 were downregulated in both Jishu 26 and NL54, and others showed no significant trend (Figure 8B).
Next, RNA-seq data for I. trifida and I. triloba under mannitol and NaCl stress indicated that specific FBA genes (ItfFBA1, ItfFBA6; ItbFBA1, ItbFBA4, and ItbFBA6) were upregulated under drought and salt stress (Figure S2). Taken together, these results indicated that certain FBAs participated in drought- and salt-stress responses in sweet potato and its two wild diploid relatives.

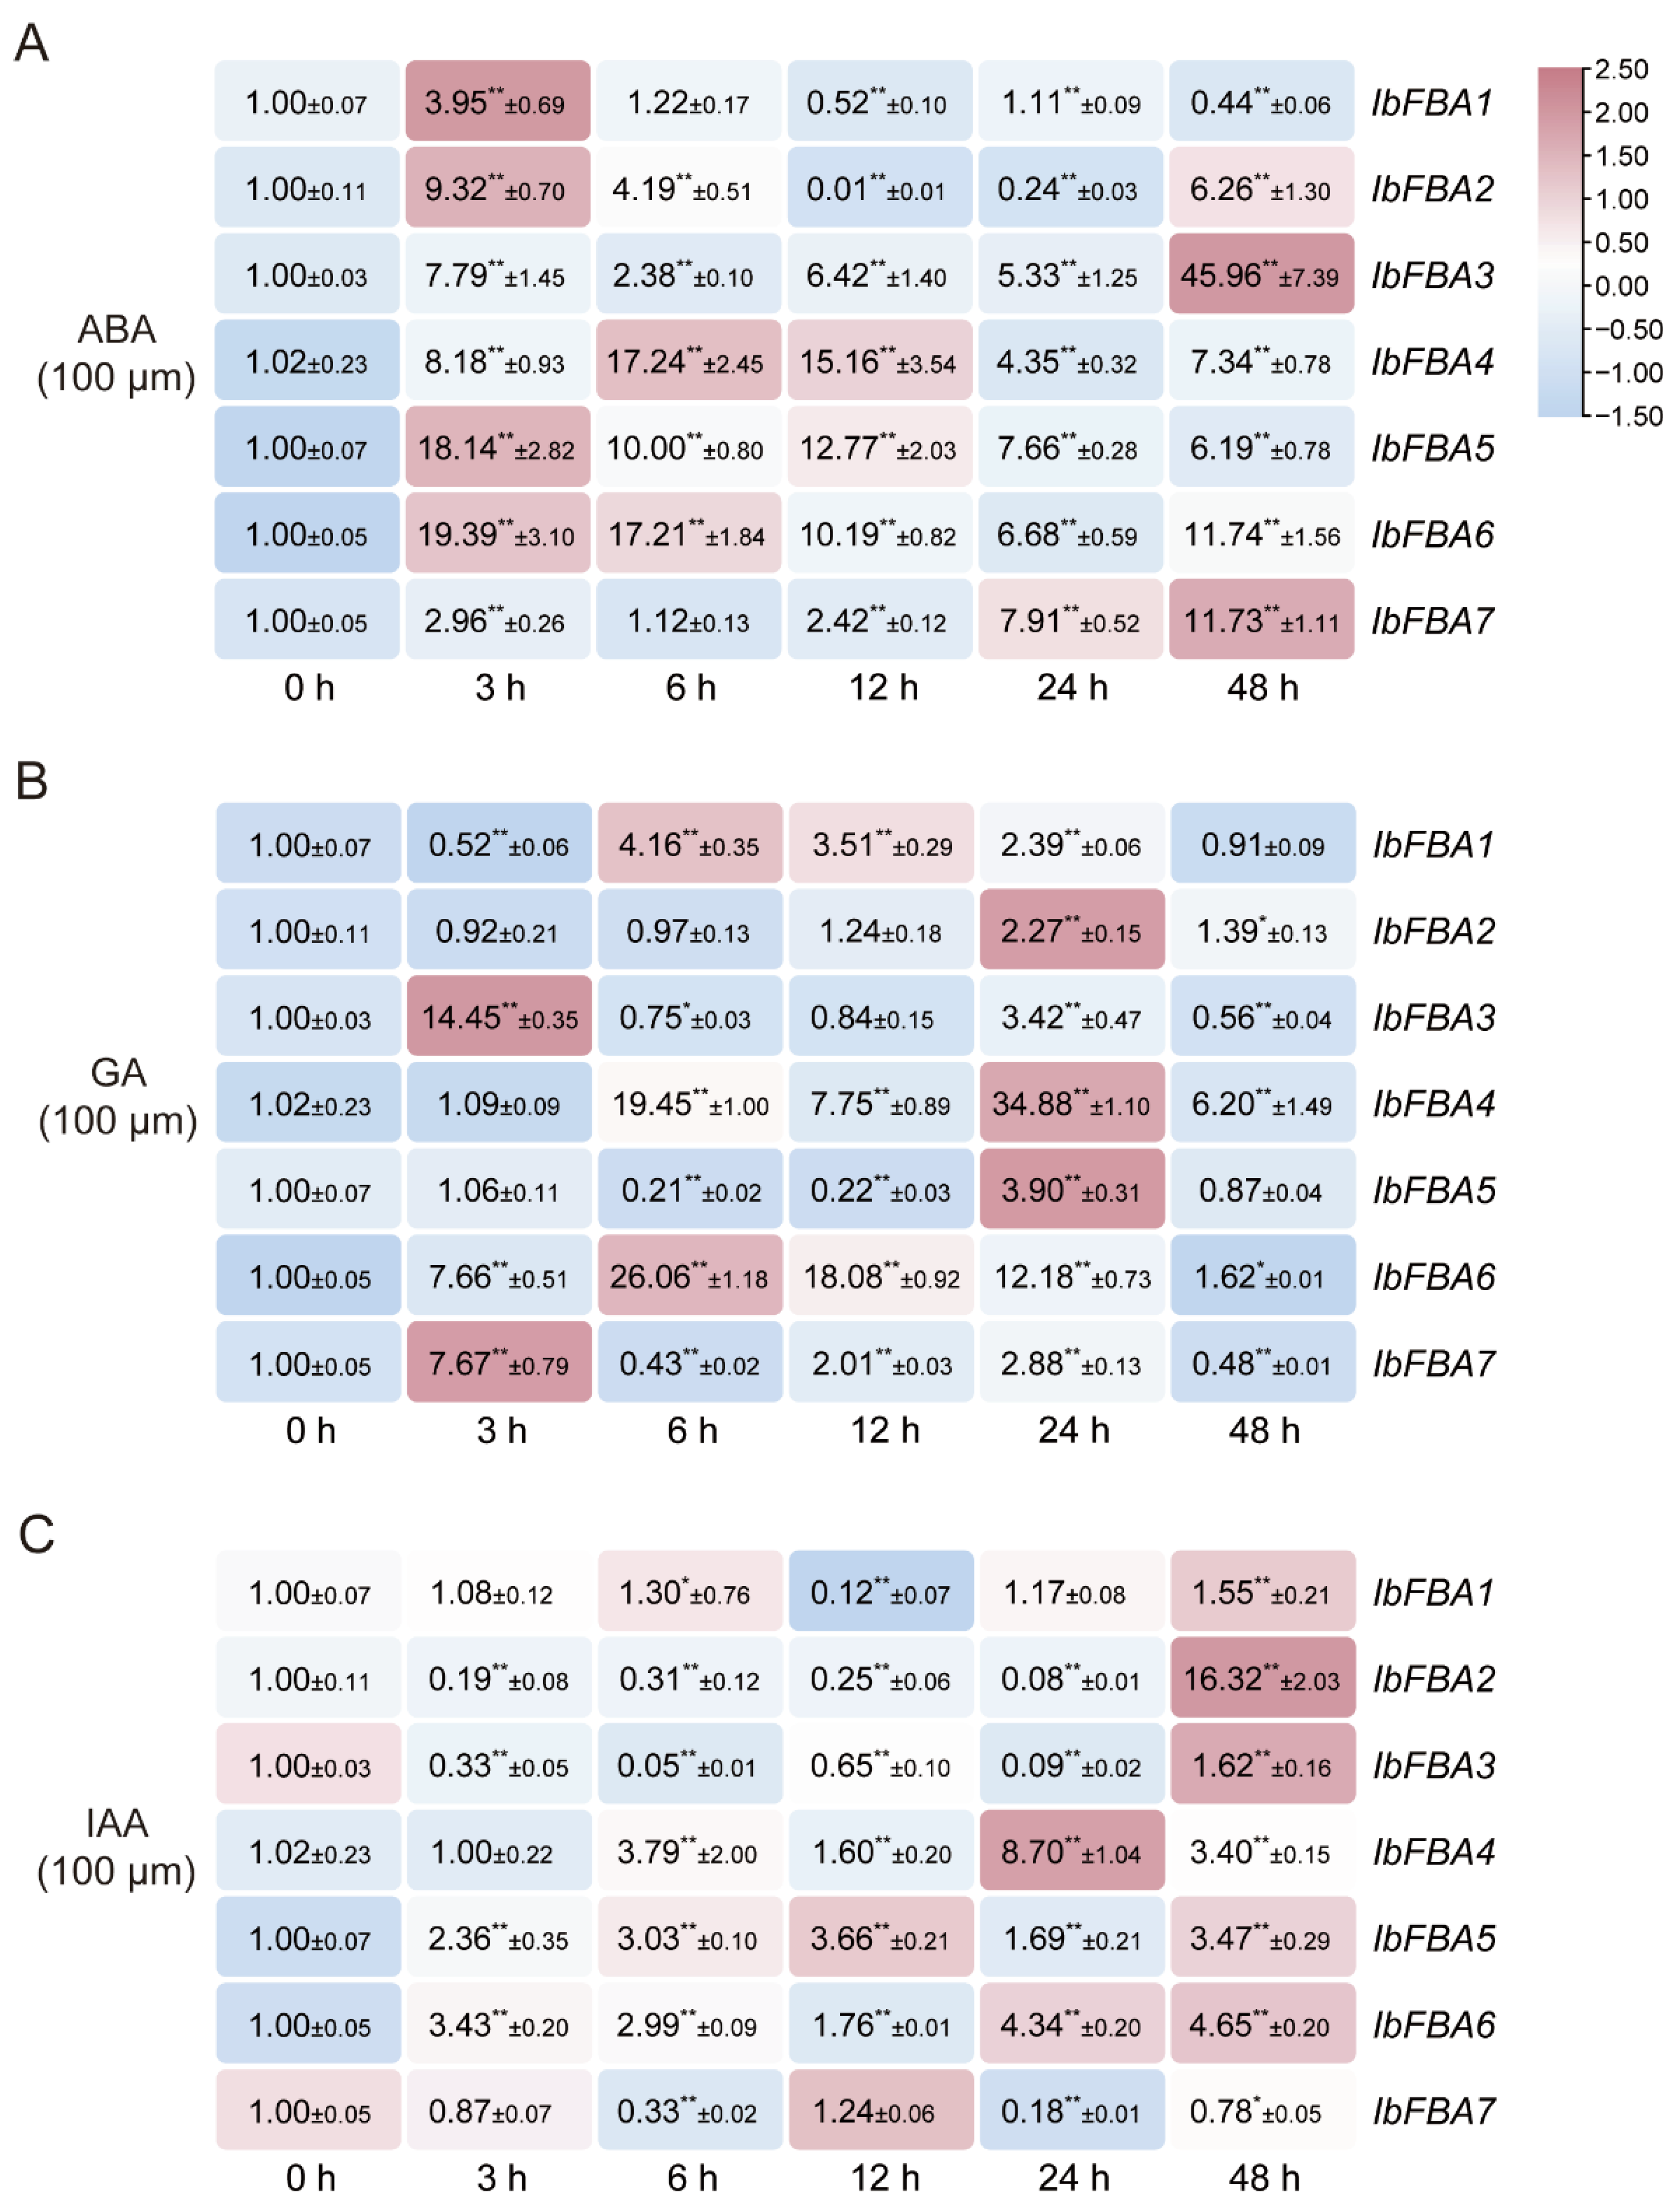
2.5.5. Expression Analysis in Response to Hormones

Next, we conducted a qRT-PCR to evaluate the expression levels of IbFBAs in sweet potato variety Jishu25 following treatments with ABA, GA3, and IAA to explore the potential functions of IbFBAs in the hormone signaling and crosstalk in sweet potato (Figure 9). Under ABA and GA3 treatments, all IbFBAs were upregulated (Figure 9A,B). Under ABA treatment, IbFBA1, IbFBA2, IbFBA5, and IbFBA6 exhibited the highest expression at 3 h, IbFBA4 at 6 h, and IbFBA3 and IbFBA7 at 48 h (Figure 9A). Under GA3 treatment, IbFBA3 and IbFBA7 were highest expressed at 3 h; IbFBA1 and IbFBA6 at 6 h; and IbFBA2, IbFBA4, and IbFBA5 at 24 h after the treatment (Figure 9B). Under IAA treatment, IbFBA4, IbFBA5, and IbFBA6 were upregulated, and the others were downregulated or unchanged (Figure 9C).
RNA-seq data analysis revealed the expression of ItfFBAs and ItbFBAs subjected to ABA (upregulated genes: ItfFBA1, ItfFBA6, ItbFBA1, ItbFBA4, and ItbFBA6; downregulated genes: ItfFBA3, ItfFBA4, ItfFBA5, ItfFBA7, ItbFBA3, and ItbFBA5), GA3 (upregulated genes: ItfFBA1, ItfFBA3, ItfFBA6, and ItbFBA6; downregulated genes: ItfFBA4, ItfFBA5, ItfFBA7, ItbFBA1, ItbFBA3, ItbFBA4, and ItbFBA5), and IAA (upregulated genes: ItfFBA3, ItfFBA4, ItfFBA7, ItbFBA3, and ItbFBA5; downregulated genes: ItfFBA1, ItfFBA6, ItbFBA1, ItbFBA4, and ItbFBA6) treatments (Figure S3) [28]. Therefore, FBAs exhibited distinct expression patterns in response to hormone treatments and may be involved in hormonal crosstalk in sweet potato and its diploid relatives.

3. Discussion

3.1. FBAs Were Conserved During the Evolution of Sweet Potato

In various plant species, the FBA gene family has been identified in Arabidopsis thaliana (eight) [21], Solanum lycopersicum (eight) [22], Nicotiana tabacum (sixteen) [23], cotton (seventeen) [24], Solanum tuberosum (nine) [25], and Cucumis sativus (five) [26]. In this research, we identified seven, seven, and six FBAs in I. batatas, I. trifida, and I. triloba, respectively. According to the chromosomal localization and phylogenetic relationships of FBAs, the homologs among I. batatas, I. trifida, and I. triloba were located on similar genomic positions (Figure 1 and Figure 2), suggesting that FBAs of sweet potato originated from its diploid ancestors, with I. batatas being more closely related to I. trifida.
Furthermore, ten conserved motifs were identified in all FBAs (Figure 3A). Gene exon/intron structures are typically conserved among homologous genes of a gene family [33]. In our study, all homologous FBAs had the same number of exons and introns in I. batatas, I. trifida, and I. triloba. FBAs in Group III and Group IV had more exons than those in Group I and Group II (Figure 3B). These results demonstrate that FBAs, as pivotal enzymes in the pentose phosphate cycle, glycolysis, and gluconeogenesis pathways, were conserved during the evolution of I. batatas [10,18,34]. Owing to the conserved gene and protein structures, FBAs likely play crucial roles in maintaining the carbohydrate metabolism to keep cellular functions in plants.

3.2. IbFBAs Are Involved in Storage Root Development and Starch Biosynthesis in Sweet Potato

As an important metabolic enzyme in photosynthesis and glycolysis/gluconeogenesis, fructose-1,6-bisphosphate aldolase (FBA) is an important enzyme involved in photosynthetic products and energy metabolism [15]. In potatoes, the inhibition of FBA activity decreased the sucrose and starch content in tubers [12]. In tobacco, overexpression of Arabidopsis thaliana plastid aldolase gene (AtptAL) promoted the photosynthetic rate and enhanced biomass yields of tobacco [13]. In rice, the mutation of OsALD-Y exhibited serious defects in chloroplast development and Chlorophyll accumulation, affecting the photosynthetic rate and sugar metabolism in leaves, which ultimately reduced the yield of rice [35]. In Arabidopsis, the mutation of AtFBA3 disrupted plastid glycolytic metabolism in roots, thereby limiting the synthesis of essential compounds such as starch and amino acids [15]. Overexpression of PeFBA6 in rice increased the accumulation of glucose, fructose, and starch in seeds [36]. In summary, these findings demonstrated that FBA is essential for metabolic processes and plant development.
In our research, IbFBA1 and IbFBA6 were highly expressed in storage roots, suggesting that they may be involved in starch biosynthesis of storage roots, while other IbFBAs were predominantly expressed in leaves and may participate in the assimilation of carbohydrates (Figure 5). As the primary harvest organ of sweet potato, storage roots serve as the main sink for carbohydrate accumulation. At different developmental stages of storage roots, IbFBAs exhibited differential expression patterns. In Taizhong 6, IbFBA1, IbFBA4, and IbFBA6 were highly expressed in DR, and IbFBA3 and IbFBA7 were highly expressed in FR (Figure 6A). The qRT-PCR analysis showed that IbFBA1 and IbFBA2 were highly expressed at 60 DAP (initial thickening). IbFBA3, IbFBA4, IbFBA6, and IbFBA7 were highly expressed at 75 DAP (rapid thickening and initial starch accumulation stage) (Figure 6B). Additionally, IbFBA2, IbFBA3, IbFBA5, and IbFBA6 were highly expressed in the high-starch-content variety Jishu 25; IbFBA1 and IbFBA4 were highly expressed in the low-starch-content variety Jishu 29 (Figure 6B). The qRT-PCR analysis showed that IbFBA2, IbFBA5, and IbFBA6 were expressed at significantly higher levels in high-starch lines compared to medium- and low-starch lines (Figure 7). Therefore, IbFBA1 may primarily contribute to storage root development, while IbFBA6 may be involved in both development and starch biosynthesis, making them potential targets for improving yield and starch content in sweet potato.

3.3. FBAs Regulate Response to Drought and Salt Stresses in Sweet Potato and Its Two Wild Diploid Relatives

FBAs in plants have been reported to regulate plant response to abiotic stress. In tomato, reduced FBA activities compromised plant tolerance to chilling stress [20]. In mini Chinese cabbage seedlings, BR enhanced S-nitrosylation of BrFBA2 and accelerated ATP release, helping to maintain homeostasis of cell energy metabolism at low temperature [37]. In chickpea, the activities of fructose-1,6-bisphosphate aldolase declined under drought stress [19]. In maize, the fructose-1,6-bisphosphate aldolase 1 gene (Aldo1) participated in the response to hypoxia [38,39]. In Sesuvium portulacastrum, drought and salt treatment induced the expression of SpFBA [18]. In this study, IbFBA1, IbFBA4, IbFBA5, IbFBA6, and IbFBA7 in sweet potato; ItfFBA1 and ItfFBA6 in I. trifida; and ItbFBA1, ItbFBA4, and ItbFBA6 in I. triloba were upregulated under drought stress (Figure 8A and Figure S2A). Therefore, the FBAs, especially FBA1 and FBA6, may play crucial roles in response to drought stress in sweet potato and its two diploid relatives.
Under NaCl stress, IbFBA2, IbFBA4, and IbFBA5 were upregulated, and IbFBA6 and IbFBA7 were downregulated in both Jishu 26 and NL54 (Figure 8B). ItfFBA1 and ItfFBA6 in I. trifida and ItbFBA1 and ItbFBA6 in I. triloba were upregulated under NaCl stress (Figure S2B). These findings suggest that FBAs are involved in regulating salt stress responses in sweet potato and its diploid relatives, although their salt tolerance functions may have diverged during sweet potato evolution.

3.4. FBAs Participate in Hormone Crosstalk in Sweet Potato and Its Two Wild Diploid Relatives

In previous studies, FBA genes in plants have been shown to participate in hormonal signaling pathways, including those involving abscisic acid (ABA), gibberellin (GA), and brassinosteroids (BR) [40,41]. However, no reports have addressed the roles of FBAs in mediating responses to other plant hormones. In this study, abundant ABA-, GA-, and SA-responsive elements were identified in the IbFBA promoters, and similarly, ItfFBAs and ItbFBAs promoters were enriched in hormone-responsive elements (Figure 4). Furthermore, most IbFBAs were transcriptionally activated by ABA, GA3, and IAA, whereas most ItfFBAs and ItbFBAs were repressed or unaffected by these hormone treatments (Figure S3). Specifically, IbFBA1 and IbFBA6, along with their homologs, ItfFBA1, ItfFBA6, ItbFBA1, and ItbFBA6, were upregulated under ABA treatment, and IbFBA6, along with ItfFBA6 and ItbFBA6, were upregulated by GA3 treatment (Figure 9). These results suggest that FBAs may participate in hormone crosstalk in sweet potato and its wild diploid relatives, and their hormonal regulatory roles may have become more pronounced during the evolution of sweet potato. FBA1 is likely involved in ABA-mediated signaling, while FBA6 may function in both ABA and GA responses in sweet potato and its diploid relatives.

4. Materials and Methods

4.1. Identification of FBAs

All protein sequences of I. trifida and I. triloba were extracted from the Ipomoea Genome Hub (https://sweetpotato.uga.edu/, accessed on 2 April 2025), and the I. batatas Taizhong6 protein sequences were downloaded from the Sweet potato Genomics Resource (https://sweetpotao.com/download_genome.html, accessed on 2 February 2025). The Hidden Markov Model (HMM) profiles of the glycolytic domain (PF00274) and fructose-bisphosphate aldolase class-II domain (PF01116) were downloaded from the Pfam database (http://www.ebi.ac.uk/interpro/, accessed on 2 April 2025) to screen all the possible FBA proteins in I. batatas, I. trifida, and I. triloba. All the predicted FBAs sequences were checked using NCBI Batch CD-Search programs (CDD, E value < 1e−2, https://www.ncbi.nlm.nih.gov/Structure/cdd/wrpsb.cgi, accessed on 2 April 2025) and SMART (http://smart.embl-heidelberg.de/, accessed on 2 April 2025).

4.2. Chromosomal Location and Property Prediction of FBAs

IbFBAs, ItfFBAs, and ItbFBAs were located on the I. batatas, I. trifida, and I. triloba chromosomes, respectively, according to the annotated GFF3 files downloaded from the Ipomoea Genome Hub (https://sweetpotao.com/download_genome.html/, accessed on 3 April 2025) and Sweet potato Genomics Resource (http://sweetpotato.plantbiology.msu.edu/, accessed on 3 April 2025). The visualization was generated by the TBtools software v1.120 (South China Agricultural University, Guangzhou, China). “One Step MCScanX Super Fast” of TBtools software v1.131 was used to obtain collinearity information among IbFBAs, ItfFBAs and ItbFBAs [42].
The ExPASy was used to calculate the MW, theoretical pI, unstable index, and hydrophilic of the FBAs (https://www.expasy.org/, accessed on 3 April 2025). The subcellular localizations of FBAs were presumed by WoLF PSORT website (https://wolfpsort.hgc.jp/aboutWoLF_PSORT.html.en, accessed on 3 April 2025).

4.3. Phylogenetic Analysis of FBAs

Protein sequences of A. thaliana, I. batatas, I. triloba, I. trifida, and S. tuberosum were used to construct the phylogenetic tree via the neighbor-joining method with 1000 bootstrap replicates [43]. The phylogenetic tree was visualized by iTOL (http://itol.embl.de/, accessed on 5 April 2025).

4.4. Gene Structures and Conserved Motifs Analysis of FBAs

The conserved motifs of FBAs were analyzed using MEME software (https://meme-suite.org/meme/tools/meme, accessed on 5 April 2025), and the maximum number of motif parameters was set to 10 [44]. Tbtools software (v1.131) was used to visualize the conserved domain structures and exon–intron structures of FBAs (South China Agricultural University, Guangzhou, China).

4.5. Cis-Acting Elements in Promoter Regions Analysis of IbFBAs

The PlantCARE was used to predicted the cis-elements in the approximately 2000 bp promoter regions of FBAs (http://bioinformatics.psb.ugent.be/webtools/plantcare/html/, accessed on 5 April 2025) [45]. TBtools software (v1.131) was used for visualization.

4.6. Expression Patterns Analysis of IbFBAs

Transcriptome data of Taizhong 6 in different developmental stages (FR, fibrous roots; DR, developing storage roots; MR, mature storage roots) and storage roots expansion of Jishu 29 and Jishu 25 under different developmental stages (32, 46 and 67 DAP: day after planting) from a previous study with NCBI project ID PRJNA756699 were used to calculate the expression patterns of IbFBAs [30,32]. In addition, transcriptome data of the salt-tolerant variety Jishu 26 and the salt-sensitive variety NL54 under salt stress were obtained from previous studies under NCBI project number PRJNA552932 [31]. The RNA-seq data of FBAs in I. trifida and I. triloba were downloaded from the Sweetpotato Genomics Resource (http://sweetpotato.plantbiology.msu.edu/, accessed on 4 March 2023). The expression levels of FBAs were calculated as fragments per kilobase of exon per million fragments mapped (FPKM), and the heat maps of expression were constructed using TBtools software v1.120 (South China Agricultural University, Guangzhou, China).
For the analysis of IbFBAs expression in different organs, under stress, and with hormone effects, the seedlings of sweet potato variety ‘Jishu25’ were collected from the Crop Research Institute, Shandong Academy of Agricultural Sciences, China. Seedlings were grown in Hoagland solution under a light cycle of 26 °C, 16 h of illumination, and 8 h of darkness. When seedlings have 5 to 6 functional leaves and 8 to 10 cm of adventitious roots, they are subjected to four different treatments. The storage roots of Jishu25 sampled at the different development stages (30, 45, 60, 75, 90, 105, and 120 DAP) were used for analyzing the expression of IbFBAs. Hoagland’s solution containing 20% PEG 6000, 100 mmol/L IAA, 100 mmol/L ABA, and 100 mmol/L GA3 was used, respectively,; treated fibrous roots were collected after 0, 3, 6, 12, 24, and 48 h. Total RNA was extracted from the sample using an RNA isolator, Total RNA Extraction Reagent (Vzayme, Nanjing, China). cDNA was obtained through reverse transcription using a reverse transcription kit (Takara, Beijing, China) and used as a template. The CFX Connect real-time system (Bio-RAD) and ChamQ Universal SYBR qPCR Master Mix (Vazyme, Nanjing, China) were used for qRT-PCR. Using the Ibactin gene as an internal reference, Table S2 lists the primer sequences of the examined genes. The experiment was repeated three times, and the data were calculated using the 2−△△CT method [46].

4.7. Statistical Analysis

All data were analyzed using a two-tailed Student’s t-test with SPSS 26.0 (https://www.ibm.com/support/pages/downloading-ibm-spss-statistics-26, accessed on 14 March 2025). Data are shown as means ± standard deviation (SD). Heatmaps were generated using TBtools software v1.131.

5. Conclusions

Seven, seven, and six FBAs were identified in the cultivated sweet potato and its two wild diploid relatives I. trifida and I. triloba, respectively. A comprehensive analysis was performed on their protein physicochemical properties, chromosomal localization, phylogenetic relationship, gene structure, promoter cis-elements, protein interaction network, and expression patterns. All the IbFBAs, ItfFBAs, and ItbFBAs shared the same conserved motifs in proteins, and IbFBAs had the same exons structures as their homologs (ItfFBAs and ItbFBAs). The conserved gene and protein structures suggest functional conservation among FBAs. The FBAs exhibited differential expressions across various organs. IbFBAs might play vital roles in storage root development and starch biosynthesis in sweet potato; among them, IbFBA1 and IbFBA6 are promising candidate genes for further functional investigation. In addition, the FBAs were responsive to drought and salt stress. They also took part in hormone crosstalk, especially between ABA and GA. This work offers valuable insights into the structure and function of FBAs and identifies candidate genes for enhancing yield, starch content, and abiotic stress tolerance in sweet potatoes. By leveraging the genetic diversity and functional plasticity of FBA genes, we can develop crops with enhanced photosynthetic efficiency and resilience to environmental stresses, contributing to global food security.

Supplementary Materials

The following supporting information can be downloaded at https://www.mdpi.com/article/10.3390/ijms26157348/s1.

Author Contributions

F.H. and Z.J. conceived and designed the research. Z.J. performed the experiments. Z.J. and T.D. analyzed the data. Z.J. wrote the paper. Y.Z., Z.Q., A.L., Q.W., L.Z. and F.H. revised the paper. All authors have read and agreed to the published version of the manuscript.

Funding

This work was supported by the Agricultural scientific and technological innovation project of Shandong Academy of Agricultural Sciences (CXGC2025C01), China Agriculture Research System of Sweet potato (CARS-10-GW08), and the Technical System of Potato Industry in Shandong Province (SDAIT-16-04).

Institutional Review Board Statement

Not applicable.

Informed Consent Statement

Not applicable.

Data Availability Statement

The original contributions presented in this study are included in the article/Supplementary Material. Further inquiries can be directed to the corresponding author.

Conflicts of Interest

The authors declare no conflicts of interest.

References

  1. Liu, Q.C. Improvement for agronomically important traits by gene engineering in sweetpotato. Breed. Sci. 2017, 67, 15–26. [Google Scholar] [CrossRef]
  2. Zhang, H.; Zhang, Q.; Zhai, H.; Gao, S.; Yang, L.; Wang, Z.; Xu, Y.; Huo, J.; Ren, Z.; Zhao, N.; et al. IbBBX24 promotes the jasmonic acid pathway and enhances fusarium wilt resistance in sweet potato. Plant Cell 2020, 32, 1102–1123. [Google Scholar] [CrossRef]
  3. Xue, L.Y.; Wei, Z.H.; Zhai, H.; Xing, S.H.; Wang, Y.X.; He, S.Z.; Gao, S.P.; Zhao, N.; Zhang, H.; Liu, Q.C. The IbPYL8-IbbHLH66-IbbHLH118 complex mediates the abscisic acid-dependent drought response in sweet potato. New Phytol. 2022, 236, 2151–2171. [Google Scholar] [CrossRef]
  4. Li, Q.; Zhao, H.; Jin, Y.L.; Zhu, J.C.; Ma, D.F. Analysis and perspectives of sweetpotato industry contributing to national food security in China. J. Jiangsu Agric. Sci. 2022, 38, 1484–1491. [Google Scholar]
  5. Berg, I.A.; Kockelkorn, D.; Ramos-Vera, W.H.; Say, R.F.; Zarzycki, J.; Hügler, M.; Alber, B.E.; Fuchs, G. Autotrophic carbon fixation in archaea. Nat. Rev. Microbiol. 2010, 8, 447–460. [Google Scholar] [CrossRef]
  6. Fushinobu, S.; Nishimasu, H.; Hattori, D.; Song, H.J.; Wakagi, T. Structural basis for the bifunctionality of fructose-1,6-bisphosphate aldolase/phosphatase. Nature 2011, 478, 538–541. [Google Scholar] [CrossRef]
  7. Marsh, J.J.; Lebherz, H.G. Fructose-bisphosphate aldolases: An evolutionary history. Trends Biochem. Sci. 1992, 17, 110–113. [Google Scholar] [CrossRef]
  8. Nakahara, K.; Yamamoto, H.; Miyake, C.; Yokota, A. Purification and characterization of class-I and class-II fructose-1, 6-bisphosphate aldolases from the cyanobacterium Synechocystis sp. PCC 6803. Plant Cell physiol. 2003, 44, 326–333. [Google Scholar] [CrossRef]
  9. Perham, R.N. The fructose-1, 6-bisphosphate aldolases: Same reaction, different enzymes. Biochem. Soc. Trans. 1990, 18, 185–187. [Google Scholar] [CrossRef]
  10. Gross, W.; Lenze, D.; Nowitzki, U.; Weiske, J.; Schnarrenberger, C. Characterization, cloning, and evolutionary history of the chloroplast and cytosolic class I aldolases of the red alga Galdieria sulphuraria. Gene 1999, 230, 7–14. [Google Scholar] [CrossRef]
  11. Lebherz, H.G.; Leadbetter, M.M.; Bradshaw, R.A. Isolation and characterization of the cytosolic and chloroplast forms of spinach leaf fructose diphosphate aldolase. J. Biol. Chem. 1984, 259, 1011–1017. [Google Scholar] [CrossRef]
  12. Haake, V.; Zrenner, R.; Sonnewald, U.; Stitt, M. A moderate decrease of plastid aldolase activity inhibits photosynthesis, alters the levels of sugars and starch, and inhibits growth of potato plants. Plant J. 1998, 14, 147–157. [Google Scholar] [CrossRef]
  13. Uematsu, K.; Suzuki, N.; Iwamae, T.; Inui, M.; Yukawa, H. Increased fructose 1, 6-bisphosphate aldolase in plastids enhances growth and photosynthesis of tobacco plants. J. Exp. Bot. 2012, 63, 3001–3009. [Google Scholar] [CrossRef]
  14. Cai, B.B.; Li, Q.; Liu, F.J.; Bi, H.A.; Ai, X.Z. Decreasing fructose-1,6-bisphosphate aldolase activity reduces plant growth and tolerance to chilling stress in tomato seedlings. Physiol. Plant. 2018, 163, 247–258. [Google Scholar] [CrossRef]
  15. Carrera, D.A.; George, G.M.; Fischer-Stettler, M.; Galbier, F.; Eicke, S.; Truernit, E.; Streb, S.; Zeeman, S.C. Distinct plastid fructose bisphosphate aldolases function in photosynthetic and non-photosynthetic metabolism in Arabidopsis. J. Exp. Bot. 2021, 72, 3739–3755. [Google Scholar] [CrossRef]
  16. Zeng, Y.; Tan, X.; Zhang, L.; Jiang, N.; Cao, H. Identification and expression of fructose-1, 6-bisphosphate aldolase genes and their relations to oil content in developing seeds of tea oil tree (Camellia oleifera). PLoS ONE 2014, 9, e107422. [Google Scholar] [CrossRef]
  17. Yamada, S.; Komori, T.; Hashimoto, A.; Kuwata, S.; Imaseki, H.; Kubo, T. Differential expression of plastidic aldolase genes in plants under salt stress. Plant Sci. 2000, 154, 61–69. [Google Scholar] [CrossRef]
  18. Fan, W.; Zhang, Z.; Zhang, Y. Cloning and molecular characterization of fructose-1,6-bisphosphate aldolase gene regulated by high-salinity and drought in Sesuvium portulacastrum. Plant Cell Rep. 2009, 28, 975–984. [Google Scholar] [CrossRef]
  19. Khanna, S.M.; Taxak, P.C.; Jain, P.K.; Saini, R.; Srinivasan, R. Glycolytic enzyme activities and gene expression in cicer arietinum exposed to water-deficit stress. Appl. Biochem. Biotechnol. 2014, 173, 2241–2253. [Google Scholar] [CrossRef]
  20. Cai, B.B.; Ning, Y.; Li, Q.; Li, Q.Y.; Ai, X.Z. Effects of the chloroplast fructose-1,6-bisphosphate aldolase gene on growth and low-temperature tolerance of tomato. Int. J. Mol. Sci. 2022, 23, 728. [Google Scholar] [CrossRef]
  21. Lu, W.; Tang, X.L.; Huo, Y.Q.; Xu, R.; Qi, S.D.; Huang, J.G.; Zheng, C.C.; Wu, C.A. Identification and characterization of fructose 1,6-bisphosphate aldolase genes in Arabidopsis reveal a gene family with diverse responses to abiotic stresses. Gene 2012, 503, 65–74. [Google Scholar] [CrossRef] [PubMed]
  22. Cai, B.B.; Li, Q.; Xu, Y.C.; Yang, L.; Bi, H.G.; Ai, X.Z. Genome-wide analysis of the fructose 1,6-bisphosphate aldolase (FBA) gene family and functional characterization of FBA7 in tomato. Plant Physiol. Biochem. 2016, 108, 251–265. [Google Scholar] [CrossRef]
  23. Zhao, Y.; Jiao, F.; Tang, H.; Xu, H.; Zhang, L.; Wu, H. Genome-wide characterization, evolution, and expression profiling of FBA gene family in response to light treatments and abiotic stress in Nicotiana tabacum. Plant Signal Behav. 2021, 16, 1938442. [Google Scholar] [CrossRef]
  24. Li, Z.Q.; Zhang, Y.; Li, H.; Su, T.T.; Liu, C.G.; Han, Z.C.; Wang, A.Y.; Zhu, J.B. Genome-wide characterization and expression analysis provide basis to the biological function of cotton FBA genes. Front. Plant Sci. 2021, 12, 696698. [Google Scholar]
  25. Li, T.; Hou, X.Y.; Sun, Z.L.; Ma, B.; Wu, X.X.; Feng, T.T.; Ai, H.; Huang, X.Z.; Li, R.N. Characterization of FBA genes in potato (Solanum tuberosum L.) and expression patterns in response to light spectrum and abiotic stress. Front. Plant Genet. 2024, 15, 1364944. [Google Scholar] [CrossRef]
  26. Zhang, J.L.; Liu, Y.K.; Zhou, Z.P.; Yang, L.N.; Xue, Z.J.; Li, Q.Y.; Cai, B.B. Genome-wide characterization of fructose 1,6-bisphosphate aldolase genes and expression profile reveals their regulatory role in abiotic stress in cucumber. Int. J. Mol. Sci. 2024, 25, 7687. [Google Scholar] [CrossRef]
  27. Yang, J.; Moeinzadeh, M.H.; Kuhl, H.; Helmuth, J.; Xiao, P.; Haas, S.; Liu, G.; Zheng, J.; Sun, Z.; Fan, W.; et al. Haplotype-resolved sweet potato genome traces back its hexaploidization history. Nat. Plants 2017, 3, 696–703. [Google Scholar] [CrossRef]
  28. Wu, S.; Lau, K.H.; Cao, Q.; Hamilton, J.P.; Sun, H.; Zhou, C.; Eserman, L.; Gemenet, D.C.; Olukolu, B.A.; Wang, H.; et al. Genome sequences of two diploid wild relatives of cultivated sweetpotato reveal targets for genetic improvement. Nat. Commun. 2018, 9, 4580. [Google Scholar] [CrossRef]
  29. Du, T.F.; Zhou, Y.Y.; Qin, Z.; Li, A.X.; Wang, Q.M.; Li, Z.Y.; Hou, F.Y.; Zhang, L.M. Genome-wide identification of the C2H2 zinc finger gene family and expression analysis under salt stress in sweetpotato. Front. Plant Sci. 2023, 14, 1301848. [Google Scholar] [CrossRef] [PubMed]
  30. Zhang, J.; Dong, T.; Zhu, M.; Du, D.; Liu, R.; Yu, Q.; Sun, Y.; Zhang, Z. Transcriptome-and genome-wide systematic identification of expans in gene family and their expression in tuberous root development and stress responses in sweetpotato (Ipomoea batatas). Front. Plant Sci. 2024, 15, 1412540. [Google Scholar]
  31. Qin, Z.; Hou, F.; Li, A.; Dong, S.; Wang, Q.; Zhang, L. Transcriptome-wide identification of WRKY transcription factor and their expression profiles under salt stress in sweetpotato (Ipomoea batatas L.). Plant Biotechnol. Rep. 2020, 14, 599–611. [Google Scholar] [CrossRef]
  32. Du, T.F.; Qin, Z.; Zhou, Y.Y.; Zhang, L.M.; Wang, Q.M.; Li, Z.Y.; Hou, F.Y. Comparative transcriptome analysis reveals the effect of lignin on storage roots formation in two sweetpotato (Ipomoea batatas (L.) lam.) cultivars. Genes 2023, 14, 1263. [Google Scholar] [CrossRef] [PubMed]
  33. Frugoli, J.A.; McPeek, M.A.; Thomas, T.L.; McClung, C.R. Intron loss and gain during evolution of the catalase gene family in angiosperms. Genetics 1998, 149, 355–365. [Google Scholar] [CrossRef] [PubMed]
  34. Sonnewald, U.; Lerchl, J.; Zrenner, R.; Frommer, W. Manipulation of sink-source relations in transgenic plants. Plant Cell Environ. 1994, 17, 649–658. [Google Scholar] [CrossRef]
  35. Zhang, F.; Zhang, P.; Zhang, Y.; Wang, S.C.; Qu, L.H.; Liu, X.Q.; Luo, J. Identification of a peroxisomal-targeted aldolase involved in chlorophyll biosynthesis and sugar metabolism in rice. Plant Sci. 2016, 250, 205–215. [Google Scholar] [CrossRef]
  36. Li, T.K.; Li, H.; Zhu, C.L.; Yang, K.B.; Lin, Z.M.; Wang, J.F.; Gao, Z.M. Unveiling the Biological Function of Phyllostachys-edulis FBA6 (PeFBA6) through the Identification of the Fructose-1,6-Bisphosphate Aldolase Gene. Plant 2024, 13, 968. [Google Scholar] [CrossRef]
  37. Gao, X.Q.; Tie, J.Z.; Yang, X.; Yang, J.J.; Wang, G.Z.; Lyu, J.; Hu, L.L.; Yu, J.H. Brassinosteroid-induced S-nitrosylation of fructose-1,6-bisphosphate aldolase increased ATP synthesis under low temperatures in mini Chinese cabbage seedlings. Int. J. Biol. Macromol. 2025, 308, 142626. [Google Scholar] [CrossRef]
  38. Fedorin, D.N.; Khomutova, A.E.; Eprintsev, A.T.; Igamberdiev, A.U. Involvement of miR775 in the post-transcriptional regulation of fructose-1,6-bisphosphate aldolase in maize (Zea mays L.) leaves under hypoxia. Int. J. Mol. Sci. 2025, 26, 865. [Google Scholar] [CrossRef]
  39. Zhang, Z.J.; Li, X.M.; Zhang, Y.Y.; Zhou, J.J.; Chen, Y.M.; Li, Y.; Ren, D.T. Identification of the fructose 1,6-bisphosphate aldolase (FBA) family genes in maize and analysis of the phosphorylation regulation of ZmFBA8. Plant Sci. 2025, 350, 112311. [Google Scholar] [CrossRef]
  40. Konishi, H.; Yamane, H.; Maeshima, M.; Komatsu, S. Characterization of fructose-bisphosphate aldolase regulated by gibberellin in roots of rice seedling. Plant Mol. Biol. 2004, 56, 839–848. [Google Scholar] [CrossRef] [PubMed]
  41. Osakabe, Y.; Maruyama, K.; Seki, M.; Satou, M.; Shinozaki, K.; Yamaguchi-Shinozaki, K. Leucine-rich repeat receptor-like kinase1 is a key membrane bound regulator of abscisic acid early signaling in Arabidopsis. Plant Cell 2005, 17, 1105–1119. [Google Scholar] [CrossRef]
  42. Chen, C.; Chen, H.; Zhang, Y.; Thomas, H.R.; Frank, M.H.; He, Y.; Xia, R. TBtools: An integrative toolkit developed for interactive analyses of big biological data. Mol. Plant 2020, 13, 1194–1202. [Google Scholar] [CrossRef]
  43. Thompson, J.D.; Gibson, T.J.; Plewniak, F.; Jeanmougin, F.; Higgins, D.G. The Clustal_X windows interface: Flexible strategies for multiple sequence alignment aided by quality analysis Tools. Nucleic Acids Res. 1997, 25, 4876–4882. [Google Scholar] [CrossRef]
  44. Bailey, T.L.; Johnson, J.; Grant, C.E.; Noble, W.S. The MEME Suite. Nucleic Acids Res. 2015, 43, W39–W49. [Google Scholar] [CrossRef] [PubMed]
  45. Lescot, M.; Dehais, P.; Thijs, G.; Marchal, K.; Moreau, Y.; Van de Peer, Y.; Rouze, P.; Rombauts, S. PlantCARE, a database of plant cis-acting regulatory elements and a portal to tools for in silico analysis of promoter sequences. Nucleic Acids Res. 2002, 30, 325–327. [Google Scholar] [CrossRef] [PubMed]
  46. Schmittgen, T.D.; Livak, K.J. Analyzing real-time PCR data by the comparative C-T method. Nat. Protoc. 2008, 3, 1101–1108. [Google Scholar] [CrossRef] [PubMed]
Figure 1. Chromosomal localization and distribution of FBAs in I. batatas (A), I. trifida (B), and I. triloba (C). The bars represent chromosomes. The chromosome numbers are displayed on the left side, and the gene names are displayed on the right side. The relative chromosomal localization of each FBA gene is marked on the black line of the right side and indicated by the unit Mbp. The stripes on chromosomes represent the density of chromosomes. (D) Syntenic analysis of I. batatas, I. trifida, and I. triloba FBAs. Chromosomes of I. batatas, I. trifida, and I. triloba are shown in different colors. The approximate positions of IbFBAs, ItfFBAs, and ItbFBAs are marked with short black lines on the chromosomes. Red curves denote the syntenic relationships between I. batatas and I. trifida FBAs.
Ijms 26 07348 g001
Figure 2. Phylogenetic analysis of FBAs in I. batatas, I.triloba, I. trifida, A. thaliana, and S. tuberosum. Based on the neighbor-joining method with 1000 bootstrap replicates, a total of 37 FBAs were divided into four groups (groups I, II, III, and IV, filled with orange, green, blue, and purple, respectively). The claret circles represent seven IbFBAs in I. batatas. The purple squares represent seven ItfFBAs in I. trifida. The yellow stars represent six ItbFBAs in I. triloba. The green triangles represent eight AtFBAs in A. thaliana. The brown triangles represent nine StFBAs in S. tuberosum.
Ijms 26 07348 g002
Figure 3. Conserved motifs and exon–intron structure analysis of FBAs in I. batatas, I. trifida, and I. triloba. (A) The phylogenetic tree showed that FBAs were divided into four subgroups, and the ten conserved motifs were shown in different colors. The claret circles represent IbFBAs. (B) Exon–intron structures of FBAs. The green boxes, yellow boxes, and black lines represent CDS, UTRs, and introns, respectively.
Ijms 26 07348 g003
Figure 4. Cis-element analysis in the promoters of FBAs from I. batatas, I. trifida, and I. triloba. The cis-elements were divided into five broad categories. The degree of red colors represents the number of cis-elements in the promoters of FBAs.
Ijms 26 07348 g004
Figure 5. Expression analysis of FBAs in different organs of I. batatas, I. trifida, and I. triloba. (A) Expression analysis of IbFBAs in the leaf, stem, and storage root of I. batatas. The values were determined by qRT-PCR from three biological replicates consisting of pools of three plants, and the results were analyzed using the comparative CT method. The expression level of the leaf is determined as “1”. Fold change ± SD is shown in the boxes. (**) and (*) indicate significant difference at p < 0.01 and p < 0.05, respectively, based on the Student’s t-test compared to the leaf. (B) Expression patterns of ItfFBAs in the flower, leaf, stem, root1, and root2 of I. trifida. (C) Expression patterns of ItbFBAs in the flower, leaf, stem, root1, and root2 of I. triloba. The FPKM values are shown in the boxes.
Ijms 26 07348 g005
Figure 6. Expression analysis of IbFBAs at different developmental stages of the H283 storage roots (i.e., 20, 30, 40, 50, 60, 70, 80, 90, 100, and 130 DAP) using qRT-PCR. (A) Expression analysis of IbFBAs at different developmental stages of the Taizhong 6 storage roots (i.e., FR, DR, and MR). The FPKM values are shown in the boxes. (B) Expression analysis of IbFBAs at different developmental stages of the Jishu 29 and Jishu 25 storage roots (i.e., 32, 46, and 67 DAP). The FPKM values are shown in the boxes. (C) Expression analysis of IbFBAs at different developmental stages of the Jishu 25 storage roots (i.e., 30, 45, 60, 75, 90, 105, and 120 DAP) using qRT-PCR. The values were determined via qRT-PCR from three biological replicates consisting of pools of three plants, and the results were analyzed using the comparative CT method. The expression level of 30 DAP is determined as “1”. Fold change ± SD is shown in the boxes. (**) and (*) indicate significant difference at p < 0.01 and p < 0.05, respectively, based on the Student’s t-test compared to 30 DAP.
Ijms 26 07348 g006
Figure 7. Expression analysis of IbFBAs in sweet potato lines with different starch contents. The values were determined using qRT-PCR from three biological replicates consisting of pools of three plants, and the results were analyzed using the comparative CT method. The expression level of Jishu 33 is determined as “1”. Fold change ± SD is shown in the boxes. (**)indicates significant difference at p < 0.01 based on the Student’s t-test compared to Jishu 33.
Ijms 26 07348 g007
Figure 8. Expression analysis of IbFBAs in sweet potato under drought and salt stresses. (A) Expression analysis of IbFBAs in the drought-tolerant line Xu55-2 under PEG6000 stress. The values were determined with the qRT-PCR from three biological replicates consisting of pools of three plants, and the results were analyzed using the comparative CT method. The expression level of 0 h is determined as “1”. Fold change ± SD is shown in the boxes. (**) and (*) indicate significant difference at p < 0.01 and p < 0.05, respectively, based on the Student’s t-test compared to 0 h. (B) Expression analysis of IbFBAs in the salt-sensitive variety NL54 and salt-tolerant line Jishu 26 under NaCl stress. The FPKM values are shown in the boxes.
Ijms 26 07348 g008
Figure 9. Expression analysis of IbFBAs in response to different hormones in sweet potato line Jishu 25: (A) ABA. (B) GA3. (C) IAA. The values were determined using the qRT-PCR from three biological replicates consisting of pools of three plants, and the results were analyzed using the comparative CT method. The expression level of 0 h is determined as “1”. Fold change ± SD is shown in the boxes. (**) and (*) indicate significant difference at p < 0.01 and p < 0.05, respectively, based on the Student’s t-test compared to 0 h.
Ijms 26 07348 g009
Table 1. Characteristics of FBAs in I. batatas, I. trifida, and I. triloba.
Gene IDGene NameGenomic
Length (bp)
CDS
(bp)
Protein Size (aa)MW (kDa)pIInstabilityGRAVYSubcellular
Location
g7510.t1IbFBA12902118239342.498.6138.95−0.238chloroplast
g25147.t1IbFBA21682108035938.977.5332.85−0.336cytoplasm
g29379.t1IbFBA32345117339041.917.5635.57−0.087chloroplast
g45357.t1IbFBA42537107735838.627.5134.46−0.228cytoplasm
g53926.t1IbFBA52702104734837.146.8636.14−0.33cytoplasm
g58139.t1IbFBA62418107735838.517.5329.23−0.156cytoplasm
g59775.t1IbFBA72134117038941.418.1736.61−0.13chloroplast
itf15g01090ItfFBA11752108035938.977.5332.85−0.336cytoplasm
itf09g13930ItfFBA22461107735838.517.5329.23−0.156cytoplasm
itf03g07070ItfFBA32365119439742.667.5936.02−0.105chloroplast
itf04g13320ItfFBA43179118239342.498.6138.95−0.238chloroplast
itf02g17280ItfFBA52273107435738.236.3831.82−0.123cytoplasm
itf01g09380ItfFBA62527107735838.617.5134.09−0.228cytoplasm
itf09g00890ItfFBA72611119439742.588.4936.56−0.094chloroplast
itb04g138401ItbFBA14627118239342.498.6138.95−0.238chloroplast
itb15g011501ItbFBA21831108035938.977.5332.85−0.336cytoplasm
itb01g158701ItbFBA32699107735838.62835.12−0.228cytoplasm
itb09g148001ItbFBA42864107735838.518.0430.13−0.156cytoplasm
itb03g071201ItbFBA52316119439742.677.5936.02−0.101chloroplast
itb02g147601ItbFBA62589119139642.696.9738.86−0.101chloroplast
CDS, coding sequence; MW, molecular weight; pI, isoelectric point; GRAVY, grand average of hydropathicity.
Disclaimer/Publisher’s Note: The statements, opinions and data contained in all publications are solely those of the individual author(s) and contributor(s) and not of MDPI and/or the editor(s). MDPI and/or the editor(s) disclaim responsibility for any injury to people or property resulting from any ideas, methods, instructions or products referred to in the content.

