Article

Long-Chain Fatty Acids Alter Estrogen Receptor Expression in Breast Cancer Cells

Department of Molecular Pathology, Nara Medical University School of Medicine, Kashihara 634-8521, Japan
*
Authors to whom correspondence should be addressed.
These authors contributed equally to this work.
Int. J. Mol. Sci. 2025, 26(14), 6722; https://doi.org/10.3390/ijms26146722
Submission received: 31 May 2025 / Revised: 8 July 2025 / Accepted: 11 July 2025 / Published: 13 July 2025
(This article belongs to the Special Issue Molecular Mechanisms and Targeted Therapies of Breast Cancer)

Abstract

Long-chain fatty acids (LCFAs) have emerged as important regulators of cancer metabolism, but their impact on hormone receptor expression in breast cancer (BCA) remains poorly understood. In this study, we investigated the effects of five LCFAs—linoleic acid (LA), oleic acid (OA), elaidic acid (EA), palmitic acid (PA), and α-linolenic acid (LNA)—on two BCA cell lines: luminal-type MCF7 and triple-negative MDA-MB-231 (MB231). All LCFAs suppressed cell viability and mitochondrial function in a dose-dependent manner, accompanied by decreased membrane potential, increased reactive oxygen species production, and a metabolic shift. Notably, OA reduced both mRNA and nuclear protein levels of estrogen receptor alpha (ERα) in MCF7 cells, leading to impaired responses to estradiol and tamoxifen. In contrast, PA induced nuclear ERα expression in MB231 cells, although ER signaling remained inactive. MicroRNA profiling revealed that OA upregulated ER-suppressive miR-22 and miR-221 in MCF7, while PA increased miR-34a in MB231, contributing to ERα induction. These findings suggest that specific LCFAs modulate ER expression through epigenetic and post-transcriptional mechanisms, altering hormonal responsiveness in BCA. Our results offer new insights into how dietary lipids may influence therapeutic efficacy and tumor behavior by regulating nuclear receptor signaling.

1. Introduction

Breast cancer (BCA) is the most common malignancy among women, with an estimated 2.3 million new cases and 680,000 deaths worldwide in 2020 [1]. Its incidence is higher in high-income countries, while mortality is disproportionately greater in low- and middle-income countries, reflecting regional disparities in early detection and access to treatment, factors that critically impact survival rates.
BCA is classified into four molecular subtypes based on the expression of key biomarkers, each characterized by distinct biological features and therapeutic approaches [2]. The luminal A subtype (estrogen receptor [ER]+/human epidermal growth factor receptor 2 [HER2]−), which expresses hormone receptors, responds well to endocrine therapies, such as tamoxifen and aromatase inhibitors, and is associated with the most favorable prognosis [3]. The luminal B subtype (ER+/HER2+ or high Ki67) typically requires a combination of endocrine therapy with chemotherapy and HER2-targeted agents like trastuzumab [4,5]. The HER2-enriched subtype (ER−/HER2+), once linked to poor outcomes, now shows significantly improved prognoses due to the advent of HER2-targeted therapies including trastuzumab, pertuzumab, and trastuzumab emtansine [6].
In contrast, triple-negative BCA (TNBC; ER−/PR−/HER2−) has limited treatment options and is associated with a poor prognosis. In recent years, however, immune checkpoint inhibitors (e.g., atezolizumab combined with nab-paclitaxel) and poly (ADP-ribose) polymerase inhibitors (e.g., olaparib) have been approved for specific patient subgroups [7,8]. Furthermore, intratumoral heterogeneity and differences in metastatic behavior among subtypes underscore the increasing importance of personalized medicine [9,10,11].
ERα is a nuclear steroid receptor expressed in approximately 70% of BCAs and plays a central role in regulating cell proliferation, differentiation, and tumor progression [12,13]. ERα is activated in an estrogen-dependent manner and promotes tumor cell growth by modulating the transcription of target genes via estrogen response elements (EREs) [14]. The ER gene (ESR1) contains complex transcriptional regulatory regions and is subject to epigenetic regulation, including histone acetylation and DNA methylation [15]. For instance, CpG methylation of the ESR1 promoter is associated with ER silencing and is frequently observed in triple-negative breast cancer (TNBC) [16]. ER expression is maintained by transcription factors such as GATA-binding protein 3 (GATA3) and forkhead box protein A1 (FOXA1), which regulate chromatin accessibility at the ER locus [17,18]. Notably, GATA3 is essential for maintaining luminal differentiation in BCA and functions alongside ER as a “luminal master regulator” [19]. Several microRNAs (miRNAs) directly target ER mRNA and regulate its expression through translational repression or mRNA degradation. For example, miR-221/222, miR-206, and miR-22 have been shown to bind to the 3′UTR of ESR1, leading to reduced ER protein levels [20,21].
Long-chain fatty acids (LCFAs), defined as fatty acids with 12 or more carbon atoms, are integral to membrane structure, energy metabolism, and cell signaling. Recent studies have highlighted their important roles in cancer cell proliferation, invasion, and metabolic adaptation [22]. In addition to exhibiting the Warburg effect and a dependence on glucose metabolism, cancer cells promote tumor progression by modulating fatty acid uptake, synthesis, and oxidation [23,24]. Elevated expression of CD36 and fatty acid transport proteins (FATPs) enhances LCFA uptake, which is subsequently used for mitochondrial β-oxidation or membrane lipid biosynthesis [25,26,27]. Each LCFA exerts a distinct effect on cancer cells. Palmitic acid (PA, C16:0) contributes to cancer cell inflammation and increases the metastatic potential by inducing endoplasmic reticulum stress, altering lipid rafts, and activating toll-like receptor 4 [28]. Oleic acid (OA, C18:1) promotes cell proliferation in certain cancers (e.g., breast and prostate cancers) but also facilitates drug resistance by suppressing ER expression and activating the phosphatidylinositol 3-kinase (PI3K)/AKT pathway [29,30]. Omega-6 fatty acids, such as linoleic acid (LA, C18:2), are considered to promote tumors through the production of inflammatory eicosanoids (e.g., prostaglandin E2) [31,32]. We have previously shown that LA induces dormancy in colorectal cancer cells via the upregulation of miR-497, leading to the suppression of energy metabolism and increased expression of the repressive form of the Gli family zinc finger 2 protein [33,34,35]. This mechanism has attracted attention as a potential cause of delayed metastasis in breast and gastrointestinal cancers. Moreover, LA has been implicated in maintaining stemness in mesenchymal stem cells within the tumor stroma [36], as well as in promoting drug resistance [37] and tumorigenesis [38]. LCFAs have garnered increasing attention as tumor-promoting factors in various cancers. In TNBC, fatty acid oxidation serves as a major source of ATP, and inhibition of the LCFA-metabolizing enzyme carnitine palmitoyltransferase 1A has been proposed as a potential therapeutic strategy [39].
Although LCFAs have been shown to exert various effects on BCA cells, their precise mechanisms, particularly their relationship with hormone receptor expression, remain incompletely understood. In this study, we investigated the potential therapeutic relevance of selected LCFAs by examining their effects on human BCA cell lines.

2. Results

2.1. Effect of LCFAs on Cell Viability in BCA Cells

We first treated MCF7 (estrogen receptor-positive, ER+) and MDA-MB-231 (MB231) (triple-negative breast cancer, TNBC) cells with five types of LCFAs—LA, OA, elaidic acid (EA, C18:1, trans), PA, and α-linolenic acid (LNA, C18:3, ω-3)—at various concentrations. In MCF7 cells, all LCFAs showed dose-dependent viability inhibition, with LA exerting the strongest suppressive effect (Figure 1A). In contrast, MB231 cells were less sensitive to most LCFAs, showing viability inhibition only at higher concentrations, with the exception of PA. Notably, EA promoted cell viability as well. PA, however, exhibited a strong inhibitory effect on MB231 cells, even at low concentrations (Figure 1B). Moreover, a comparison of PA sensitivity revealed that the IC50 in MB231 cells was approximately half of that observed in MCF7 cells, indicating a greater inhibitory effect in MB231 (Figure 1C). The treatment concentrations of LCFAs were set to 50 μM based on the results in Figure 1.

2.2. Effect of LCFAs on Mitochondrial Function in BCA Cells

As LCFAs are transported into mitochondria via the carnitine shuttle and influence mitochondrial activity [40,41], we next examined their effects on mitochondrial function. In MCF7 cells, mitochondrial membrane potential (MMP) was reduced by LA, OA, and PA, while in MB231 cells, MMP was decreased by LA, OA, EA, and LNA (Figure 2A). Mitochondrial volume (MtVol) decreased with all LCFAs in MCF7 cells. In MB231 cells, MtVol was also reduced by all LCFAs except LNA, which caused an increase in volume (Figure 2B). Mitochondrial H2O2 levels increased in MCF7 cells with all LCFAs, whereas in MB231 cells, H2O2 levels rose only with LA and declined with the other fatty acids (Figure 2C). Similarly, mitochondrial superoxide levels increased across all treatments in MCF7 cells, but in MB231 cells, the levels decreased with LA and OA and increased with PA (Figure 2D).

2.3. Effect of LCFAs on Stemness and Differentiation of BCA Cells

We next investigated the effects of LCFAs on stemness by analyzing the expression of CD24 and octamer-binding transcription factor 3 (Oct3), which are recognized markers of stemness in BCA [42]. CD24 expression was reduced by LA and OA in both the MCF7 and MB231 cell lines (Figure 3A,B). Oct3 expression was decreased by LA and OA in MCF7 cells, whereas in MB231 cells, all LCFAs led to reduced Oct3 expression (Figure 3A,C). To assess differentiation, we examined the expression of the epithelial markers E-cadherin (CDH) and cytokeratin 18 (CK18). Both genes were upregulated by all LCFAs in both cell lines (Figure 3D–F). In sphere formation, OA reduced the sphere number in MCF7 and MB231 cells. PA reduced the sphere number in MCF7 cells alone (Figure 3G).

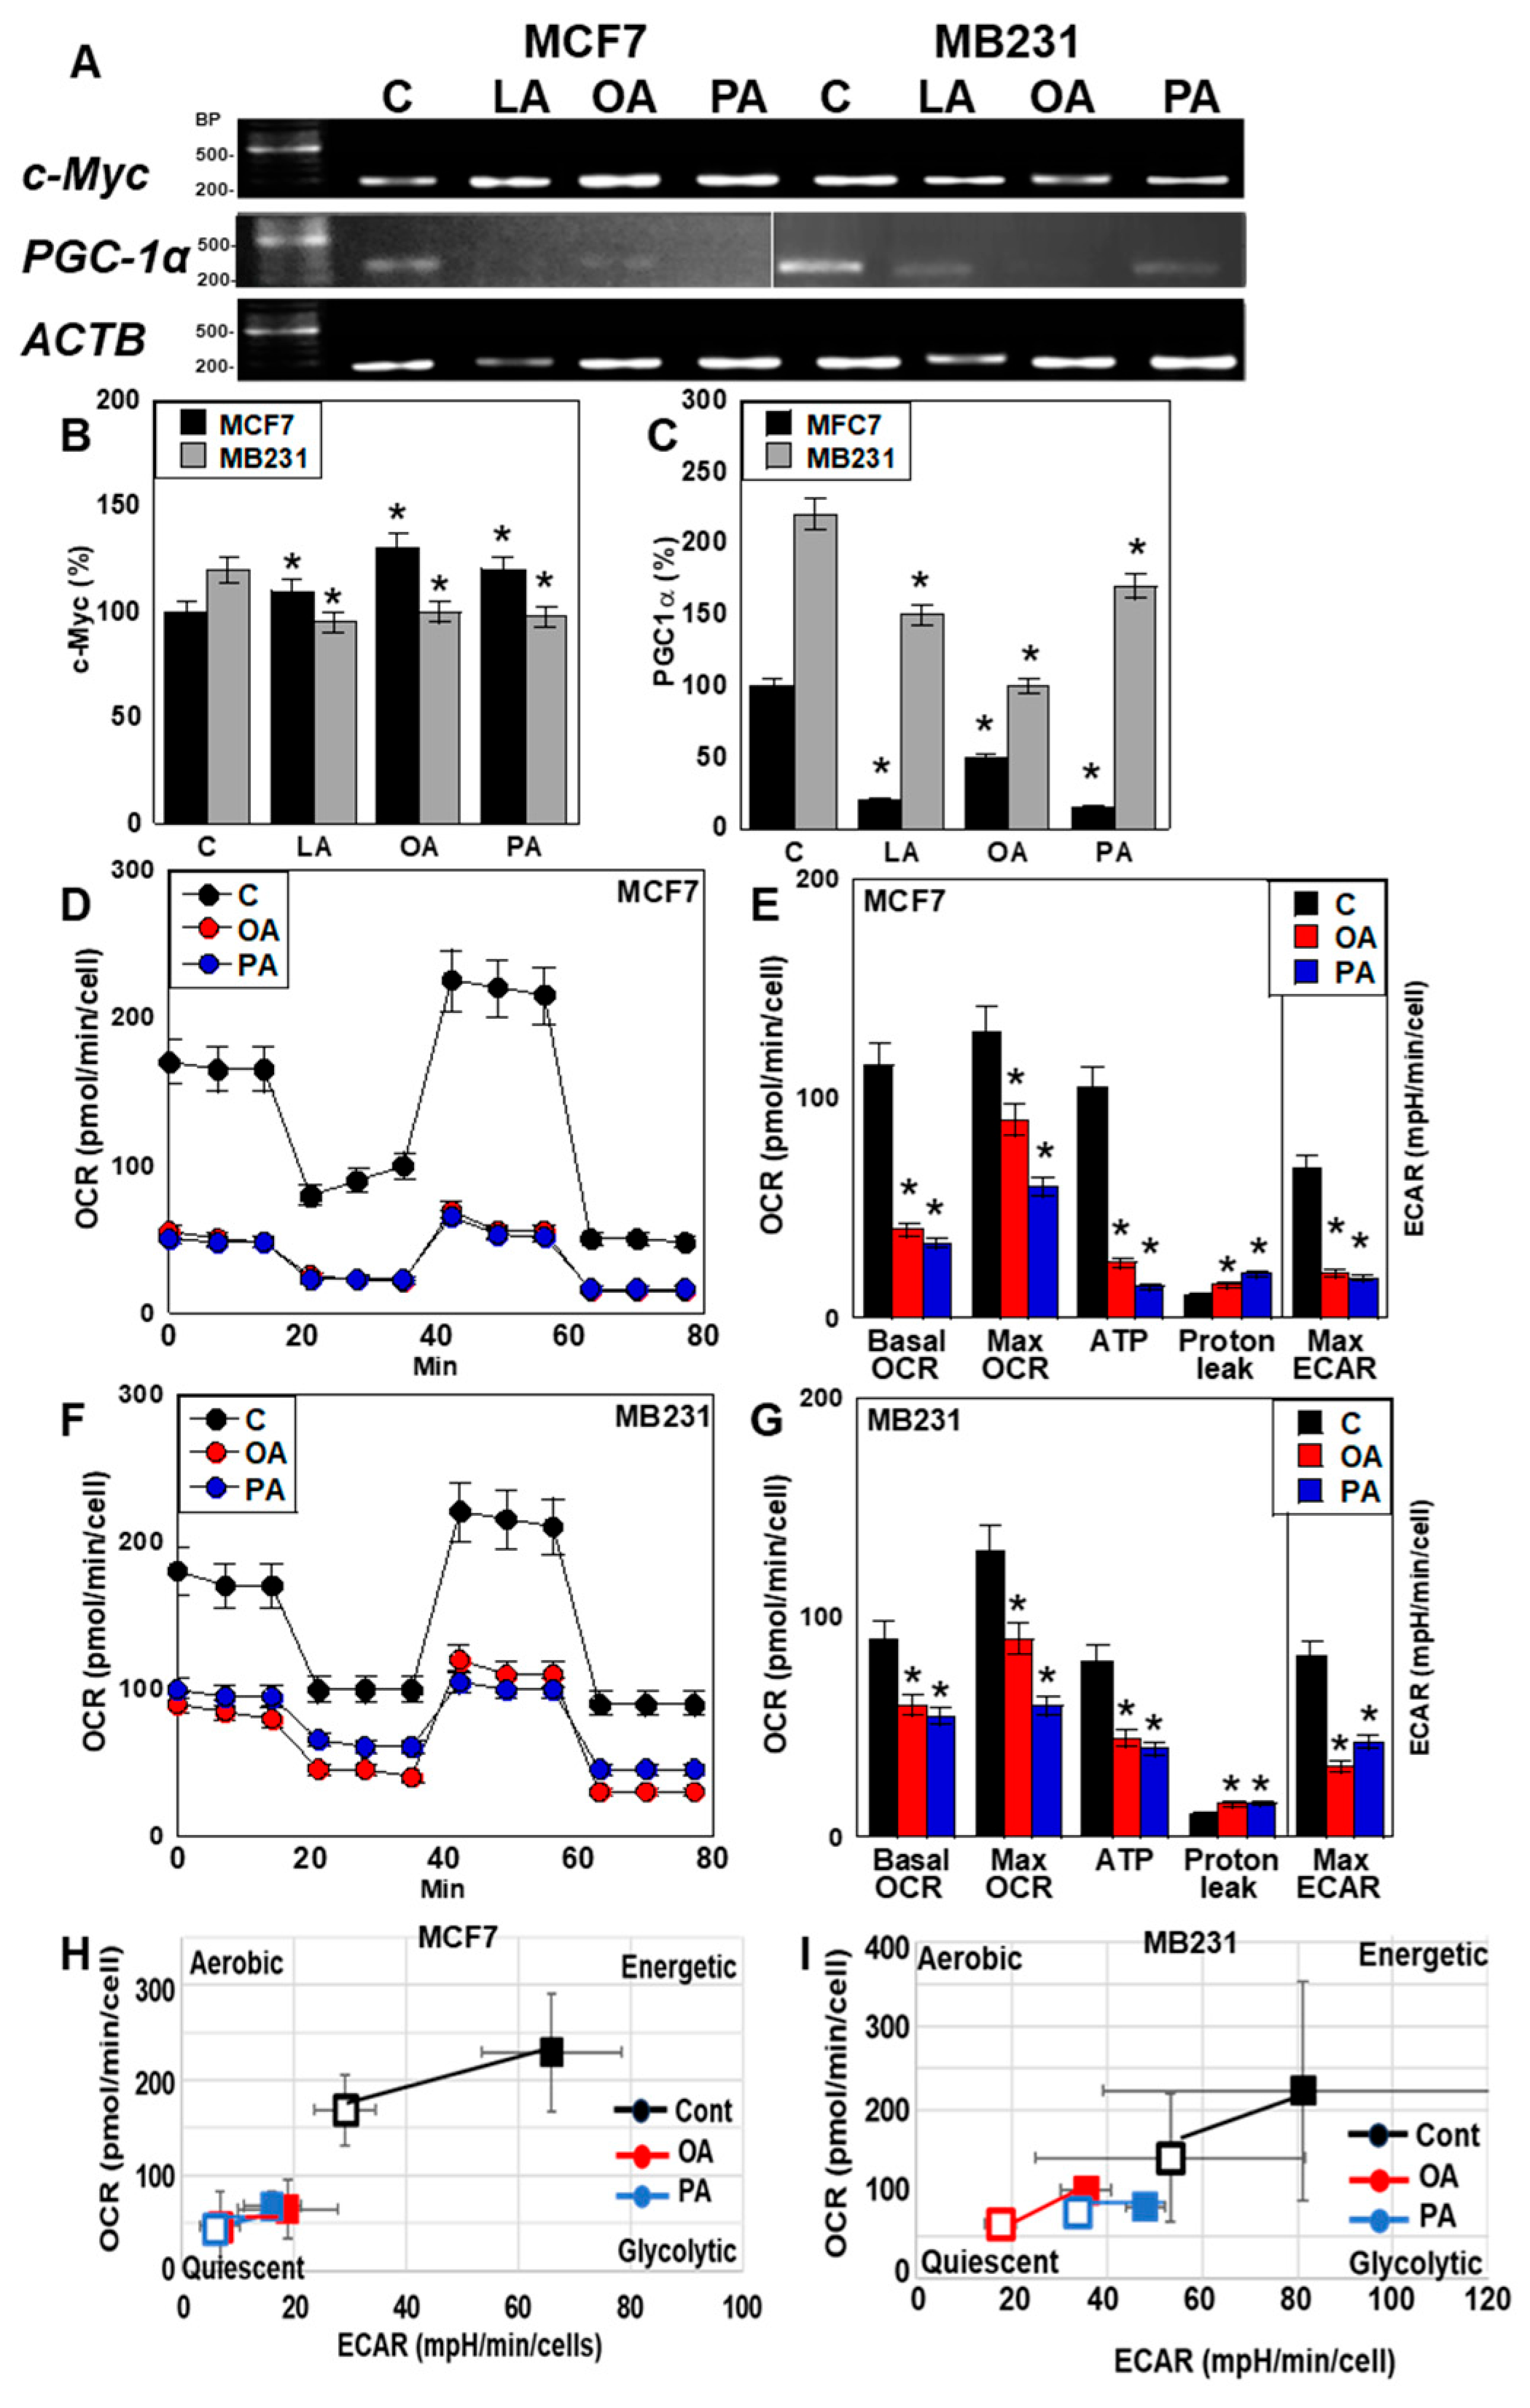
2.4. Effect of LCFAs on Energy Metabolism of BCA Cells

To assess the impact of LCFAs on energy metabolism, we analyzed the expression of peroxisome proliferator-activated receptor gamma coactivator-1α (PGC1α) (oxidative phosphorylation) and c-Myc (glycolysis). In MCF7 cells, c-Myc expression was increased by all the LCFAs, whereas in MB231 cells, it was decreased by them (Figure 4A,B). On the other hand, PGC1α expression was suppressed by all LCFAs in both MCF7 and MB231 cells (Figure 4A,C). Subsequent flux analysis showed that the basal oxygen consumption rate (OCR), maximal OCR, and ATP production were reduced by all fatty acids in both cell lines. In contrast, the maximal extracellular acidification rate (ECAR) increased in MCF7 cells but decreased in MB231 cells (Figure 4D–G). These results indicated that LCFAs shift energy metabolism toward a glycolytic phenotype in MCF7 cells, whereas they induce a quiescent state in MB231 cells (Figure 4H,I).

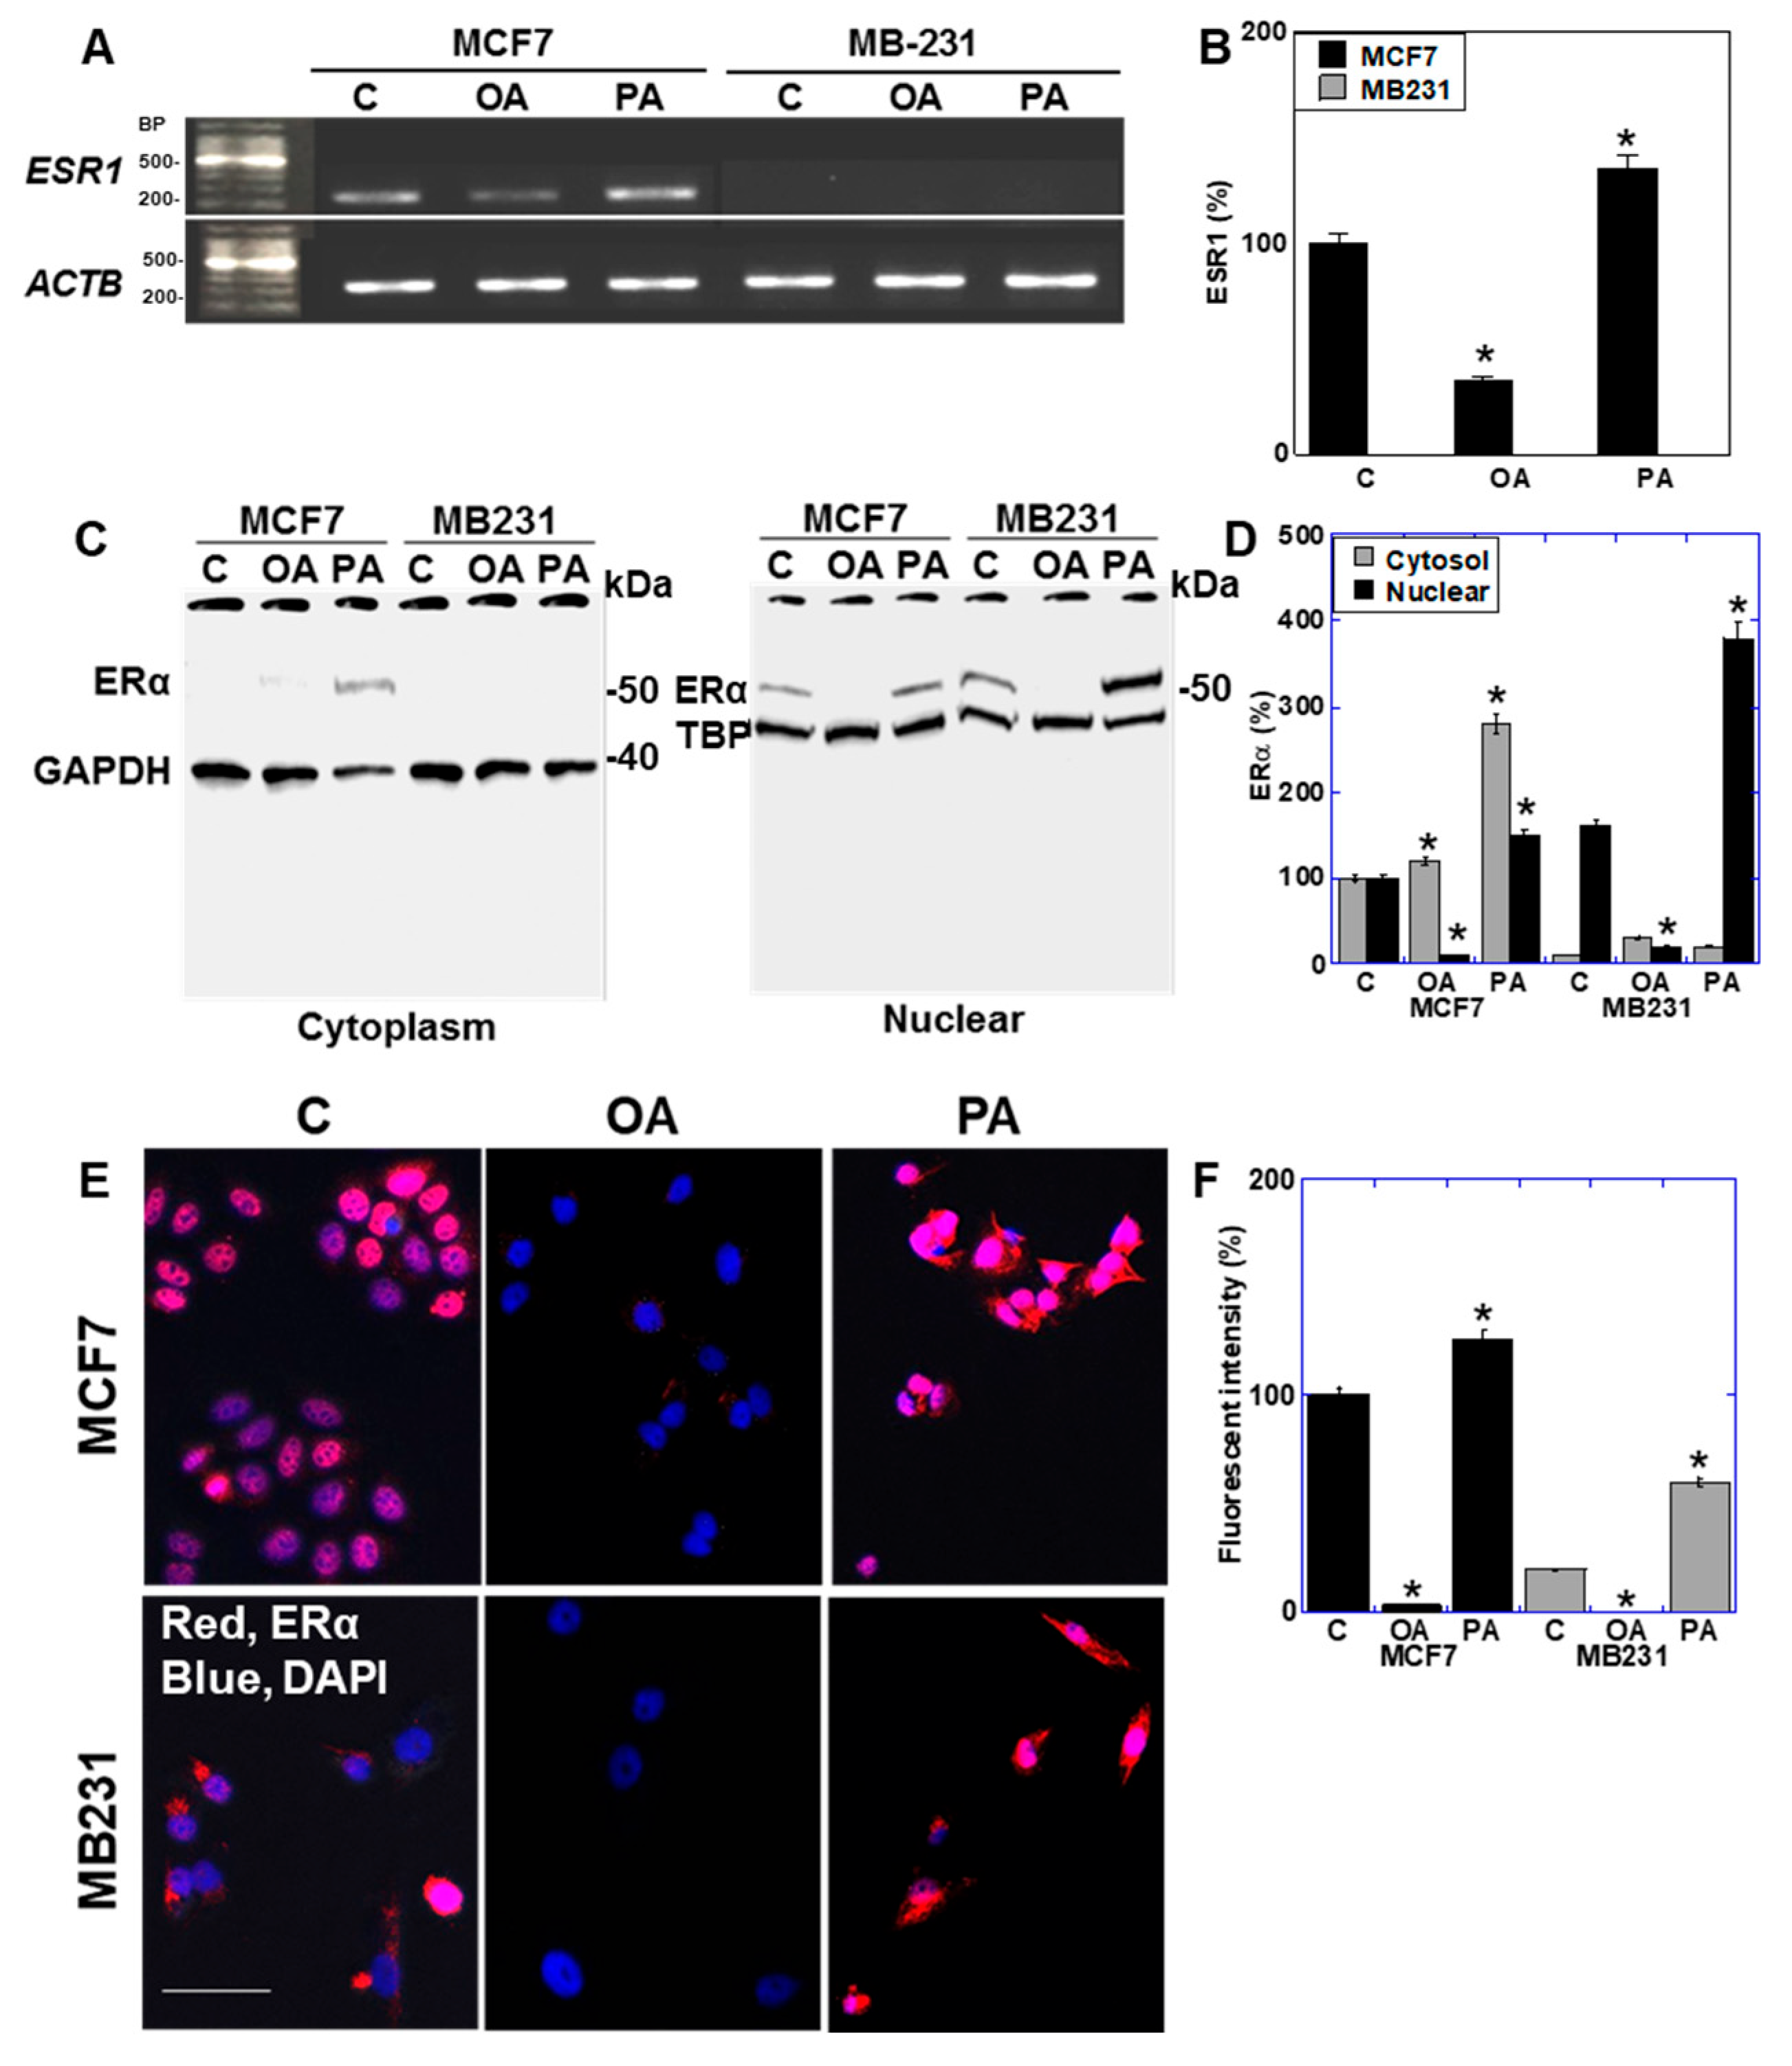
2.5. Effect of LCFAs on Expression of Estrogen Receptor in BCA Cells

In the luminal-type BCA cell line MCF7, the ER protein was expressed at low levels in the cytoplasm and high levels in the nucleus. Interestingly, treatment with OA led to the disappearance of the nuclear ER protein. In contrast, PA increased ER protein levels in both the cytoplasm and nucleus.
In MCF7 cells, OA reduced ESR1 gene expression. In contrast, in the basal-like TNBC cell line, MB231 showed undetectable expression of ESR in the control and in cells treated with OA or PA (Figure 5A,B). In MB231, ER protein expression was minimal in the cytoplasm; however, nuclear expression was observed, even under control conditions. This nuclear expression was almost completely lost with OA treatment but markedly increased with PA treatment (Figure 5C,D). Fluorescent immunostaining confirmed that nuclear ER expression, as indicated by the co-localization of ER staining with DAPI-stained nuclei, was nearly absent in OA cells and increased with PA in both cell lines (Figure 5E,F). These findings clearly demonstrated that nuclear ER protein levels decreased with OA and increased with PA.

2.6. Function of ER Expressed in BCA Cells
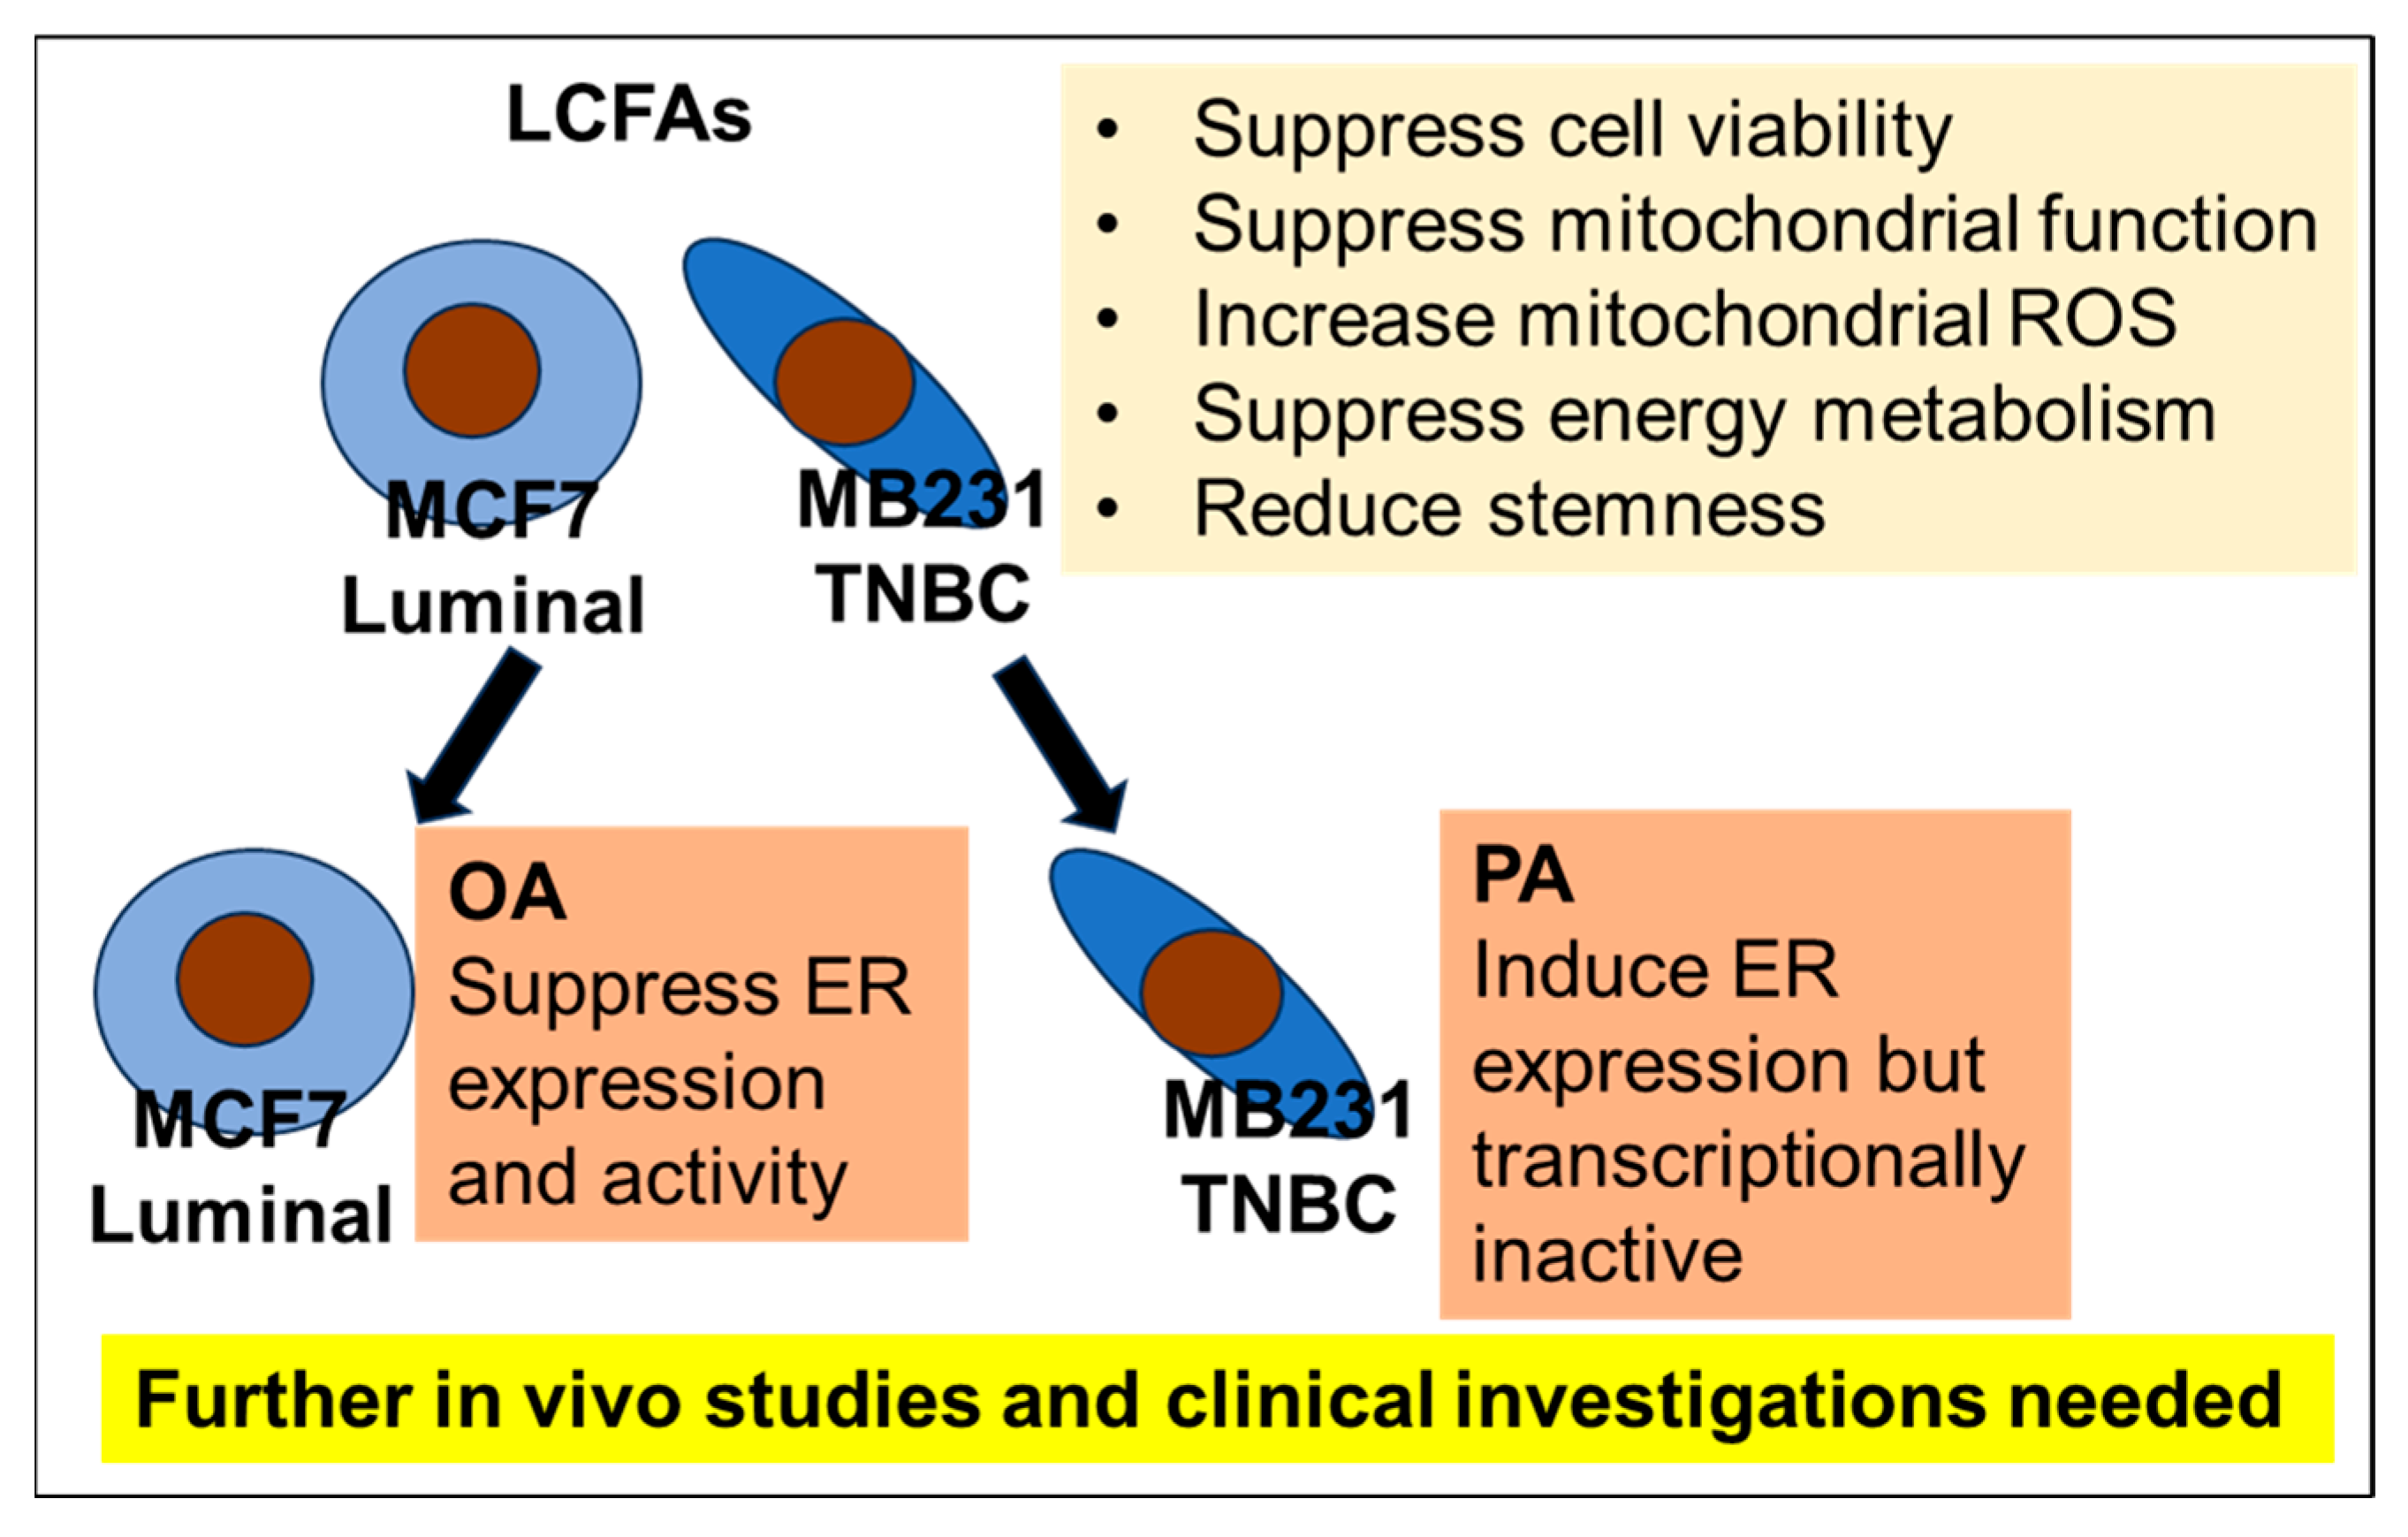
Next, we investigated the function of ER expression in BCA cells. First, we examined responses to estradiol (E2) and tamoxifen (TAM) (Figure 6A,B). In MCF7 cells, E2 enhanced cell viability under control conditions; however, this effect was abolished by co-treatment with TAM (Figure 6A). When treated with OA, MCF7 cell viability was reduced in comparison with the untreated control. Moreover, compared with the untreated control, OA did not significantly alter the effects of E2, TAM, or E2 + TAM, suggesting that suppression of ER expression by OA reduced responsiveness to E2 and TAM. In contrast, MB231 cells showed no response to either E2 or TAM under control conditions. Although PA induced ER expression in MB231 cells, these cells exhibited a reduced or no response to E2 or TAM (Figure 6B).
Next, we examined the expression of ER target genes such as progesterone receptor (PgR) and trefoil factor 1 (TFF1). In MCF7 cells, the expression of both genes was decreased by OA treatment, but it was unchanged by PA. In MB231 cells, the expression levels of both genes remained low with no significant changes (Figure 6C). We also assessed the expression of the ER target gene B-cell/CLL lymphoma 2 (BCL2), which promotes BCA cell survival, and PI3K, an ER-interacting factor. In MCF7 cells, both genes were down-regulated by OA, whereas no changes were observed in MB231 cells. Conversely, PA did not affect their expression in MCF7 cells but significantly reduced their expression in MB231 cells (Figure 6D). The expression of the master regulator of mammary differentiation, GATA3, remained unchanged by both OA and PA in both cell lines (Figure 6E). These findings suggest that, in MCF7 cells, OA suppresses ER expression along with its downstream targets, whereas in MB231 cells, although ER expression is induced by PA, its target genes remain unchanged, indicating that ER is functionally inactive.
We further hypothesized that these changes in gene expression may be mediated by miRNAs and analyzed the expression of miRNAs known to affect the ER [43,44,45,46,47,48,49,50]. In MCF7 cells, OA treatment increased the levels of miR-22 and miR-221, both of which suppressed ER expression. The expression of the anti-apoptotic miRNA miR-21 was also upregulated (Figure 6F). In MB231, OA induced minimal changes in microRNA expression. In contrast, PA treatment increased the levels of ER-suppressive miRNAs miR-22, miR-206, and miR-221 (ER-suppressive miRNAs), whereas miR-200 was downregulated (Figure 6G). Notably, miR-34a, which promotes ER expression, was markedly upregulated, and miR-21 was downregulated. In MCF7, PA had little effect on microRNA expression. To clarify the role of miR-34a in PA-induced ER expression in MB231 cells, we examined the effects of an miR-34a inhibitor. miR-34a inhibition suppressed the PA-induced ERα expression (Figure 6H). Additionally, inhibition of miR-22 and miR-221 alleviated the OA-induced suppression of ER expression in MCF7 cells (Figure 6I).
These findings suggest that coordinated changes in microRNAs contribute to OA-induced ER suppression in MCF7 cells and PA-induced ER expression and apoptosis enhancement in MB231 cells.

3. Discussion

In this study, we investigated the effects of five types of LCFAs on BCA cell lines and found that all LCFAs induced dose-dependent inhibition of cell proliferation in both MCF7 and MB231 cells. In BCA, lipid metabolism has been shown to have a strong influence on its malignancy and prognosis [51]. The investigation of the effects of fatty acids on BCA, especially TNBC, is relevant. Notably, OA and PA suppressed mitochondrial function, increased reactive oxygen species (ROS) production, and inhibited energy metabolism, resulting in a shift toward a quiescent phenotype (Table 1). Additionally, suppression of stemness and the epithelial–mesenchymal transition (EMT) was observed. Interestingly, PA induced nuclear ERα expression in MB231 cells—a TNBC cell line—although the receptor appeared to be non-functional. In contrast, OA reduced ERα expression in MCF7 cells, representative of the luminal subtype.
One of the most intriguing findings of this study was the induction of ERα expression by PA in TNBC cells. In luminal-type BCA, ERα is a central driver of tumor proliferation. Previous studies have suggested that PA may influence ERα expression through the induction of cellular stress, including endoplasmic reticulum stress [52,53,54], as well as through epigenetic modifications [55]. In our experiments, PA upregulated ERα protein expression but not mRNA and promoted nuclear translocation of the ERα protein in MB231 cells, a TNBC model. This discrepancy between mRNA and protein may reflect the truncated form of the ERα protein. Although Δ7 ERα has a molecular weight similar to that of normal ERα, it may not be detectable by PCR primers for normal ERα [56]. Δ7 ERα does not exhibit normal receptor activity [57]. Alternatively, even if the ER RNA expression level was undetectable, ER protein accumulation may have occurred because of degradation of ER proteins, which were reduced by inhibition of ubiquitination [58] or enhanced phosphorylation [59]. Although TNBC typically lacks ERα protein expression, the gene itself remains intact; our findings support the notion that its re-expression can be triggered by specific external stimuli [13,60,61]. While the presence or absence of “functionality” is judged solely based on changes in the expression of ER target genes, the direct measurement of transcriptional activity, the confirmation of ER-DNA binding by chromatin immunoprecipitation, and a comprehensive analysis of ER-dependent transcriptional networks have not been performed, so the determination of whether the ER is truly non-functional is limited. Moreover, changes in ERα mRNA and protein expression due to OA and PA have been reported, but direct epigenetic analysis of DNA methylation, histone modification, chromatin accessibility, etc., has not been performed. Although hypotheses have been presented regarding post-translational regulation by endoplasmic reticulum stress and ubiquitination, no experimental data have been presented.
We focused on miRNAs as the potential mechanism underlying this effect. Several microRNAs, including miR-22, miR-206, and miR-221/222, have been reported to suppress ER expression [43,44,45,46,47,48,49], and PA has been shown to further promote the expression of miR-22 and miR-206 [62,63]. In our study, we also observed the upregulation of miR-22, miR-206, and miR-221 following PA treatment. However, PA suppressed miR-200 expression. Reports have demonstrated that PA enhances miR-221/222 expression in hepatocytes and retinal pigment epithelial cells [64,65], suggesting that these microRNAs may indirectly contribute to ERα suppression in TNBC.
In contrast, the expression of miR-34a—known to promote ERα expression [50]—was elevated beyond that of the aforementioned microRNAs. PA-induced upregulation of miR-34a has been previously reported in pancreatic β-cells and hepatocellular carcinoma cells [66,67], suggesting that a similar regulatory response may occur in MB231 cells. However, miR-34a is also known to promote stemness and EMT in TNBC [68]. In our study, treatment with a miR-34a inhibitor suppressed PA-induced ERα expression, supporting the role of miR-34a in PA-mediated upregulation of ERα. These findings suggest that, in this context, the opposing effects of various microRNAs were balanced in a manner that ultimately favored ERα induction. Furthermore, PA may promote chromatin reopening at the ESR1 locus and enhance gene expression through the activation of peroxisome proliferator-activated receptor (PPAR) γ, accompanied by histone acetylation and recruitment of coactivators such as steroid receptor coactivator-1 (SRC-1) and the cAMP response element-binding protein (CREB)-binding protein (CBP) [69,70]. In addition, PA has been reported to facilitate nuclear translocation of the ERα protein via the activation of the extracellular signal-regulated kinase (ERK) and PI3K/AKT pathways [71]. The lncRNA LYPLAL1-DT suppresses the β-catenin/WNT system and acts as a tumor suppressor, and this lncRNA is induced by FOXO1 [72]. Interestingly, PA suppresses FOXO1 expression [73], which suggests that PA promotes the malignancy of TNBC. However, these mechanisms warrant further investigation in future studies.
One finding of potentially greater clinical significance was the OA-induced loss of ER expression in MCF7 cells. LCFAs such as OA have been reported to reduce ERα mRNA and protein levels, suggesting that the metabolic environment may reprogram hormone sensitivity through epigenetic modifications [74,75]. One proposed mechanism is that OA suppresses protein translation via the endoplasmic reticulum stress response, potentially inhibiting ERα protein synthesis [76,77]. Additionally, OA has been shown to promote ubiquitination and proteasomal degradation of ERα, leading to decreased protein stability [78,79].
Consistent with these mechanisms, our data showed that OA treatment led to a reduction in both ERα mRNA and protein levels. Based on this observation, we examined the involvement of microRNAs and found that OA upregulated the expression of miR-22 [43,80,81,82] and miR-221 [80,82], both known to suppress ERα expression. Moreover, the OA-induced downregulation of ERα was alleviated by treatment with inhibitors of miR-22 and miR-221, supporting their role in mediating OA-driven ER suppression. At the transcriptional level, OA has also been suggested to suppress ESR1 expression through the activation of peroxisome proliferator-activated receptors (PPARs), particularly PPARα and PPARγ [83].
In this study, we examined the effects of five long-chain fatty acids (LCFAs) on breast cancer (BCA) cells. These LCFAs represent structurally diverse categories, including ω-6, ω-3, saturated, and trans fatty acids. Despite their structural differences, all LCFAs induced mitochondrial dysfunction to varying degrees, as evidenced by decreased mitochondrial membrane potential, reduced mitochondrial mass, increased mitochondrial ROS, and the suppression of energy metabolism. These mitochondrial impairments appear to drive a shift toward a quiescent phenotype, thereby contributing to the suppression of cell proliferation. LA and OA, in particular, led to reduced stemness and enhanced cellular differentiation. Notably, the transition to a quiescent state has been reported to confer chemoresistance in pancreatic cancer cells [84,85]. On the other hand, the suppression of stemness and the promotion of differentiation may instead contribute to reduced metastatic potential and resistance to anticancer drugs [86,87]. Interestingly, the triple-negative breast cancer cell line MB231 exhibited greater resistance to the viability–inhibitory effects of LCFAs compared to luminal-type MCF7 cells, and EA even showed a slight viability-promoting effect in MB231. These findings suggest that LCFAs exert complex and potentially bidirectional effects on BCA cells, with both suppressive and promotive actions depending on the cellular context. Because of their hydrophobic nature, LCFAs can also be readily inserted into the inner mitochondrial membrane, altering membrane fluidity and increasing proton leakage via changes in membrane properties [88]. Consistent with this, our data also demonstrated an increase in proton leakage. LCFA-induced cardiolipin oxidation disrupts respiratory chain function and promotes apoptosis [89]. In addition, LCFAs may enhance mitochondrial ROS production, impair oxidative protein folding in the endoplasmic reticulum, and trigger ER stress.
Our findings suggest that fatty acids modulate the expression profile of BCA cells. Hormone therapy is a key standard treatment for luminal-type BCAs [90], which fundamentally depend on the sustained expression of ER in BCA cells. Our results suggest that OA may suppress ER expression, potentially reducing the responsiveness to hormone therapy. OA is a major component of olive oil, comprising over 70% of its content, and is a central component of the Mediterranean diet. OA has been shown to exert beneficial effects, such as anti-inflammatory actions, through various mechanisms, including the activation of sirtuin 1 and PPARα via its metabolite oleoylethanolamide [91]. While the Mediterranean diet has demonstrated a preventive effect against BCA incidence [92], its role in reducing recurrence remains unclear [93]. Further research is needed to clarify the relationship between dietary OA intake and the efficacy of hormone therapy in BCA treatment.
On the other hand, the induction of ER expression by PA in TNBC suggests a potential “luminalization” of TNBC, which could broaden therapeutic strategies. However, in our study, the ER induced in MB231 cells was non-functional. ER dysfunction in TNBC is not solely due to the loss of ER expression but may also result from defects in downstream signaling pathways and the suppression of GATA3, a key regulator of luminal differentiation. ER exerts transcriptional activity through complex formation with coactivators such as SRC-1, SRC-3, and CBP/p300; however, in TNBC, the expression of these coactivators is significantly reduced, making it difficult to restore functional signaling even when ER is re-expressed [94]. Furthermore, ER target genes are often epigenetically repressed in TNBC, further impairing signal transduction [95]. GATA3 plays a critical role in maintaining the luminal lineage of mammary epithelial cells and luminal-type BCA [96,97]. In TNBC—especially in the basal-like subtype—GATA3 expression is frequently diminished or lost, contributing to a breakdown of the luminal phenotype and the acquisition of undifferentiated, mesenchymal-like features [98,99,100]. In our study, PA did not induce GATA3 expression in MB231 cells. Although forced GATA3 expression has been reported to reduce the malignant phenotype of TNBC, it does not result in the full acquisition of a luminal phenotype [101]. These findings underscore that substantial barriers remain in achieving effective luminalization of TNBC. Further investigation is warranted.
This study relied on only two cell lines, MCF7 (luminal) and MB231 (TNBC, basal-like), and did not evaluate the effects of LCFAs on other breast cancer subtypes (e.g., HER2-positive, luminal B, other TNBC lines). Without validation in in vivo systems such as mouse models or patient-derived tissues, it is unclear whether the observed molecular changes also occur in a real tumor environment. Indeed, mouse BCA models or human BCAs show pro-metastatic ability of LCFAs in cancer cells [102,103,104]. Finally, although the clinical implications of OA and PA were discussed in the context of hormone therapy and dietary patterns, such interpretations must be made with caution. Dietary OA intake or supplementation cannot yet be linked to treatment outcomes without robust clinical or epidemiological validation.

4. Materials and Methods

4.1. Cell Lines

The human BCA cell lines MCF7 (CVCL_0031) and MB231 (CVCL_0062) were purchased from Dainihon Pharmaceutical Co. (Tokyo, Japan). Cells were cultured in phenol red-free Dulbecco’s Modified Eagle Medium (DMEM) supplemented with 10% charcoal-stripped fetal bovine serum (FBS; Sigma Chemical Co., St. Louis, MO, USA) at 37 °C in a humidified atmosphere containing 5% CO2. LA, EA, OA, PA, and LNA (Wako Pure Chemical Corporation, Osaka, Japan) were used at a concentration of 50 μM for 48 h. LCFAs were dissolved in 70% ethanol and then added to the culture medium to reach the desired concentration. 17β-estradiol (E2; 10 μM) and TAM (1 μM), also purchased from Wako Pure Chemical Corporation, were used for 48 h treatments.

4.2. MTS [3-(4,5-Dimethylthiazol-2-yl)-5-(3-Carboxymethoxyphenyl)-2-(4-Sulfophenyl)-2H-Tetrazolium] Assay

MTS assays were performed using the CellTiter 96 aqueous one-solution cell proliferation assay kit (Promega Biosciences Inc., San Luis, CA, USA). The plates were read using a Multiskan FC (Thermo Fisher Scientific, Waltham, MA, USA) microplate photometer at a wavelength of 490 nm. The MTS value of cells cultured with the control oligonucleotide was used as the control.

4.3. Mitochondrial Imaging

Mitochondrial function was assessed using fluorescent probes. After treatment with or without LCFAs (50 μM), cells were incubated with the respective probes for 30 min at 37 °C, then imaged using an all-in-one fluorescence microscope (BZ-X710 microscope, Keyence, Osaka, Japan). A total of 1000 cells were observed using a 40× objective with 20 fields of view. Fluorescent intensities were represented as relative values. We used DHR123 (100 μM, Dojindo, Kumamoto, Japan) to measure mitochondrial H2O2, MitoSOX (mitochondrial superoxide) (10 μM, AAT Bioquest Inc., Sunnyvale, CA, USA) to assess oxidative stress, mitoGreen (100 nM, PromoCell GmbH, Heidelberg, Germany) to assess mitochondrial volume, and TMRE (200 nM, Sigma-Aldrich, St. Louis, MO, USA) to assess mitochondrial membrane potential in accordance with the manufacturer’s instructions.

4.4. Reverse Transcription Polymerase Chain Reaction (RT-PCR)

To assess human and murine mRNA expression, RT-PCR was performed using 0.5 μg of total RNA extracted from the three cell lines with the RNeasy Kit (Qiagen, Germantown, MD, USA). Primer sets (listed in Table 2) were synthesized by Sigma Genosys (Ishikari, Japan). PCR products were separated on a 2% agarose gel and stained with ethidium bromide. β-actin mRNA was amplified as an internal control. The signals with ethidium bromide staining were quantified using the NIH ImageJ software (version 1.52, Bethesda, MD, USA). Signals are normalized to ACTB expression and expressed as 100% relative to the MCF7 control.

4.5. Sphere Assay

Cells (1000 cells/well) were seeded into uncoated bacteriological 35 mm dishes (Corning Inc., Corning, NY, USA) using 3D Tumorsphere Medium XF (Sigma-Aldrich). Cells were cultured with or without LCFAs (50 μM). After 7 d, sphere images were captured digitally, and sphere numbers were quantified using the NIH ImageJ software (version 1.52, Bethesda, MD, USA). The number of spheres was counted manually, with a size cutoff of 50 μm.

4.6. Protein Extraction

Protein was extracted from BCA cells following our previously reported protocol [105]. Whole-cell lysates were prepared using RIPA buffer supplemented with 0.1% sodium dodecyl sulfate (SDS) (Thermo Fisher Scientific, Tokyo, Japan), as described previously. Subcellular fractions were obtained using the Cell Fractionation Kit (Abcam, Cambridge, UK) according to the manufacturer’s instructions. Protein concentrations were measured using the Protein Assay Rapid Kit (Wako, Osaka, Japan).

4.7. Immunoblot Analysis

Cell lysates were separated by 10% SDS–polyacrylamide gel electrophoresis and transferred onto nitrocellulose membranes. Membranes were incubated with the anti-ERα primary antibody, followed by the peroxidase-conjugated IgG secondary antibody (P0217; Dako, Glostrup Municipality, Denmark). Immune complexes were visualized using the Fusion Solo S imaging system (M&S Instruments Inc., Osaka, Japan). Band images were captured digitally, and band intensities were quantified using the NIH ImageJ software (version 1.52, Bethesda, MD, USA).

4.8. Immunocytochemistry

BCA cells were cultured on chamber slides with or without OA (50 µM) or PA (50 µM) for 48 h. Cells were fixed with 4% paraformaldehyde in phosphate-buffered saline (PBS) for 15 min at room temperature and washed with PBS. Permeabilization was performed using 0.2% Triton X-100 in PBS for 10 min at room temperature. Cells were then incubated with the anti-ERα antibody (SP1, Alexa Fluor 555-labeled, 1:100 dilution, ab282199, Abcam) for 4 h at room temperature, followed by DAPI staining (1 μg/mL; Dojindo, Kumamoto, Japan) for 5 min. Fluorescence imaging was performed using a BZ-X710 microscope (Keyence, Osaka, Japan). For ER expression, 1000 cells were observed using a 40×objective with 20 fields of view. The fluorescence intensity is shown relatively, and the positive rate was not defined.

4.9. Mitochondrial Stress Test (Seahorse Assay)

Mitochondrial respiration and ATP production were analyzed using the Seahorse XF Analyzer (Agilent Technologies, Santa Clara, CA, USA) to measure the extracellular flux in live cells. Following 48 h of LCFA treatment (50 μM), cells were seeded into XF plates at a density of 2 × 10⁴ cells/well and incubated overnight. One hour before the assay, the medium in the XF plate was replaced with Seahorse XF DMEM (Agilent Technologies, Santa Clara, CA, USA). The Mito Stress Test (Seahorse XF Cell Mito Stress Test Kit; Agilent Technologies) was performed per the manufacturer’s instructions. The OCR was measured following sequential injections of 2 µM oligomycin, 0.5 µM carbonyl cyanide-p-trifluoromethoxyphenylhydrazone (FCCP), and 0.5 µM rotenone/antimycin A. OCR values were normalized to the total cell number.

4.10. Glycolytic Stress Test

The ECAR of BCA cells was measured using a modified glycolytic stress test with the Seahorse XFe24 Extracellular Flux Analyzer and XF24 FluxPaks (Agilent Technologies). Then, BCA cells were treated with LCFAs (50 μM) 48 h in 6-well plates prior to Seahorse analysis. Cells (1 × 10⁴ cells/well) were then seeded in the XF Base Medium (Agilent Technologies) supplemented with 200 mM L-glutamine and 5 mM HEPES, as recommended by the manufacturer for glycolytic assays. The sensor cartridge was rehydrated the day before the assay by adding 1 mL of the XF Calibrant to each well and incubating at 37 °C until use. The cartridge injection ports were loaded with the following compounds in sequence to achieve the indicated final concentrations: 10 mM glucose, 1 µM oligomycin, a combined injection of 1 µM rotenone, 5 µM antimycin A, and finally 50 mM 2-deoxyglucose. The combined rotenone/antimycin treatment was used to assess the contribution of mitochondrial respiration to ECAR by accounting for respiratory acidification resulting from glycolytic pyruvate entering the TCA cycle.

4.11. Detection of microRNA

Total RNA was extracted using the miRNeasy Kit (Qiagen, Hilden, Germany). Individual microRNAs were quantified using TaqMan MicroRNA Assay Kits, with U6 snRNA used as the internal control.

4.12. Inhibition of microRNA

MicroRNA inhibitors (S-TuD) for miR-34a, miR-21, and miR221 were purchased from WAKO. Cells were treated with each inhibitor at 2 μM for 24 h.

4.13. Statistical Analysis

Statistical significance was determined using analysis of variance (ANOVA) with Bonferroni correction, performed using the InStat software (version 3.0; GraphPad Software, Inc., La Jolla, CA, USA). A p-value of < 0.05 (two-sided) was considered statistically significant.

5. Conclusions

This study demonstrates that long-chain fatty acids (LCFAs) modulate key cellular processes—including mitochondrial function, stemness, and energy metabolism—in breast cancer (BCA) cell lines (Figure 7). Notably, oleic acid (OA) reduced ERα expression and activity in luminal-type MCF-7 cells, suggesting a possible mechanism by which fatty acids could influence hormone responsiveness. Conversely, palmitic acid (PA) upregulated ERα expression in MDA-MB-231 cells, although the receptor remained transcriptionally inactive. While these findings offer novel insights into how fatty acid metabolism may affect hormonal signaling pathways in breast cancer cells, they are based solely on in vitro experiments using two cell lines. Further in vivo studies and clinical investigations will be required to determine the relevance of these mechanisms to patient care and dietary recommendations.

Author Contributions

Study concept and design: R.F.-T. and H.K.; data investigation: R.O., Y.L., R.S., A.I., K.M., and A.S.; data analysis: R.O., Y.L., T.S., K.F., and H.O.; drafting of the manuscript: R.O. and Y.L.; editing of the manuscript: R.F.-T. and H.K. All authors have read and agreed to the published version of the manuscript.

Funding

This work was supported by MEXT KAKENHI Grant Numbers 23K19900 (R.O.), 24K14281 (Y.L.), 25K14462 (R.F.-T.), 23K10481 (H.O.), 21K11223 (K.F.), and 22K11396 (T.S.).

Institutional Review Board Statement

All experimental procedures were performed in accordance with the Ethical Guidelines for Human Genome/Gene Research enacted by the Japanese Government and with the approval of the Ethics Committee of Nara Medical University (approval number: 937, 20 October 2014).

Informed Consent Statement

Not applicable.

Data Availability Statement

Data is contained within the article.

Acknowledgments

The authors thank Tomomi Nitta for expert assistance with the preparation of this manuscript.

Conflicts of Interest

The authors declare no conflicts of interest.

Abbreviation

BCA, breast cancer; ER, estrogen receptor; HER, human epidermal growth factor receptor; ERE, estrogen response element; TNBC, triple-negative breast cancer; GATA3, GATA-binding protein 3; FOXA1, forkhead box protein A1; miRNA, microRNA; LCFA, long-chain fatty acid; PA, palmitic acid; OA, oleic acid; LA, linoleic acid; EA, elaidic acid; LNA, α-linolenic acid; PI3K, phosphatidylinositol 3-kinase; MMP, mitochondrial membrane potential; Oct3, octamer-binding transcription factor 3; PGC1α, peroxisome proliferator-activated receptor gamma coactivator-1α; OCR, oxygen consumption rate; ECAR, extracellular acidification rate; E2, estradiol; TAM, tamoxifen; PgR, progesterone receptor; TFF1, trefoil factor 1; BCXL2, B-cell/CLL lymphoma 2; ROS, reactive oxygen species; EMT, epithelial–mesenchymal transition; PPAR, peroxisome proliferator-activated receptor; SRC, steroid receptor coactivator; CRB, cAMP response element-binding protein; CBP, CREB-binding protein.

References

  1. Sung, H.; Ferlay, J.; Siegel, R.L.; Laversanne, M.; Soerjomataram, I.; Jemal, A.; Bray, F. Global Cancer Statistics 2020: GLOBOCAN Estimates of Incidence and Mortality Worldwide for 36 Cancers in 185 Countries. CA Cancer J. Clin. 2021, 71, 209–249. [Google Scholar] [CrossRef]
  2. Perou, C.M.; Sørlie, T.; Eisen, M.B.; van de Rijn, M.; Jeffrey, S.S.; Rees, C.A.; Pollack, J.R.; Ross, D.T.; Johnsen, H.; Akslen, L.A.; et al. Molecular portraits of human breast tumours. Nature 2000, 406, 747–752. [Google Scholar] [CrossRef] [PubMed]
  3. Reis-Filho, J.S.; Pusztai, L. Gene expression profiling in breast cancer: Classification, prognostication, and prediction. Lancet 2011, 378, 1812–1823. [Google Scholar] [CrossRef]
  4. Prat, A.; Cheang, M.C.; Martín, M.; Parker, J.S.; Carrasco, E.; Caballero, R.; Tyldesley, S.; Gelmon, K.; Bernard, P.S.; Nielsen, T.O.; et al. Prognostic significance of progesterone receptor-positive tumor cells within immunohistochemically defined luminal A breast cancer. J. Clin. Oncol. 2013, 31, 203–209. [Google Scholar] [CrossRef]
  5. Carey, L.A.; Berry, D.A.; Cirrincione, C.T.; Barry, W.T.; Pitcher, B.N.; Harris, L.N.; Ollila, D.W.; Krop, I.E.; Henry, N.L.; Weckstein, D.J.; et al. Molecular Heterogeneity and Response to Neoadjuvant Human Epidermal Growth Factor Receptor 2 Targeting in CALGB 40601, a Randomized Phase III Trial of Paclitaxel Plus Trastuzumab With or Without Lapatinib. J. Clin. Oncol. 2016, 34, 542–549. [Google Scholar] [CrossRef] [PubMed]
  6. Swain, S.M.; Baselga, J.; Kim, S.B.; Ro, J.; Semiglazov, V.; Campone, M.; Ciruelos, E.; Ferrero, J.M.; Schneeweiss, A.; Heeson, S.; et al. Pertuzumab, trastuzumab, and docetaxel in HER2-positive metastatic breast cancer. N. Engl. J. Med. 2015, 372, 724–734. [Google Scholar] [CrossRef]
  7. Schmid, P.; Adams, S.; Rugo, H.S.; Schneeweiss, A.; Barrios, C.H.; Iwata, H.; Diéras, V.; Hegg, R.; Im, S.A.; Shaw Wright, G.; et al. Atezolizumab and Nab-Paclitaxel in Advanced Triple-Negative Breast Cancer. N. Engl. J. Med. 2018, 379, 2108–2121. [Google Scholar] [CrossRef] [PubMed]
  8. Robson, M.; Im, S.A.; Senkus, E.; Xu, B.; Domchek, S.M.; Masuda, N.; Delaloge, S.; Li, W.; Tung, N.; Armstrong, A.; et al. Olaparib for Metastatic Breast Cancer in Patients with a Germline BRCA Mutation. N. Engl. J. Med. 2017, 377, 523–533. [Google Scholar] [CrossRef]
  9. Harkins, B.; Geyer, C.E., Jr. Overcoming treatment challenges in advanced breast cancer. Semin. Oncol. Nurs. 2007, 23 (Suppl. 2), S10–S16. [Google Scholar] [CrossRef]
  10. Gingras, I.; Gebhart, G.; de Azambuja, E.; Piccart-Gebhart, M. HER2-positive breast cancer is lost in translation: Time for patient-centered research. Nat. Rev. Clin. Oncol. 2017, 14, 669–681. [Google Scholar] [CrossRef]
  11. Babina, I.S.; Turner, N.C. Advances and challenges in targeting FGFR signalling in cancer. Nat. Rev. Cancer 2017, 17, 318–332. [Google Scholar] [CrossRef]
  12. Ali, S.; Coombes, R.C. Estrogen receptor alpha in human breast cancer: Occurrence and significance. J. Mammary Gland. Biol. Neoplasia 2000, 5, 271–281. [Google Scholar] [CrossRef] [PubMed]
  13. Traish, A.M.; Newton, A.W.; Styperek, K.; Beazley, R.; Kavanah, M. Estrogen receptor functional status in human breast cancer. Diagn. Mol. Pathol. 1995, 4, 220–228. [Google Scholar] [CrossRef] [PubMed]
  14. Toumba, M.; Kythreotis, A.; Panayiotou, K.; Skordis, N. Estrogen receptor signaling and targets: Bones, breasts and brain (Review). Mol. Med. Rep. 2024, 30, 144. [Google Scholar] [CrossRef] [PubMed]
  15. Cignarella, A.; Boscaro, C.; Albiero, M.; Bolego, C.; Barton, M. Post-Transcriptional and Epigenetic Regulation of Estrogen Signaling. J. Pharmacol. Exp. Ther. 2023, 386, 288–297. [Google Scholar] [CrossRef]
  16. Wu, Y.; Zhang, Z.; Cenciarini, M.E.; Proietti, C.J.; Amasino, M.; Hong, T.; Yang, M.; Liao, Y.; Chiang, H.C.; Kaklamani, V.G.; et al. Tamoxifen Resistance in Breast Cancer Is Regulated by the EZH2-ERα-GREB1 Transcriptional Axis. Cancer Res. 2018, 78, 671–684. [Google Scholar] [CrossRef]
  17. Du, F.; Yuan, P.; Wang, T.; Zhao, J.; Zhao, Z.; Luo, Y.; Xu, B. The Significance and Therapeutic Potential of GATA3 Expression and Mutation in Breast Cancer: A Systematic Review. Med. Res. Rev. 2015, 35, 1300–1315. [Google Scholar] [CrossRef]
  18. Carroll, J.S.; Liu, X.S.; Brodsky, A.S.; Li, W.; Meyer, C.A.; Szary, A.J.; Eeckhoute, J.; Shao, W.; Hestermann, E.V.; Geistlinger, T.R.; et al. Chromosome-wide mapping of estrogen receptor binding reveals long-range regulation requiring the forkhead protein FoxA1. Cell 2005, 122, 33–43. [Google Scholar] [CrossRef]
  19. Theodorou, V.; Stark, R.; Menon, S.; Carroll, J.S. GATA3 acts upstream of FOXA1 in mediating ESR1 binding by shaping enhancer accessibility. Genome Res. 2013, 23, 12–22. [Google Scholar] [CrossRef]
  20. Viedma-Rodríguez, R.; Baiza-Gutman, L.; Salamanca-Gómez, F.; Diaz-Zaragoza, M.; Martínez-Hernández, G.; Ruiz Esparza-Garrido, R.; Velázquez-Flores, M.A.; Arenas-Aranda, D. Mechanisms associated with resistance to tamoxifen in estrogen receptor-positive breast cancer (review). Oncol. Rep. 2014, 32, 3–15. [Google Scholar] [CrossRef]
  21. Adams, B.D.; Guttilla, I.K.; White, B.A. Involvement of microRNAs in breast cancer. Semin. Reprod. Med. 2008, 26, 522–536. [Google Scholar] [CrossRef]
  22. Bird, J.K.; Troesch, B.; Warnke, I.; Calder, P.C. The effect of long chain omega-3 polyunsaturated fatty acids on muscle mass and function in sarcopenia: A scoping systematic review and meta-analysis. Clin. Nutr. ESPEN 2021, 46, 73–86. [Google Scholar] [CrossRef]
  23. Ferraro, G.B.; Ali, A.; Luengo, A.; Kodack, D.P.; Deik, A.; Abbott, K.L.; Bezwada, D.; Blanc, L.; Prideaux, B.; Jin, X.; et al. Fatty Acid Synthesis Is Required for Breast Cancer Brain Metastasis. Nat. Cancer 2021, 2, 414–428. [Google Scholar] [CrossRef] [PubMed]
  24. Rose, D.P.; Rayburn, J.; Hatala, M.A.; Connolly, J.M. Effects of dietary fish oil on fatty acids and eicosanoids in metastasizing human breast cancer cells. Nutr. Cancer 1994, 22, 131–141. [Google Scholar] [CrossRef]
  25. Nieman, K.M.; Kenny, H.A.; Penicka, C.V.; Ladanyi, A.; Buell-Gutbrod, R.; Zillhardt, M.R.; Romero, I.L.; Carey, M.S.; Mills, G.B.; Hotamisligil, G.S.; et al. Adipocytes promote ovarian cancer metastasis and provide energy for rapid tumor growth. Nat. Med. 2011, 17, 1498–1503. [Google Scholar] [CrossRef]
  26. Xia, L.; Zhou, Z.; Chen, X.; Luo, W.; Ding, L.; Xie, H.; Zhuang, W.; Ni, K.; Li, G. Ligand-dependent CD36 functions in cancer progression, metastasis, immune response, and drug resistance. Biomed. Pharmacother. 2023, 168, 115834. [Google Scholar] [CrossRef]
  27. Yang, B.; Ren, X.L.; Wang, Z.Y.; Wang, L.; Zhao, F.; Guo, X.J.; Li, D. Biomarker of long-chain n-3 fatty acid intake and breast cancer: Accumulative evidence from an updated meta-analysis of epidemiological studies. Crit. Rev. Food Sci. Nutr. 2019, 59, 3152–3164. [Google Scholar] [CrossRef] [PubMed]
  28. Cheng, A.M.; Handa, P.; Tateya, S.; Schwartz, J.; Tang, C.; Mitra, P.; Oram, J.F.; Chait, A.; Kim, F. Apolipoprotein A-I attenuates palmitate-mediated NF-κB activation by reducing Toll-like receptor-4 recruitment into lipid rafts. PLoS ONE 2012, 7, e33917. [Google Scholar] [CrossRef] [PubMed]
  29. Rayaprolu, S.J.; Hettiarachchy, N.S.; Horax, R.; Phillips, G.K.; Mahendran, M.; Chen, P. Soybean peptide fractions inhibit human blood, breast and prostate cancer cell proliferation. J. Food Sci. Technol. 2017, 54, 38–44. [Google Scholar] [CrossRef]
  30. Huang, L.H.; Chung, H.Y.; Su, H.M. Docosahexaenoic acid reduces sterol regulatory element binding protein-1 and fatty acid synthase expression and inhibits cell proliferation by inhibiting pAkt signaling in a human breast cancer MCF-7 cell line. BMC Cancer 2017, 17, 890. [Google Scholar] [CrossRef]
  31. Rose, D.P.; Goldman, M.; Connolly, J.M.; Strong, L.E. High-fiber diet reduces serum estrogen concentrations in premenopausal women. Am. J. Clin. Nutr. 1991, 54, 520–525. [Google Scholar] [CrossRef] [PubMed]
  32. Edin, M.L.; Duval, C.; Zhang, G.; Zeldin, D.C. Role of linoleic acid-derived oxylipins in cancer. Cancer Metastasis Rev. 2020, 39, 581–582. [Google Scholar] [CrossRef] [PubMed]
  33. Ogata, R.; Mori, S.; Kishi, S.; Sasaki, R.; Iwata, N.; Ohmori, H.; Sasaki, T.; Nishiguchi, Y.; Nakashima, C.; Goto, K.; et al. Linoleic Acid Upregulates Microrna-494 to Induce Quiescence in Colorectal Cancer. Int. J. Mol. Sci. 2021, 23, 225. [Google Scholar] [CrossRef] [PubMed]
  34. Ogata, R.; Mori, S.; Ohmori, H.; Kishi, S.; Fujiwara-Tani, R.; Sasaki, T.; Nishiguchi, Y.; Nakashima, C.; Goto, K.; Kawahara, I.; et al. Suppressive GLI2 fragment enhances liver metastasis in colorectal cancer. Oncotarget 2022, 13, 122–135. [Google Scholar] [CrossRef]
  35. Ohmori, H.; Sasahira, T.; Fujii, K.; Yi, L.; Shimomoto, T.; Kuniyasu, H. Linoleic-acid-induced growth suppression induces quiescent cancer cell nests in nude mice. Pathobiology 2008, 75, 226–232. [Google Scholar] [CrossRef]
  36. Kawahara, I.; Mori, T.; Goto, K.; Fujii, K.; Ohmori, H.; Kishi, S.; Fujiwara-Tani, R.; Kuniyasu, H. Fatty Acids Induce Stemness in the Stromal Cells of a CT26 Mouse Tumor Model. Pathobiology 2017, 84, 237–242. [Google Scholar] [CrossRef]
  37. Tanabe, E.; Kitayoshi, M.; Fujii, K.; Ohmori, H.; Luo, Y.; Kadochi, Y.; Mori, S.; Fujiwara, R.; Nishiguchi, Y.; Sasaki, T.; et al. Fatty acids inhibit anticancer effects of 5-fluorouracil in mouse cancer cell lines. Oncol. Lett. 2017, 14, 681–686. [Google Scholar] [CrossRef]
  38. Shimomoto, T.; Luo, Y.; Ohmori, H.; Chihara, Y.; Fujii, K.; Sasahira, T.; Denda, A.; Kuniyasu, H. Advanced glycation end products (AGE) induce the receptor for AGE in the colonic mucosa of azoxymethane-injected Fischer 344 rats fed with a high-linoleic acid and high-glucose diet. J. Gastroenterol. 2012, 47, 1073–1083. [Google Scholar] [CrossRef]
  39. Carracedo, A.; Cantley, L.C.; Pandolfi, P.P. Cancer metabolism: Fatty acid oxidation in the limelight. Nat. Rev. Cancer 2013, 13, 227–232. [Google Scholar] [CrossRef]
  40. Cheng, C.F.; Ku, H.C.; Lin, H. PGC-1α as a Pivotal Factor in Lipid and Metabolic Regulation. Int. J. Mol. Sci. 2018, 19, 3447. [Google Scholar] [CrossRef]
  41. He, Q.; Chen, Y.; Wang, Z.; He, H.; Yu, P. Cellular Uptake, Metabolism and Sensing of Long-Chain Fatty Acids. Front. Biosci. (Landmark Ed.) 2023, 28, 10. [Google Scholar] [CrossRef] [PubMed]
  42. Kawasaki, H.; Ogura, H.; Arai, Y.; Baba, S.; Kosugi, I.; Tsutsui, Y.; Iwashita, T. Aggressive progression of breast cancer with microscopic pulmonary emboli possessing a stem cell-like phenotype independent of its origin. Pathol. Int. 2010, 60, 228–234. [Google Scholar] [CrossRef]
  43. Xiong, J.; Yu, D.; Wei, N.; Fu, H.; Cai, T.; Huang, Y.; Wu, C.; Zheng, X.; Du, Q.; Lin, D.; et al. An estrogen receptor alpha suppressor, microRNA-22, is downregulated in estrogen receptor alpha-positive human breast cancer cell lines and clinical samples. FEBS J. 2010, 277, 1684–1694. [Google Scholar] [CrossRef] [PubMed]
  44. Di Leva, G.; Gasparini, P.; Piovan, C.; Ngankeu, A.; Garofalo, M.; Taccioli, C.; Iorio, M.V.; Li, M.; Volinia, S.; Alder, H.; et al. MicroRNA cluster 221-222 and estrogen receptor alpha interactions in breast cancer. J. Natl. Cancer Inst. 2010, 102, 706–721. [Google Scholar] [CrossRef]
  45. Vesuna, F.; Lisok, A.; van Diest, P.; Raman, V. Twist activates miR-22 to suppress estrogen receptor alpha in breast cancer. Mol. Cell Biochem. 2021, 476, 2295–2306. [Google Scholar] [CrossRef] [PubMed]
  46. Kondo, N.; Toyama, T.; Sugiura, H.; Fujii, Y.; Yamashita, H. miR-206 Expression is down-regulated in estrogen receptor alpha-positive human breast cancer. Cancer Res. 2008, 68, 5004–5008. [Google Scholar] [CrossRef]
  47. Chakkaravarthi, K.; Ramesh, R.; Palaniyandi, T.; Baskar, G.; Viswanathan, S.; Wahab, M.R.A.; Surendran, H.; Ravi, M.; Sivaji, A. Prospectives of mirna gene signaling pathway in triple-negative breast cancer. Pathol. Res. Pract. 2023, 248, 154658. [Google Scholar] [CrossRef]
  48. Shao, X.; Huang, P.; Shi, L.; Lei, L.; Cao, W.; Chen, Z.; Wang, X.; Zheng, Y. MicroRNA and LncRNA Expression Profiles in Human Estrogen Receptor Positive Breast Cancer. Clin. Lab. 2019, 65, 7. [Google Scholar] [CrossRef]
  49. Adams, B.D.; Furneaux, H.; White, B.A. The micro-ribonucleic acid (miRNA) miR-206 targets the human estrogen receptor-alpha (ERalpha) and represses ERalpha messenger RNA and protein expression in breast cancer cell lines. Mol. Endocrinol. 2007, 21, 1132–1147. [Google Scholar] [CrossRef]
  50. Endo, Y.; Toyama, T.; Takahashi, S.; Yoshimoto, N.; Iwasa, M.; Asano, T.; Fujii, Y.; Yamashita, H. miR-1290 and its potential targets are associated with characteristics of estrogen receptor α-positive breast cancer. Endocr. Relat. Cancer 2013, 20, 91–102. [Google Scholar] [CrossRef]
  51. Tang, Y.; Tian, W.; Xie, J.; Zou, Y.; Wang, Z.; Li, N.; Zeng, Y.; Wu, L.; Zhang, Y.; Wu, S.; et al. Prognosis and Dissection of Immunosuppressive Microenvironment in Breast Cancer Based on Fatty Acid Metabolism-Related Signature. Front. Immunol. 2022, 31, 843515. [Google Scholar] [CrossRef]
  52. Palomer, X.; Pizarro-Delgado, J.; Barroso, E.; Vázquez-Carrera, M. Palmitic and Oleic Acid: The Yin and Yang of Fatty Acids in Type 2 Diabetes Mellitus. Trends Endocrinol. Metab. 2018, 29, 178–190. [Google Scholar] [CrossRef] [PubMed]
  53. Khoi, C.S.; Lin, T.Y.; Chiang, C.K. Targeting Insulin Resistance, Reactive Oxygen Species, Inflammation, Programmed Cell Death, ER Stress, and Mitochondrial Dysfunction for the Therapeutic Prevention of Free Fatty Acid-Induced Vascular Endothelial Lipotoxicity. Antioxidants 2024, 13, 1486. [Google Scholar] [CrossRef]
  54. Mondal, A.; Burchat, N.; Sampath, H. Palmitate exacerbates bisphenol A toxicity via induction of ER stress and mitochondrial dysfunction. Biochim. Biophys. Acta Mol. Cell Biol. Lipids 2021, 1866, 158816. [Google Scholar] [CrossRef]
  55. González-Becerra, K.; Ramos-Lopez, O.; Barrón-Cabrera, E.; Riezu-Boj, J.I.; Milagro, F.I.; Martínez-López, E.; Martínez, J.A. Fatty acids, epigenetic mechanisms and chronic diseases: A systematic review. Lipids Health Dis. 2019, 18, 178. [Google Scholar] [CrossRef]
  56. Al-Bader, M.; Ford, C.; Al-Ayadhy, B.; Francis, I. Analysis of estrogen receptor isoforms and variants in breast cancer cell lines. Exp. Ther. Med. 2011, 2, 537–544. [Google Scholar] [CrossRef] [PubMed]
  57. Fuqua, S.A.; Fitzgerald, S.D.; Allred, D.C.; Elledge, R.M.; Nawaz, Z.; McDonnell, D.P.; O’Malley, B.W.; Greene, G.L.; McGuire, W.L. Inhibition of estrogen receptor action by a naturally occurring variant in human breast tumors. Cancer Res. 1992, 65, 483–486. [Google Scholar]
  58. Ge, Y.; Jin, J.; Chen, G.; Li, J.; Ye, M.; Jin, X. Endometrial cancer (EC) derived G3BP1 overexpression and mutant promote EC tumorigenesis and metastasis via SPOP/ERα axis. Cell Commun. Signal 2023, 21, 303. [Google Scholar] [CrossRef]
  59. He, X.; Zheng, Z.; Song, T.; Wei, C.; Ma, H.; Ma, Q.; Zhang, Y.; Xu, Y.; Shi, W.; Ye, Q.; et al. c-Abl regulates estrogen receptor alpha transcription activity through its stabilization by phosphorylation. Oncogene 2010, 29, 2238–2251. [Google Scholar] [CrossRef]
  60. Karim, A.M.; Eun Kwon, J.; Ali, T.; Jang, J.; Ullah, I.; Lee, Y.G.; Park, D.W.; Park, J.; Jeang, J.W.; Kang, S.C. Triple-negative breast cancer: Epidemiology, molecular mechanisms, and modern vaccine-based treatment strategies. Biochem. Pharmacol. 2023, 212, 115545. [Google Scholar] [CrossRef]
  61. Shi, M.; Guo, N. MicroRNA expression and its implications for the diagnosis and therapeutic strategies of breast cancer. Cancer Treat. Rev. 2009, 35, 328–334. [Google Scholar] [CrossRef]
  62. da Paixão, A.O.; Bolin, A.P.; Silvestre, J.G.; Rodrigues, A.C. Palmitic Acid Impairs Myogenesis and Alters Temporal Expression of miR-133a and miR-206 in C2C12 Myoblasts. Int. J. Mol. Sci. 2021, 22, 2748. [Google Scholar] [CrossRef] [PubMed]
  63. Murakami, J.; Hu, Y.; Fan, Y.; Zhang, C.; Wang, C. Palmitic acid inhibits vascular smooth muscle cell switch to synthetic phenotype via upregulation of miR-22 expression. Aging 2022, 14, 8046–8060. [Google Scholar]
  64. Huang, F.; Chen, J.; Wang, J.; Zhu, P.; Lin, W. Palmitic Acid Induces MicroRNA-221 Expression to Decrease Glucose Uptake in HepG2 Cells via the PI3K/AKT/GLUT4 Pathway. Biomed. Res. Int. 2019, 2019, 8171989. [Google Scholar] [CrossRef] [PubMed]
  65. Li, F.; Lei, C.; Gong, K.; Bai, S.; Sun, L. Palmitic acid promotes human retinal pigment epithelial cells migration by upregulating miR-222 expression and inhibiting NUMB. Aging 2023, 15, 9341–9357. [Google Scholar] [CrossRef] [PubMed]
  66. Lin, X.; Guan, H.; Huang, Z.; Liu, J.; Li, H.; Wei, G.; Cao, X.; Li, Y. Downregulation of Bcl-2 expression by miR-34a mediates palmitate-induced Min6 cells apoptosis. J. Diabetes Res. 2014, 2014, 258695. [Google Scholar] [CrossRef]
  67. Dian, B.; Wang, Y.; Liao, J.; Kadeer, A.; Wang, J.; Wibuer, P. Downregulation of miR-34a represses insulin resistance and mediates glucose metabolism by upregulating IGF2 to activate PI3K/AKT signaling pathway. Trop. J. Pharm. Res. 2021, 20, 2481–2487. [Google Scholar]
  68. Weng, Y.S.; Tseng, H.Y.; Chen, Y.A.; Shen, P.C.; Al Haq, A.T.; Chen, L.M.; Tung, Y.C.; Hsu, H.L. MCT-1/miR-34a/IL-6/IL-6R signaling axis promotes EMT progression, cancer stemness and M2 macrophage polarization in triple-negative breast cancer. Mol. Cancer 2019, 18, 42. [Google Scholar] [CrossRef]
  69. Chung, S.; Hwang, J.T.; Park, J.H.; Choi, H.K. Free fatty acid-induced histone acetyltransferase activity accelerates lipid accumulation in HepG2 cells. Nutr. Res. Pract. 2019, 13, 196–204. [Google Scholar] [CrossRef]
  70. Xie, X.; Gao, M.; Zhao, W.; Li, C.; Zhang, W.; Yang, J.; Zhang, Y.; Chen, E.; Guo, Y.; Guo, Z.; et al. LncRNA Snhg3 aggravates hepatic steatosis via PPARγ signaling. eLife 2024, 13, RP96988. [Google Scholar] [CrossRef]
  71. Madak-Erdogan, Z.; Lupien, M.; Stossi, F.; Brown, M.; Katzenellenbogen, B.S. Genomic collaboration of estrogen receptor alpha and extracellular signal-regulated kinase 2 in regulating gene and proliferation programs. Mol. Cell Biol. 2011, 31, 226–236. [Google Scholar] [CrossRef]
  72. Tang, Y.; Tian, W.; Zheng, S.; Zou, Y.; Xie, J.; Zhang, J.; Li, X.; Sun, Y.; Lan, J.; Li, N.; et al. Dissection of FOXO1-Induced LYPLAL1-DT Impeding Triple-Negative Breast Cancer Progression via Mediating hnRNPK/β-Catenin Complex. Research 2023, 15, 0289. [Google Scholar] [CrossRef] [PubMed]
  73. Zhang, B.; Zhu, R.; Sun, X.; Guo, Q.; Zhang, Y.; Zhang, N.; Oh, Y.; Fan, L.; Wang, C.; Gu, N. Fatty acid palmitate suppresses FoxO1 expression via PERK and IRE1 unfolded protein response in C2C12 myotubes. Toxicol. In Vitro 2022, 85, 105459. [Google Scholar] [CrossRef] [PubMed]
  74. Wu, X.; Li, Y.; Wang, J.; Wen, X.; Marcus, M.T.; Daniels, G.; Zhang, D.Y.; Ye, F.; Wang, L.H.; Du, X.; et al. Long chain fatty Acyl-CoA synthetase 4 is a biomarker for and mediator of hormone resistance in human breast cancer. PLoS ONE 2013, 8, e77060. [Google Scholar] [CrossRef] [PubMed]
  75. Brechbuhl, H.M.; Han, A.; Paul, K.V.; Nemkov, T.; Ramachandran, S.; Ward, A.; Jacobsen, B.M.; Hansen, K.; Sartorius, C.A.; D’Alessandro, A.; et al. Metabolic Switch in Endocrine Resistant Estrogen Receptor Positive Breast Cancer. bioRxiv 2024. [Google Scholar] [CrossRef]
  76. Radde, B.N.; Alizadeh-Rad, N.; Price, S.M.; Schultz, D.J.; Klinge, C.M. Anacardic Acid, Salicylic Acid, and Oleic Acid Differentially Alter Cellular Bioenergetic Function in Breast Cancer Cells. J. Cell Biochem. 2016, 117, 2521–2532. [Google Scholar] [CrossRef]
  77. Bian, C.; Sun, J.; Huang, X.; Ji, S.; Ji, H. Endoplasmic reticulum stress is involved in lipid accumulation induced by oleic acid in adipocytes of grass carp (Ctenopharyngodon idella): Focusing on the transcriptional level. Fish. Physiol. Biochem. 2022, 48, 275–284. [Google Scholar] [CrossRef]
  78. Halder, S.; Macatangay, N.J.; Zerfas, B.L.; Salazar-Chaparro, A.F.; Trader, D.J. Oleic amide derivatives as small molecule stimulators of the human proteasome’s core particle. RSC Med. Chem. 2022, 13, 1077–1081. [Google Scholar] [CrossRef]
  79. Chen, L.; Zhang, Q.; Meng, Y.; Zhao, T.; Mu, C.; Fu, C.; Deng, C.; Feng, J.; Du, S.; Liu, W.; et al. Saturated fatty acids increase LPI to reduce FUNDC1 dimerization and stability and mitochondrial function. EMBO Rep. 2023, 24, e54731. [Google Scholar] [CrossRef]
  80. Cochrane, D.R.; Cittelly, D.M.; Howe, E.N.; Spoelstra, N.S.; McKinsey, E.L.; LaPara, K.; Elias, A.; Yee, D.; Richer, J.K. MicroRNAs link estrogen receptor alpha status and Dicer levels in breast cancer. Horm. Cancer 2010, 1, 306–319. [Google Scholar] [CrossRef]
  81. Pandey, D.P.; Picard, D. miR-22 inhibits estrogen signaling by directly targeting the estrogen receptor alpha mRNA. Mol. Cell Biol. 2009, 29, 3783–3790. [Google Scholar] [CrossRef] [PubMed]
  82. Leivonen, S.K.; Mäkelä, R.; Ostling, P.; Kohonen, P.; Haapa-Paananen, S.; Kleivi, K.; Enerly, E.; Aakula, A.; Hellström, K.; Sahlberg, N.; et al. Protein lysate microarray analysis to identify microRNAs regulating estrogen receptor signaling in breast cancer cell lines. Oncogene 2009, 28, 3926–3936. [Google Scholar] [CrossRef]
  83. Dunbier, A.K.; Hong, Y.; Masri, S.; Brown, K.A.; Sabnis, G.J.; Palomares, M.R. Progress in aromatase research and identification of key future directions. J. Steroid Biochem. Mol. Biol. 2010, 118, 311–315. [Google Scholar] [CrossRef]
  84. Fujiwara-Tani, R.; Sasaki, T.; Takagi, T.; Mori, S.; Kishi, S.; Nishiguchi, Y.; Ohmori, H.; Fujii, K.; Kuniyasu, H. Gemcitabine Resistance in Pancreatic Ductal Carcinoma Cell Lines Stems from Reprogramming of Energy Metabolism. Int. J. Mol. Sci. 2022, 23, 7824. [Google Scholar] [CrossRef]
  85. Takagi, T.; Fujiwara-Tani, R.; Mori, S.; Kishi, S.; Nishiguchi, Y.; Sasaki, T.; Ogata, R.; Ikemoto, A.; Sasaki, R.; Ohmori, H.; et al. Lauric Acid Overcomes Hypoxia-Induced Gemcitabine Chemoresistance in Pancreatic Ductal Adenocarcinoma. Int. J. Mol. Sci. 2023, 24, 7506. [Google Scholar] [CrossRef] [PubMed]
  86. Walcher, L.; Kistenmacher, A.K.; Suo, H.; Kitte, R.; Dluczek, S.; Strauß, A.; Blaudszun, A.R.; Yevsa, T.; Fricke, S.; Kossatz-Boehlert, U. Cancer Stem Cells-Origins and Biomarkers: Perspectives for Targeted Personalized Therapies. Front. Immunol. 2020, 11, 1280. [Google Scholar] [CrossRef] [PubMed]
  87. Xu, X.; Zhang, M.; Xu, F.; Jiang, S. Wnt signaling in breast cancer: Biological mechanisms, challenges and opportunities. Mol. Cancer 2020, 19, 165. [Google Scholar] [CrossRef]
  88. Hinder, L.M.; Figueroa-Romero, C.; Pacut, C.; Hong, Y.; Vivekanandan-Giri, A.; Pennathur, S.; Feldman, E.L. Long-chain acyl coenzyme A synthetase 1 overexpression in primary cultured Schwann cells prevents long chain fatty acid-induced oxidative stress and mitochondrial dysfunction. Antioxid. Redox Signal 2014, 21, 588–600. [Google Scholar] [CrossRef]
  89. Holloway, G.P.; Fajardo, V.A.; McMeekin, L.; LeBlanc, P.J. Unsaturation of mitochondrial membrane lipids is related to palmitate oxidation in subsarcolemmal and intermyofibrillar mitochondria. J. Membr. Biol. 2012, 245, 165–176. [Google Scholar] [CrossRef]
  90. Loibl, S.; Poortmans, P.; Morrow, M.; Denkert, C.; Curigliano, G. Breast cancer. Lancet 2021, 397, 1750–1769. [Google Scholar] [CrossRef]
  91. Santa-María, C.; López-Enríquez, S.; Montserrat-de la Paz, S.; Geniz, I.; Reyes-Quiroz, M.E.; Moreno, M.; Palomares, F.; Sobrino, F.; Alba, G. Update on Anti-Inflammatory Molecular Mechanisms Induced by Oleic Acid. Nutrients 2023, 15, 224. [Google Scholar] [CrossRef]
  92. Tosti, V.; Bertozzi, B.; Fontana, L. Health Benefits of the Mediterranean Diet: Metabolic and Molecular Mechanisms. J. Gerontol. A Biol. Sci. Med. Sci. 2018, 73, 318–326. [Google Scholar] [CrossRef]
  93. Berrino, F.; Villarini, A.; Gargano, G.; Krogh, V.; Grioni, S.; Bellegotti, M.; Venturelli, E.; Raimondi, M.; Traina, A.; Zarcone, M.; et al. The Effect of Diet on Breast Cancer Recurrence: The DIANA-5 Randomized Trial. Clin. Cancer Res. 2024, 30, 965–974. [Google Scholar] [CrossRef]
  94. Creighton, C.J.; Massarweh, S.; Huang, S.; Tsimelzon, A.; Hilsenbeck, S.G.; Osborne, C.K.; Shou, J.; Malorni, L.; Schiff, R. Development of resistance to targeted therapies transforms the clinically associated molecular profile subtype of breast tumor xenografts. Cancer Res. 2008, 68, 7493–7501. [Google Scholar] [CrossRef] [PubMed]
  95. Khaled, N.; Bidet, Y. New Insights into the Implication of Epigenetic Alterations in the EMT of Triple Negative Breast Cancer. Cancers 2019, 11, 559. [Google Scholar] [CrossRef] [PubMed]
  96. Kouros-Mehr, H.; Kim, J.W.; Bechis, S.K.; Werb, Z. GATA-3 and the regulation of the mammary luminal cell fate. Curr. Opin. Cell Biol. 2008, 20, 164–170. [Google Scholar] [CrossRef] [PubMed]
  97. Asselin-Labat, M.L.; Sutherland, K.D.; Barker, H.; Thomas, R.; Shackleton, M.; Forrest, N.C.; Hartley, L.; Robb, L.; Grosveld, F.G.; van der Wees, J.; et al. Gata-3 is an essential regulator of mammary-gland morphogenesis and luminal-cell differentiation. Nat. Cell Biol. 2007, 9, 201–209. [Google Scholar] [CrossRef]
  98. Yoon, E.C.; Wang, G.; Parkinson, B.; Huo, L.; Peng, Y.; Wang, J.; Salisbury, T.; Wu, Y.; Chen, H.; Albarracin, C.T.; et al. TRPS1, GATA3, and SOX10 expression in triple-negative breast carcinoma. Hum. Pathol. 2022, 125, 97–107. [Google Scholar] [CrossRef]
  99. Byrne, D.J.; Deb, S.; Takano, E.A.; Fox, S.B. GATA3 expression in triple-negative breast cancers. Histopathology 2017, 71, 63–71. [Google Scholar] [CrossRef]
  100. Choi, J.; Choi, J.H.; Lee, H.W.; Seo, D.; Lkhagvasuren, G.; Kim, J.W.; Seo, S.B.; Lee, K.; Lee, K.H. KPNA3 promotes epithelial-mesenchymal transition by regulating TGF-β and AKT signaling pathways in MDA-MB-231, a triple-negative breast cancer cell line. BMB Rep. 2023, 56, 120–125. [Google Scholar] [CrossRef]
  101. Chu, I.M.; Lai, W.C.; Aprelikova, O.; El Touny, L.H.; Kouros-Mehr, H.; Green, J.E. Expression of GATA3 in MDA-MB-231 triple-negative breast cancer cells induces a growth inhibitory response to TGFß. PLoS ONE 2013, 8, e61125. [Google Scholar] [CrossRef] [PubMed]
  102. Pascual, G.; Avgustinova, A.; Mejetta, S.; Martín, M.; Castellanos, A.; Attolini, C.S.; Berenguer, A.; Prats, N.; Toll, A.; Hueto, J.A.; et al. Targeting metastasis-initiating cells through the fatty acid receptor CD36. Nature 2017, 541, 41–45. [Google Scholar] [CrossRef] [PubMed]
  103. Altea-Manzano, P.; Doglioni, G.; Liu, Y.; Cuadros, A.M.; Nolan, E.; Fernández-García, J.; Wu, Q.; Planque, M.; Laue, K.J.; Cidre-Aranaz, F.; et al. A palmitate-rich metastatic niche enables metastasis growth via p65 acetylation resulting in pro-metastatic NF-κB signaling. Nat. Cancer 2023, 4, 344–364. [Google Scholar] [CrossRef] [PubMed]
  104. Terry, A.R.; Nogueira, V.; Rho, H.; Ramakrishnan, G.; Li, J.; Kang, S.; Pathmasiri, K.C.; Bhat, S.A.; Jiang, L.; Kuchay, S.; et al. CD36 maintains lipid homeostasis via selective uptake of monounsaturated fatty acids during matrix detachment and tumor progression. Cell Metab. 2023, 35, 2060–2076.e9. [Google Scholar] [CrossRef]
  105. Kuniyasu, H.; Luo, Y.; Fujii, K.; Sasahira, T.; Moriwaka, Y.; Tatsumoto, N.; Sasaki, T.; Yamashita, Y.; Ohmori, H. CD10 enhances metastasis of colorectal cancer by abrogating the anti-tumoural effect of methionine-enkephalin in the liver. Gut 2010, 59, 348–356. [Google Scholar] [CrossRef]
Figure 1. Effect of LCFAs on cell viability of BCA cells. (A,B) The BCA cell lines MCF7 (A) and MT231 (B) were treated with various concentrations of LCFAs for 48 h. (C) Comparison of PA on cell viability between MCF7 and MB231 cells. Cell viability in untreated controls was set at 100%. Error bars: SD from three independent trials. Statistical analysis: ANOVA with Bonferroni correction. * p < 0.05, MCF7 vs. MB231. LCFA, long-chain fatty acid; BCA, breast cancer; LA, linoleic acid; OA, oleic acid; EA, elaidic acid; PA, palmitic acid; LNA, linolenic acid; C, control; ANOVA, analysis of variance; SD, standard deviation.
Ijms 26 06722 g001
Figure 2. Effect of LCFAs on mitochondrial function in BCA cells. BCA cells were treated with LCFAs (50 μM) for 48 h. (A) MMP, (B) MtVol, (C) mitochondrial H2O2, and (D) mitochondrial superoxide. Each parameter was expressed relative to the fluorescence intensity of the control, taken as 100%. Scale bar, 50 μm. Error bars: SD from three independent trials. Statistical analysis: ANOVA with Bonferroni correction. * p < 0.05 vs. C. LCFA, long-chain fatty acid; BCA, breast cancer; LA, linoleic acid; OA, oleic acid; EA, elaidic acid; PA, palmitic acid; LNA, linolenic acid; C, control; MMP, mitochondrial membrane potential; MtVol, mitochondrial volume; ANOVA, analysis of variance; SD, standard deviation.
Ijms 26 06722 g002
Figure 3. Effect of LCFAs on stemness and differentiation of BCA cells. BCA cells were treated with LCFAs (50 μM) for 48 h. (A) Gene expression of stemness-related genes, namely CD24 and Oct3. (B,C) Semi-quantification of panel A. The MCF7 control was set to 100. (D) Expression of differentiation-related genes, namely CDH and CK18. (E,F) Semi-quantification of panel D. The MCF7 control was set to 100. (G) Sphere formation in the BCA cells. Scale bar, 200 μm. Right panel: Quantification of the left panel. Error bars: SD from three independent trials. Statistical analysis: ANOVA with Bonferroni correction. * p < 0.05 vs. C. LCFA, long-chain fatty acid; BCA, breast cancer; LA, linoleic acid; OA, oleic acid; PA, palmitic acid; C, control; BP, base pair; Oct3, octamer-binding transcription factor 3; ACTB, β-actin; CDH, E-cadherin; CK18, cytokeratin; ANOVA, analysis of variance; SD, standard deviation.
Ijms 26 06722 g003
Figure 4. Effect of LCFAs on energy metabolism of BCA cells. BCA cells were treated with LCFAs (50 μM) for 48 h. (A) Gene expression of energy metabolism-related genes, namely c-Myc and PGC-1α. (B,C) Semi-quantification of panels (A,DG). Energy flux analysis of MCF7 (D,F) and MB231 cells (E,G). (H,I) Matrix diagram of energy metabolism. Error bars: SD from three independent trials. Statistical analysis: ANOVA with Bonferroni correction. * p < 0.05 vs. C. LCFA, long-chain fatty acid; BCA, breast cancer; LA, linoleic acid; OA, oleic acid; PA, palmitic acid; C, control; BP, base pair; PGC-1α, peroxisome proliferator-activated receptor gamma coactivator 1-α; ACTB, β-actin; OCR, oxygen consumption rate; ECAR, extracellular acidification rate; Max maximal; C, control; cont, control; ANOVA, analysis of variance; SD, standard deviation.
Ijms 26 06722 g004
Figure 5. Effect of LCFAs on expression of estrogen receptor in BCA cells. BCA cells were treated with LCFAs (50 μM) for 48 h. (A) Gene expression of ESR1. (B) Semi-quantification of panel A. (C) Protein levels of ERα in the cytoplasm and nuclei. (D) Semi-quantification of panel D. (E) Immunocytochemistry of ERα. Scale bar, 50 μm. (F) Semi-quantification of the fluorescence intensity in panel E. Error bars: SD from three independent trials. Statistical analysis: ANOVA with Bonferroni correction. * p < 0.05 vs. C.LCFA, long-chain fatty acid; BCA, breast cancer; OA, oleic acid; PA, palmitic acid; C, control; BP, base pair; ESR1, estrogen receptor gene; ER, estrogen receptor; GAPDH, glyceraldehyde-3-phosphate dehydrogenase; TBP, TATA-binding protein; DAPI, 4′,6-diamidino-2-phenylindole; ANOVA, analysis of variance; SD, standard deviation.
Ijms 26 06722 g005
Figure 6. Function of ER expressed in BCA cells. BCA cells were treated with LCFAs (50 μM) with or without E2 or TAM for 48 h. (A,B) Effects of E2 and TAM on the viability of MCF7 (A) and MB231 cells (B). (CE) Expression of PgR and TFF1 (C), BCL2 and PI3K (D), and GATA3 (E) based on the data from quantitative PCR. The expression was standardized by ACTB expression. (F,G) Expression of ER-associated miRNAs in MCF7 (F) and MB231 cells (G). (H) ESR1 expression in MB231 cells treated with PA (50 μM) and/or the miR-34a inhibitor (34a-I, 2 μM) for 48 h. (I) ESR1 expression in MCF7 cells treated with OA (50 μM) and/or miR-22 or -221 inhibitors (22-I or 221-I, 2 μM) for 48 h. Error bars: SD from three independent trials. Statistical analysis: ANOVA with Bonferroni correction. * p < 0.05 vs. C. LCFA, long-chain fatty acid; BCA, breast cancer; OA, oleic acid; PA, palmitic acid; C, control; ER, estrogen receptor; E2, estradiol; TAM, tamoxifen; PgR, progesterone receptor; TFF1, trefoil factor-1; BCL2, B-cell CLL/lymphoma 2; PI3K, phosphatidyl inositol-3 kinase; GATA3, GATA-binding protein 3; BP, base pair; ANOVA, analysis of variance; SD, standard deviation.
Ijms 26 06722 g006
Figure 7. LCFAs modulate mitochondrial function, energy metabolism, and cellular stemness in breast cancer cells. Notably, OA suppresses ER expression and activity in luminal-type MCF7 cells. In contrast, PA induces ER re-expression in TNBC MB231 cells; however, the receptor remains transcriptionally inactive. Further in vivo studies and clinical validation are necessary to determine the translational relevance of these findings. LCFA, long-chain fatty acids; ROS, reactive oxygen species; TNBC, triple-negative breast cancer; MB231, MDA-MB231; OA, oleic acid; ER, estrogen receptor; PA, palmitic acid.
Ijms 26 06722 g007
Table 1. Effect of LCFAs on MCF7 and MB231 cells.
LCFAIC50 (μM)MMP (%) *MtVol (%) *MtROS (%) *Basal OCR (%) *
MCF7MB231MCF7MB231MCF7MB231MCF7MB231MCF7MB231
LA7812977426521175140NTNT
EA198NA7640372015650NTNT
OA192198108605222130833567
PA22458821021734138.51053061
LNA138176928076140137.595NTNT
* Each value was expressed as a percentage of the control. The standard deviation of each value is under 10%. LCFA, long-chain fatty acid; LA, linoleic acid; EA, elaidic acid; OA, oleic acid; PA, palmitoic acid; LNA, α-linolenic acid; IC, inhibitory concentration of viability; MMP, mitochondrial membrane potential; MtVol, mitochondrial volume; MtROS, mitochondrial reactive oxygen; it is the mean value of H2O2 and superoxide; basal OCR, basal oxygen consumption rate; NA, not applicable; EA did not reach IC50; NT, not tested.
Table 2. Polymerase chain reaction (PCR) primers and antibodies.
RT-PCR Primers
GeneIDUpper (5′ to 3′)Lower (5′ to 3′)
ACTBNM_001101.3ggacttcgagcaagagatggagcactgtgttggcgtacag
CD24BC064619.1atgggcagagcaatggtggccacgaagagactggctgtt
OCT3BC117437.1gaaggatgtggtccgagtgtgtgaagtgagggctcccata
CDH1BC146662.1cgtcctgggcagagtgaattgctctgtcaccttcagccat
CK18NM_000224.3ccgcatcgttctgcagattgtctgactcaaggtgcagcag
c-MycNM_002467.4ttcgggtagtggaaaaccagcagcagctcgaatttcttcc
PGC-1αBC156323.1gtgaagaccagcctctttgcaatccgtcttcatccacagg
ESR1JF810888.1gctccgcaaatgctacgaagagatctccaccatgccctct
Antibodies
TargetRRIDCompany
ERαAB_2617128Cell Signaling Technology, Danvers, MA, USA
GAPDHAB_2107448Abcam, Waltham, MA, USA
TBP− *Abcam, Waltham, MA, USA
* Not registered. The catalog number is ab300656. ACTB, beta-actin; Oct3, octamer-binding transcription factor 3; CDH1; E-cadherin; CK, cytokeratin; PGC1α, peroxisome proliferator-activated receptor gamma coactivator 1-α; ESR1, αER; GAPDH, glyceraldehyde-3-phosphate dehydrogenase; TBP, TATA-binding protein; RT-PCR, reverse transcription polymerase chain reaction; RRID, Research Resource Identifier.
Disclaimer/Publisher’s Note: The statements, opinions and data contained in all publications are solely those of the individual author(s) and contributor(s) and not of MDPI and/or the editor(s). MDPI and/or the editor(s) disclaim responsibility for any injury to people or property resulting from any ideas, methods, instructions or products referred to in the content.

