Abstract
Cigarette smoking exposes individuals to numerous toxic substances, including heavy metals. Smokers are at risk due to the accumulation of these substances in various tissues. Objective: To compare the concentrations of 41 elements in 11 brain regions, the spinal cord, the bronchial, the lungs, and the liver in smokers (n = 11) and non-smokers (n = 17). Elemental composition was determined by ICP-MS after wet digestion in a microwave system. The following toxic elements were detected at levels of µg/g w.w.: Al, Cd, Pb, Ba, As, Ni, and Tl. Significantly higher concentrations of Al were detected in bronchial and lung, and more Pb, Tl, and rare earth elements were detected in the liver of smokers compared to non-smokers. In addition, smokers had significantly lower concentrations of essential elements involved in antioxidant defense, such as Cu, in liver tissue (p = 0.033). The brain and spinal cord in smokers and non-smokers were similar in terms of chemical composition, except the insula, where smokers had greater Al accumulation (p = 0.030), the precentral gyrus, where higher amounts of As, Cd, and Mn were detected, and the septal nucleus accumbens, which preferentially accumulated Cd in smokers; however, the p-values indicate that these differences were not statistically significant. Most brain areas of smokers were characterized by higher Na content (p < 0.05). These findings prove the long-term effects of smoking, demonstrating the bioaccumulation of toxic elements, the increased levels of rare earth elements in the liver, decreased levels of elements involved in the body’s antioxidant defense, and disruption of sodium homeostasis in the brain of smokers.
1. Introduction
Nicotine addiction and tobacco smoking are the leading causes of premature death [1,2]. According to the World Health Organization (WHO), one person dies every 4 s as a result of tobacco smoking [3]. In Poland, according to the National Health Fund’s report on tobacco-related diseases in 2021, 8.5 million people smoked tobacco. Tobacco smoking is the most common identified cause of chronic obstructive pulmonary disease (COPD) and coexisting diseases, such as chronic bronchitis, emphysema, and recurrent bacterial lung infections [4]. The WHO currently predicts that COPD will become the third leading cause of death worldwide by 2030 [5]. Tobacco-related diseases also include malignancies, including lung, laryngeal, and oropharyngeal cancers, and cardiovascular diseases, including ischemic heart disease [6,7]. Recent population studies have confirmed in animal models that chronic exposure to tobacco smoke accelerates aging through mitochondrial dysfunction [8]. Unfortunately, the use of tobacco products and the prevalence of cigarette smoking continue despite evidence of the harmful effects of smoking [9,10].
Tobacco use is declining worldwide, but it is still a major public health problem. WHO data shows that in 2022, about 1.25 billion adults consumed tobacco, down from 32.7% of the world’s population in 2000. However, the use of alternative smoking products (e.g., electronic cigarettes, heated tobacco products (HPT)) is growing, especially among young people. Among the observed trends, the attitude of minors to tobacco is worrying. According to the report, about one in ten adolescents aged 13 to 15 (9.7% or about 37 million) consume tobacco products. In Poland, according to the 2022 Global Youth Tobacco Survey (GYTS): 11.7% of Polish youth aged 13–15 smoke traditional cigarettes; 22.3% of Polish youth aged 13–15 use electronic cigarettes [11]. Moreover, although smoking prevalence is decreasing, polyconsumption (the combined use of different smoking products) is increasing, especially among young people. In Italy, for example, 30.2% of young people use at least one product from traditional cigarettes, heated tobacco or electronic cigarettes. Although cigarette prevalence among 13–15-year-olds in Italy decreased from 21% in 2010 to 15% in 2022, the prevalence of e-cigarette use increased from 8% in 2014 to 20% in 2022 [12].
The prevalence of cigarette smoking has even been studied among university athletes at Thammasat University in Thailand, with a mean age of 19.8 ± 1.3 years [13]. The study confirmed that the proportion of smokers in the population studied was relatively high. Smokers were predominantly men (70.6% vs. 29.4%, p < 0.001) who had higher levels of the measured indicator, exhaled carbon monoxide gas (CO; 3.75 ± 3.08 ppm vs. 2.18 ± 0.73 ppm, p < 0.001). Cigarette smoke has been shown to contain many toxic substances, including volatile organic compounds, nitrosamines, polycyclic aromatic hydrocarbons, and toxic heavy metals [14,15,16]. Some chemical elements penetrate tobacco smoke better than others, with concentrations ranging from almost 1% (As compounds) to up to 22% (Cd compounds) [17,18,19]. Edgar Pinto et al. [18] showed that the transfer of Tl and Cd to cigarette smoke was >81%; As and Pb were transferred at rates of 33–60%.
Several reports describe the determination of heavy metals in different cigarette brands [20,21,22,23]. A 2024 study by Tarimo Felix et al. reported the content of heavy metals (As, Cd, Cr, Hg, and Pb) in different brands of cigarettes produced worldwide [24]. Fresquez et al. investigated the content of As, Be, Cd, Cr, Co, Pb, Mn, Hg, and Ni in 50 commercial tobacco products available in the USA using inductively coupled plasma mass spectrometry (ICP MS) [25]. The mean values of Mn ranged from 131 to 245 μg/g, Cr values ranged from 1.4 to 3.2 μg/g, As values ranged from 0.22 to 0.36 μg/g, Cd values ranged from 1.0 to 1.7 μg/g, Ni values ranged from 2.1 to 3.9 μg/g, and Pb values ranged from 0.6 to 1.2 μg/g. In the study by Kazi et al., toxic metals (Al, Cd, Ni, and Pb) were detected in the ash of different brands of cigarettes available in Pakistan, with Al being the most abundant [26]. As reported by the International Agency for Research on Cancer, these metals are carcinogenic [27]. In this context, in March 2012, the US Food and Drug Administration (FDA) published guidelines for reporting harmful ingredients in tobacco products, including As, Cd, Cr, Ni, and Pb [28]. Matassa et al. [29] provided direct evidence, using microscopic imaging, that metallic inorganic microparticles are transported with the gaseous smoke stream to the fibrous filters in the mouthpiece and form nanostructures of up to 150 µm in size containing, among others, vanadium, chromium, iron, nickel, copper, uranium, manganese, and osmium. The authors point out that the insufficient porosity of the filters is not an obstacle for toxic volatile substances. The studies provide a basis for further work developing microfibers that are capable of capturing toxic particles in gaseous media to protect human health.
The presence of metals in tobacco products results from the ability of tobacco (Nicotiana tabacum L.) to accumulate heavy metals during plant growth [30]. The tobacco absorbs metal ions and compounds from the soil through its roots, which are then transported to the leaves [31,32]. The efficiency of the uptake of contaminants from the soil depends on plant growth conditions, soil pH and type, organic matter composition, presence of organic or metal ions, type of fertilizer used, and geographical location [17,33]. Therefore, the origin of the tobacco may play a key role in the level of heavy metal contamination in the variety of tobacco brands [34,35,36,37,38]. The source of soil contamination with heavy metals such as arsenic (As), cadmium (Cd), chromium (Cr), mercury (Hg), and lead (Pb) is mainly anthropogenic human activity (wastewater, spraying, fertilizers, mining, and atmospheric deposition) [39]. It has been shown that Cd accumulates in the tobacco plant in a natural way [30]. This “hyperaccumulation” leads to very high cadmium concentrations in tobacco leaves, which are relatively independent of soil content [30,40]. The cadmium content of tobacco leaves is in the range of 1 to 2 µg/g of dry weight, which leads to amounts of 0.5 to 1 µg of cadmium per cigarette. Another possible source of contamination may be the cigarette manufacturing process itself and additives in the form of flavorings or humectants [41].
Tobacco smoke is a source of exposure to toxic elements [42]. Metals found in cigarette smoke are carcinogenic, toxic to the cardiovascular system and kidneys (As and Cd), and toxic to the nervous system (Pb) [43]. Chronic smoking leads to the accumulation of metals in tissues and body fluids, resulting in the deterioration of health [44]. Pinto et al. [20] demonstrated accumulation in the lungs of smokers (As, Cd, and Pb). Biomonitoring studies have shown that active and passive smokers have significantly elevated levels of Cd and Pb [45,46]. These elements have a long half-life, i.e., 10–12 years [47]. Stojanović et al. [48] showed elevated levels of nickel in the blood and urine of smokers. Richter et al. [49] showed that smokers had significantly higher urinary levels of Cd, Pb, Sb, and Ba compared to non-smokers. The exposure of children of about 7–8 years of age to tobacco smoke is one of the sources of increased exposure to heavy metals. In addition to cotinine (a metabolite of nicotine), traces of chromium (Cr), copper (Cu), lead (Pb), manganese (Mn), nickel (Ni), and zinc (Zn) were found in the saliva of exposed children [50]. The authors observed significant associations between cotinine levels and salivary levels of Cu, Zn, and Pb [50]. However, most studies of tobacco smoke poisoning focus on cadmium, which has been considered a toxin associated with lung disease since 1950 [51,52,53,54,55]. The National Health and Nutrition Examination Survey (NHANES) has been continuously monitoring urinary cadmium concentrations since 1988 to assess trends in cadmium exposure, including those from cigarette smoking.
However, knowledge of local cadmium deposition, e.g., in the lungs, is limited [53]. It is thought that the uptake of cadmium oxide produced during smoking into the lungs is much higher than the uptake of cadmium from food through the gut, and therefore, the blood and urine cadmium concentrations of smokers may be several times higher than those of non-smokers [53,56,57,58,59,60,61]. The local accumulation of cadmium in the lungs appears to be a critical component of the predisposition to lung disease in long-term smokers. This is particularly important given that the biological half-life of cadmium in the human body is >25 years, which is a significant period, suggesting that cadmium may be significantly retained in the lungs of long-term smokers [53]. At this stage of research, it is difficult to disentangle the effects of the different components of tobacco smoke. The presence of toxic metals in body fluids suggests that accumulation in tissues, lungs, and other organs is likely. Such accumulation may affect intracellular signaling and, consequently, host defense functions. This explains the increased susceptibility to bacterial colonization and infection, leading to chronic inflammation, fibrosis, and emphysema, and further impairment of lung ventilatory function and gas exchange, key clinical features of severe COPD observed in smokers. Further studies are needed to investigate the relationship between tobacco smoke exposure and pathogenic mechanisms, and to determine the metal concentrations in different sites in long-term smokers. Such studies can significantly improve the understanding of the pathogenic significance of toxic element accumulation due to tobacco smoking and the associated potential to use this knowledge in risk monitoring.
This study shows, for the first time, the levels of many chemical elements in post-mortem tissues from 11 different areas of the brain, spinal cord, lung, bronchus, and liver of chronic smokers compared to a control group of non-smokers. The aim is to understand the long-term effects of smoking on disturbances in the levels of essential elements, as well as the organ-specific accumulation of toxic elements. The study provides up-to-date evidence for the need to monitor tobacco products for certain elements that tend to accumulate in tissues.
2. Results
2.1. Evidence of Metal Accumulation in Bronchial Tissues of Smokers
The bronchial tissues of smokers/non-smokers were analyzed for the content of 41 metals and metalloids using ICP-MS. The descriptive statistics developed based on the measured data are summarized in Table S1a, Supplementary Materials. The elemental composition of bronchial tissues revealed a high concentration range 100–2000 µg/g (wet weight, w.w.) for essential macroelements, including sodium (Na), potassium (K), phosphorus (P), calcium (Ca), and magnesium (Mg). Trace elements, such as iron (Fe), zinc (Zn), rubidium (Rb), strontium (Sr), copper (Cu), manganese (Mn), selenium (Se), cadmium (Cd), and lead (Pb), were detected within the range of 20–0.04 µg/g (w.w.). Additionally, ultra-trace elements, namely chromium (Cr), vanadium (V), cobalt (Co), nickel (Ni), and cerium (Ce), were present at concentrations between 0.01 and 0.002 µg/g (w.w.). The distribution of these elements suggests both physiological relevance and potential environmental exposure influences.
The comparison of the case/control groups is presented as a graph (Figure 1), with the difference between the mean values of the chemical element concentrations presented in µg/g (w.w.) of tissue collected from the study and control groups. Bronchial tissues from smokers showed a higher content of Al, Zn, Cd, La, Ce, Tb, Mg, P, Ca, Fe, Sr, Ba, Pb, and As compared to the tissue of non-smokers. The remaining elements were found in higher concentrations in the bronchial tissue of the non-smokers group: V, Mn, Co, Ni, Cu, Pr, Nd, Gd, Dy, Tm, Na, K, Rb, Cs, Tl, Cr, and Se. The highest difference was observed for Al, i.e., 0.63 µg/g (w.w.).
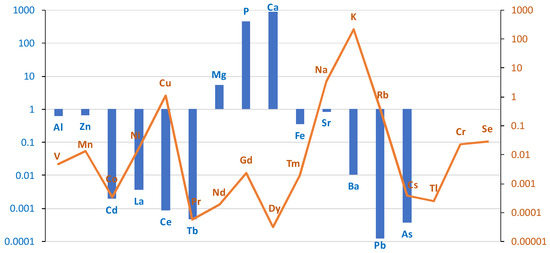
Figure 1.
The difference between the mean values of metal concentrations (µg/g w.w.) of bronchial tissue collected from the study and control groups. Blue bar represents log(case mean–control mean); orange line represents log(control mean–case mean).
A comparison of the content of individual elements in bronchial tissue in smokers and non-smokers is presented in Table 1.

Table 1.
Comparison of median chemical element concentrations (µg/g; w.w.) in bronchial tissue of non-smokers (1) (n = 16) and smokers (2) (n = 11) using the Mann–Whitney test. The “statistic” column refers to the Mann–Whitney U test statistic. The notations for statistical significance are as follows: p < 0.01 with two asterisks (**).
Based on the results of the Mann–Whitney test, it can be seen that, for most elements, no statistically significant differences in concentration were observed between the smoking and non-smoking groups. The exception is aluminum (Al), for which the p-value is 0.004. This indicates a significant difference at the typical level of statistical significance, e.g., 0.05 (Figure 2).
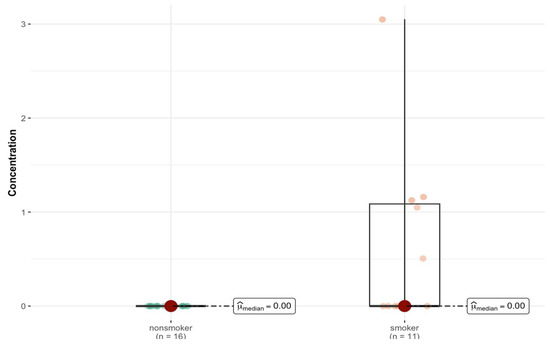
Figure 2.
Statistically significant difference in Al concentration (µg/g w.w.) in bronchial tissue of smokers (n = 11) compared to non-smokers (n = 16).
2.2. Comparison of Elemental Content in Lung Tissue (Left and Right) Between Smokers and Non-Smokers
Descriptive statistics of elemental content in right and left lung tissue (right and left lung, n = 55) for the study population (smokers and non-smokers) are summarized in Supplementary Materials Table S1b,c in the Supplementary Materials. An analysis of lung tissues demonstrated elevated concentrations (1500–50 µg/g; w.w.) of key macroelements, including potassium (K), sodium (Na), phosphorus (P), iron (Fe), calcium (Ca), and magnesium (Mg). Trace elements, such as zinc (Zn), aluminum (Al), rubidium (Rb), copper (Cu), strontium (Sr), manganese (Mn), selenium (Se), cadmium (Cd), chromium (Cr), vanadium (V), and lead (Pb), were found in the range of 10–0.01 µg/g (w.w.). Ultra-trace elements, including cerium (Ce), nickel (Ni), cobalt (Co), cesium (Cs), and neodymium (Nd), were detected at concentrations between 0.01 and 0.001 µg/g (w.w.). The elemental profile reflects both the metabolic requirements of pulmonary tissues and potential accumulation from environmental exposure.
The differences between the groups in the content of individual elements in the lung tissue (right and left) are shown in the logarithmic scale graph in Figure 3. In the case group, higher levels of the following elements were found in the lung tissue: Al, V, Mn, Co, Cu, Zn, Ce, Pr, Nd, Sm, Eu, Dy, Er, Tm, Na, Mg, P, Ca, Be, Sr, Sb, Cs, Ba, Tl, Cr, and As. Lower levels were found for Ni, Cd, La, Gd, Tb, K, Fe, Rb, Pb, and Se.
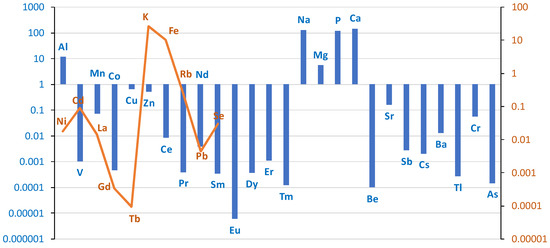
Figure 3.
Comparison of differences in mean values of individual elements on a logarithmic scale in lung tissue (right + left) divided into case/control groups. Blue bar represents log(case mean–control mean); orange line represents log(control mean–case mean).
Higher levels of As and Al were found in the lung tissue of smokers. As levels were in the ng/g range, but were twice as high in smokers as in non-smokers (0.43 ng/g vs. 0.28 ng/g; w.w.). For Al, the mean level was three times higher in smokers than in non-smokers (18 vs. 6.7 µg/g; w.w.). The Ba level was 7.5 times higher in smokers (0.015 vs. 0.002 µg/g). A similar trend was observed in other studies [20], but the values reported by Pinto are much higher due to the conversion of the measurements to dry tissue weight.
When the left and right lung tissues are considered separately, there is an asymmetric distribution of elements between the two sides of the body. A comparative analysis of the medians between the smoker/non-smoker groups (Table 2) revealed statistically significant differences for Al content in both the right (p = 0.026) and left lungs (p = 0.022) (Figure 4a,b) and for Dy in the right (p = 0.035) (Figure S1, Supplementary Materials) and left lungs (p = 0.041). Smokers have statistically significantly more of these elements. In the left lung, there were additional differences in the content of Er (p = 0.003), Nd (p = 0.018), Pr (p = 0.004), Sm (p = 0.01), Sr (p = 0.011), Mn (p = 0.047), and Na (p = 0.042) (Figure S2, Supplementary Materials).
Table 2.
Comparison of median chemical element concentrations (µg/g; w.w.) in left and right lung tissue of smokers and non-smokers, analyzed by Mann–Whitney U test. p < 0.05 is marked with one asterisk (*).
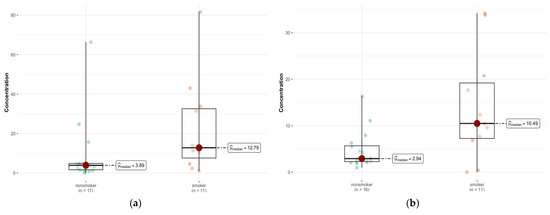
Figure 4.
Statistically significant difference in Al concentration (µg/g w.w.) in the left lung (a) between smokers (n = 11) and non-smokers (n = 17), and right lung (b) tissue of smokers (n = 11) compared with non-smokers (n = 16).
2.3. Comparison of the Content of Elements in Liver Tissue in the Group of Smokers and Non-Smokers
For liver tissue, descriptive statistics are summarized in Table S1d (Supplementary Materials). The elemental analysis of liver tissue showed high concentrations (2000–100 µg/g; w.w.) of major elements, including phosphorus (P), potassium (K), sodium (Na), iron (Fe), and magnesium (Mg). Trace elements, such as calcium (Ca), zinc (Zn), rubidium (Rb), manganese (Mn), copper (Cu), selenium (Se), cadmium (Cd), strontium (Sr), and lead (Pb), were present in the range of 40–0.1 µg/g (w.w.). Ultra-trace elements, including chromium (Cr), cobalt (Co), cesium (Cs), cerium (Ce), and nickel (Ni), were detected at concentrations between 0.02 and 0.002 µg/g (w.w.). This distribution highlights the liver’s central role in metabolism, detoxification, and elemental storage.
The differences in the content of individual elements in liver tissue between the group of cases (smokers) and controls (non-smokers) on a logarithmic scale are presented in the graph in Figure 5.
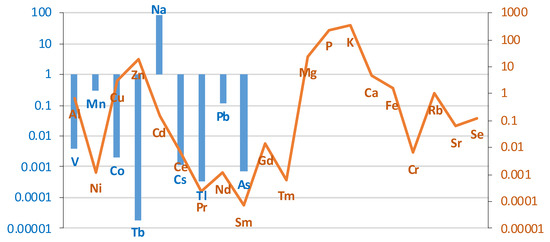
Figure 5.
Comparison of the differences between groups (smokers/non-smokers) in the mean levels of individual elements in liver tissue on a logarithmic scale. Blue bar represents log(case mean–control mean); orange line represents log(control mean–case mean).
The liver of smokers contained more elements, such as V, Mn, Co, Tb, Na, Cs, Tl, Pb, As, La. The concentration of the remaining elements was lower in the liver of smokers compared to the control group. A comparison of the content of individual elements in liver tissue in smokers and non-smokers is presented in Table 3.
Table 3.
Comparison between the elemental liver content (µg/g; w.w.) of non-smokers (1) (n = 17) and smokers (2) (n = 9) using the Mann–Whitney test. p < 0.05 is marked with one asterisk (*).
For most elements, the test showed no statistically significant differences. This means that the levels of these elements in the livers of smokers and non-smokers are similar (p > 0.05). However, for two elements Cu and Pb, statistically significant differences were observed (Figure 6a,b). For Cu (p = 0.033), smokers and non-smokers differ significantly, suggesting that smoking may affect the levels of this element in the liver. There were also significant differences for Pb (p = 0.025), which may indicate an increased accumulation of this element in smokers. Also noteworthy is the element Tl (p = 0.025), which also shows a statistically significant difference between the groups (Figure 6c).
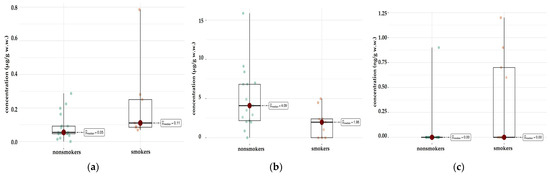
Figure 6.
Comparison of statistically significant differences in median values of Pb (a), Cu (b), and Tl (c) content in liver tissue of smokers (n = 9) and non-smokers (n = 17).
2.4. Comparison of Elemental Content in Different Parts of the Brain Between Smokers and Non-Smokers
Descriptive statistics developed for the study population based on measurements of element levels in brain tissues are summarized in Table S1e (Supplementary Materials). The elemental composition of brain tissues indicated high concentrations (3000–150 µg/g wet weight) of potassium (K), phosphorus (P), sodium (Na), and magnesium (Mg). Trace elements, such as calcium (Ca), iron (Fe), zinc (Zn), copper (Cu), rubidium (Rb), manganese (Mn), aluminum (Al), lead (Pb), selenium (Se), and strontium (Sr), were present in the range of 100–0.1 µg/g (w.w.). Ultra-trace elements, including nickel (Ni), chromium (Cr), cadmium (Cd), barium (Ba), cesium (Cs), and arsenic (As), were detected at concentrations between 0.05 and 0.001 µg/g (w.w.). The elemental profile underscores the brain’s complex biochemical environment and highlights the potential influence of environmental and systemic exposures. Considering the whole brain, smokers have higher levels of Ni, Zn, Cd, La, Pr, Nd, Tb, Tm, Na, Mg, P, K, Fe, Cs, Tl, Cr, and As, and lower concentrations of Al, V, Mn, Co, Cu, Ce, Eu, Gd, Dy, Er, Ca, Rb, Sr, Sb, Ba, Pb, and Se (Figure 7).
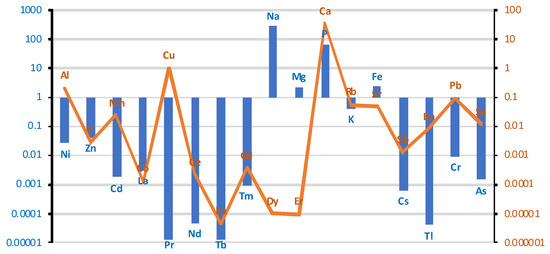
Figure 7.
Comparison of differences in mean values of individual elements at a logarithmic scale in brain tissue between smoking/non-smoking groups. Blue bar represents log(case mean–control mean); orange line represents log(control mean–case mean).
An analysis of the results of the Mann–Whitney test shows significant differences in the concentration of some elements in the brain between smokers and non-smokers (Table S2a, Supplementary Materials). In particular, a significantly lower concentration of Cu (p = 0.047) was observed in smokers compared to non-smokers (Figure 8a). Another significant result is a higher concentration of Na in smokers (p < 0.001) (Figure 8b). The median Na concentration was 1762.815 µg/g (w.w.) in non-smokers and 2065.320 µg/g (w.w.) in smokers, indicating significant differences in the concentration of this element. For the remaining elements, no statistically significant differences were found between smokers and non-smokers.
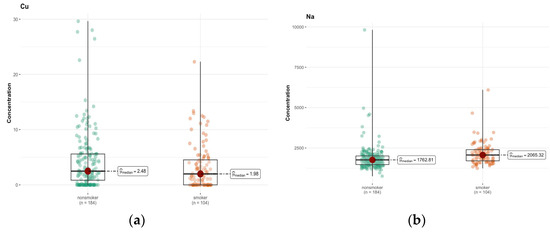
Figure 8.
Comparison of difference in median values of Cu (a) and Na (b) content (µg/g w.w.) in the whole brain tissue of smokers (n = 104) and non-smokers (n = 184).
In area A, only calcium (Ca, p = 0.057) and sodium (Na, p = 0.072) showed p-values close to the significance limit, suggesting that their concentration in the brain area might differ between groups (Tables S1f and S2b, Supplementary Materials). However, after Bonferroni correction, these differences were not statistically significant. In the case of calcium, the medians were 74.979 µg/g (w.w.) in non-smokers and 46.372 µg/g (w.w.) in smokers, which may indicate a tendency for lower calcium concentrations in smokers (Figure 9a,b).
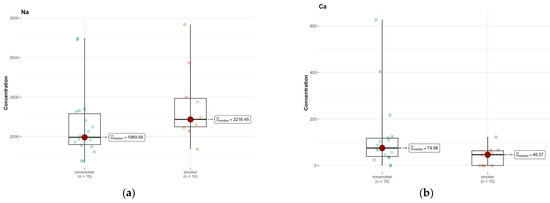
Figure 9.
Comparison of difference in median values of Na (a) and Ca (b) content in the A area of the brain tissue of smokers (n = 10), and non-smokers (n = 18).
In region B, the only elements approaching significance were cadmium (Cd) and Mn (Figure 10a,b). The median is smaller than the limit of detection (DL) (0.00 µg/g; w.w.) for non-smokers and 0.018 µg/g (w.w.) for smokers, indicating a higher concentration of this element in the smokers group (Tables S1g and S2c, Supplementary Materials). The test statistics (46.500) and p-value (0.058) suggest a possible difference, but not at the significance level, after Bonferroni correction.
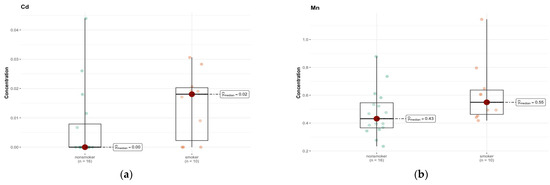
Figure 10.
Comparison of difference in median values of Cd (a) and Mn (b) content (µg/g w.w.) in the B area of the brain tissue of smokers (n = 10) and non-smokers (n = 16).
An analysis of the results of comparative tests between the group of smokers and non-smokers for individual elements in the C region does not show significant statistical differences for most of the analyzed elements (Tables S1h and S2d, Supplementary Materials). The p values, in most cases, exceed the standard significance threshold of 0.05, which suggests a lack of statistically significant differences in the median concentrations of these elements between both groups. The only element for which a significant difference was detected is chromium (Cr) (p = 0.010) (Figure 11). Its median concentration was 0.042 µg/g (w.w.) in non-smokers, while in smokers it was <DL (0 µg/g; w.w.), which indicates significantly lower values in this group. The statistical test suggests that this difference is significant and is not due to random variability in the samples.
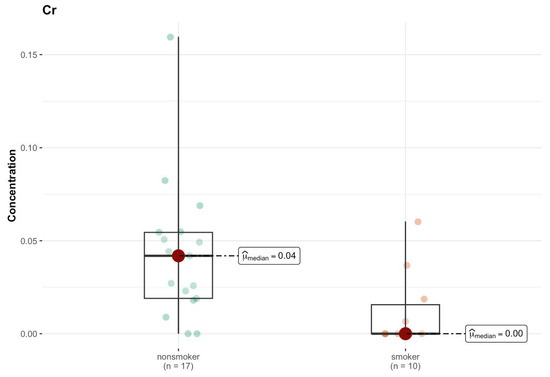
Figure 11.
Comparison of statistically significant difference (p < 0.01) in median values of Cr content (µg/g w.w.) in C area of the brain tissue of smokers (n = 10) and non-smokers (n = 17).
A comparative analysis of element concentrations between non-smokers and smokers does not show statistically significant differences for most of the elements studied in brain region D (Tables S1i and S2e, Supplementary Materials). The p values for all elements analyzed are higher than 0.05, which means that there is not enough evidence to state that smoking affects the concentrations of these elements in the examined brain region. The median concentrations for both groups are very similar, and in many cases identical, which suggests that smoking does not have a significant effect on the level of these elements. Some elements, such as cadmium (Cd) and manganese (Mn), show small differences in median values between groups. For example, the median cadmium concentration in smokers is 0.008 µg/g (w.w.), while in non-smokers it is <DL (0.000 µg/g; w.w.). Similarly, the median manganese concentration in smokers is slightly higher (0.531 µg/g; w.w.) than in non-smokers (0.432 µg/g; w.w.). However, the p values for these elements (0.167 and 0.058, respectively) do not reach statistical significance, indicating that these differences may be due to chance.
In the analysis of differences between smokers and non-smokers for various elements in region E, none of the comparisons showed statistical significance after correction for multiple testing (Tables S1j and S2f, Supplementary Materials). Magnesium (Mg) was the only element for which the differences between groups were close to significance (p = 0.027), which may suggest potential deviations in its concentration. Non-smokers had a higher median (114.053 µg/g; w.w.) compared to smokers (100.910 µg/g; w.w.).
A statistically significant difference was detected in the level of medians for several elements for which p < 0.1 in region F, i.e., Tm (p = 0.054) and Ce (p = 0.072) (Tables S1k and S2g, Supplementary Materials).
A statistically significant difference was detected in the level of medians for elements for which p < 0.1 in region G for Na (p = 0.074). The group of smokers contained more sodium (1588.444 µg/g w.w.) compared to non-smokers (1446.051 µg/g; w.w.) (Tables S1l and S2h, Supplementary Materials).
In region H, the test statistics and p values do not suggest significant differences between groups (Tables S1m and S2i, Supplementary Materials). The only element that shows a significant difference between groups is sodium (Na), where p = 0.010 indicates a statistically significant higher concentration in the smokers group (median 1597.932 µg/g; w.w.) compared to non-smokers (median 1411.739 µg/g; w.w.) (Figure 12). This may suggest some systematic difference in sodium levels between groups.
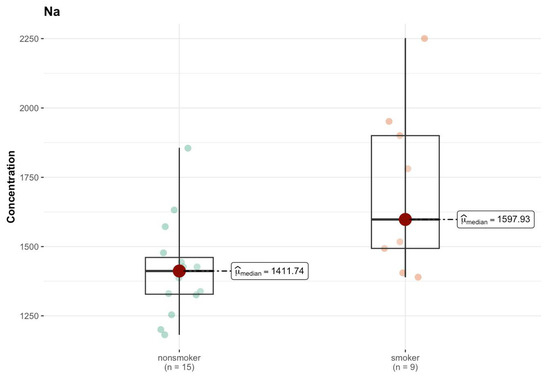
Figure 12.
Comparison of statistically significant difference (p < 0.01) in median values of Na content (µg/g w.w.) in H area of the brain tissue of smokers (n = 9) and non-smokers (n = 15).
In area I, the results of the comparison tests for various elements between the group of smokers and non-smokers indicate a lack of statistically significant differences for most of the analyzed elements (Tables S1n and S2j, Supplementary Materials). One of the few elements for which a lower p value was observed is sodium (Na), for which the test indicates a p value of 0.003, suggesting a statistically significant difference between the groups. The median value of sodium in smokers is higher than that in non-smokers (2044.602 µg/g; w.w. vs. 1765.695 µg/g; w.w.), which indicates this element was present at different levels in the analyzed samples (Figure 13). For lead (Pb), the p value of 0.051 is close to the level of significance, which may suggest that the differences in the levels of this element may be significant; however, at the level of 0.05, the result is ambiguous. The medians are low, and amount to 0.038 µg/g (w.w.) for non-smokers and <DL (0.000 µg/g; w.w.) for smokers, which may suggest a reduction in the levels of this element that were detected in the samples of smokers. Similar results were obtained for Ce (p = 0.097), where the median in both groups was <DL.
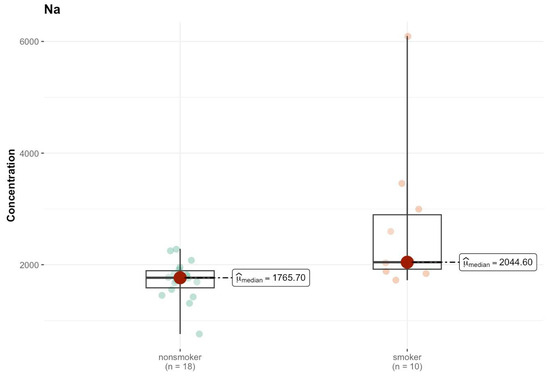
Figure 13.
Comparison of statistically significant differences (p < 0.05) in median values of Na content (µg/g w.w.) in I area of the brain tissue of smokers (n = 10) and non-smokers (n = 18).
In the J region, cadmium (Cd) in the non-smokers group had a median of 0.004 µg/g (w.w.), while among smokers this increased to 0.023 µg/g (w.w.) (Tables S1o and S2k, Supplementary Materials). However, the p-value of 0.554 indicates that this difference is not statistically significant. Chromium (Cr) had a higher median among smokers (0.034 µg/g; w.w.) compared to non-smokers (0.023 µg/g; w.w.), but the p-value (0.544) suggests a lack of statistical significance. For copper (Cu), a difference in the median is observed—3.311 µg/g (w.w.) for non-smokers and <DL (0 µg/g; w.w.) for smokers—which may suggest a difference in the concentration of this element between the groups, but the p-value (0.403) indicates that this difference is not significant. Only Na shows a significant difference in the median—1442.755 µg/g (w.w.) in the non-smokers group and 2402.024 µg/g (w.w.) in the smokers group (Figure 14). The p-value (0.005) suggests that this difference is statistically significant.
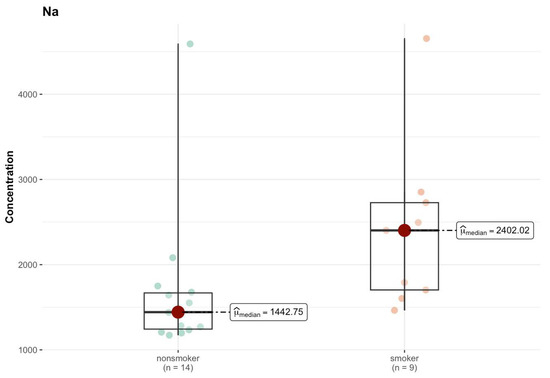
Figure 14.
Comparison of statistically significant differences (p < 0.05) in median values of Na content (µg/g w.w.) in J area of the brain tissue of smokers (n = 9) and non-smokers (n = 14).
In the K region, the aluminum (Al) level showed a significant difference (p = 0.030), although both groups had a median smaller than that of DL (0 µg/g; w.w.) (Tables S1p and S2l, Supplementary Materials). This may mean that despite the zero median in both groups, higher concentration values of this element were present in the smokers’ samples, which suggests that smoking influences its presence in the body. For sodium (Na), the median in the smokers’ group was clearly higher (2086.35 µg/g; w.w.) compared to non-smokers (1770.87 µg/g; w.w.), and the test result (p = 0.057) was close to the borderline of statistical significance (Figure 15).
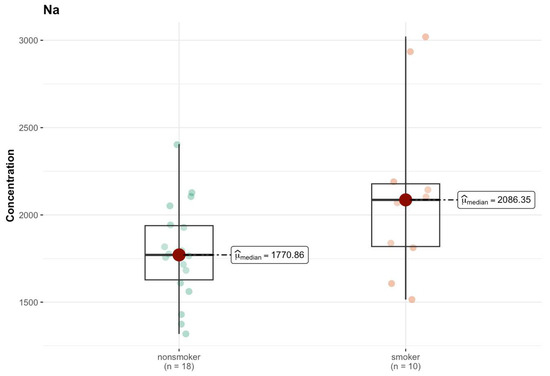
Figure 15.
Comparison of difference in median values of Na content (µg/g w.w.) in the K area of the brain tissue of smokers (n = 10) and non-smokers (n = 18).
2.5. Comparison of Elemental Content in Spinal Cord Between Smokers and Non-Smokers
In the case of the spinal cord (Tables S1r and S2m, Supplementary Materials), the distribution of elements according to the median values is presented in Figure 16. The elemental analysis of spinal cord tissue revealed high concentrations (3500–100 µg/g; w.w.) of phosphorus (P), potassium (K), sodium (Na), and magnesium (Mg). Trace elements, including calcium (Ca), iron (Fe), zinc (Zn), rubidium (Rb), and manganese (Mn), were detected within the range of 60–0.6 µg/g (w.w.). Additionally, selenium (Se), strontium (Sr), chromium (Cr), vanadium (V), and cadmium (Cd) were present at concentrations between 0.2 and 0.02 µg/g (w.w.). The elemental distribution reflects the metabolic activity and ionic regulation essential for the function and integrity of neural tissues.
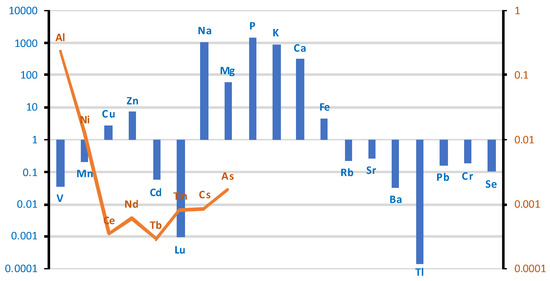
Figure 16.
Comparison of differences in mean values of individual elements at a logarithmic scale in spinal cord tissue between groups of smokers and non-smokers. Blue bar represents log(case mean–control mean); orange line represents log(control mean–case mean).
In the case group, the spinal cord tissue contains more V, Mn, Cu, Zn, Cd, Lu, Na, Mg, P, K, Ca, Fe, Rb, Sr, Ba, Tl, Pb, Cr, and Se. Lower concentrations compared to the control group were observed for the following elements: Al, Ni, Ce, Nd, Tb, Tm, Cs, and As. For a large group of elements including Co, La, Pr, Sm, Eu, Gd, Dy, Ho, Er, Yb, Be, B, and Sb, the detected changes were outside the detection limit.
The results of the Mann–Whitney test indicate that only sodium (Na) concentration differs statistically significantly between the smokers and non-smokers (p = 0.040). Phosphorus (p) (p = 0.056) and zinc (Zn) (p = 0.065) show p values close to the significance threshold, but do not exceed it. These results should be considered as guidelines for further research. Similarly, selenium (Se) (p = 0.087), despite its role in neutralizing oxidative stress (related to smoking), did not show a significant difference, although the p value suggests a certain trend (Figure S3, Supplementary Materials).
3. Discussion
An important aspect of cigarette smoking is the disruption of microelement and trace element homeostasis and the accumulation of toxic elements. Toxic metals, together with other toxins, enter the body through tobacco smoke.
The use of the Mann–Whitney U test in this study was dictated by the characteristics of the data obtained. Elemental concentrations measured in post-mortem human tissues did not follow a normal distribution, as verified through descriptive statistics and exploratory data analysis. These deviations from normality are typical in biological and environmental datasets, especially when the sample size is limited and includes many non-detects or values below the detection limit. Given the non-normal distribution of data and the relatively small sample sizes in both the smoker and non-smoker groups, a non-parametric statistical approach was the most appropriate. The Mann–Whitney U test is a widely used non-parametric alternative to Student’s t-test that does not require the assumption of normality or homogeneity of variances. It compares the medians of two independent groups and is suitable for ordinal or continuous data that are skewed or contain outliers. In this study, the Mann–Whitney U test was applied consistently across tissue types to compare the concentrations of individual chemical elements between smokers and non-smokers. The test allowed for the identification of statistically significant differences (e.g., in aluminum, lead, copper, sodium, and thallium levels), while minimizing the risk of erroneous conclusions that might result from applying parametric tests to non-normally distributed data. The decision to use this test enhances the reliability of the findings and ensures their methodological adequacy.
A statistically significantly higher Al content was found in smokers’ bronchial and lung tissue. The scatter in Figure 2 suggests that Al accumulation in the bronchi of smokers may be a function of the length of exposure, type of smoking (cigarettes vs. pipe), and tobacco source. A similar trend was observed for the Tl content in the liver of smokers, as shown in Figure 6c. On the other hand, the concentration of elements such as Cu, Rb, and Se in the bronchial tissue was lower than that in the control tissue, and the p-values in these cases were close to the limit of 0.05. It is known that Al is an element that has no physiological function and is toxic even at low concentrations [62]. Se and Cu, on the other hand, are essential trace elements that are responsible for the activity of enzymes that form the body’s antioxidant barrier. Se, as a component of selenoproteins (GPx1, GPx2, GPx4), also plays an antiviral role, and is responsible for male reproductive functions and for maintaining the integrity of membranes in the gastrointestinal tract; and Se-dependent iodothyronine deiodinase enzymes (Dio1, Dio2) are responsible for intrathyroidal iodine metabolism [63,64,65]. Cu deficiency and impaired homeostasis of this element can disrupt many processes that are key to the body’s immune and antioxidant defenses, iron metabolism, neurotransmission, energy metabolism, and erythropoiesis, and negatively affect skeletal development and melanin synthesis [66,67,68]. Therefore, Cu and Se dyshomeostasis, along with other elements such as Zn and Mg, may occur in pathological conditions associated with oxidative stress and inflammation [69,70,71,72,73,74,75].
The biological role of Rb in the human body is not fully understood. Studies suggest that Rb is similar to K and Cs in its behavior in physiological processes. Rb may therefore be involved in K metabolism, especially since Na+/K+ ATPase has the same affinity for K as Rb [76,77]. In the central nervous system (CNS), Rb increases synaptic dopamine and norepinephrine levels and acts similarly to serotonin. Several experiments in animal models and humans have been described in which the administration of rubidium chloride was found to be as effective as tricyclic antidepressants in the treatment of depressive disorders [78,79]. The problem in diagnosing excess/deficiency is the lack of reference ranges for trace elements such as Rb and the need to use highly specialized analytical techniques for their determination, such as ICP-MS and inductively coupled plasma optical emission spectrometry (ICP-OES). In summary, Rubidium is not a natural element in homo sapiens and is not considered essential to any organism [80]. Although Rb can partially replace K, and there is a possibility that it may have modest beneficial effects under certain conditions, it should be considered a form of toxicity.
A significantly higher Al content was also found in the lung tissue of smokers. There was also an accumulation of rare earth elements, i.e., Ce, Pr, Nd, Pr, Sm, Eu, Dy, and Er. Rare earth elements are poorly understood in terms of their presence in tissues and their potential role in the body. Lanthanides are similar in terms of their physico-chemical properties. The ionic form occurs in oxidation state +3, and less commonly in oxidation states +2 and +4. It is generally believed that these elements have low toxicity and can be used in medicine for diagnosis and therapy. For example, Gd 3+ has been used as a contrast agent in magnetic resonance imaging (MRI) [81,82]. There is even a hypothesis that lanthanides act as Ca analogs in biological systems. Although this hypothesis originated in the last century, further research is needed [83,84,85]. A significantly higher concentration of Dy was observed in the right lung of the study group, and, in addition, statistical significance was achieved in the left lung for Er, Nd, Pr, Sm, and Mn, as well as Na and Sr. There were also many strong positive interelement correlations for Al vs. Pr, Nd, Sm, Er, and Dy. In the group of smokers, the correlations were weaker in the right lung than in the left lung, indicating not only the effect of smoking on the balance of elements in the body, but also the asymmetric distribution of elements in the two lungs.
Liver tissue from smokers contained significantly more toxic Pb and Tl and less Cu than the control group. A strong K-Rb correlation was observed in the non-smoker group (r = 0.81, CI = [0.53, 0.93], p = 0.04), confirming the similarity described above in terms of the role these elements play in physiological processes. However, most of the observed correlations concern rare earth elements, the role of which is poorly understood. The increased accumulation of Pb, one of the most toxic heavy metals, may be of concern [86]. Many studies confirm that most Pb accumulates in the liver [87,88]. The toxicity of Pb is due to the generation of oxidative stress and the depletion of antioxidant systems, resulting in damage [89].
This observation may explain a report published in Nature showing a high probability of developing non-alcoholic fatty liver disease as a result of smoking [90] and other reports linking smoking with an increased risk of fibrosis and the development of hepatocellular carcinoma [91].
At the same time, Cu levels were significantly lower in the livers of smokers. Previously published reports refer to the level of Cu in body fluids, and smokers were found to have lower urinary copper concentrations [92], while plasma copper concentrations were significantly higher in smokers than in non-smokers (120 ± 19 vs. 100 ± 16 μg/dL, p < 0.01 [93,94].
There were no significant differences in the spinal cord (apart from a higher Na content in the smokers group), but the presence of a higher concentration of toxic elements Pb, Cr, Al, and Cd in the smokers group is worth noting.
The smoker’s brain contained significantly more Na and less Cu compared to non-smokers. Studies to date on the effects of smoking on Na levels in the body have yielded inconsistent results. Most studies indicate that smokers may have higher serum Na levels than non-smokers. Other authors point to the fact that smoking is associated with a greater preference for salty foods and potentially increased Na intake [95]. The difference in Na levels between smokers and non-smokers in brain tissues may also be due to other reasons. Na is highly regulated in all tissues and is abundant, at ~1200 ug/g in adult brains [96]. Figure 8b and Figure 14 show higher levels of Na spreading in smokers than in non-smokers. These higher Na levels may be due to smoking-related vascular disorders, high blood pressure, poor circulation, and stroke [97]. Analyzing individual areas, it was possible to notice that they had a similar chemical composition, and the differences between groups rarely reached statistical significance. Cd accumulated in areas B and J, and aluminum in area K (insula). The insula is part of the cerebral cortex and is located in the lateral sulcus depression. This is an area that is responsible for understanding human behavior, considered the center of our emotions, intuition, and empathy, but it also participates in the perception of taste and smell, regulates the work of internal organs (blood pressure, heart rate), and integrates the functions of the vestibular system. There are indications that the insula is involved in the existence of addictions. In area B (precentral gyrus), there was more As, Cd, and Mn in the brains of smokers compared to non-smokers, but statistical significance was not reached. The precentral gyrus is part of the primary motor cortex. This part of the brain is responsible for the control of voluntary movements; therefore, any damage to the precentral gyrus affects the upper motor neurons. The location of the precentral gyrus above the pyramidal chiasm causes motor dysfunctions, i.e., muscle weakness, especially distal ones, pathological reflexes (Babinski’s sign), and increased muscle tone with spasticity, to appear on the opposite side of the body [98].
This study investigated the elemental composition of approximately 400 human tissue samples collected from smokers and non-smokers, focusing on the quantification of 41 chemical elements using advanced analytical methodologies. Macroelements P, K, Na, Mg, and Ca were consistently among the most abundant across all tissues. The spinal cord and brain exhibited the highest macroelement concentrations. Microelements Fe and Zn were present across all tissues; Rb and Mn also appeared frequently, with Cu and Se being particularly prominent in liver and brain tissues. Toxic Elements Pb and Cd were detected in all tissues. Notably, brain tissues showed higher levels of Pb and Al, with the additional detection of Ba, Cs, and As. These findings align with earlier reports associating cadmium and aluminum exposure with neurodegenerative diseases and cognitive impairments [99], but uniquely highlight smoking as a significant source of metal accumulation within neural tissues. Smokers exhibited markedly higher concentrations of aluminum (Al) in bronchial and pulmonary tissues. Furthermore, liver samples from smokers demonstrated elevated levels of lead (Pb), thallium (Tl), and rare earth elements (REEs). These findings highlight the distinct elemental profiles of different tissues, reflecting their physiological roles and exposure risks. It can be concluded that the systemic impact of tobacco smoke exposure promotes the bioaccumulation of toxic metals and trace elements across critical organs, underscoring the potential long-term health risks associated with smoking. The accumulation of toxic elements in neurologically sensitive tissues such as the brain and spinal cord suggests potential environmental and health concerns that merit further research.
The study is limited by the relatively small population included in the study. Therefore, in addition to statistically significant differences between the levels of the elements in the groups being compared, the trends of changes deserve attention, especially those close to the significance level. In addition, the results obtained refer only to the inhabitants of south-eastern Poland, which is associated with difficult-to-determine exposure to various environmental toxins and different available brands of cigarettes. The high variability of the measured values, expressed by the SD, as well as the high kurtosis, indicate the presence of outliers for many elements.
4. Materials and Methods
4.1. Studied Population and Sample Characterization
Tissue samples were collected during autopsies performed at the request of the prosecutor at the Department of Forensic Medicine of the Medical University of Lublin. Consent to tissue collection was approved by the Bioethics Committee of the Medical University of Lublin (approval number KE-0254/181/2021). According to Polish law, securing biological material during forensic autopsies requires the consent of the prosecutor supervising the proceedings. Such a decision is not dependent on obtaining additional consent from the family members of the deceased person. All the samples were obtained from cadavers during a medicolegal autopsy performed no later than 24–48 h after death. All of them were victims of sudden death (mors subita) after road accidents and suicides.
The demographic characteristics of the study population are summarized in Table 4. Fisher’s exact test statistic (0.2264) indicated that the gender distribution between groups was not statistically significant. The Mann–Whitney U test was used to compare mean age, weight, and BMI values between groups. Statistical significance was set at p < 0.05.
Table 4.
Demographic characteristics of the patient groups enrolled in the study.
The research material was collected during autopsies from cerebral hemispheres (n = 28), liver (n = 26), bronchi (n = 27), lungs (n = 55), and spinal cord (n = 23). Brain samples were collected from the following areas: A—frontal pole (n = 28); B—precentral gyrus (n = 26); C—postcentral gyrus (n = 27); D—cingulate gyrus (n = 26); E—hippocampus (n = 25); F—head of caudate nucleus (n = 26); G—superior longitudinal fasciculus of brain, SLF (n = 27); H—inferior longitudinal fasciculus of brain, ILF (n = 27); I—dorsal thalamus (n = 28); J—nucleus accumbens septi, NAc (n = 26); K—insula (n = 28).
Belonging to the study/control (smoker/non-smoker) group was determined based on post-mortem documentation in accordance with the established criteria. The study/control group was selected based on the absence/presence of signs of smoking addiction resulting from documentation and a macroscopic evaluation of features attributed to tobacco smokers.
Lung tissue damage includes smoking-related interstitial lung diseases (SR-ILD), i.e., interstitial lung damage, edema, inflammation, idiopathic pulmonary fibrosis (IPF), diaphragm muscle atrophy, lobular emphysema, combined pulmonary fibrosis and emphysema (CPFE), and lung cancer, which belong to a wide range of characteristic abnormalities and clinical pictures observed in the respiratory system of tobacco smokers [100]. Smoking-related interstitial fibrosis (SRIF) (Figure 17) is a common and morphologically characteristic finding in the lung tissue of cigarette smokers. It can be distinguished histologically from idiopathic interstitial pneumonias and other causes of interstitial lung fibrosis. SRIF is characterized by dense thickening of the alveolar septa by thick collagen bundles with a glassy appearance, with a common admixture of hyperplastic smooth muscle bands [101].
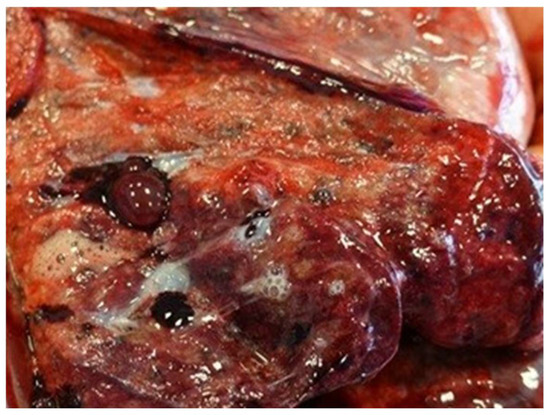
Figure 17.
Pathological changes observed in Smoking-Related Interstitial Fibrosis (SRIF).
Macroscopic assessment of the skin includes features characteristic of smokers, such as premature aging, yellowing of the fingers and nails (Figure 18), and fat accumulation around the waist and upper trunk, with less around the hips [102,103].
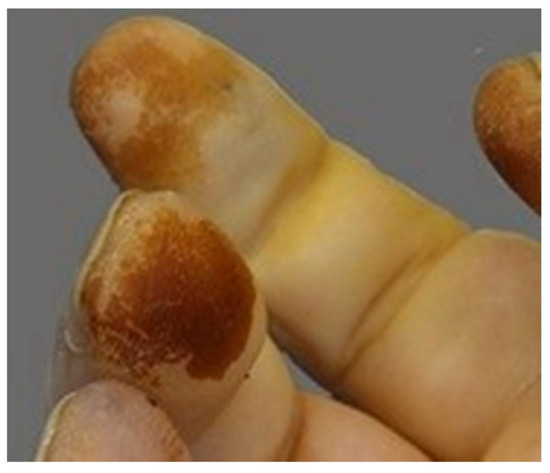
Figure 18.
Yellowing of a smoker’s fingers.
Oral conditions in smokers include darker pigmentation of the gingiva (“smoker’s melanosis”); lingual leukoplakia (“smoker’s tongue”, Figure 19), characterized by white spots or patches on the tongue or vulva; and a grayish-white palate with red nodules (nodules) signifying inflammation of the salivary glands (“smoker’s palate”/nicotine stomatitis) [104].
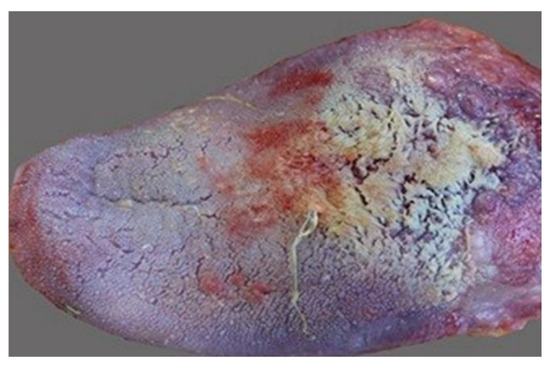
Figure 19.
Smoker’s tongue.
Regarding blood and urine alcohol levels in the case group, 3 out of 10 individuals exhibited blood alcohol levels ranging from 0.82 to 5.07, while in the control group, 8 out of 16 individuals had blood alcohol levels ranging from 0.63 to 3.23. The urine alcohol levels recorded were 2.57.
4.2. Sample Collection Procedure
Tissue samples were collected by qualified pathologists. Samples weighing 0.5–1.5 g were rinsed with ultrapure water (Milli-Q, Millipore, Raleigh, NC, USA; resistivity: 18.2 MΩ cm), dried on a sterile filter paper, weighed on an analytical balance, and stored in decontaminated polypropylene tubes at −80 °C until further analysis. Instruments (knives, forceps and scissors) used during autopsy were immersed in 10% HNO3 and then rinsed with ultrapure deionized water to minimize the likelihood of sample contamination.
4.3. Sample Preparation
Tissue samples were predigested with 7 mL of 69% Suprapur Nitric Acid 65% HNO3 (Baker, Radnor, PA, USA) and 1 mL of deionized water. Closed digestion was performed in closed Teflon containers using a microwave digester using a Mars 6 microwave system (CEM, Matthews, NC, USA). Microwave digestion was performed according to the program: 20 min at maximum temperature 185 °C, with a rise time of 10 min and holding time of 10 min. After digestion, the digests were quantitatively transferred to sterile Falcon polypropylene conical tubes with Plug-Seal caps and 1 mL of 35% HCl ultrapure for trace metal analysis (Baker, Radnor, PA, USA) was added to stabilize some elements (As, Se, Mo, Tl). The sample was then diluted to a total volume of 25.0 mL by ultrapure water (>18.2 MΩ cm at 25 °C) obtained via the Milli-Q purification system (Millipore, Darmstadt, Germany). A sample without tissue was used as a control.
4.4. Measurements Using ICP MS
All samples were analyzed using ICP MS (PQ MS Q, Analytik Jena, Germany), which is equipped with Integrated Collision-Reaction Cell (iCRC). All detailed operating parameters are provided in the Supplementary Material (Table S1, Supplementary Materials). Multiple certified reference materials (CRMs) were used to validate the ICP MS method (Table S3, Supplementary Materials). The selected CRMs, representing a similar matrix, were used for quality control of the analysis process, e.g., DB001 (human hair), ERM BB 184 (bovine muscle), and BCR 185R (bovine liver), achieving acceptable recovery (80–120%) for most elements (Table S4, Supplementary Materials). For elements with uncertified content, the standard addition method was additionally used. An internal standard of 5 ug L−1 (Li6, Sc, Y, Rh, Ir, Bi) was added to all solutions, being pumped to the nebulizer through the Y-shape connector by a separate channel of the spectrometer peristaltic pump. The multielement internal standard allowed for control of both the sample introduction system and the mass analyzer and detection system. Table S5 (Supplementary Materials) presents the DL values for chemical elements measured by ICP MS.
4.5. Statistical Analysis
Descriptive statistics were calculated for all tissues examined separately for the control and studied groups. All elements were characterized by right-sided asymmetry in terms of concentration, so the t-test could not be used to test the significance of differences between groups, as this requires a normal probability of distribution in both groups, especially when groups are relatively small.
Given the clear deviations from normality, as indicated by the high skewness and kurto-sis values, nonparametric methods were used to verify mutual differences between groups [105]. The Mann–Whitney U test, also known as the Wilcoxon rank-sum test applied in the article, is a non-parametric statistical method used to compare differences between two independent groups when the assumption of normal distribution is not met [106,107]. This test is particularly useful in analyzing data that is skewed, ordinal, or has unequal variances, making it a robust alternative to the traditional t-test. The Mann–Whitney U test operates by ranking all data from both groups together; it then calculates the sum of ranks for each group and uses these rank sums to evaluate the differences between the groups. The primary hypothesis tested by the Mann–Whitney U test is whether one group tends to have higher or lower values than the other, without assuming any specific distributional form for the data. This makes the Mann–Whitney U test highly applicable in medicine, psychology, and environmental science, where data may not typically conform to normal distributions due to natural variability, measurement methods, or sample sizes.
The Mann–Whitney U test is robust to nonnormality and small sample sizes [108]. Bonferroni correction was applied to adjust for multiple comparisons and control the family-wise error rate, thus ensuring that significant results were not artifacts of multiple hypothesis testing [109]. p < 0.05 was considered as statistically significant.
Box and whisker plots were used to visually compare median values, interquartile ranges, and potential outliers, facilitating the identification of trends and variability between groups [110]. To examine patterns of element concentrations in smokers and non-smokers, PCA analysis was performed as a dimensionality reduction technique [111]. PCA analysis was performed on standardized data to ensure the equal weighting of variables, taking into account the different values of element concentrations [112,113].
5. Conclusions
Cigarette smoking remains a major source of exposure to toxic elements, contributing to the accumulation of heavy metals in vital organs. This study provides the first comprehensive analysis of 41 chemical elements in the post-mortem tissues of chronic smokers, revealing significant alterations in essential metals’ homeostasis and the accumulation of toxic elements. The deposition of Al, Pb, and Tl in the bronchi, lungs, and liver highlights the long-term toxic effects of smoking and possibly the induction of oxidative stress, ultimately leading to organ damage and linking smoking to an increased risk of liver or lung fibrosis. Once in the bloodstream, metals are systemically transported and can accumulate in secondary target organs in the central nervous system, accumulating Cd in selected brain regions. The findings emphasize the need for regular monitoring of tobacco products for toxic elements and further research into the mechanisms of their accumulation and potential health effects.
Supplementary Materials
The following supporting information can be downloaded at: https://www.mdpi.com/article/10.3390/ijms26136368/s1.
Author Contributions
Conceptualization, W.F., G.T., J.F. and R.M.; methodology, P.N., Z.W., J.P. and A.T.; software, D.M. and P.N.; validation, A.T., A.F. and W.F.; formal analysis, A.P., Z.W. and J.P.; investigation, W.F., A.T., A.P. and A.F.; resources, P.N., G.T., J.B. and A.F.; data curation, D.M., Z.W., A.P. and J.P.; writing—original draft preparation, W.F., J.F. and J.B.; writing—review and editing, J.F., P.N. and G.T.; visualization, W.F., A.P., D.M. and J.B.; supervision, R.M., P.N. and J.F.; project administration, R.M. and G.T.; funding acquisition, R.M., G.T. and J.F. All authors have read and agreed to the published version of the manuscript.
Funding
This research received no external funding.
Institutional Review Board Statement
The study was conducted in accordance with the Declaration of Helsinki, and approved by the Bioethics Committee of the Medical University of Lublin (approval number KE-0254/181/2021).
Informed Consent Statement
Not applicable.
Data Availability Statement
The original contributions presented in this study are included in the article/Supplementary Material. Further inquiries can be directed to the corresponding authors.
Conflicts of Interest
The authors declare no conflicts of interest.
Abbreviations
The following abbreviations are used in this manuscript:
| CNS | The central nervous system |
| COPD | Chronic obstructive pulmonary disease |
| CPFE | Combined pulmonary fibrosis and emphysema |
| DL | Limit of detection |
| FDA | The US Food and Drug Administration |
| HPT | Heated tobacco products |
| GYTS | Global Youth Tobacco Survey |
| iCRC | Integrated collision–reaction cell |
| SRIF | Smoking-related interstitial fibrosis |
| NHANES | The National Health and Nutrition Examination Survey |
| ICP-OES | Inductively coupled plasma optical emission spectroscopy |
| MRI | Magnetic resonance imaging |
| PCA | Principal component analysis |
| SLF | Superior longitudinal fasciculus of brain |
| ILF | Inferior longitudinal fasciculus of brain |
| NAc | Nucleus accumbens septi |
| SR-ILD | Smoking-related interstitial lung diseases |
| IPF | Idiopathic pulmonary fibrosis |
| ICP-MS | Inductively coupled plasma mass spectrometry |
| WHO | World Health Organization |
| w.w. | Wet weight |
References
- Family Smoking Prevention and Tobacco Control Act. 22 June 2009. Public Law 111-31. Available online: http://www.gpo.gov/fdsys/pkg/PLAW-111publ31/pdf/PLAW-111publ31.pdf (accessed on 2 December 2013).
- USA Department of Health and Human Services. How Tobacco Smoke Causes Disease: The Biology and Behavioral Basis for Smoking-Attributable Disease: A Report of the Surgeon General; USA Department of Health and Human Services, Centers for Disease Control and Prevention, National Center for Chronic Disease Prevention and Health Promotion, Office on Smoking and Health: Atlanta, GA, USA, 2010.
- Claire, S.S.; Fayokun, R.; Commar, A.; Schotte, K.; Prasad, V.M. The world health organization’s world no tobacco day 2020 campaign exposes tobacco and related industry tactics to manipulate children and young people and hook a new generation of users. J. Adolesc. Health 2020, 67, 334–337. [Google Scholar] [CrossRef] [PubMed]
- Vogelmeier, C.F.; Criner, G.J.; Martinez, F.J.; Anzueto, A.; Barnes, P.J.; Bourbeau, J.; Celli, B.R.; Chen, R.; Decramer, M.; Fabbri, L.M.; et al. Global Strategy for the Diagnosis, Management, and Prevention of Chronic Obstructive Lung Disease 2017 Report. GOLD Executive Summary. Am. J. Respir. Crit. Care Med. 2017, 195, 557–582. [Google Scholar] [CrossRef] [PubMed]
- Adeloye, D.; Chua, S.; Lee, C.; Basquill, C.; Papana, A.; Theodoratou, E.; Nair, H.; Gasevic, D.; Sridhar, D.; Campbell, H.; et al. Global and regional estimates of COPD prevalence: Systematic review and meta-analysis. J. Glob. Health 2015, 5, 020415. [Google Scholar] [CrossRef]
- Hu, C.W.; Cooke, M.S.; Chang, Y.J.; Chao, M.R. Direct-acting DNA ethylating agents associated with tobacco use primarily originate from the tobacco itself, not combustion. J. Hazard. Mater. 2018, 358, 397–404. [Google Scholar] [CrossRef]
- National Health Fund on Health. Tobacco-Related Diseases (in Polish: NFZ o Zdrowiu. Choroby Odtytoniowe). Available online: https://ezdrowie.gov.pl/portal/home/badania-i-dane/zdrowe-dane/raporty/nfz-o-zdrowiu-choroby-odtytoniowe (accessed on 7 July 2021).
- Jiang, W.; Liu, X.; Lei, Q.; Xiao, M.; Li, M.; Ma, Y.; Hu, C.; Kong, X.; Qi, L.; Wu, H.; et al. Long-term exposure to third-hand smoke could accelerate biological aging via mitochondrial dysfunction: Evidence from population and animal studies. J. Hazard. Mater. 2024, 480, 136061. [Google Scholar] [CrossRef]
- Azeez, S.O.; Saheed, I.O.; Ashiyanbola, I.O. Assessment of Cr, Cd and Pb levels in tobacco leaves and selected cigarette samples from Ilorin Metropolis Kwara State, Nigeria. J. Appl. Sci. Environ. Manag. 2019, 22, 1937. [Google Scholar] [CrossRef]
- Hussain, A.; Ahmad, U.; Khan, Z.I.; Ahmad, K. Evaluation of heavy metals in various brands of tobacco cigarettes marketed in pakistan and their implications in public health. J. Health Rehabil. Res. 2024, 4, 1–8. [Google Scholar] [CrossRef]
- Global Youth Tobacco Survey, Poland 2022. Last Updated 23 January 2025. Available online: https://extranet.who.int/ncdsmicrodata/index.php/catalog/971 (accessed on 31 October 2024).
- Minardi, V.; Asta, F.; Timelli, L.; Spizzichino, L.; Gorini, G.; Contoli, B.; Masocco, M. Usage and accessibility of cigarettes, electronic cigarettes, and heated tobacco products among 13–15-year-old students in Italy: Temporal trend results from the Global Youth Tobacco Survey (GYTS), 2010–2022. Tob. Prev. Cessat. 2023, 9 (Suppl. S2), A38. [Google Scholar] [CrossRef]
- Saiphoklang, N.; Poachanukoon, O.; Soorapan, S. Smoking characteristics and lung functions among university athletes. Sci. Rep. 2020, 10, 20118. [Google Scholar] [CrossRef]
- Talhout, R.; Schulz, T.; Florek, E.; Benthem, J.V.; Wester, P.; Opperhuizen, A. Hazardous compounds in tobacco smoke. Int. J. Environ. Res. Public Health 2011, 8, 613–628. [Google Scholar] [CrossRef]
- Wang, S.Q.; Bao, L.J.; Li, T.Y.; Zeng, E.Y. Potential health risk of human exposure to tobacco-specific nitrosamines in second-hand and third-hand smoke. J. Hazard. Mater. 2024, 480, 136446. [Google Scholar] [CrossRef] [PubMed]
- Oliveira, M.; Slezakova, K.; Magalhães, C.P.; Fernandes, A.; Teixeira, J.P.; Delerue-Matos, C.; Pereira, M.D.C.; Morais, S. Individual and cumulative impacts of fire emissions and tobacco consumption on wildland firefighters’ total exposure to polycyclic aromatic hydrocarbons. J. Hazard. Mater. 2017, 334, 10–20. [Google Scholar] [CrossRef] [PubMed]
- Rodgman, A.; Perfetti, T.A. The Chemical Components of Tobacco and Tobacco Smoke; CRC Press: Boca Raton, FL, USA, 2009. [Google Scholar]
- European Commission. Ambient Air Pollution by AS, CD and NI Compounds: Position Paper—Final Version; LUA NRW.: Essen, Germany, 2001. [Google Scholar]
- Lugon-Moulin, N.; Martin, F.; Krauss, M.R.; Ramey, P.B.; Rossi, L. Arsenic Concentration in Tobacco Leaves: A Study on Three Commercially Important Tobacco (Nicotiana tabacum L.) Types. Water Air Soil Pollut. 2008, 192, 315–319. [Google Scholar] [CrossRef]
- Pinto, E.; Cruz, M.; Ramos, P.; Santos, A.; Almeida, A. Metals transfer from tobacco to cigarette smoke: Evidences in smokers’ lung tissue. J. Hazard. Mater. 2017, 325, 31–35. [Google Scholar] [CrossRef]
- Bernhard, D.; Rossmann, A.; Wick, G. Metals in cigarette smoke. IUBMB Life 2005, 57, 805–809. [Google Scholar] [CrossRef]
- Iradukunda, A.; Zhang, D.; Proshad, R.; Mperejekumana, P. A review on cadmium contamination in soil and bioaccumulation by tobacco, its source, toxicity and health risk. Asian J. Plant Sci. Res. 2021, 11, 154–163. [Google Scholar]
- Pappas, R.S. Toxic elements in tobacco and in cigarette smoke: Inflammation and sensitization. Metallomics 2011, 3, 1181–1198. [Google Scholar] [CrossRef]
- Tarimo Felix, A.; Ntarisa, A.V. Review of toxic metals in tobacco cigarette brands and risk assessment. J. King Saud Univ. Sci. 2024, 36, 103484. [Google Scholar] [CrossRef]
- Fresquez, M.R.; Pappas, R.S.; Watson, C.H. Establishment of Toxic Metal Reference Range in Tobacco from U.S. Cigarettes. J. Anal. Toxicol. 2013, 37, 298–304. [Google Scholar] [CrossRef]
- Kazi, T.G.; Jalbani, N.; Arain, M.B.; Jamali, M.K.; Afridi, H.I.; Sarfraz, R.A.; Shah, A.Q. Toxic metals distribution in different components of Pakistani and imported cigarettes by electrothermal atomic absorption spectrometer. J. Hazard. Mater. 2009, 163, 302–307. [Google Scholar] [CrossRef]
- IARC Working Group on the Evaluation of Carcinogenic Risks to Humans. Tobacco Smoke and Involuntary Smoking. In IARC Monographs on the Evaluation of Carcinogenic Risks to Humans; World Health Organization, International Agency for Research on Cancer: Lyon, France, 2004; Volume 83. [Google Scholar]
- Food and Drug Administration. Harmful and Potentially Harmful Constituents in Tobacco Products and Tobacco Smoke; FDA–2012–N–0143; Established List. FDA.: Rockville, MD, USA, 2012.
- Matassa, R.; Cattaruzza, M.S.; Sandorfi, F.; Battaglione, E.; Relucenti, M.; Familiari, G. Direct imaging evidences of metal inorganic contaminants traced into cigarettes. J. Hazard. Mater. 2021, 411, 125092. [Google Scholar] [CrossRef] [PubMed]
- Satarug, S.; Moore, M.R. Adverse health effects of chronic exposure to low-level cadmium in foodstuffs and cigarette smoke. Environ. Health Perspect. 2004, 112, 1099–1103. [Google Scholar] [CrossRef] [PubMed]
- Arain, M.B.; Kazi, T.G.; Jamali, M.K.; Jalbani, N.; Afridi, H.I.; Kandhro, G.A.; Ansari, R.; Sarfraz, R.A. Hazardous impact of toxic metals on tobacco leaves grown in contaminated soil by ultrasonic assisted pseudo-digestion: Multivariate study. J. Hazard. Mater. 2008, 155, 216–224. [Google Scholar] [CrossRef]
- Özcan, M.M.; Aljuhaimi, F.; Uslu, N.; Ghafoor, K.; Mohamed Ahmed, I.A.; Babiker, E.E. Distribution of heavy metal and macroelements of Indian and imported cigarette brands in Turkey. Environ. Sci. Pollut. Res. 2019, 26, 28210–28215. [Google Scholar] [CrossRef] [PubMed]
- Eneji, I.S.; Salawu, O.W.; Sha’ato, R. Analysis of heavy metals in selected cigarettes and tobacco leaves in Benue state. Niger. J. Sci. 2013, 3, 244–247. [Google Scholar]
- Viana, G.F.; Garcia, K.S.; Menezes-Filho, J.A. Assessment of carcinogenic heavy metals levels in Brazilian cigarettes. Environ. Monit. Assess 2001, 181, 255–265. [Google Scholar] [CrossRef]
- O’Connor, R.J.; Li, Q.; Stephens, W.E.; Hammond, D.; Elton-Marshall, T.; Cummings, K.M.; Giovino, G.A.; Fong, G.T. Cigarettes sold in China: Design, emissions and metals. Tob. Control 2010, 19, i47–i53. [Google Scholar] [CrossRef]
- Stephens, W.E.; Calder, A.; Newton, J. Source and health implications of high toxic metal concentrations in illicit tobacco products. Environ. Sci. Technol. 2005, 39, 479–488. [Google Scholar] [CrossRef]
- Pappas, R.S.; Polzin, G.M.; Watson, C.H.; Ashley, D.L. Cadmium, lead, and thallium in smoke particulate from counterfeit cigarettes compared to authentic US brands. Food Chem. Toxicol. 2007, 45, 202–209. [Google Scholar] [CrossRef]
- Ziarati, P.; Mousavi, Z.; Pashapour, S. Analysis of heavy metals in cigarette tobacco. J. Med. Discov. 2016, 2, jmd16006. [Google Scholar] [CrossRef]
- Su, X.; Narayanan, M.; Shi, X.; Chen, X.; Li, Z.; Ma, Y. Mitigating heavy metal accumulation in tobacco: Strategies, mechanisms, and global initiatives. Sci. Total Environ. 2024, 926, 172128. [Google Scholar] [CrossRef]
- Gou, Z.; Liu, C.; Qi, M.; Zhao, W.; Sun, Y.; Qu, Y.; Ma, J. Machine learning-based prediction of cadmium bioaccumulation capacity and associated analysis of driving factors in tobacco grown in Zunyi City, China. J. Hazard. Mater. 2024, 463, 132910. [Google Scholar] [CrossRef] [PubMed]
- Wertz, M.S.; Kyriss, T.; Paranjape, S.; Glantz, S.A. The toxic effects of cigarette additives. Philip Morris’ project mix reconsidered: An analysis of documents released through litigation. PLoS Med. 2011, 8, e1001145. [Google Scholar] [CrossRef] [PubMed]
- Tellez-Plaza, M.; Navas-Acien, A.; Caldwell, K.L.; Menke, A.; Muntner, P.; Guallar, E. Reduction in cadmium exposure in the United States population, 1988–2008: The contribution of declining smoking rates. Environ. Health Perspect. 2012, 120, 204–209. [Google Scholar] [CrossRef]
- Dorne, J.L.; Kass, G.E.; Bordajandi, L.R.; Amzal, B.; Bertelsen, U.; Castoldi, A.F.; Heppner, C.; Eskola, M.; Fabiansson, S.; Ferrari, P.; et al. Human risk assessment of heavy metals: Principles and applications. Met. Ions Life Sci. 2011, 8, 27–60. [Google Scholar] [PubMed]
- Ntarisa, A.V. Heavy metals concentration and human health risk assessment in tobacco cigarette products from Tanzania. Chin. J. Anal. Chem. 2024, 52, 100428. [Google Scholar] [CrossRef]
- Marano, K.M.; Naufal, Z.S.; Kathman, S.J.; Bodnar, J.A.; Borgerding, M.F.; Garner, C.D.; Wilson, C.L. Cadmium exposure and tobacco consumption: Biomarkers and risk assessment. Regul. Toxicol. Pharmacol. 2012, 64, 243–252. [Google Scholar] [CrossRef]
- Serdar, M.A.; Akin, B.S.; Razi, C.; Akin, O.; Tokgoz, S.; Kenar, L.; Aykut, O. The correlation between smoking status of family members and concentrations of toxic trace elements in the hair of children. Biol. Trace Elem. Res. 2012, 148, 11–17. [Google Scholar] [CrossRef]
- Gidlow, D.A. Lead toxicity. Occup. Med. 2004, 54, 76–81. [Google Scholar] [CrossRef]
- Stojanović, D.; Nikić, D.; Lazarević, K. The level of nickel in smoker’s blood and urine. Cent. Eur. J. Public Health 2004, 12, 187–189. [Google Scholar]
- Richter, P.A.; Bishop, E.E.; Wang, J.; Swahn, M.H. Tobacco smoke exposure and levels of urinary metals in the U.S. youth and adult population: The National Health and Nutrition Examination Survey (NHANES) 1999–2004. Int. J. Environ. Res. Public Health 2009, 6, 1930–1946. [Google Scholar] [CrossRef] [PubMed]
- Gatzke-Kopp, L.M.; Riis, J.L.; Ahmadi, H.; Piccerillo, H.L.; Granger, D.A.; Blair, C.B.; Thomas, E.A. Environmental tobacco smoke exposure is associated with increased levels of metals in children’s saliva. J. Expo. Sci. Environ. Epidemiol. 2023, 33, 903–910. [Google Scholar] [CrossRef]
- Friberg, L. Health hazards in the manufacture of alkaline accumulators with special reference to chronic cadmium poisoning; a clinical and experimental study. Acta Medica Scand. Suppl. 1950, 240, 1–124. [Google Scholar]
- Friberg, L. Injuries following continued administration of cadmium. preliminary report of a clinical and experimental study. Arch. Indust. Hyg. Occup. Med. 1950, 1, 458–466. [Google Scholar]
- Agency for Toxic Substances & Disease Registry (ATSDR). Toxicological Profile for Cadmium; USA Department of Health and Human Services, Public Health Service: Atlanta, GA, USA, 2012.
- World Health Organization (WHO). Exposure to Cadmium: A Major Public Health Concern; WHO: Geneva, Switzerland, 2010. [Google Scholar]
- Ganguly, K.; Levänen, B.; Palmberg, L.; Åkesson, A.; Lindén, A. Cadmium in tobacco smokers: A neglected link to lung disease? Eur. Respir. Rev. 2018, 27, 170122. [Google Scholar] [CrossRef] [PubMed]
- Nair, A.R.; DeGheselle, O.; Smeets, K.; Van Kerkhove, E.; Cuypers, A. Cadmium-induced pathologies: Where is the oxidative balance lost (or not)? Int. J. Mol. Sci. 2013, 14, 6116–6143. [Google Scholar] [CrossRef]
- Barregard, L.; Fabricius-Lagging, E.; Lundh, T.; Mölne, J.; Wallin, M.; Olausson, M.; Modigh, C.; Sallsten, G. Cadmium, mercury, and lead in kidney cortex of living kidney donors: Impact of different exposure sources. Environ. Res. 2010, 110, 47–54. [Google Scholar] [CrossRef]
- Mannino, D.M.; Holguin, F.; Greves, H.M.; Savage-Brown, A.; Stock, A.L.; Jones, R.L. Urinary cadmium levels predict lower lung function in current and former smokers: Data from the Third National Health and Nutrition Examination Survey. Thorax 2004, 59, 194–198. [Google Scholar] [CrossRef]
- Rokadia, H.K.; Agarwal, S. Serum heavy metals and obstructive lung disease: Results from the National Health and Nutrition Examination Survey. Chest 2013, 143, 388–397. [Google Scholar] [CrossRef]
- Hassan, F.; Xu, X.; Nuovo, G.; Killilea, D.W.; Tyrrell, J.; Da Tan, C.; Tarran, R.; Diaz, P.; Jee, J.; Knoell, D.; et al. Accumulation of metals in GOLD4 COPD lungs is associated with decreased CFTR levels. Respir. Res. 2014, 15, 69. [Google Scholar] [CrossRef]
- Lindén, A.; Sundblad, B.-M.; Ji, J.; Levänen, B.; Midander, K.; Julander, A.; Larsson, K.; Palmberg, L. Extracellular cadmium in the bronchoalveolar space of long-term tobacco smokers with and without COPD and its association with inflammation. Int. J. Chron. Obstruct. Pulmon. Dis. 2016, 11, 1005–1013. [Google Scholar] [CrossRef]
- Exley, C. The toxicity of aluminium in humans. Morphologie 2016, 100, 51–55. [Google Scholar] [CrossRef] [PubMed]
- Verma, P.; Sharma, A.K.; Shankar, H.; Sharma, A.; Rao, D.N. Role of Trace Elements, Oxidative Stress and Immune System: A Triad in Premature Ovarian Failure. Biol. Trace Elem. Res. 2018, 184, 325–333. [Google Scholar] [CrossRef] [PubMed]
- Rayman, M.P. Selenium and human health. Lancet 2012, 379, 1256–1268. [Google Scholar] [CrossRef]
- Hawkes, W.C.; Turek, P.J. Effects of dietary selenium on sperm motility in healthy men. J. Androl. 2001, 22, 764–772. [Google Scholar] [CrossRef] [PubMed]
- Scheiber, I.F.; Dringen, R. Astrocyte functions in the copper homeostasis of the brain. Neurochem. Int. 2013, 62, 556–565. [Google Scholar] [CrossRef]
- Scheiber, I.F.; Mercer, J.F.; Dringen, R. Metabolism and functions of copper in brain. Prog. Neurobiol. 2014, 116, 33–57. [Google Scholar] [CrossRef]
- Uriu-Adams, J.Y.; Keen, C.L. Copper, oxidative stress, and human health. Mol. Aspects Med. 2005, 26, 268–298. [Google Scholar] [CrossRef]
- Fang, X.; Wang, K.; Han, D.; He, X.; Wei, J.; Zhao, L.; Imam, M.U.; Ping, Z.; Li, Y.; Xu, Y.; et al. Dietary magnesium intake and the risk of cardiovascular disease, type 2 diabetes, and all-cause mortality: A dose-response meta-analysis of prospective cohort studies. BMC Med. 2016, 14, 210–223. [Google Scholar] [CrossRef]
- Jurowski, K.; Szewczyk, B.; Nowak, G.; Piekoszewski, W. Biological consequences of zinc deficiency in the pathomechanisms of selected diseases. J. Biol. Inorg. Chem. 2014, 19, 1069–1079. [Google Scholar] [CrossRef]
- Mocchegiani, E.; Giacconi, R.; Muzzioli, M.; Cipriano, C. Zinc, infections and immunosenescence. Mech. Ageing Dev. 2000, 121, 21–35. [Google Scholar] [CrossRef] [PubMed]
- Rayman, M.P. Selenium intake, status, and health: A complex relationship. Hormones 2020, 19, 9–14. [Google Scholar] [CrossRef] [PubMed]
- Arora, M.; Mahat, R.K.; Kumar, S.; Mustafa, I.; Sah, S.P. Study of Trace Elements in Patients of Hypothyroidism with Special Reference to Zinc and Copper. Biomed. J. Sci. Tech. Res. 2018, 6, 11–16. [Google Scholar]
- Zhang, X.; Xia, J.; Del Gobbo, L.C.; Hruby, A.; Dai, Q.; Song, Y. Serum magnesium concentrations and all-cause, cardiovascular, and cancer mortality among U.S. adults: Results from the NHANES I Epidemiologic Follow-up Study. Clin. Nutr. 2018, 37, 1541–1549. [Google Scholar] [CrossRef]
- Kim, D.J.; Xun, P.; Liu, K.; Loria, C.; Yokota, K.; Jacobs, D.R.; He, K. Magnesium intake in relation to systemic inflammation, insulin resistance, and the incidence of diabetes. Diabetes Care 2010, 33, 2604–2610. [Google Scholar] [CrossRef] [PubMed]
- Ikehara, T.; Yamaguchi, H.; Sakai, T.; Miyamoto, H. Kinetic parameters and mechanism of active cation transport in HeLa cells as studied by Rb+ influx. Biochim. Biophys. Acta 1984, 775, 297–307. [Google Scholar] [CrossRef]
- Nielsen, F.H. Nonessential Trace Minerals: Basic Nutritional and Toxicological Aspects. Mol. Genet. Nutr. Asp. Major Trace Miner. 2017, 1, 527–537. [Google Scholar]
- Kordjazy, N.; Haj-Mirzaian, A.; Amiri, S.; Ostadhadi, S.; Kordjazy, M.; Sharifzadeh, M.; Dehpour, A.R. Elevated level of nitric oxide mediates the anti-depressant effect of rubidium chloride in mice. Eur. J. Pharmacol. 2015, 762, 411–418. [Google Scholar] [CrossRef]
- Krachler, M.; Wirnsberger, G.H. Long-term changes of plasma trace element concentrations in chronic hemodialysis patients. Blood Purif. 2000, 18, 138–143. [Google Scholar] [CrossRef]
- Remick, K.A.; Helmann, J.D. The elements of life: A biocentric tour of the periodic table. Adv. Microb. Physiol. 2023, 82, 1–127. [Google Scholar] [CrossRef]
- Morrow, J.R.; Tóth, É. Next-generation magnetic resonance imaging contrast agents. Inorg. Chem. 2017, 56, 6029–6034. [Google Scholar] [CrossRef] [PubMed]
- Boros, E.; Gale, E.M.; Caravan, P. MR imaging probes: Design and applications. Dalton Trans. 2015, 44, 4804–4818. [Google Scholar] [CrossRef] [PubMed]
- El-Fakahany, E.; Richelson, E. Effects of lanthanides on muscarinic acetylcholine receptor function. Mol. Pharmacol. 1981, 19, 282–290. [Google Scholar] [CrossRef] [PubMed]
- Chantler, P.D. Lanthanides do not function as calcium analogues in scallop myosin. J. Biol. Chem. 1983, 258, 4702–4705. [Google Scholar] [CrossRef]
- Wang, K.; Cheng, Y.; Yang, X.; Li, R. Cell responses to lanthanides and potential pharmacological actions of lanthanides. Met. Ions Biol. Syst. 2003, 40, 707–751. [Google Scholar]
- Assi, M.A.; Hezmee, M.N.M.; Abd Wahid Haron, M.Y.M.; Sabri, M.A.R. The detrimental effects of lead on human and animal health. Vet. World 2016, 9, 660–671. [Google Scholar] [CrossRef]
- Ilesanmi, O.B.; Adeogun, E.F.; Odewale, T.T.; Chikere, B. Lead exposure-induced changes in hematology and biomarkers of hepatic injury: Protective role of TrévoTM supplement. Environ. Anal. Health Toxicol. 2022, 37, e2022007. [Google Scholar] [CrossRef]
- Mudipalli, A. Lead hepatotoxicity & potential health effects. Indian J. Med. Res. 2007, 126, 518. [Google Scholar]
- Flora, S.J.; Flora, G.; Saxena, G. Environmental occurrence, health effects and management of lead poisoning in Lead Chemistry, Analytical Aspects. In Environmental Impacts and Health Effects; Cascas, S.B., Sordo, J., Eds.; Elsevier: Amsterdam, The Netherlands, 2006; pp. 158–228. [Google Scholar]
- Chen, B.; Sun, L.; Zeng, G.; Shen, Z.; Wang, K.; Yin, L.; Xu, F.; Wang, P.; Ding, Y.; Nie, Q.; et al. Gut bacteria alleviate smoking-related NASH by degrading gut nicotine. Nature 2022, 610, 562–568. [Google Scholar] [CrossRef]
- Marti-Aguado, D.; Clemente-Sanchez, A.; Bataller, R. Cigarette smoking and liver diseases. J. Hepatol. 2022, 77, 191–205. [Google Scholar] [CrossRef]
- Kulikowska-Karpińska, E.; Zdanowicz, M.; Gałażyn-Sidorczuk, M. Estimation of copper in the urine of cigarette smokers. Wiad. Lek. 2017, 70, 697–702. [Google Scholar] [PubMed]
- Lapenna, D.; Mezzetti, A.; de Gioia, S.; Pierdomenico, S.D.; Daniele, F.; Cuccurullo, F. Plasma copper and lipid peroxidation in cigarette smokers. Free Radic. Biol. Med. 1995, 19, 849–852. [Google Scholar] [CrossRef] [PubMed]
- Jasińska-Starczewska, M.; Szydłowska, I.; Mroczek, B.; Laszczyńska, M.; Chlubek, D.; Kemicer-Chmielewska, E.; Chełstowski, K.; Karakiewicz, B.; Ciećwież, S.; Starczewski, A. The Influence of Cigarette Smoke Exposure on the Copper Concentration in the Serum Depending on the Use of Menopausal Hormone Therapy. Biomed. Res. Int. 2017, 2017, 5732380. [Google Scholar] [CrossRef]
- Son, Y.B.; Kim, T.B.; Min, H.J.; Yang, J.; Kim, M.G.; Jo, S.K.; Cho, W.Y.; Oh, S.W. Smoking amplifies the risk of albuminuria in individuals with high sodium intake: The Korea National Health and Nutrition Examination Survey (KNHANES) 2008–2011 and 2014–2018. Kidney Res. Clin. Pract. 2023, 44, 452–460. [Google Scholar] [CrossRef]
- Jomova, K.; Makova, M.; Alomar, S.Y.; Alwasel, S.H.; Nepovimova, E.; Kuca, K.; Rhodes, C.J.; Valko, M. Essential metals in health and disease. Chem. Biol. Interact. 2022, 367, 110173. [Google Scholar] [CrossRef] [PubMed]
- Nakamura, K.; Barzi, F.; Lam, T.H.; Huxley, R.; Feigin, V.L.; Ueshima, H.; Woo, J.; Gu, D.; Ohkubo, T.; Lawes, C.M.; et al. Asia Pacific Cohort Studies Collaboration. Cigarette smoking, systolic blood pressure, and cardiovascular diseases in the Asia-Pacific region. Stroke 2008, 39, 1694–1702. [Google Scholar] [CrossRef]
- Stern, L.Z.; Bernick, C. The Motor System and Gait. In Clinical Methods: The History, Physical, and Laboratory Examinations, 3rd ed.; Walker, H.K., Hall, W.D., Hurst, J.W., Eds.; Butterworths: Boston, MA, USA, 1990. [Google Scholar]
- Wang, S.; Lyu, Y.; Ji, S.; Liu, N.; Wu, B.; Zhao, F.; Li, Z.; Qu, Y.; Zhu, Y.; Xie, L.; et al. Heavy metals and metalloids exposure and liver function in Chinese adults—A nationally representative cross-sectional study. Environ. Res. 2024, 252, 118653. [Google Scholar] [CrossRef]
- Balbi, B.; Cottin, V.; Singh, S.; De Wever, W.; Herth, F.J.; Robalo Cordeiro, C. Smoking-related lung diseases: A clinical perspective. Eur. Respir. J. 2010, 35, 231–233. [Google Scholar] [CrossRef]
- Wick, M.R. Pathologic features of smoking-related lung diseases, with emphasis on smoking-related interstitial fibrosis and a consideration of differential diagnoses. Semin. Diagn. Pathol. 2018, 35, 315–323. [Google Scholar] [CrossRef]
- Akbartabartoori, M.; Lean, M.E.; Hankey, C.R. Relationships between cigarette smoking, body size and body shape. Int. J. Obes. 2005, 29, 236–243. [Google Scholar] [CrossRef]
- Hammad, M.M.; Darwazeh, A.M.; Al-Waeli, H.; Tarakji, B.; Alhadithy, T.T. Prevalence and awareness of halitosis in a sample of Jordanian population. J. Int. Soc. Prev. Community Dent. 2014, 4, S178–S186. [Google Scholar] [CrossRef] [PubMed]
- Palma Carrió, C.; Maestre Ferrín, L.; Peñarrocha Oltra, D.; Peñarrocha Diago, M.; Peñarrocha Diago, M. Risk factors associated with early failure of dental implants. A literature review. Med. Oral. Patol. Oral. Cir. Bucal. 2011, 16, e514–e517. [Google Scholar] [CrossRef] [PubMed]
- Wilcox, R.R. Introduction to Robust Estimation and Hypothesis Testing; Academic Press: Cambridge, MA, USA, 2012. [Google Scholar]
- Fay, M.P.; Proschan, M.A. Wilcoxon-Mann-Whitney or t-Test? On Assumptions for Hypothesis Tests and Multiple Interpretations of Decision Rules. Stat. Surv. 2010, 4, 1–39. [Google Scholar] [CrossRef]
- Neuhäuser, M. Wilcoxon–Mann–Whitney Test. In International Encyclopedia of Statistical Science; Lovric, M., Ed.; Springer: Berlin/Heidelberg, Germany, 2011; pp. 1656–1658. ISBN 978-3-642-04898-2. [Google Scholar]
- Nachar, N. The Mann-Whitney U: A test for assessing whether two independent samples come from the same distribution. Tutor. Quant. Methods Psychol. 2008, 4, 13–20. [Google Scholar] [CrossRef]
- Holm, S. A simple sequentially rejective multiple test procedure. Scand. J. Stat. 1979, 6, 65–70. [Google Scholar]
- Tukey, J.W. Exploratory Data Analysis; Addison-Wesley: Boston, MA, USA, 1977. [Google Scholar]
- Jolliffe, I.T.; Cadima, J. Principal component analysis: A review and recent developments. Philos. Trans. R. Soc. A Math. Phys. Eng. Sci. 2016, 374, 20150202. [Google Scholar] [CrossRef] [PubMed]
- Ringnér, M. What is principal component analysis? Nat. Biotechnol. 2008, 26, 303–304. [Google Scholar] [CrossRef]
- Lever, J.; Krzywinski, M.; Altman, N. Principal component analysis. Nat. Methods 2017, 14, 641–642. [Google Scholar] [CrossRef]
Disclaimer/Publisher’s Note: The statements, opinions and data contained in all publications are solely those of the individual author(s) and contributor(s) and not of MDPI and/or the editor(s). MDPI and/or the editor(s) disclaim responsibility for any injury to people or property resulting from any ideas, methods, instructions or products referred to in the content. |
© 2025 by the authors. Licensee MDPI, Basel, Switzerland. This article is an open access article distributed under the terms and conditions of the Creative Commons Attribution (CC BY) license (https://creativecommons.org/licenses/by/4.0/).