
Network Pharmacology, Molecular Dynamics Simulation, and Biological Validation Insights into the Potential of Ligustri Lucidi Fructus for Diabetic Nephropathy
 ,
,
Abstract
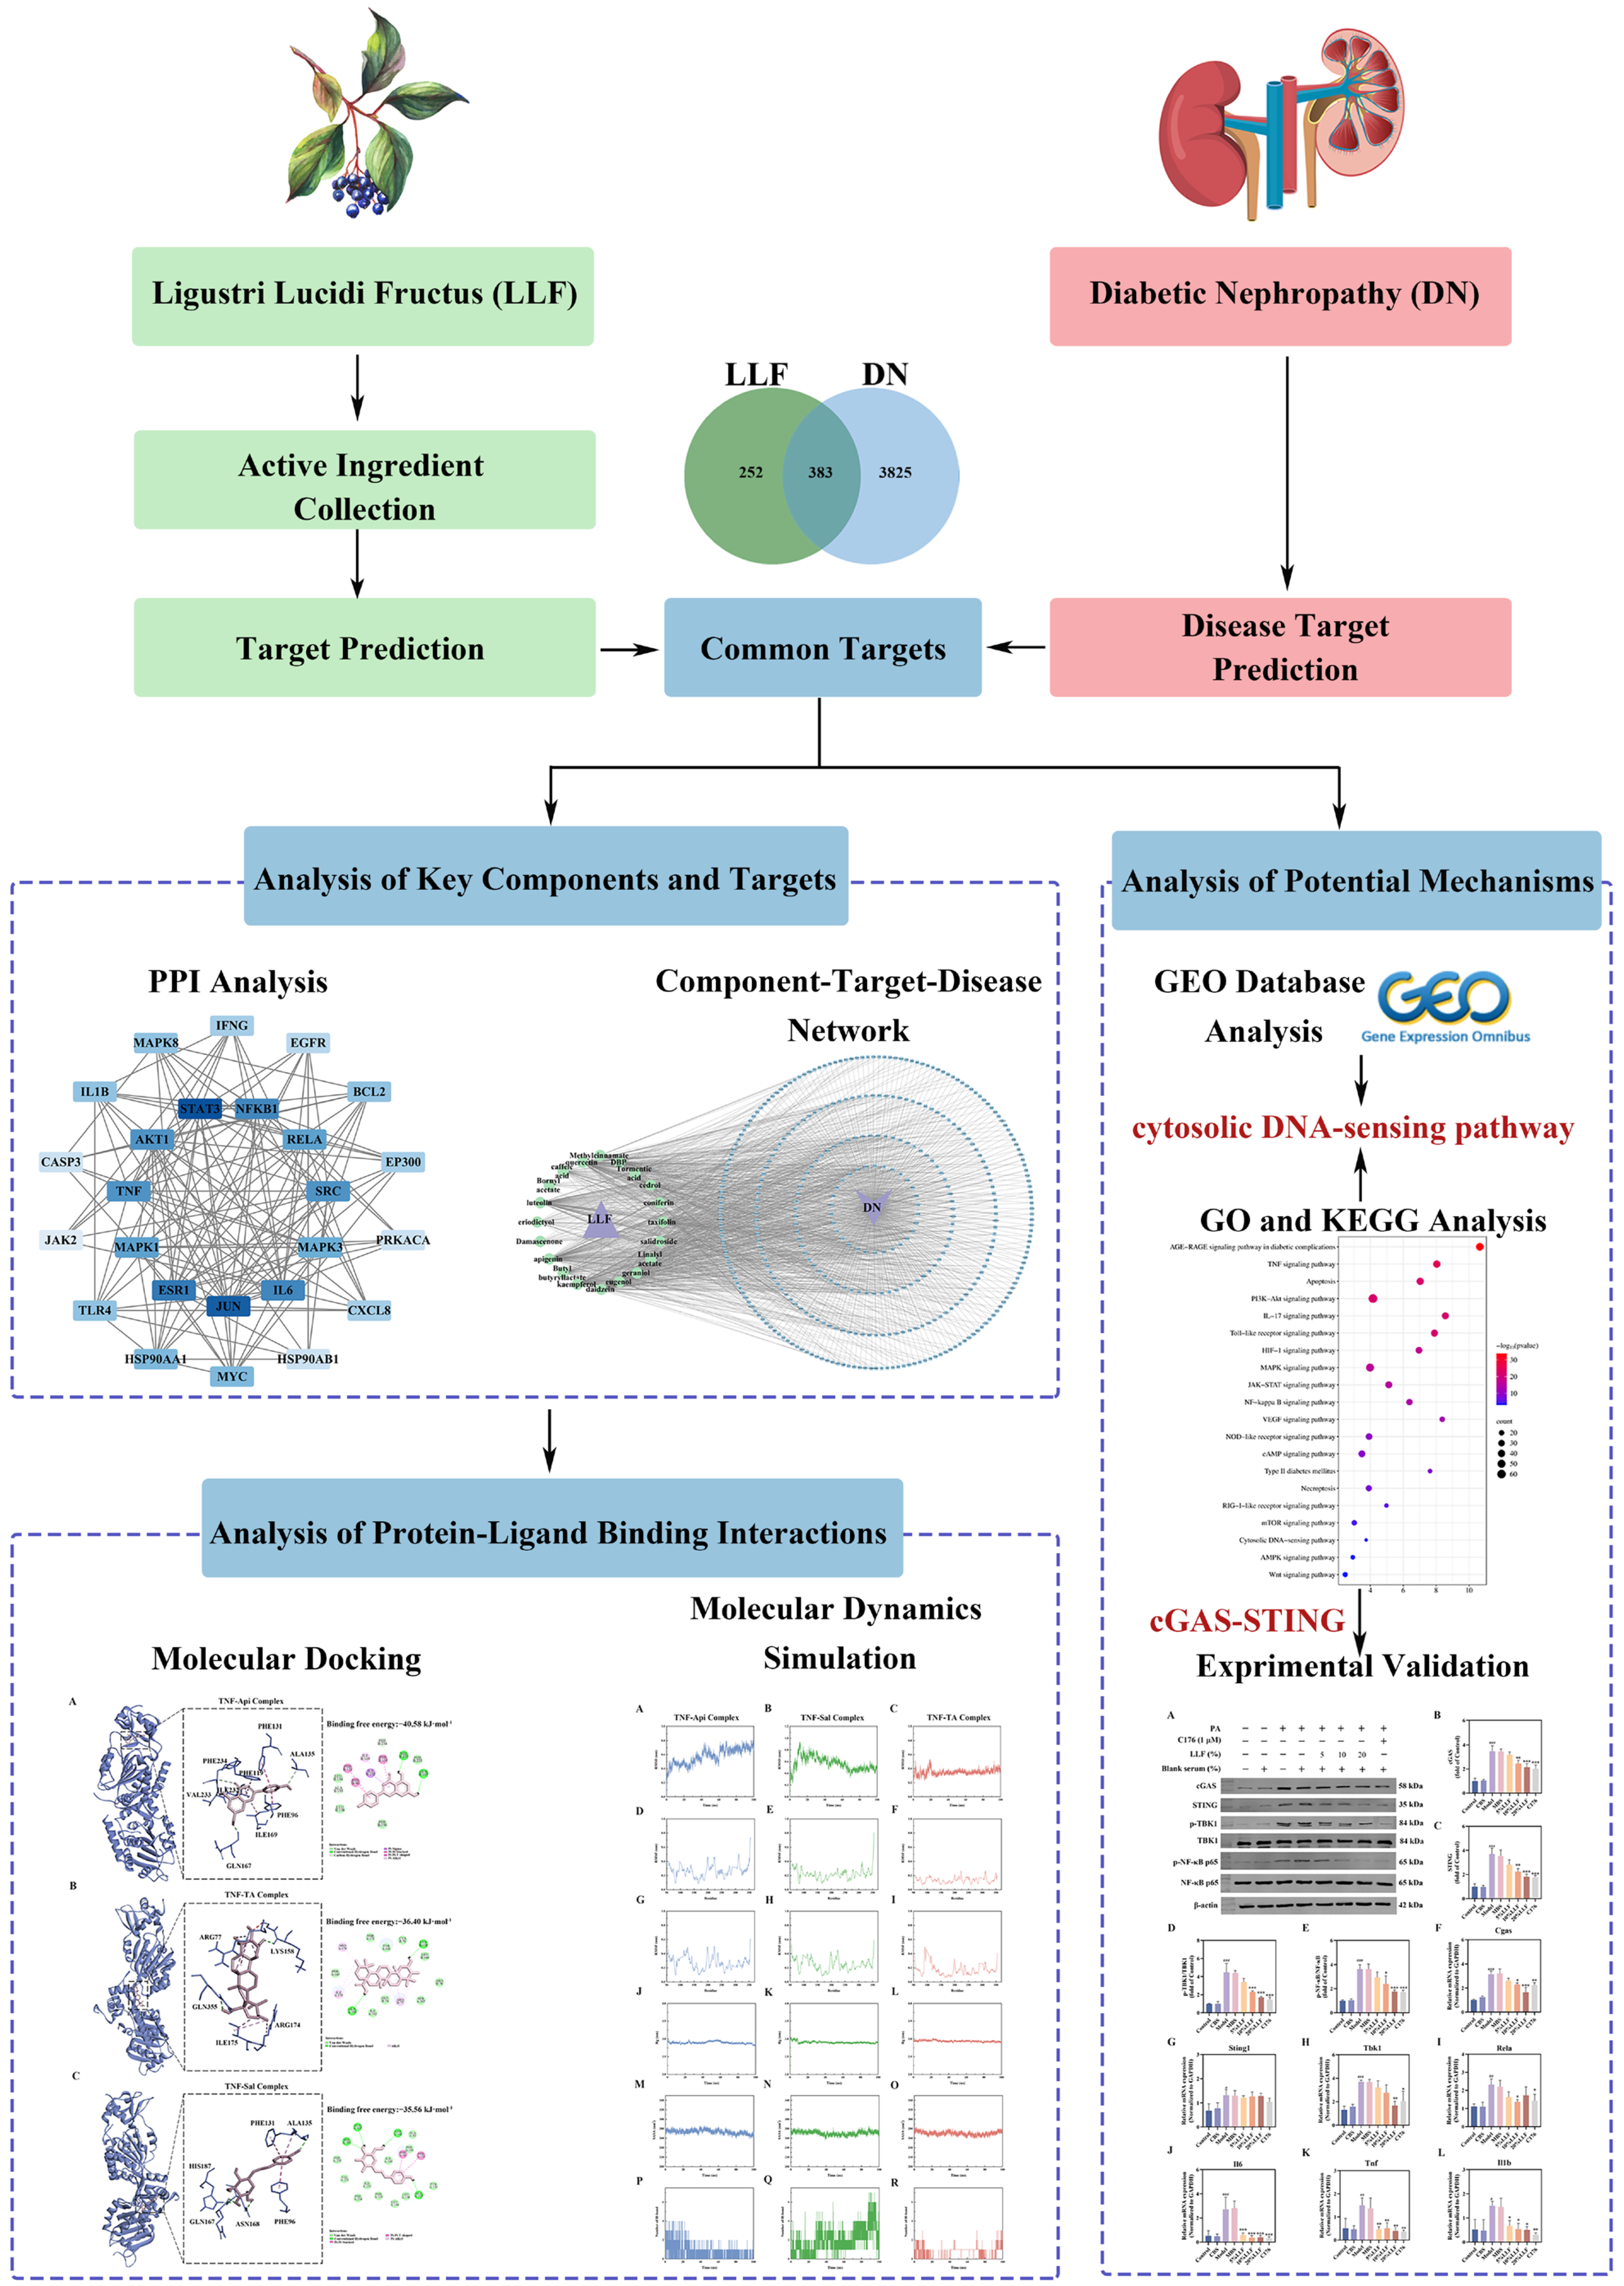
1. Introduction
2. Results
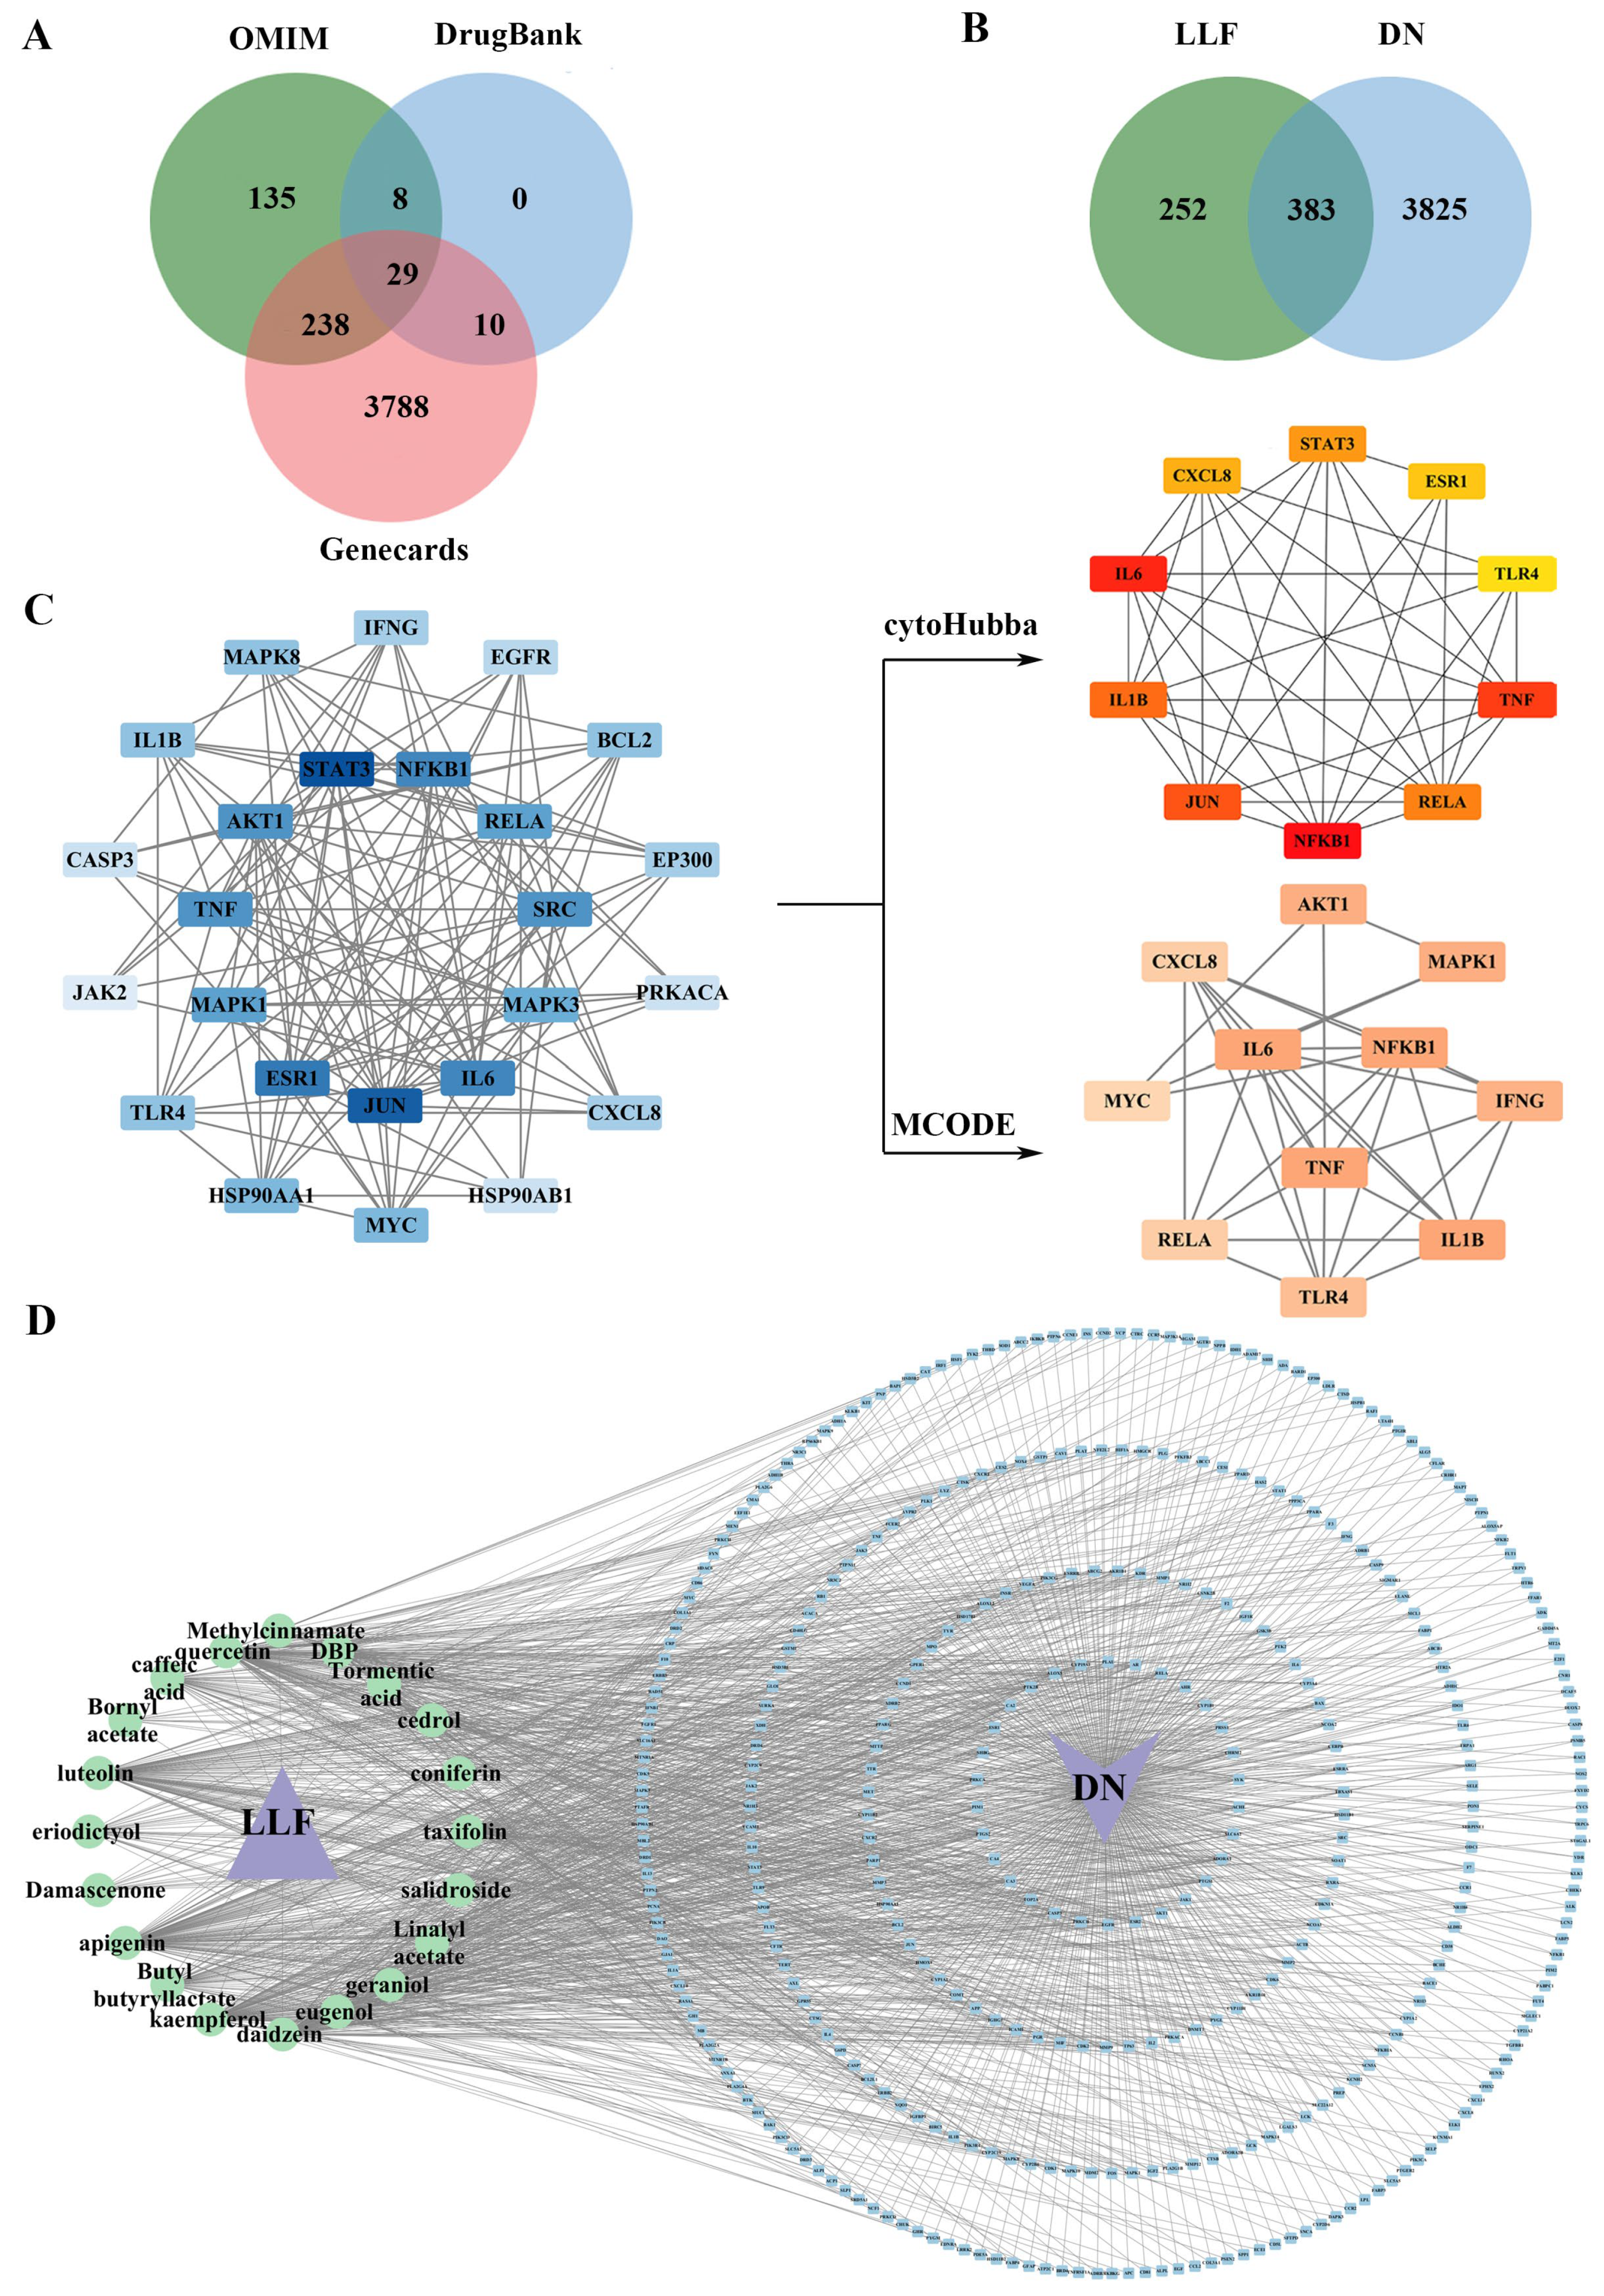
2.1. Active Compounds in LLF and Their Targets
2.2. Effective Targets for DN
2.3. Establishment of the PPI Network with Common Targets
2.4. Integrated “Component–Target–Disease” Network Analysis
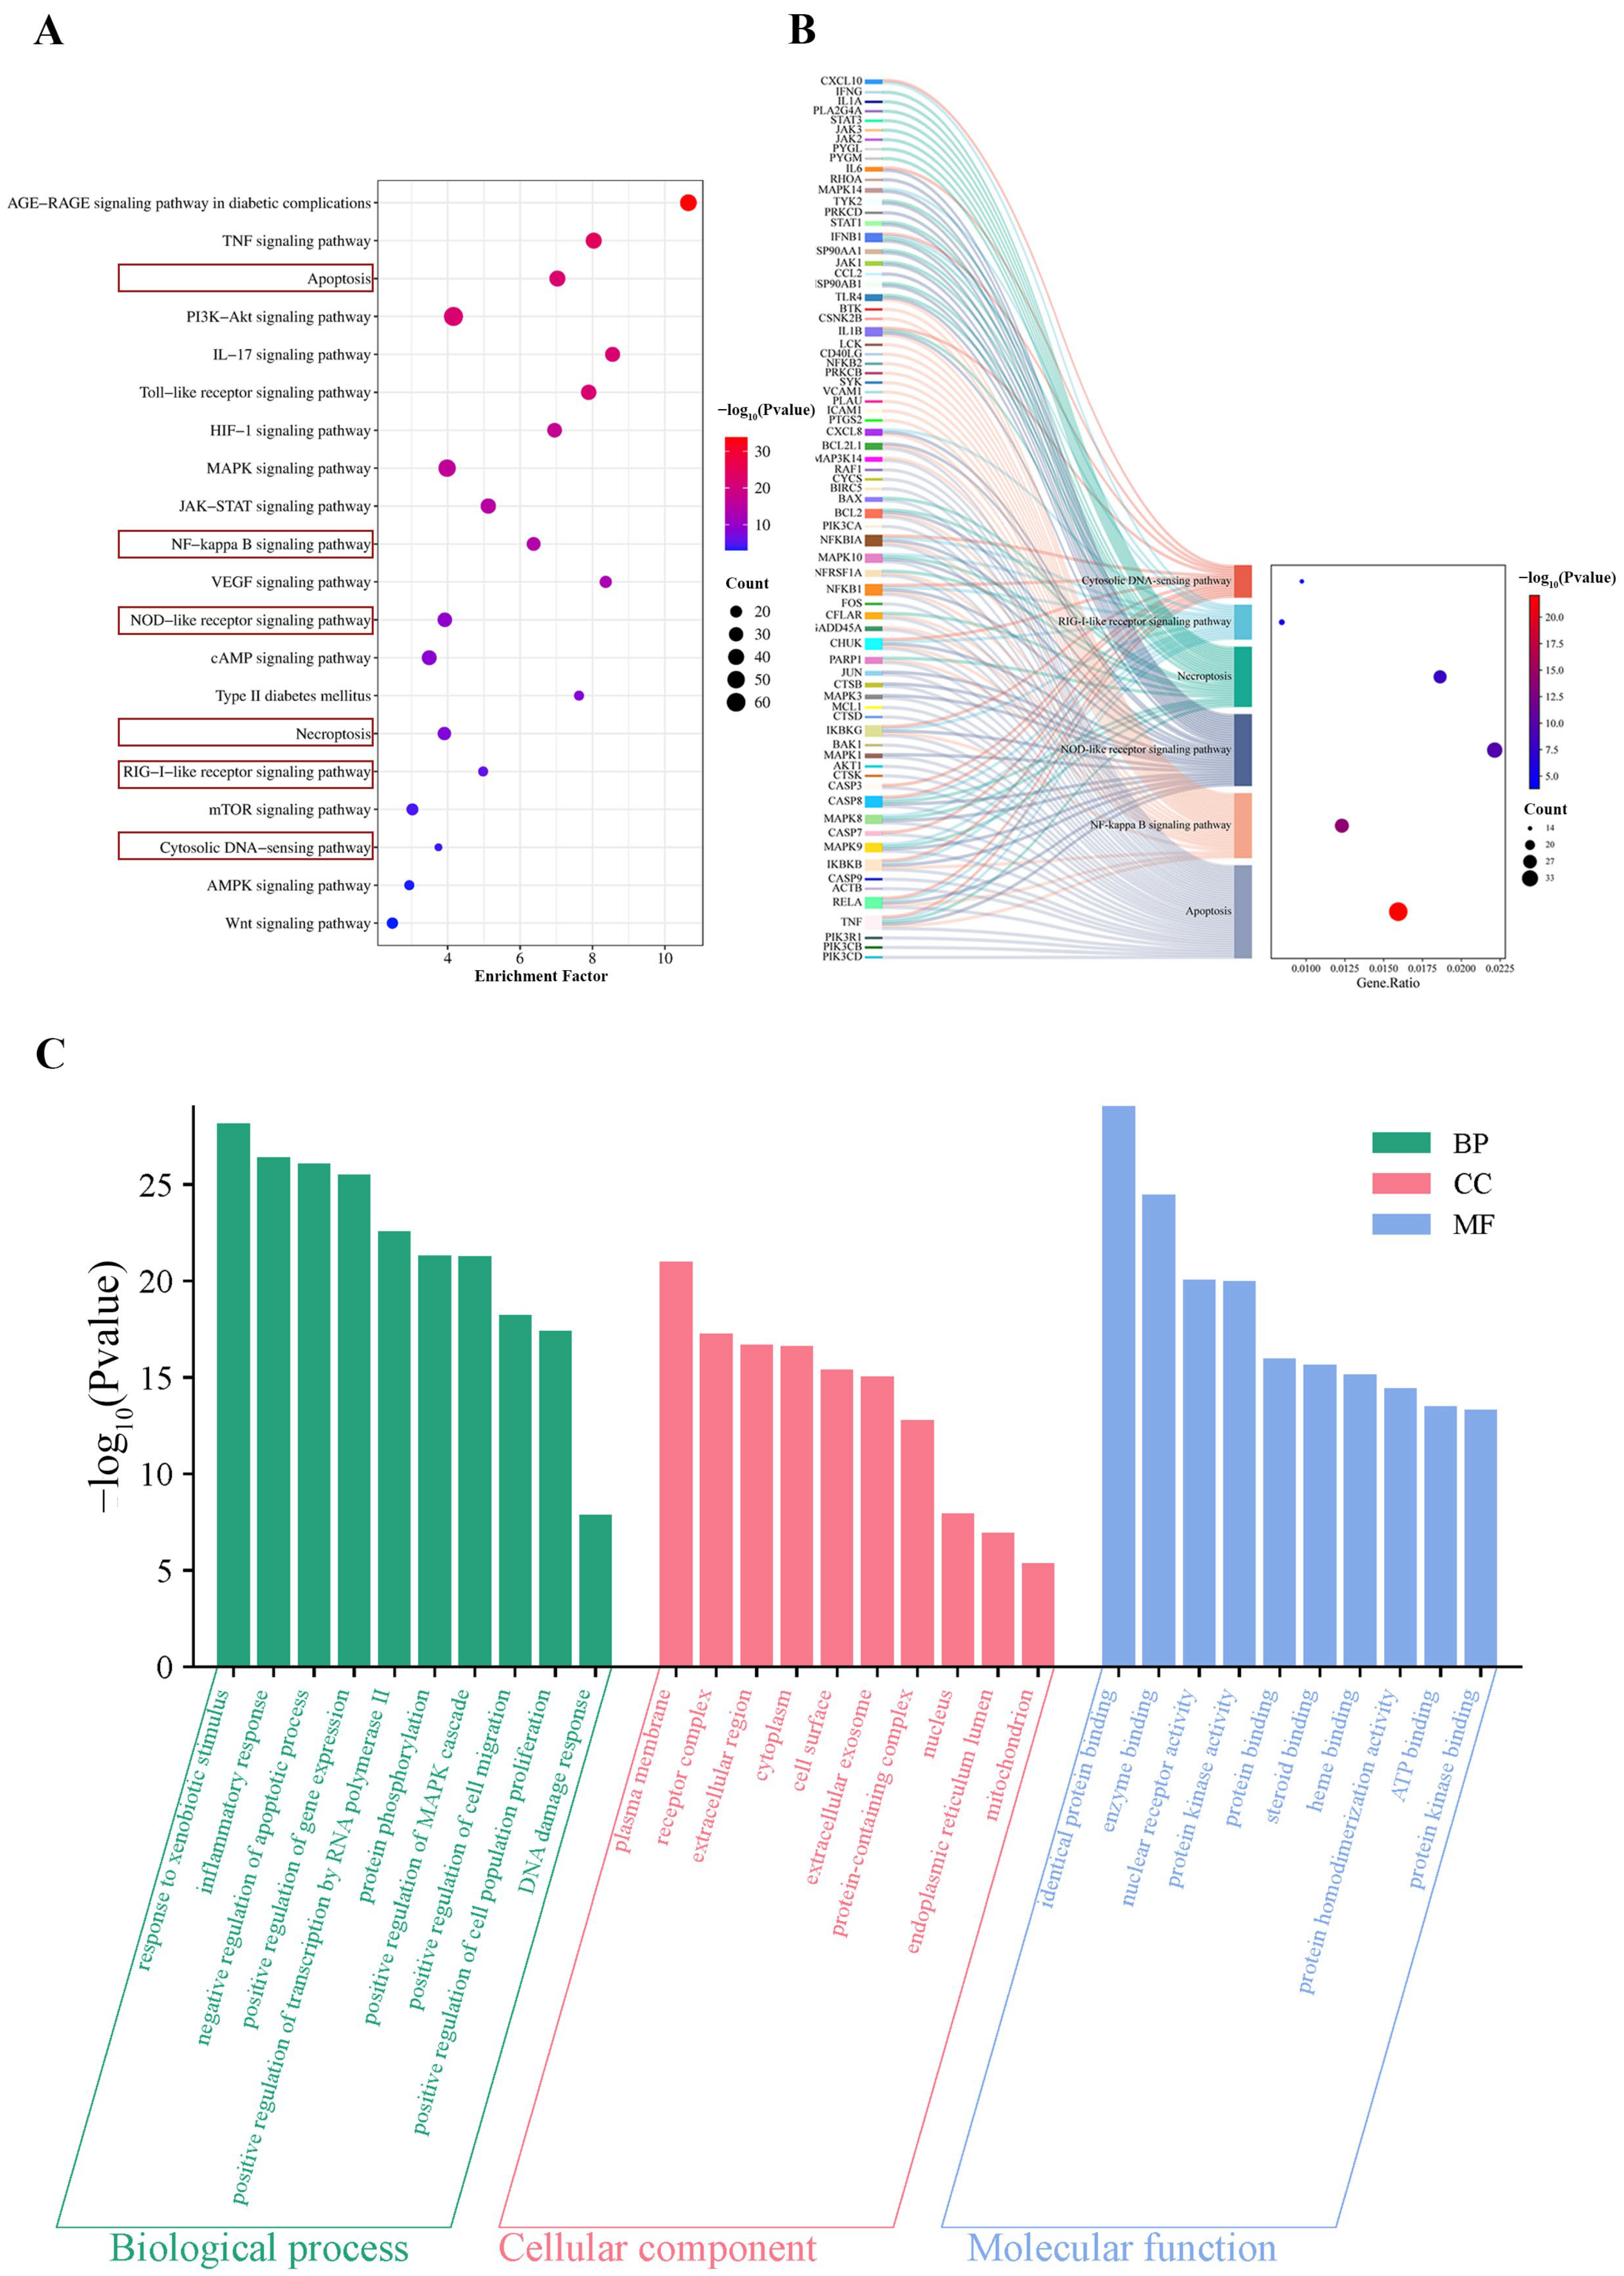
2.5. KEGG Analysis of Common Targets
2.6. GO Analysis of Common Targets
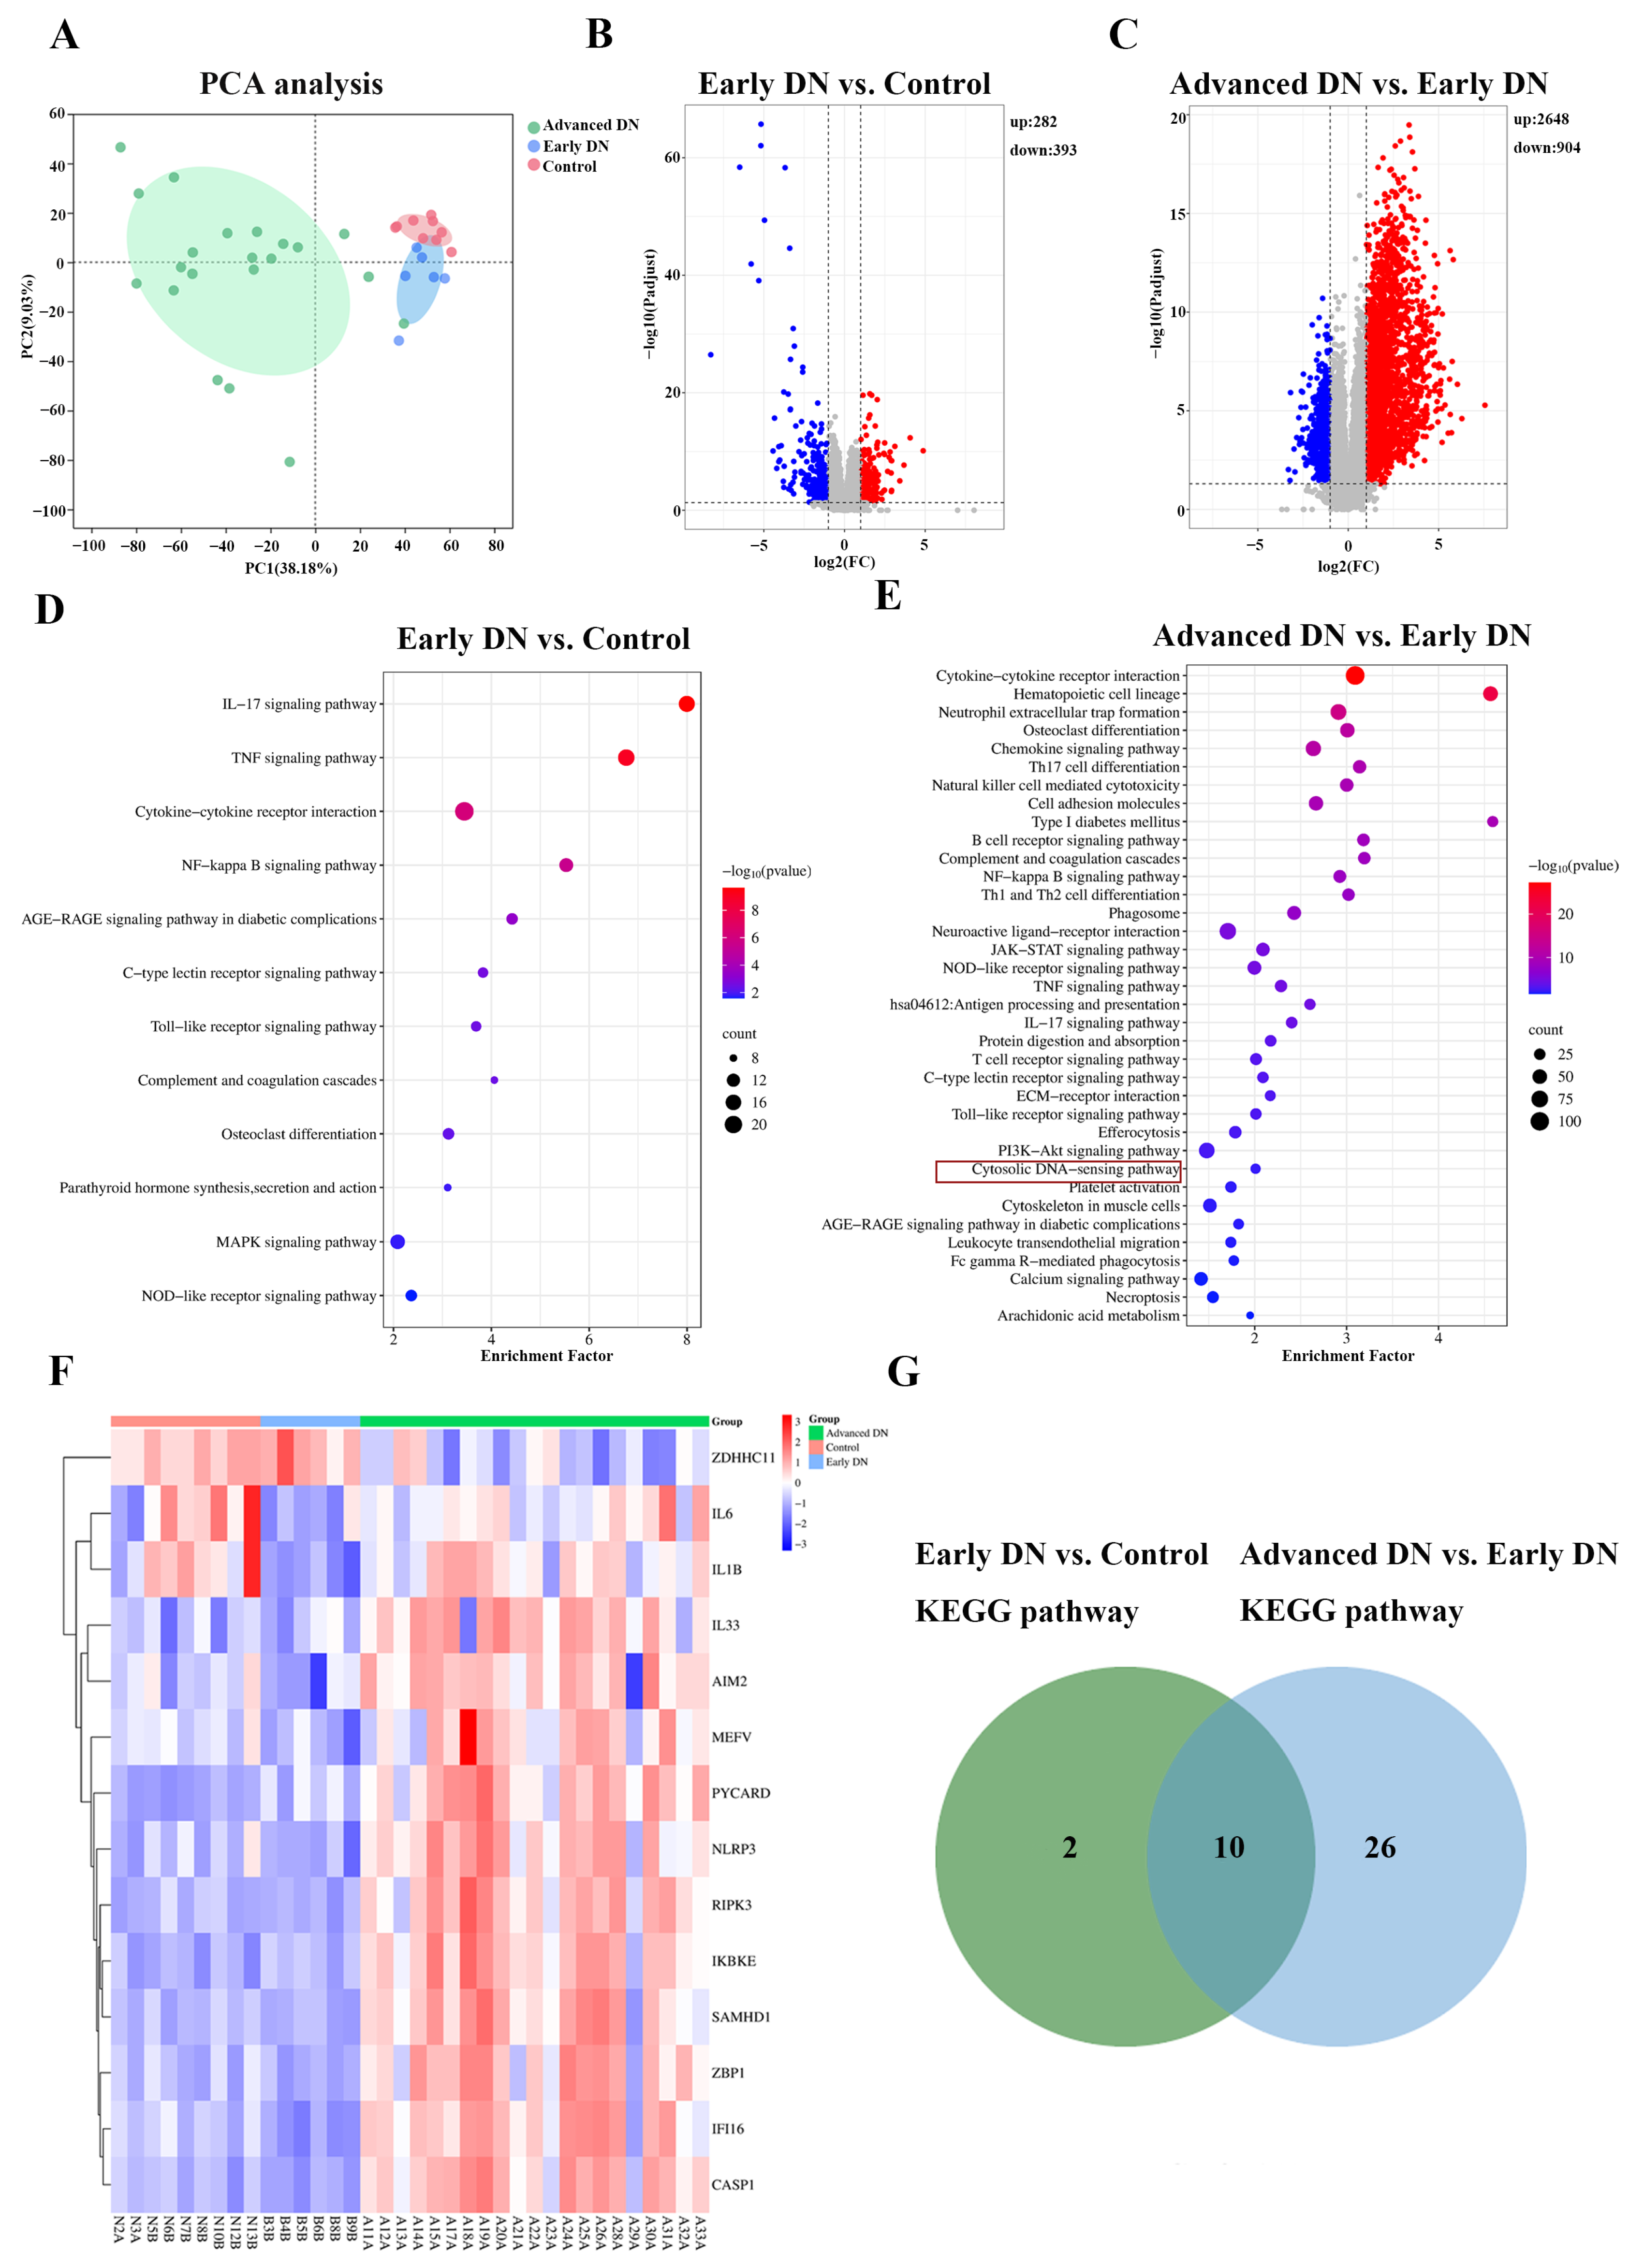
2.7. GEO Analysis of the GSE142025 Dataset
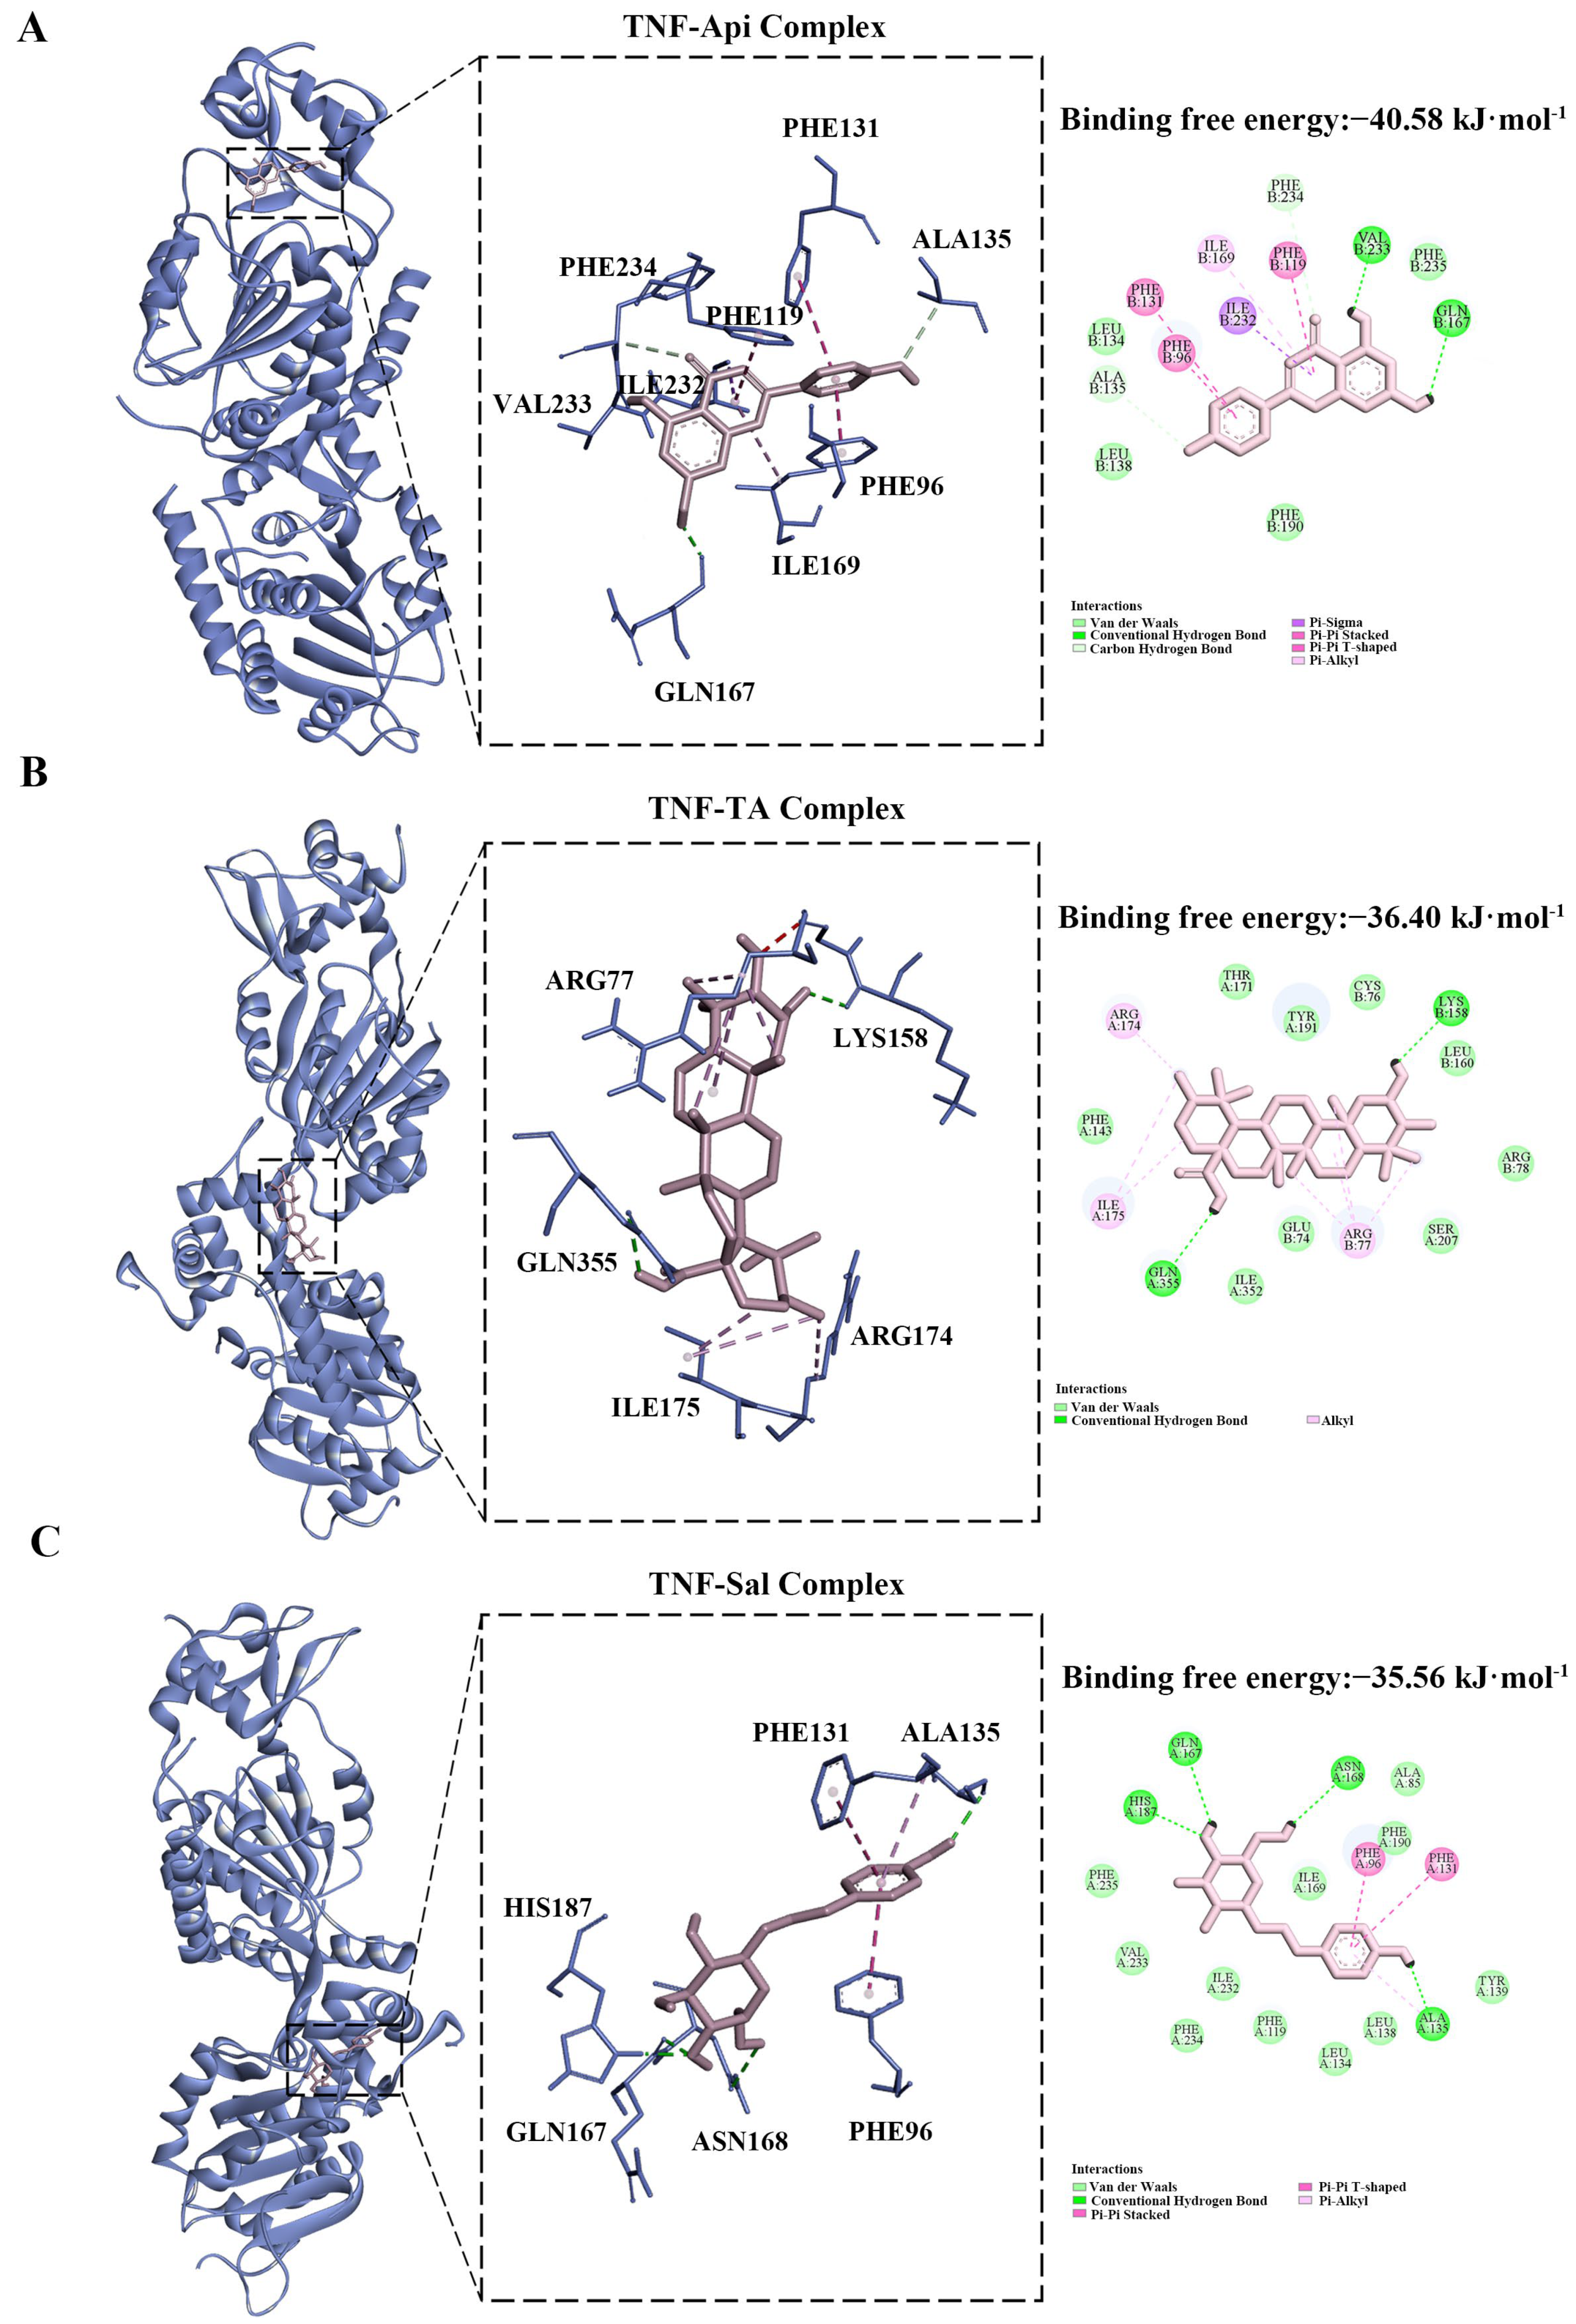
2.8. Molecular Docking Analysis
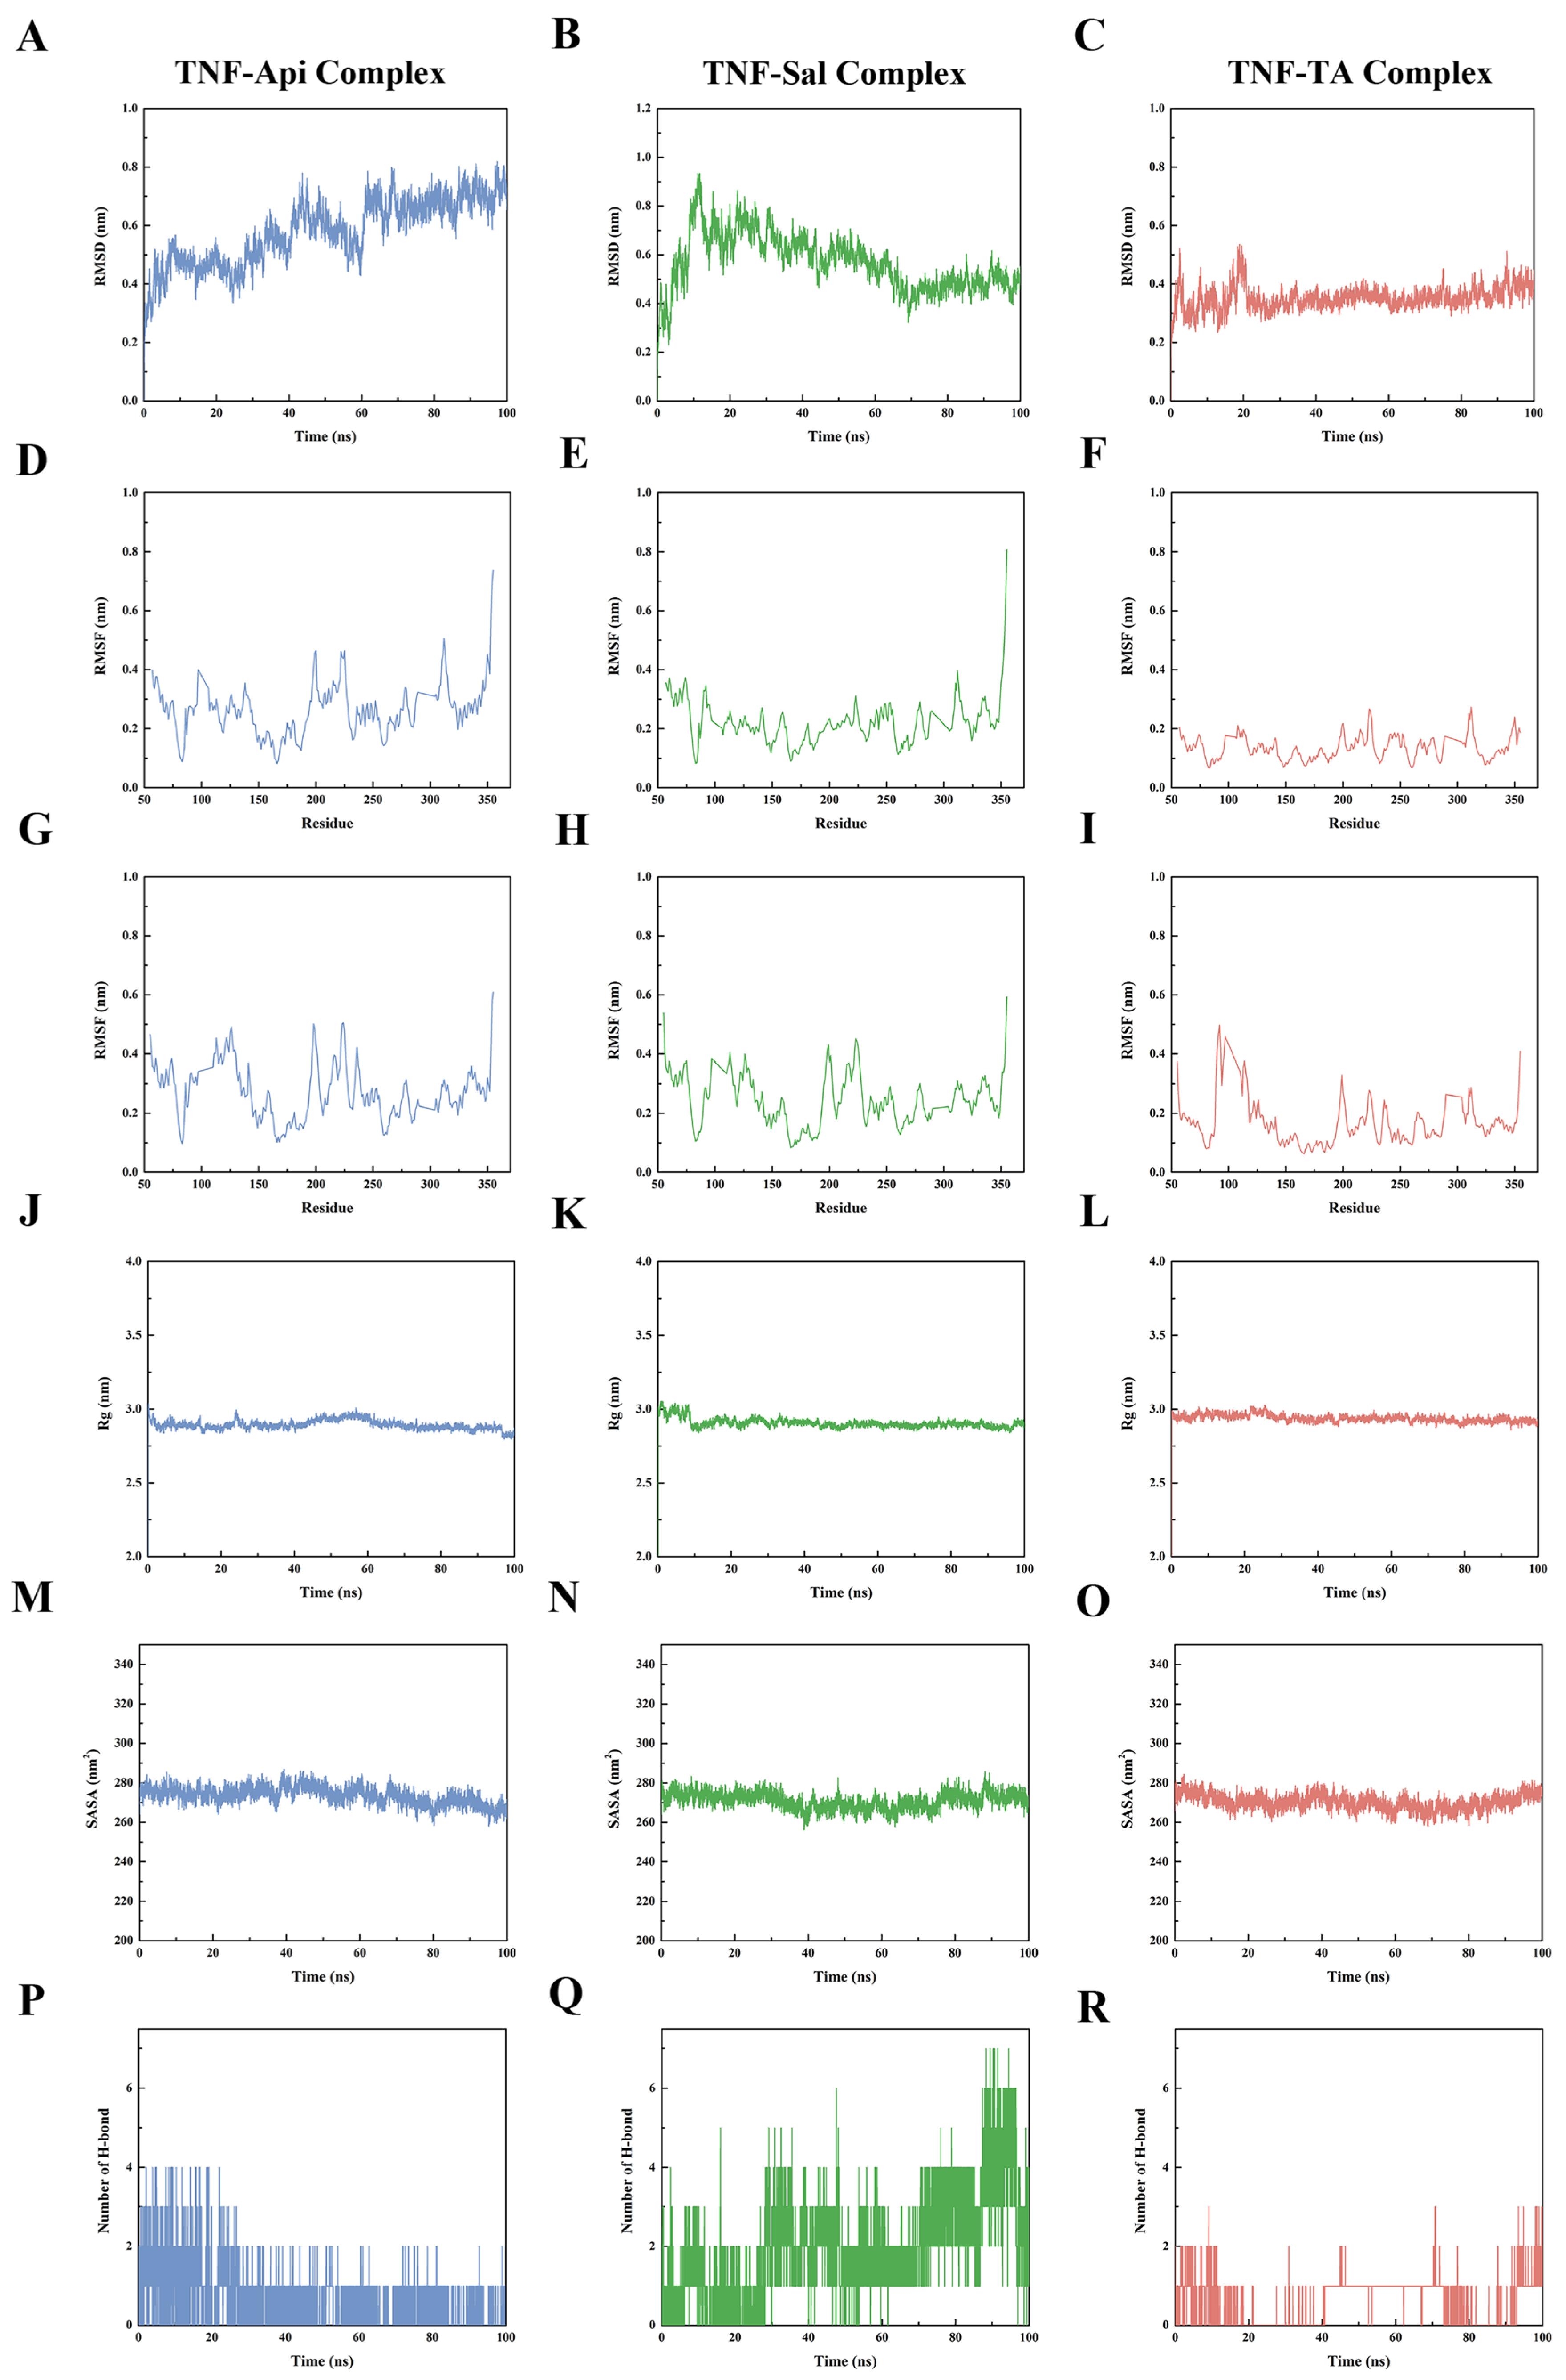
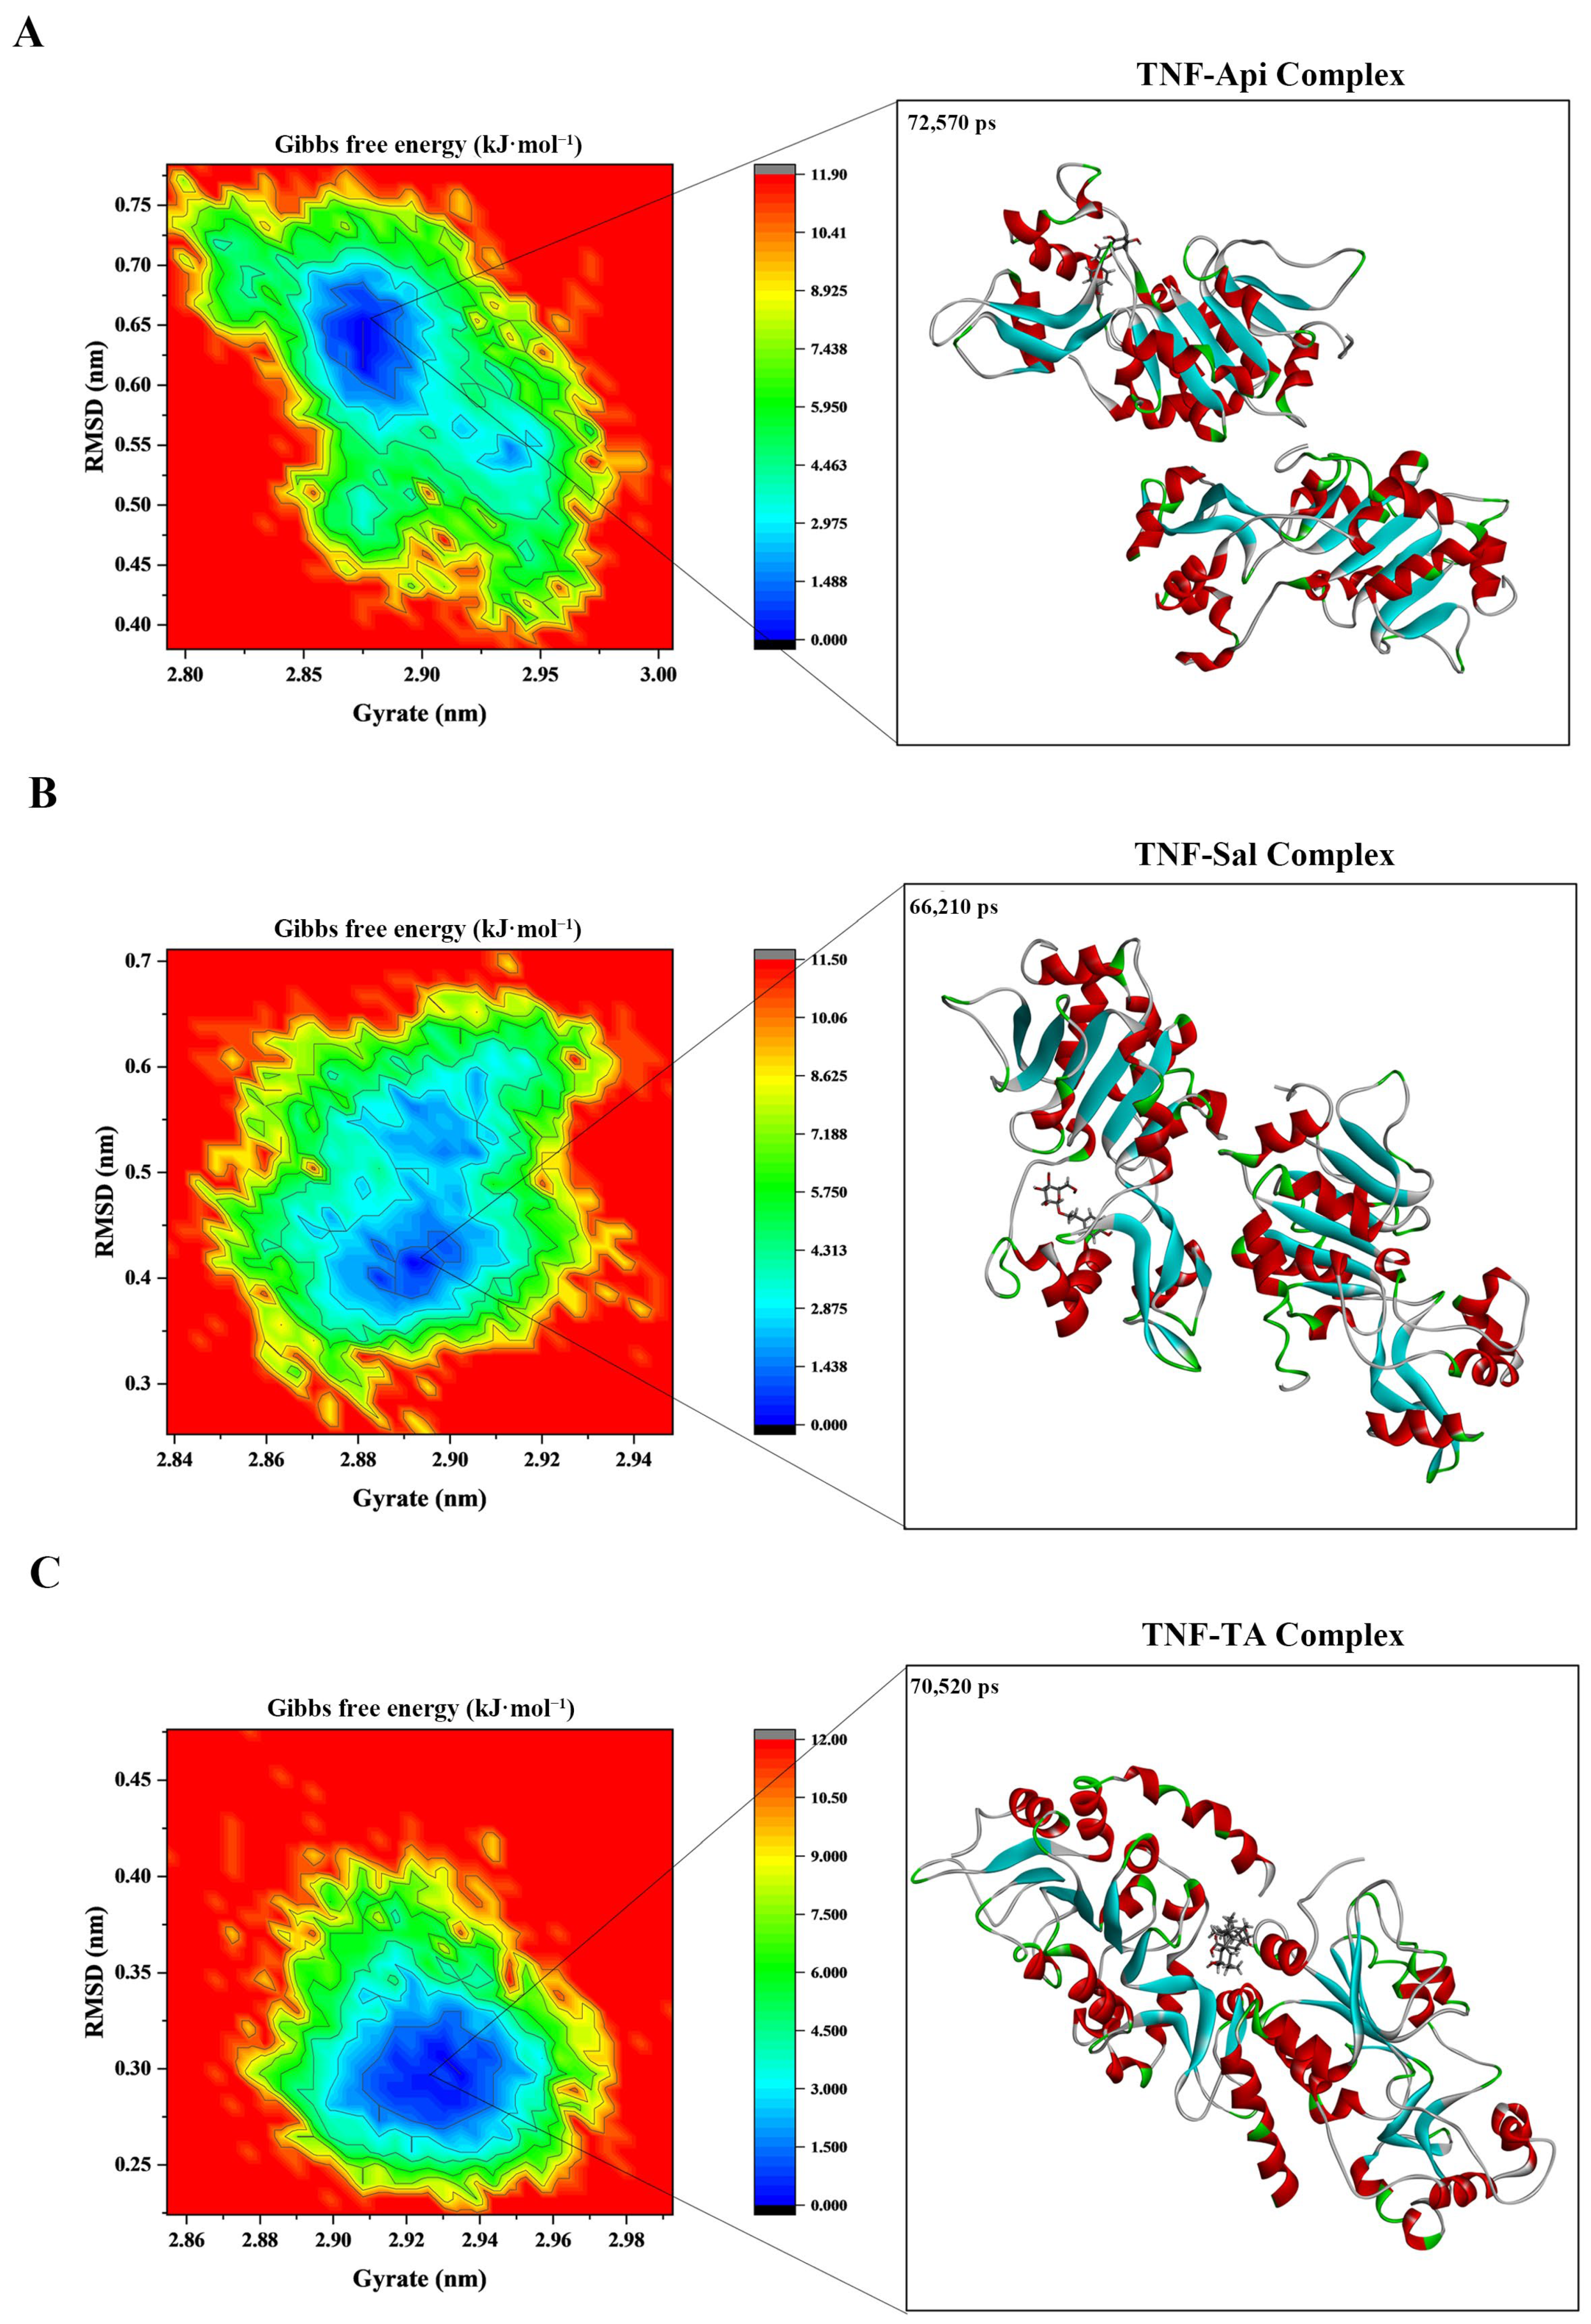
2.9. Molecular Dynamics Analysis
2.10. Effects of the LLF-Containing Serum on MPC5 Cell Viability
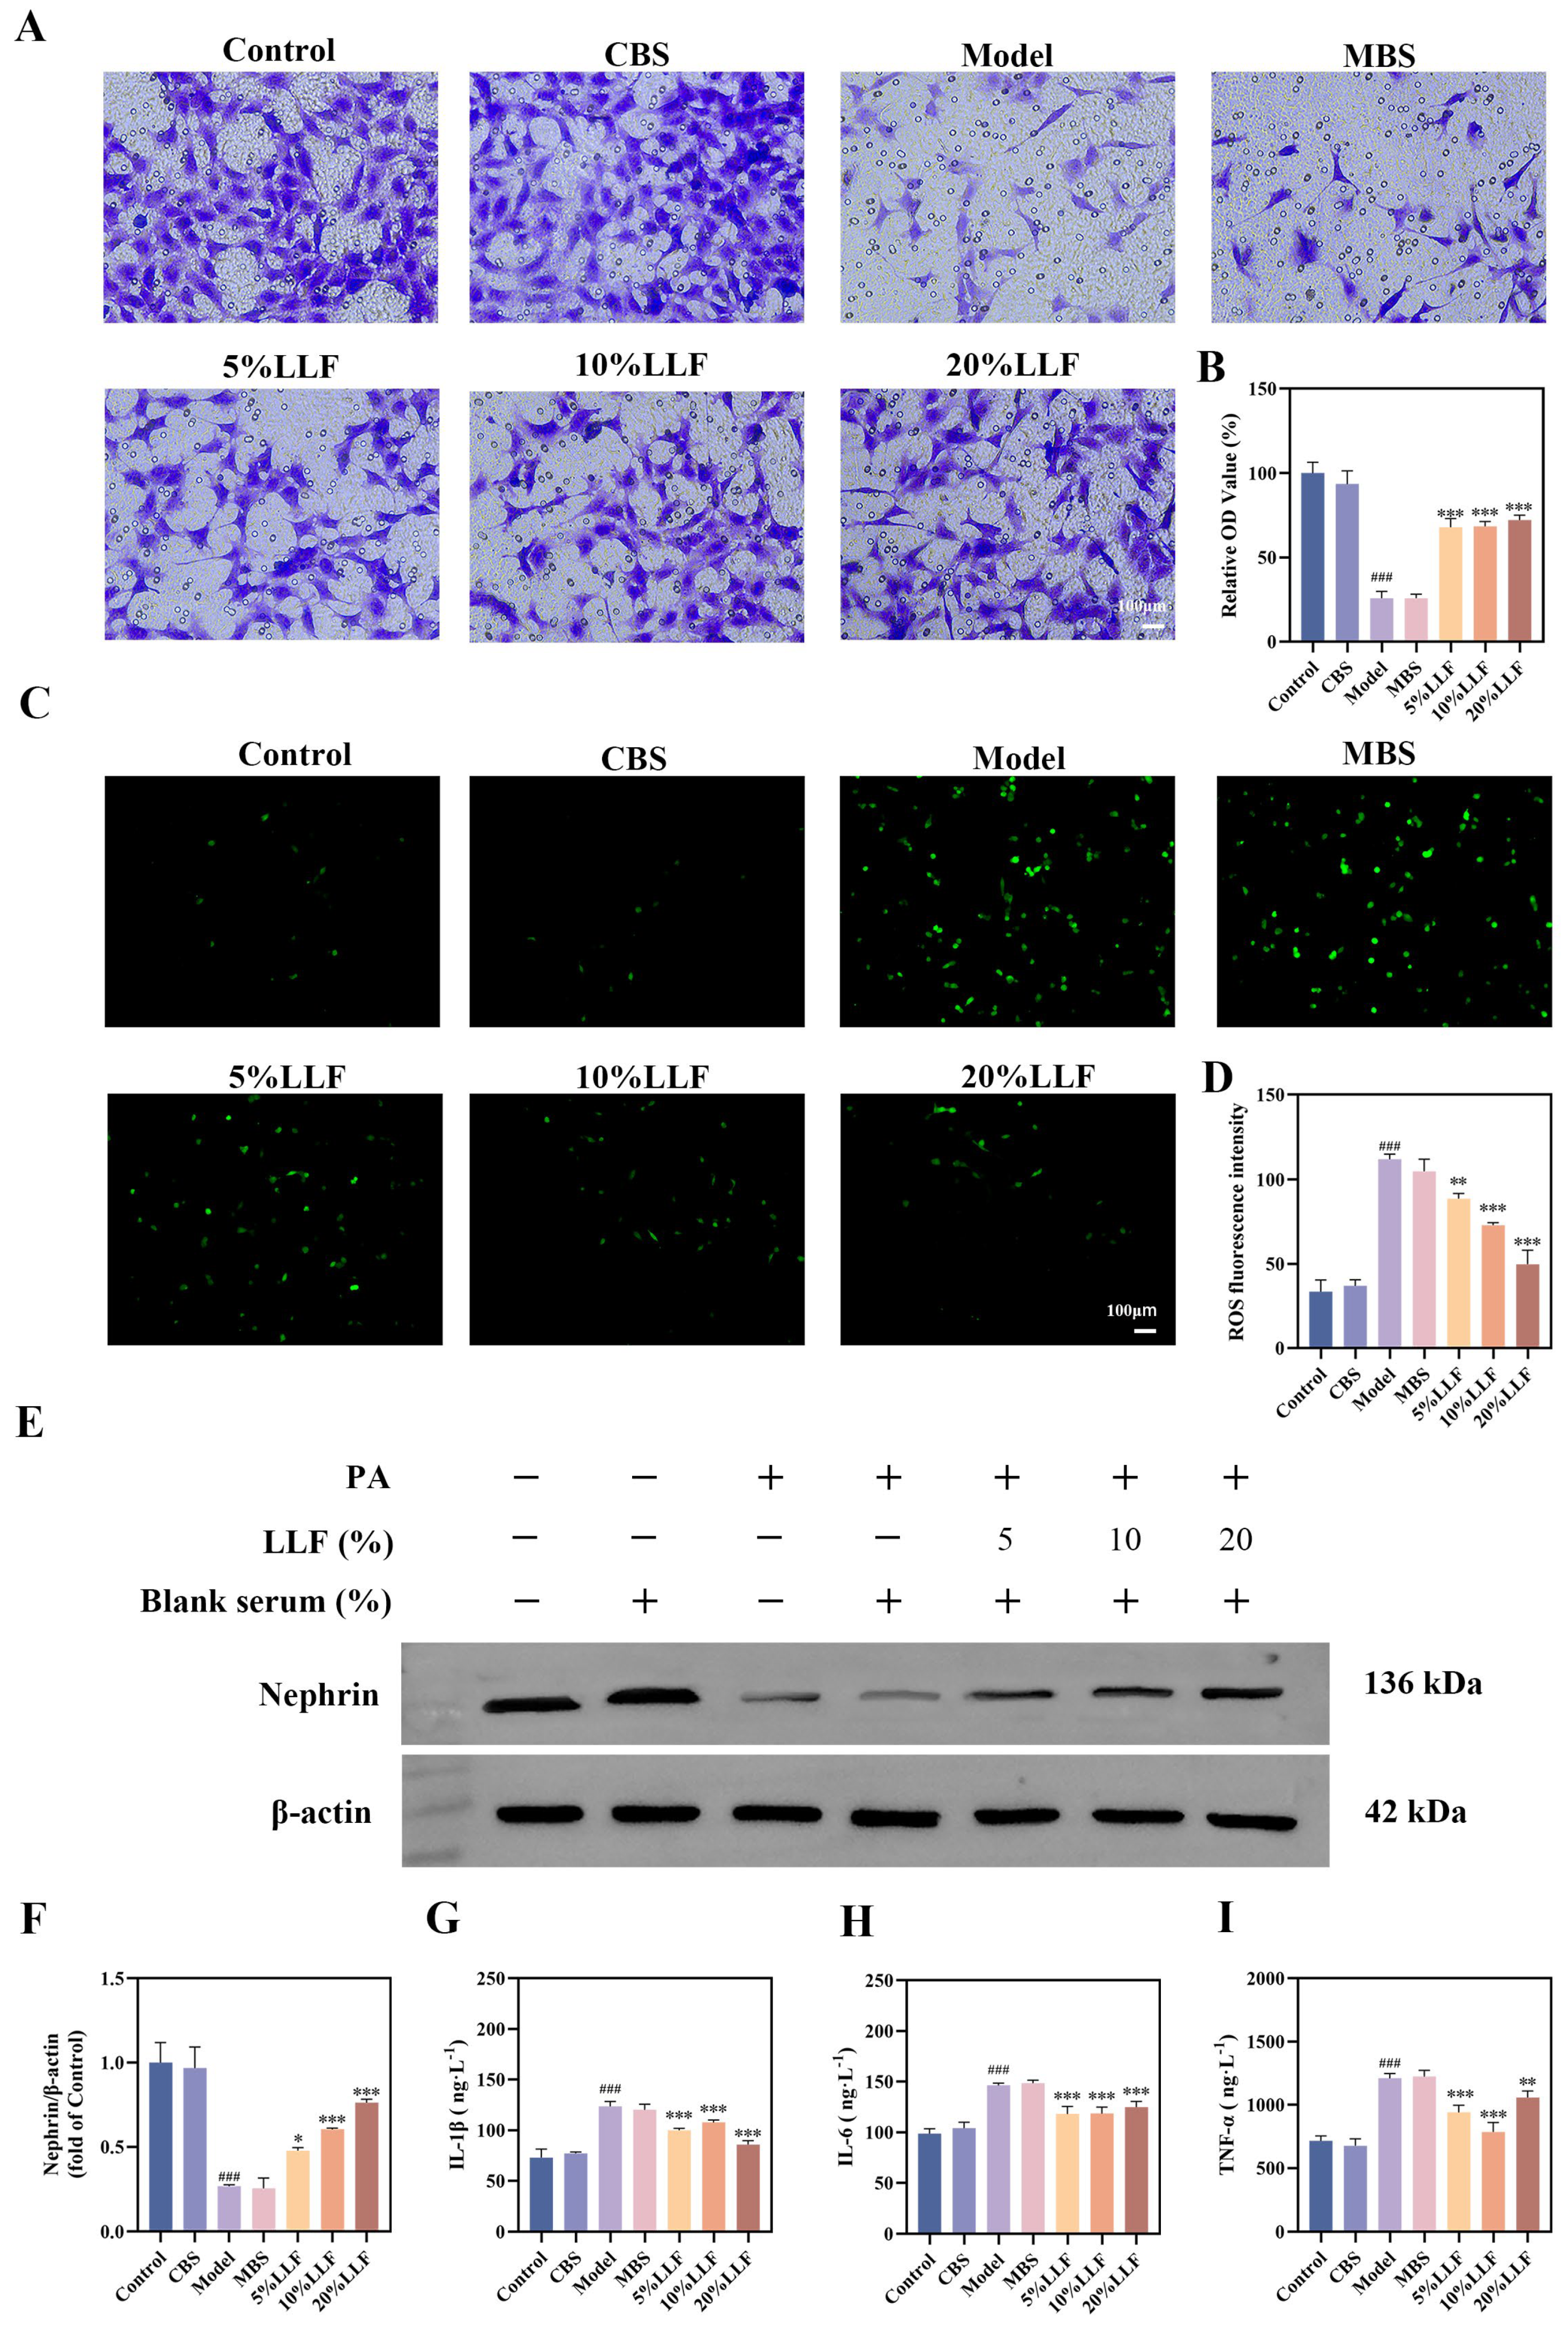
2.11. The Protective Effect of LLF-Containing Serum on MPC5 Podocytes
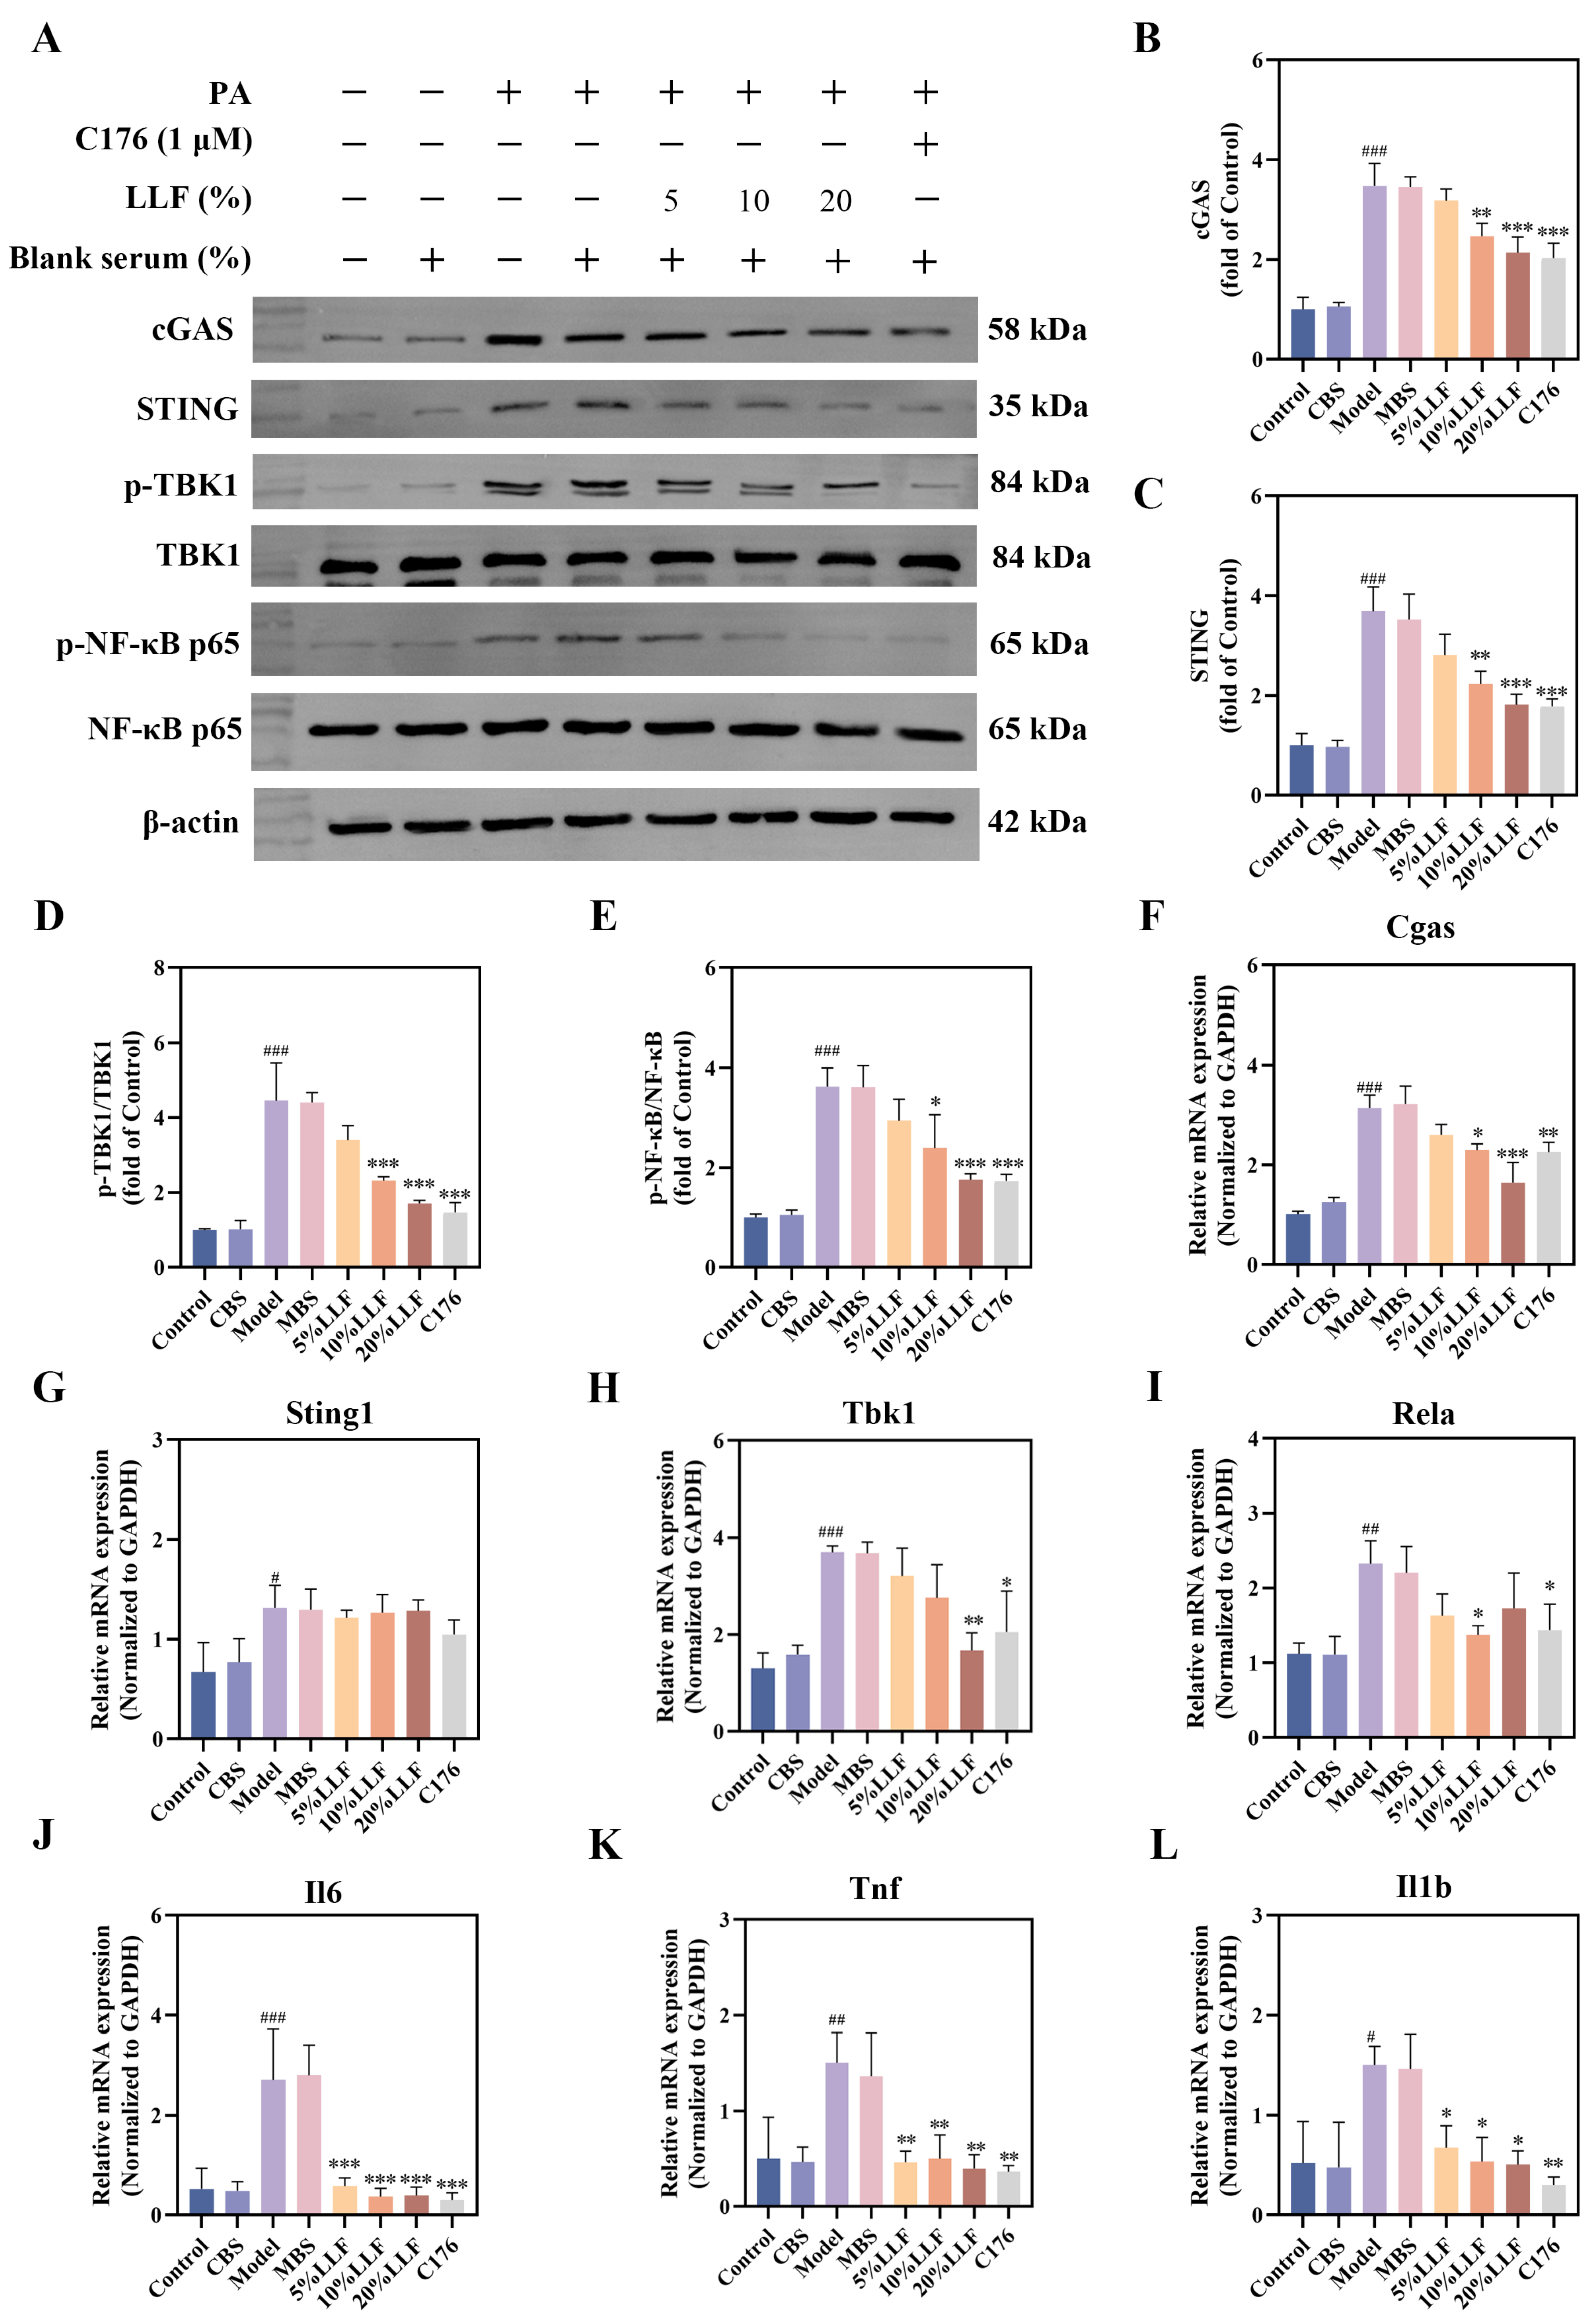
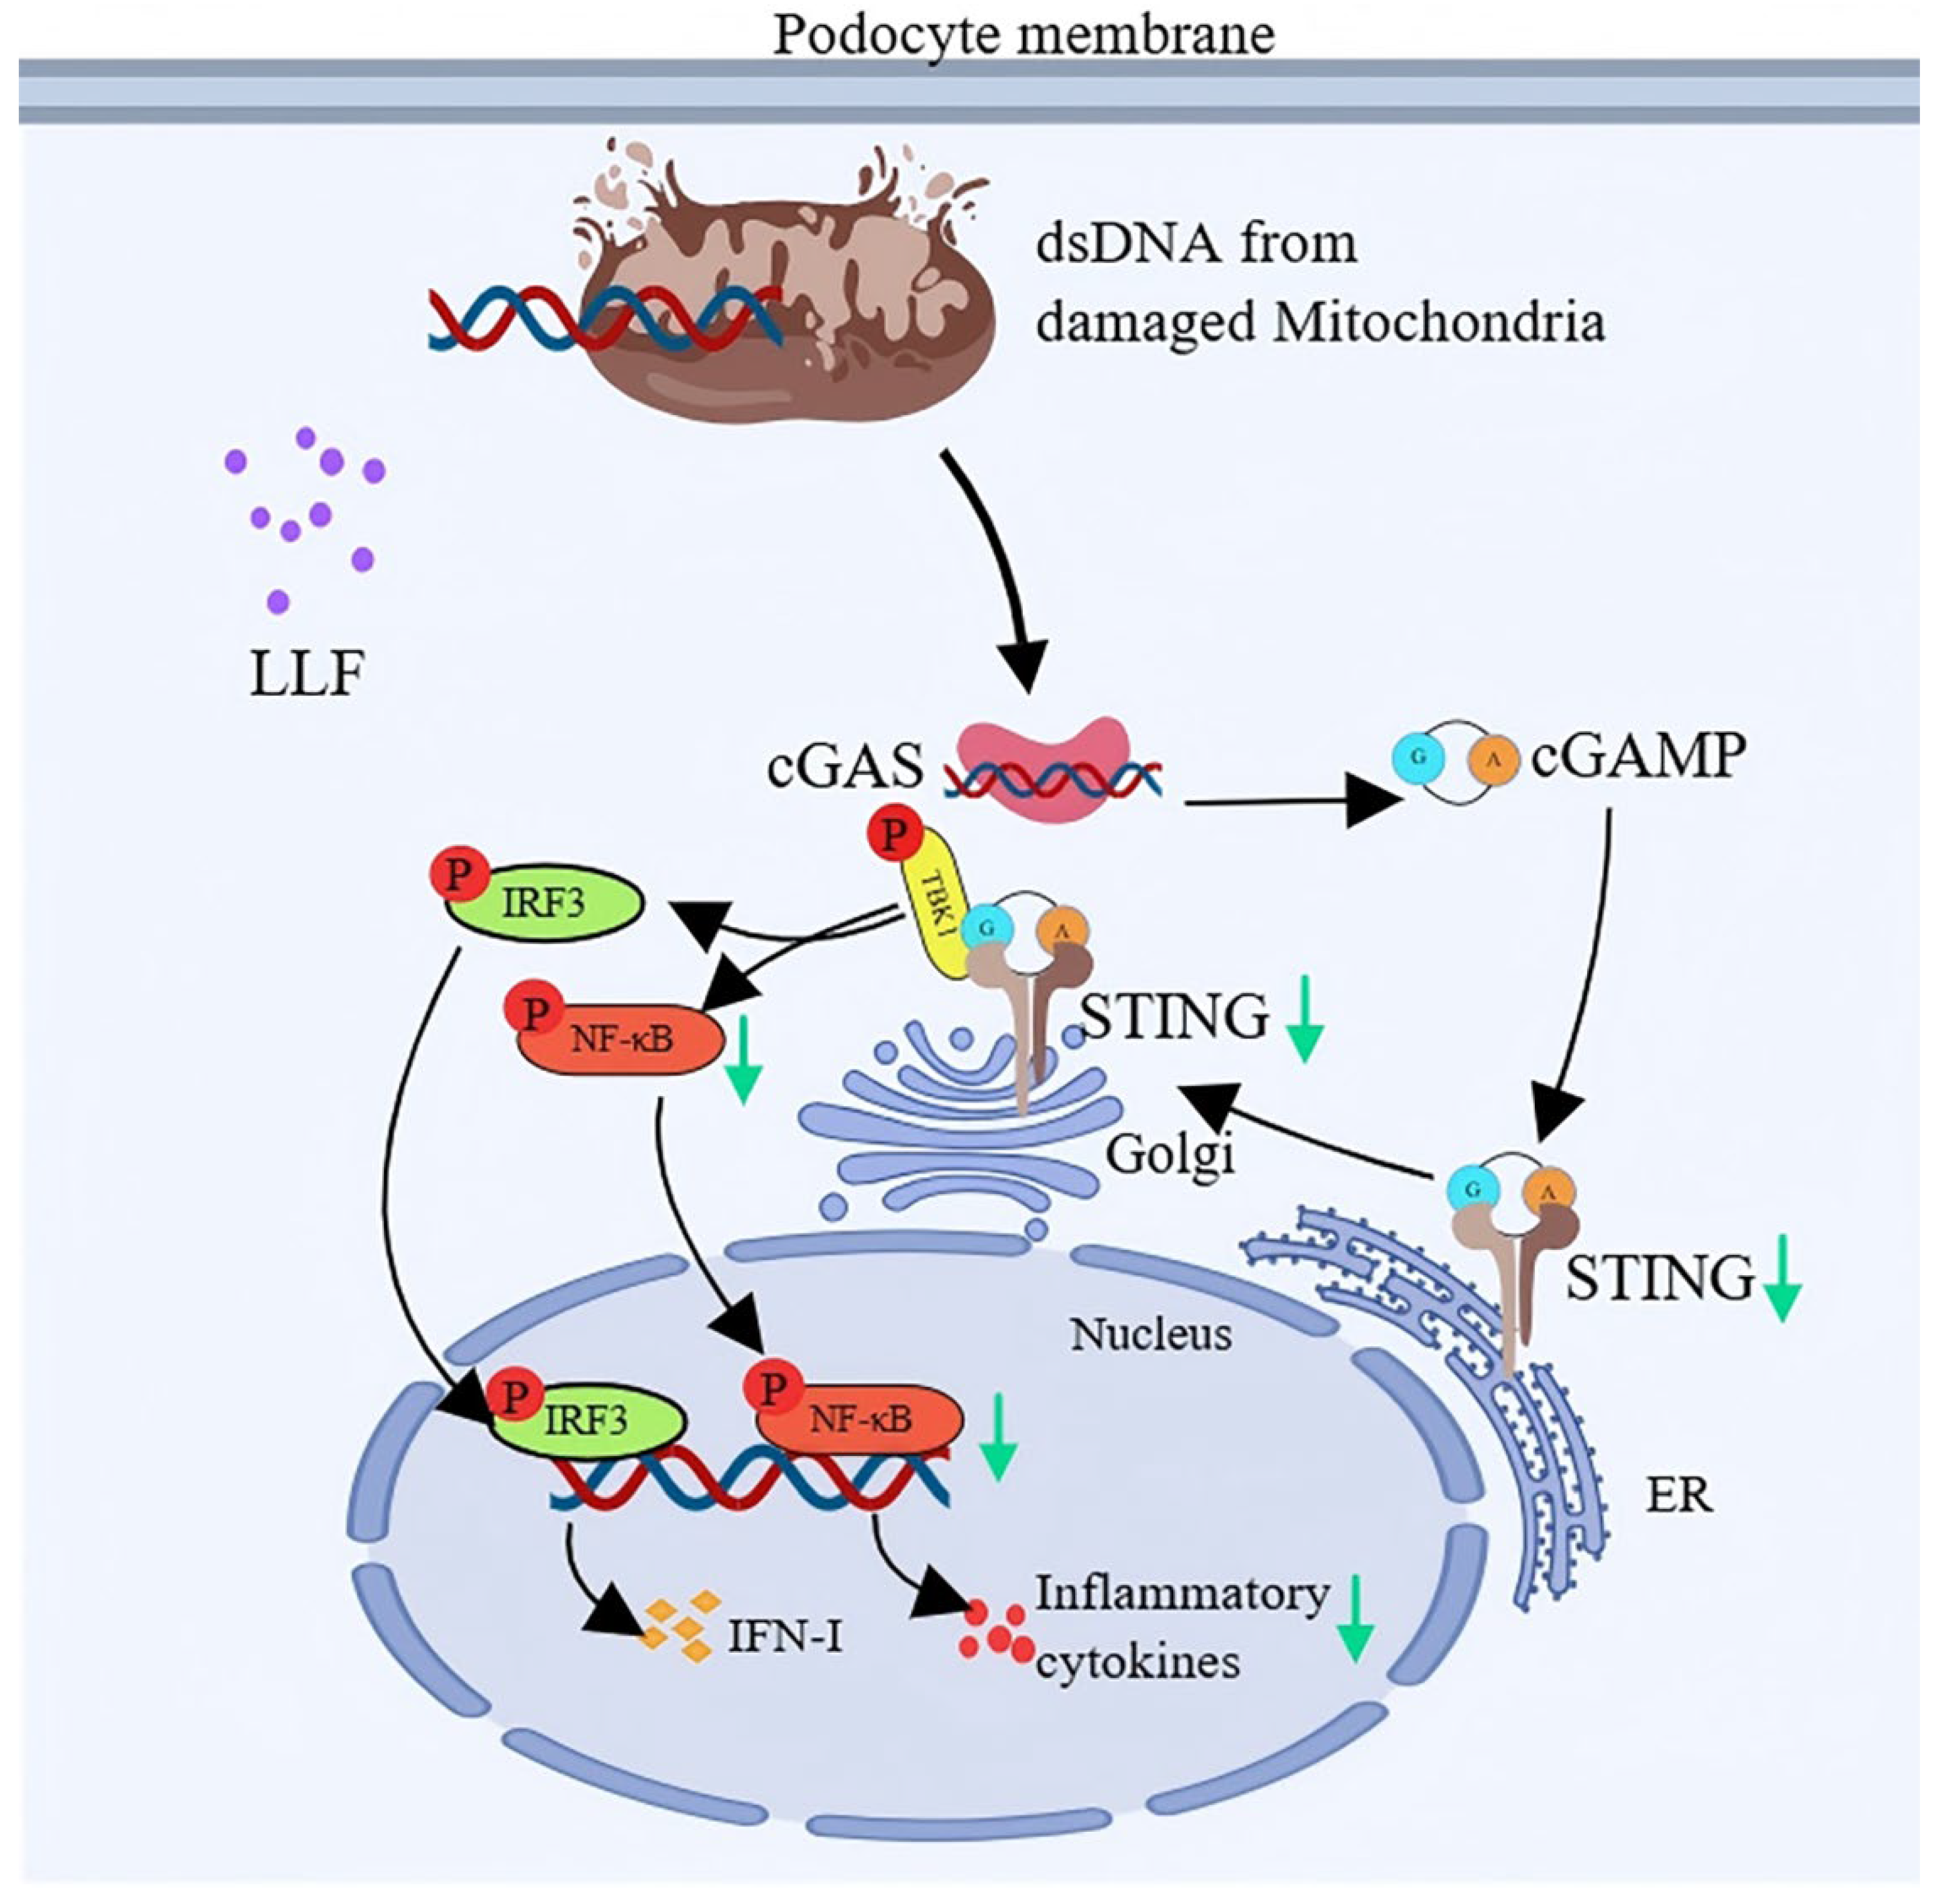
2.12. Modulation of the cGAS-STING Pathway by LLF-Containing Serum in MPC5 Podocytes
3. Discussion
4. Materials and Methods
4.1. Bioactive Component Identification and Target Gene Profiling in LLF
4.2. Screening of DN-Related Targets
4.3. Obtaining the Intersection Targets
4.4. Constructing the PPI Network
4.5. Constructing a “Component–Target–Disease” Network
4.6. Functional Enrichment Analysis of GO and KEGG Pathways
4.7. GEO Analysis
4.8. Molecular Docking
4.9. Molecular Dynamics
4.10. Preparation of LLF Extract
4.11. Preparation of Drug-Containing Serum
4.12. Cell Culture
4.13. Modeling Concentration and Time Selection
4.14. Optimization of Drug Concentration and Dosing Time
4.15. Cell Grouping and Treatment
4.16. Cell Migration Experiment
4.17. Detection of Cellular ROS
4.18. Detection of Cellular Inflammatory Factors
4.19. qRT-PCR Analysis
4.20. Western Blot
4.21. Statistical Analysis
5. Conclusions
Supplementary Materials
Author Contributions
Funding
Institutional Review Board Statement
Informed Consent Statement
Data Availability Statement
Conflicts of Interest
Abbreviations
| DN | Diabetic nephropathy |
| LLF | Ligustri Lucidi Fructus |
| TCM | Traditional Chinese Medicine |
| PA | Palmitic acid |
| Sal | Salidroside |
| Api | Apigenin |
| TA | Tormentic acid |
| GEO | Gene Expression Omnibus |
| CKD | Chronic kidney disease |
| ESKD | End-stage kidney disease |
| AGEs | Advanced Glycation End-products |
| ROS | Reactive oxygen species |
| PPI | Protein–protein interaction |
| GO | Gene Ontology |
| BP | Biological process |
| CC | Cellular component |
| MF | Molecular function |
| RMSD | Root mean square deviation |
| RMSF | Root mean square fluctuation |
| Rg | Radius of gyration |
| SASA | Solvent accessible surface area |
| DAMPs | Damage-associated molecular patterns |
| FFAs | Free fatty acids |
| T2DN | Type 2 diabetic nephropathy |
| GI | Gastrointestinal |
| CBS | Control group treated with blank serum |
| MBS | Model group treated with blank serum |
| SD | Standard deviation |
| ANOVA | Analysis of variance |
| CADD | Computer-aided drug design |
References
- Pelle, M.C.; Provenzano, M.; Busutti, M.; Porcu, C.V.; Zaffina, I.; Stanga, L.; Arturi, F. Up-Date on Diabetic Nephropathy. Life 2022, 12, 1202. [Google Scholar] [CrossRef]
- Griffin, T.P.; O’Shea, P.M.; Smyth, A.; Islam, M.N.; Wall, D.; Ferguson, J.; O’Sullivan, E.; Finucane, F.M.; Dinneen, S.F.; Dunne, F.P.; et al. Burden of chronic kidney disease and rapid decline in renal function among adults attending a hospital-based diabetes center in Northern Europe. BMJ. Open. Diabetes Res. Care. 2021, 9, e002125. [Google Scholar] [CrossRef] [PubMed]
- Hu, Q.; Jiang, L.; Yan, Q.; Zeng, J.; Ma, X.; Zhao, Y. A natural products solution to diabetic nephropathy therapy. Pharmacol. Ther. 2023, 241, 108314. [Google Scholar] [CrossRef]
- Oshima, M.; Shimizu, M.; Yamanouchi, M.; Toyama, T.; Hara, A.; Furuichi, K.; Wada, T. Trajectories of kidney function in diabetes: A clinicopathological update. Nat. Rev. Nephrol. 2021, 17, 740–750. [Google Scholar] [CrossRef] [PubMed]
- Yang, Y.; Tan, H.; Zhang, X.; Huang, M.; Bei, W.; Guo, J. Fufang Zhenzhu Tiaozhi capsule attenuates renal damage by restoring Th17/Treg balance in diabetic db/db mice. J. Holist. Integr. Pharm. 2022, 3, 32–44. [Google Scholar] [CrossRef]
- Ma, R.; He, Y.; Fang, Q.; Xie, G.; Qi, M. Ferulic acid ameliorates renal injury via improving autophagy to inhibit inflammation in diabetic nephropathy mice. Biomed. Pharmacother. 2022, 153, 113424. [Google Scholar] [CrossRef]
- Georgianos, P.I.; Vaios, V.; Eleftheriadis, T.; Papachristou, E.; Liakopoulos, V. Therapeutic Advances in Diabetic Kidney Disease. Int. J. Mol. Sci. 2023, 24, 2803. [Google Scholar] [CrossRef]
- Rossing, P.; Caramori, M.L.; Chan, J.C.N.; Heerspink, H.J.L.; Hurst, C.; Khunti, K.; Liew, A.; Michos, E.D.; Navaneethan, S.D.; Olowu, W.A.; et al. Executive summary of the KDIGO 2022 Clinical Practice Guideline for Diabetes Management in Chronic Kidney Disease: An update based on rapidly emerging new evidence. Kidney Int. 2022, 102, 990–999. [Google Scholar] [CrossRef]
- Cao, M.; Wu, J.; Peng, Y.; Dong, B.; Jiang, Y.; Hu, C.; Yu, L.; Chen, Z. Ligustri Lucidi Fructus, a traditional Chinese Medicine: Comprehensive review of botany, traditional uses, chemical composition, pharmacology, and toxicity. J. Ethnopharmacol. 2023, 301, 115789. [Google Scholar] [CrossRef]
- Hu, B.; Du, Q.; Deng, S.; An, H.M.; Pan, C.F.; Shen, K.P.; Xu, L.; Wei, M.M.; Wang, S.S. Ligustrum lucidum Ait. fruit extract induces apoptosis and cell senescence in human hepatocellular carcinoma cells through upregulation of p21. Oncol. Rep. 2014, 32, 1037–1042. [Google Scholar] [CrossRef]
- Liu, C.W.; Wu, J.; Yi, M.D.; Li, Y.X. Research on sitting posture detection method based on flexible film pressure sensor. In Proceedings of the International Conference on Sensors and Instruments SPIE 2021, Qingdao, China, 28–31 May 2021. [Google Scholar] [CrossRef]
- Tang, N.; Ren, Y.Y.; Wu, H.T.; Lv, X.T.; Liu, X.T.; Li, Q.L.; Wang, G.E.; Wu, Y.H. Specnuezhenide ameliorates ultraviolet-induced skin photoaging in mice by regulating the Sirtuin 3/8-Oxoguanine DNA glycosylase signal. Photodermatol. Photoimmunol. Photomed. 2023, 39, 478–486. [Google Scholar] [CrossRef] [PubMed]
- Ravipati, A.S.; Zhang, L.; Koyyalamudi, S.R.; Jeong, S.C.; Reddy, N.; Bartlett, J.; Smith, P.T.; Shanmugam, K.; Münch, G.; Wu, M.J.; et al. Antioxidant and anti-inflammatory activities of selected Chinese medicinal plants and their relation with antioxidant content. BMC Complement. Altern. Med. 2012, 12, 173. [Google Scholar] [CrossRef]
- Gao, L.; Li, C.; Wang, Z.; Liu, X.; You, Y.; Wei, H.; Guo, T. Ligustri lucidi fructus as a traditional Chinese medicine: A review of its phytochemistry and pharmacology. Nat. Prod. Res. 2015, 29, 493–510. [Google Scholar] [CrossRef] [PubMed]
- Li, Z.; Meng, C.; Azad, M.A.K.; Zhu, Q.; Lin, W.; Cui, Y.; Lan, W.; He, Q.; Kong, X. Effects of the Salvia miltiorrhiza, Ligustrum lucidum, and Taraxacum mongolicum ultra-fine powder formula on meat quality of aged layers by multi-omics. Poult. Sci. 2025, 104, 104783. [Google Scholar] [CrossRef] [PubMed]
- Zhang, Y.; Lai, W.P.; Leung, P.C.; Che, C.T.; Wong, M.S. Improvement of Ca balance by Fructus ligustri lucidi extract in aged female rats. Osteoporos. Int. 2008, 19, 235–242. [Google Scholar] [CrossRef] [PubMed]
- Feng, X.; Lyu, Y.; Wu, Z.; Fang, Y.; Xu, H.; Zhao, P.; Xu, Y.; Feng, H. Fructus ligustri lucidi ethanol extract improves bone mineral density and properties through modulating calcium absorption-related gene expression in kidney and duodenum of growing rats. Calcif. Tissue Int. 2014, 94, 433–441. [Google Scholar] [CrossRef]
- Wu, C.R.; Lin, W.H.; Hseu, Y.C.; Lien, J.C.; Lin, Y.T.; Kuo, T.P.; Ching, H. Evaluation of the antioxidant activity of five endemic Ligustrum species leaves from Taiwan flora in vitro. Food Chem. 2011, 127, 564–571. [Google Scholar] [CrossRef]
- Luan, R.; Zhao, P.; Zhang, X.; Li, Q.; Chen, X.; Wang, L. Pharmacodynamics, Pharmacokinetics, and Kidney Distribution of Raw and Wine-Steamed Ligustri Lucidi Fructus Extracts in Diabetic Nephropathy Rats. Molecules 2023, 28, 791. [Google Scholar] [CrossRef]
- Xie, R.Y.; Fang, X.L.; Zheng, X.B.; Lv, W.Z.; Li, Y.J.; Ibrahim Rage, H.; He, Q.L.; Zhu, W.P.; Cui, T.X. Salidroside and FG-4592 ameliorate high glucose-induced glomerular endothelial cells injury via HIF upregulation. Biomed. Pharmacother. 2019, 118, 109175. [Google Scholar] [CrossRef]
- Xue, H.; Li, P.; Luo, Y.; Wu, C.; Liu, Y.; Qin, X.; Huang, X.; Sun, C. Salidroside stimulates the Sirt1/PGC-1α axis and ameliorates diabetic nephropathy in mice. Phytomedicine 2019, 54, 240–247. [Google Scholar] [CrossRef]
- Wang, S.; Zhao, X.; Yang, S.; Chen, B.; Shi, J. Salidroside alleviates high glucose-induced oxidative stress and extracellular matrix accumulation in rat glomerular mesangial cells by the TXNIP-NLRP3 inflammasome pathway. Chem. Biol. Interact. 2017, 278, 48–53. [Google Scholar] [CrossRef]
- Iskender, H.; Dokumacioglu, E.; Hayirli, A.; Kapakin, K.A.T.; Bolat, I.; Kirman, E.M. Effects of oleanolic acid administration on renal NF-kB, IL-18, IL-6, YKL-40, and KIM-1 in experimental diabetic rats. Iran. J. Basic Med. Sci. 2023, 26, 1188–1193. [Google Scholar] [CrossRef] [PubMed]
- Dubey, V.K.; Patil, C.R.; Kamble, S.M.; Tidke, P.S.; Patil, K.R.; Maniya, P.J.; Jadhav, R.B.; Patil, S.P. Oleanolic acid prevents progression of streptozotocin induced diabetic nephropathy and protects renal microstructures in Sprague Dawley rats. J. Pharmacol. Pharmacother. 2013, 4, 47–52. [Google Scholar] [CrossRef]
- Mei, H.; Jing, T.; Liu, H.; Liu, Y.; Zhu, X.; Wang, J.; Xu, L. Ursolic Acid Alleviates Mitotic Catastrophe in Podocyte by Inhibiting Autophagic P62 Accumulation in Diabetic Nephropathy. Int. J. Biol. Sci. 2024, 20, 3317–3333. [Google Scholar] [CrossRef] [PubMed]
- Xu, H.L.; Wang, X.T.; Cheng, Y.; Zhao, J.G.; Zhou, Y.J.; Yang, J.J.; Qi, M.Y. Ursolic acid improves diabetic nephropathy via suppression of oxidative stress and inflammation in streptozotocin-induced rats. Biomed. Pharmacother. 2018, 105, 915–921. [Google Scholar] [CrossRef]
- Hopkins, A.L. Network pharmacology. Nat. Biotechnol. 2007, 25, 1110–1111. [Google Scholar] [CrossRef]
- Li, S.; Zhang, B. Traditional Chinese medicine network pharmacology: Theory, methodology and application. Chin. J. Nat. Med. 2013, 11, 110–120. [Google Scholar] [CrossRef] [PubMed]
- Pinzi, L.; Rastelli, G. Molecular docking: Shifting paradigms in drug discovery. Int. J. Mol. Sci. 2019, 20, 4331. [Google Scholar] [CrossRef]
- Filipe, H.A.L.; Loura, L.M.S. Molecular Dynamics Simulations: Advances and Applications. Molecules 2022, 27, 2105. [Google Scholar] [CrossRef]
- Chen, L.; Huang, D.; Jiang, L.; Yang, J.; Shi, X.; Wang, R.; Li, W. A review of botany, phytochemistry, pharmacology, and applications of the herb with the homology of medicine and food: Ligustrum lucidum W.T. Aiton. Front. Pharmacol. 2024, 15, 1330732. [Google Scholar] [CrossRef]
- Wu, R.; Wei, F.; Qu, L.; Bai, L.; Li, J.; Li, F.; Yan, W.; Wang, Q.; Wei, J. Effects of Keluoxin capsule combined with losartan potassium on diabetic kidney disease: Study protocol for a randomized double-blind placebo-controlled multicenter clinical trial. Trials 2020, 21, 951. [Google Scholar] [CrossRef] [PubMed]
- Zhou, X.F.; Zhou, W.E.; Liu, W.J.; Luo, M.J.; Wu, X.Q.; Wang, Y.; Liu, P.; Wen, Y.M.; Li, J.L.; Zhao, T.T.; et al. A Network Pharmacology Approach to Explore the Mechanism of HuangZhi YiShen Capsule for Treatment of Diabetic Kidney Disease. J. Transl. Int. Med. 2021, 9, 98–113. [Google Scholar] [CrossRef]
- Peng, M.; Xia, T.; Zhong, Y.; Zhao, M.; Yue, Y.; Liang, L.; Zhong, R.; Zhang, H.; Li, C.; Cao, X.; et al. Integrative pharmacology reveals the mechanisms of Erzhi Pill, a traditional Chinese formulation, against diabetic cardiomyopathy. J. Ethnopharmacol. 2022, 296, 115474. [Google Scholar] [CrossRef] [PubMed]
- Zhang, D.; Xiong, L.; Fang, L.; Li, H.; Zhao, X.; Luan, R.; Zhao, P.; Zhang, X. Systematic characterization of the absorbed components of Ligustri Lucidi Fructus and their metabolic pathways in rat plasma by ultra-high-performance liquid chromatography-Q-Exactive Orbitrap tandem mass spectrometry combined with network pharmacology. J. Sep. Sci. 2021, 44, 4343–4367. [Google Scholar] [CrossRef]
- Pei, D.; Tian, S.; Bao, Y.; Zhang, J.; Xu, D.; Piao, M. Protective effect of salidroside on streptozotocin-induced diabetic nephropathy by inhibiting oxidative stress and inflammation in rats via the Akt/GSK-3β signalling pathway. Pharm. Biol. 2022, 60, 1732–1738. [Google Scholar] [CrossRef]
- Shati, A.A.; Alfaifi, M.Y. Salidroside protects against diabetes mellitus-induced kidney injury and renal fibrosis by attenuating TGF-β1 and Wnt1/3a/β-catenin signalling. Clin. Exp. Pharmacol. Physiol. 2020, 47, 1692–1704. [Google Scholar] [CrossRef]
- Yin, D.; Yao, W.; Chen, S.; Hu, R.; Gao, X. Salidroside, the main active compound of Rhodiola plants, inhibits high glucose-induced mesangial cell proliferation. Planta Med. 2009, 75, 1191–1195. [Google Scholar] [CrossRef]
- Wu, D.; Yang, X.; Zheng, T.; Xing, S.; Wang, J.; Chi, J.; Bian, F.; Li, W.; Xu, G.; Bai, X.; et al. A novel mechanism of action for salidroside to alleviate diabetic albuminuria: Effects on albumin transcytosis across glomerular endothelial cells. Am. J. Physiol. Endocrinol. Metab. 2016, 310, E225–E237. [Google Scholar] [CrossRef] [PubMed]
- Shati, A.A. Salidroside ameliorates diabetic nephropathy in rats by activating renal AMPK/SIRT1 signaling pathway. J. Food. Biochem. 2020, 44, e13158. [Google Scholar] [CrossRef]
- Hu, Q.; Qu, C.; Xiao, X.; Zhang, W.; Jiang, Y.; Wu, Z.; Song, D.; Peng, X.; Ma, X.; Zhao, Y. Flavonoids on diabetic nephropathy: Advances and therapeutic opportunities. Chin. Med. 2021, 16, 74. [Google Scholar] [CrossRef]
- Malik, S.; Suchal, K.; Khan, S.I.; Bhatia, J.; Kishore, K.; Dinda, A.K.; Arya, D.S. Apigenin ameliorates streptozotocin-induced diabetic nephropathy in rats via MAPK-NF-κB-TNF-α and TGF-β1-MAPK-fibronectin pathways. Am. J. Physiol. Renal Physiol. 2017, 313, F414–F422. [Google Scholar] [CrossRef] [PubMed]
- Hou, Y.; Zhang, Y.; Lin, S.; Yu, Y.; Yang, L.; Li, L.; Wang, W. Protective mechanism of apigenin in diabetic nephropathy is related to its regulation of miR-423-5P-USF2 axis. Am. J. Transl. Res. 2021, 13, 2006–2020. [Google Scholar] [PubMed]
- Zhang, J.; Zhao, X.; Zhu, H.; Wang, J.; Ma, J.; Gu, M. Apigenin Protects Against Renal Tubular Epithelial Cell Injury and Oxidative Stress by High Glucose via Regulation of NF-E2-Related Factor 2 (Nrf2) Pathway. Med. Sci. Monit. 2019, 25, 5280–5288. [Google Scholar] [CrossRef]
- Olech, M.; Ziemichód, W.; Nowacka-Jechalke, N. The Occurrence and Biological Activity of Tormentic Acid—A Review. Molecules 2021, 26, 3797. [Google Scholar] [CrossRef]
- Cartwright, T.; Perkins, N.D.; Wilson, C.L. NFKB1: A suppressor of inflammation, ageing and cancer. FEBS J. 2016, 283, 1812–1822. [Google Scholar] [CrossRef] [PubMed]
- Hojjati, F.; Roointan, A.; Gholaminejad, A.; Eshraghi, Y.; Gheisari, Y. Identification of key genes and biological regulatory mechanisms in diabetic nephropathy: Meta-analysis of gene expression datasets. Nefrologia (Engl. Ed). 2023, 43, 575–586. [Google Scholar] [CrossRef]
- Asmy, V.K.S.S.; Natarajan, J. Comparative co-expression analysis of RNA-Seq transcriptome revealing key genes, miRNA and transcription factor in distinct metabolic pathways in diabetic nerve, eye, and kidney disease. Genom. Inform. 2022, 20, e26. [Google Scholar] [CrossRef]
- Baeuerle, P.A.; Baltimore, D. Activation of DNA-binding activity in an apparently cytoplasmic precursor of the NF-kappa B transcription factor. Cell 1988, 53, 211–217. [Google Scholar] [CrossRef]
- Ming, J.; Sana, S.R.G.L.; Deng, X. Identification of copper-related biomarkers and potential molecule mechanism in diabetic nephropathy. Front. Endocrinol 2022, 13, 978601. [Google Scholar] [CrossRef]
- Navarro-González, J.F.; Mora-Fernández, C. The role of inflammatory cytokines in diabetic nephropathy. J. Am. Soc. Nephrol. 2008, 19, 433–442. [Google Scholar] [CrossRef]
- Elmarakby, A.A.; Sullivan, J.C. Relationship between oxidative stress and inflammatory cytokines in diabetic nephropathy. Cardiovasc. Ther. 2012, 30, 49–59. [Google Scholar] [CrossRef]
- Navarro-González, J.F.; Jarque, A.; Muros, M.; Mora, C.; García, J. Tumor necrosis factor-alpha as a therapeutic target for diabetic nephropathy. Cytokine Growth Factor Rev. 2009, 20, 165–173. [Google Scholar] [CrossRef] [PubMed]
- Taslipinar, A.; Yaman, H.; Yilmaz, M.I.; Demirbas, S.; Saglam, M.; Taslipinar, M.Y.; Agilli, M.; Kurt, Y.G.; Sonmez, A.; Azal, O.; et al. The relationship between inflammation, endothelial dysfunction and proteinuria in patients with diabetic nephropathy. Scand. J. Clin. Lab. Investig. 2011, 71, 606–612. [Google Scholar] [CrossRef] [PubMed]
- Ng, D.P.; Nurbaya, S.; Ye, S.H.; Krolewski, A.S. An IL-6 haplotype on human chromosome 7p21 confers risk for impaired renal function in type 2 diabetic patients. Kidney Int. 2008, 74, 521–527. [Google Scholar] [CrossRef]
- Feigerlová, E.; Battaglia-Hsu, S.F. IL-6 signaling in diabetic nephropathy: From pathophysiology to therapeutic perspectives. Cytokine Growth Factor Rev. 2017, 37, 57–65. [Google Scholar] [CrossRef] [PubMed]
- Tziastoudi, M.; Theoharides, T.C.; Nikolaou, E.; Efthymiadi, M.; Eleftheriadis, T.; Stefanidis, I. Key Genetic Components of Fibrosis in Diabetic Nephropathy: An Updated Systematic Review and Meta-Analysis. Int. J. Mol. Sci. 2022, 23, 15331. [Google Scholar] [CrossRef]
- Cao, Z.; Huang, D.; Tang, C.; Lu, Y.; Huang, S.; Peng, C.; Hu, X. Pyroptosis in diabetes and diabetic nephropathy. Clin. Chim. Acta 2022, 531, 188–196. [Google Scholar] [CrossRef]
- Aghamiri, S.H.; Komlakh, K.; Ghaffari, M. The crosstalk among TLR2, TLR4 and pathogenic pathways; a treasure trove for treatment of diabetic neuropathy. Inflammopharmacology 2022, 30, 51–60. [Google Scholar] [CrossRef]
- Garibotto, G.; Carta, A.; Picciotto, D.; Viazzi, F.; Verzola, D. Toll-like receptor-4 signaling mediates inflammation and tissue injury in diabetic nephropathy. J. Nephrol. 2017, 30, 719–727. [Google Scholar] [CrossRef]
- Cui, S.; Zhu, Y.; Du, J.; Khan, M.N.; Wang, B.; Wei, J.; Cheng, J.W.; Gordon, J.R.; Mu, Y.; Li, F. CXCL8 Antagonist Improves Diabetic Nephropathy in Male Mice With Diabetes and Attenuates High Glucose-Induced Mesangial Injury. Endocrinology 2017, 158, 1671–1684. [Google Scholar] [CrossRef]
- He, Y.; Li, H.; Wang, R.; Ma, N.; Liu, L.; Shi, R.; Zhang, B.; Lin, N.; Tian, Y. Potential Role and Expression Level of Urinary CXCL8 in Different Stages of Incipient Diabetic Nephropathy with Undiminished Creatinine Clearance: A Pilot Study. Diabetes Metab. Syndr. Obes. 2023, 16, 1783–1790. [Google Scholar] [CrossRef] [PubMed]
- Higurashi, M.; Ohya, Y.; Joh, K.; Muraguchi, M.; Nishimura, M.; Terawaki, H.; Yagui, K.; Hashimoto, N.; Saito, Y.; Yamada, K. Increased urinary levels of CXCL5, CXCL8 and CXCL9 in patients with Type 2 diabetic nephropathy. J. Diabetes Complicat. 2009, 23, 178–184. [Google Scholar] [CrossRef] [PubMed]
- Wang, Y.L.; Sun, G.Y.; Zhang, Y.; He, J.J.; Zheng, S.; Lin, J.N. Tormentic acid inhibits H2O2-induced oxidative stress and inflammation in rat vascular smooth muscle cells via inhibition of the NF-κB signaling pathway. Mol. Med. Rep. 2016, 14, 3559–3564. [Google Scholar] [CrossRef]
- Pagadala, N.S.; Syed, K.; Tuszynski, J. Software for molecular docking: A review. Biophys. Rev. 2017, 9, 91–102. [Google Scholar] [CrossRef]
- Salmaso, V.; Moro, S. Bridging Molecular Docking to Molecular Dynamics in Exploring Ligand-Protein Recognition Process: An Overview. Front. Pharmacol. 2018, 9, 923. [Google Scholar] [CrossRef] [PubMed]
- Sur, S.; Nimesh, H. Challenges and limitations of computer-aided drug design. Adv. Pharmacol. 2025, 103, 415–428. [Google Scholar] [CrossRef]
- Stanzione, F.; Giangreco, I.; Cole, J.C. Use of molecular docking computational tools in drug discovery. Prog. Med. Chem. 2021, 60, 273–343. [Google Scholar] [CrossRef]
- Liu, L.; Jiao, Y.; Yang, M.; Wu, L.; Long, G.; Hu, W. Network Pharmacology, Molecular Docking and Molecular Dynamics to Explore the Potential Immunomodulatory Mechanisms of Deer Antler. Int. J. Mol. Sci. 2023, 24, 10370. [Google Scholar] [CrossRef]
- Mitrofanova, A.; Fontanella, A.; Tolerico, M.; Mallela, S.; Molina David, J.; Zuo, Y.; Boulina, M.; Kim, J.J.; Santos, J.; Ge, M.; et al. Activation of Stimulator of IFN Genes (STING) Causes Proteinuria and Contributes to Glomerular Diseases. J. Am. Soc. Nephrol. 2022, 33, 2153–2173. [Google Scholar] [CrossRef]
- Yanai, H.; Savitsky, D.; Tamura, T.; Taniguchi, T. Regulation of the cytosolic DNA-sensing system in innate immunity: A current view. Curr. Opin. Immunol. 2009, 21, 17–22. [Google Scholar] [CrossRef]
- Kranzusch, P.J.; Lee, A.S.; Berger, J.M.; Doudna, J.A. Structure of human cGAS reveals a conserved family of second-messenger enzymes in innate immunity. Cell. Rep. 2013, 3, 1362–1368. [Google Scholar] [CrossRef] [PubMed]
- Hopfner, K.P.; Hornung, V. Molecular mechanisms and cellular functions of cGAS-STING signalling. Nat. Rev. Mol. Cell. Biol. 2020, 21, 501–521. [Google Scholar] [CrossRef] [PubMed]
- Myakala, K.; Jones, B.A.; Wang, X.X.; Levi, M. Sacubitril/valsartan treatment has differential effects in modulating diabetic kidney disease in db/db mice and KKAy mice compared with valsartan treatment. Am. J. Physiol. Renal Physiol. 2021, 320, F1133–F1151. [Google Scholar] [CrossRef] [PubMed]
- Khedr, S.; Dissanayake, L.V.; Alsheikh, A.J.; Zietara, A.; Spires, D.R.; Kerketta, R.; Mathison, A.J.; Urrutia, R.; Palygin, O.; Staruschenko, A. Role of cGAS/STING pathway in aging and sexual dimorphism in diabetic kidney disease. JCI Insight. 2024, 10, e174126. [Google Scholar] [CrossRef]
- Greka, A.; Mundel, P. Cell biology and pathology of podocytes. Annu. Rev. Physiol. 2012, 74, 299–323. [Google Scholar] [CrossRef]
- Li, X.; Ding, F.; Zhang, X.; Li, B.; Ding, J. The Expression Profile of Complement Components in Podocytes. Int. J. Mol. Sci. 2016, 17, 471. [Google Scholar] [CrossRef]
- Coers, W.; Brouwer, E.; Vos, J.T.; Chand, A.; Huitema, S.; Heeringa, P.; Kallenberg, C.G.; Weening, J.J. Podocyte expression of MHC class I and II and intercellular adhesion molecule-1 (ICAM-1) in experimental pauci-immune crescentic glomerulonephritis. Clin. Exp. Immunol. 1994, 98, 279–286. [Google Scholar] [CrossRef]
- Bao, W.; Xia, H.; Liang, Y.; Ye, Y.; Lu, Y.; Xu, X.; Duan, A.; He, J.; Chen, Z.; Wu, Y.; et al. Toll-like Receptor 9 Can be Activated by Endogenous Mitochondrial DNA to Induce Podocyte Apoptosis. Sci. Rep. 2016, 6, 22579. [Google Scholar] [CrossRef]
- Goldwich, A.; Burkard, M.; Olke, M.; Daniel, C.; Amann, K.; Hugo, C.; Kurts, C.; Steinkasserer, A.; Gessner, A. Podocytes are nonhematopoietic professional antigen-presenting cells. J. Am. Soc. Nephrol. 2013, 24, 906–916. [Google Scholar] [CrossRef]
- Sieber, J.; Lindenmeyer, M.T.; Kampe, K.; Campbell, K.N.; Cohen, C.D.; Hopfer, H.; Mundel, P.; Jehle, A.W. Regulation of podocyte survival and endoplasmic reticulum stress by fatty acids. Am. J. Physiol. Renal Physiol. 2010, 299, F821–F829. [Google Scholar] [CrossRef]
- Sieber, J.; Weins, A.; Kampe, K.; Gruber, S.; Lindenmeyer, M.T.; Cohen, C.D.; Orellana, J.M.; Mundel, P.; Jehle, A.W. Susceptibility of podocytes to palmitic acid is regulated by stearoyl-CoA desaturases 1 and 2. Am. J. Pathol. 2013, 183, 735–744. [Google Scholar] [CrossRef] [PubMed]
- Zang, N.; Cui, C.; Guo, X.; Song, J.; Hu, H.; Yang, M.; Xu, M.; Wang, L.; Hou, X.; He, Q.; et al. cGAS-STING activation contributes to podocyte injury in diabetic kidney disease. iScience 2022, 25, 105145. [Google Scholar] [CrossRef] [PubMed]
- Li, L.; Liu, F.; Feng, C.; Chen, Z.; Zhang, N.; Mao, J. Role of mitochondrial dysfunction in kidney disease: Insights from the cGAS-STING signaling pathway. Chin. Med. J. (Engl.) 2024, 137, 1044–1053. [Google Scholar] [CrossRef] [PubMed]

| Gene | Sense Primer (5′-3′) | Antisense Primer (5′-3′) |
|---|---|---|
| Cgas | TGAGGTCAATGAAGGGGTCGT | GAAGTGTTACAGCAGGGCTTCC |
| Sting | TCGGGTTTATTCCAACAGCG | GTTTAGCCTGCTCAAGCCGAT |
| Tbk1 | GCAGTGCTAAGAAAGGACCATCA | TGCCTGAAGACCCTGAGAAAGAC |
| Rela | CGAGTCTCCATGCAGCTACG | TTTCGGGTAGGCACAGCAATA |
| Il6 | GACTTCCATCCAGTTGCCTTCT | CTCATTTCCACGATTTCCCAGA |
| Il1b | AAATGCCACCTTTTGACAGTGA | AAAGAAGGTGCTCATGTCCTCATCC |
| Tnf | CCCTCACACTCACAAACCACC | CTTTGAGATCCATGCCGTTG |
| GAPDH | CCTCGTCCCGTAGACAAAATG | TGAGGTCAATGAAGGGGTCGT |
| Primary Antibody | Species | Manufacturer | Catalog No. | Observed Molecular Weight | Dilution Ratio |
|---|---|---|---|---|---|
| Nephrin | Rabbit | Abcam | ab216692 | 136 kDa | 1:1000 |
| cGAS | Rabbit | Invitrogen | PA5-121188 | 58 kDa | 1:1000 |
| STING | Rabbit | Proteintech | 80165-1-RR | 35 kDa | 1:1000 |
| p-TBK1 | Rabbit | Proteintech | 82382-2-RR | 84 kDa | 1:1000 |
| TBK1 | Rabbit | Proteintech | 28397-1-AP | 84 kDa | 1:1000 |
| NF-κB p65 | Rabbit | Abcam | ab16502 | 65 kDa | 1:1000 |
| p-NF-κB p65 | Rabbit | Abcam | ab76302 | 65 kDa | 1:1000 |
| β-actin | Rabbit | Abcam | ab8227 | 42 kDa | 1:5000 |
Disclaimer/Publisher’s Note: The statements, opinions and data contained in all publications are solely those of the individual author(s) and contributor(s) and not of MDPI and/or the editor(s). MDPI and/or the editor(s) disclaim responsibility for any injury to people or property resulting from any ideas, methods, instructions or products referred to in the content. |
© 2025 by the authors. Licensee MDPI, Basel, Switzerland. This article is an open access article distributed under the terms and conditions of the Creative Commons Attribution (CC BY) license (https://creativecommons.org/licenses/by/4.0/).
Share and Cite
Liu, M.; Gu, Y.; Yang, Y.; Zhang, K.; Yang, J.; Wang, W.; Li, W.; Wang, X.; Dong, X.; Yin, X.; et al. Network Pharmacology, Molecular Dynamics Simulation, and Biological Validation Insights into the Potential of Ligustri Lucidi Fructus for Diabetic Nephropathy. Int. J. Mol. Sci. 2025, 26, 6303. https://doi.org/10.3390/ijms26136303
Liu M, Gu Y, Yang Y, Zhang K, Yang J, Wang W, Li W, Wang X, Dong X, Yin X, et al. Network Pharmacology, Molecular Dynamics Simulation, and Biological Validation Insights into the Potential of Ligustri Lucidi Fructus for Diabetic Nephropathy. International Journal of Molecular Sciences. 2025; 26(13):6303. https://doi.org/10.3390/ijms26136303
Chicago/Turabian StyleLiu, Manting, Yuhao Gu, Yuchang Yang, Ke Zhang, Jingwen Yang, Wenqi Wang, Wenjing Li, Xinzhu Wang, Xiaoxv Dong, Xingbin Yin, and et al. 2025. "Network Pharmacology, Molecular Dynamics Simulation, and Biological Validation Insights into the Potential of Ligustri Lucidi Fructus for Diabetic Nephropathy" International Journal of Molecular Sciences 26, no. 13: 6303. https://doi.org/10.3390/ijms26136303
APA StyleLiu, M., Gu, Y., Yang, Y., Zhang, K., Yang, J., Wang, W., Li, W., Wang, X., Dong, X., Yin, X., Qu, C., Ni, B., & Ni, J. (2025). Network Pharmacology, Molecular Dynamics Simulation, and Biological Validation Insights into the Potential of Ligustri Lucidi Fructus for Diabetic Nephropathy. International Journal of Molecular Sciences, 26(13), 6303. https://doi.org/10.3390/ijms26136303