

Breaking the Triad: Immune Tolerance Induction Without Antigen Co-Presentation via Tim Agonist for the Treatment of Autoimmune Diseases
Abstract
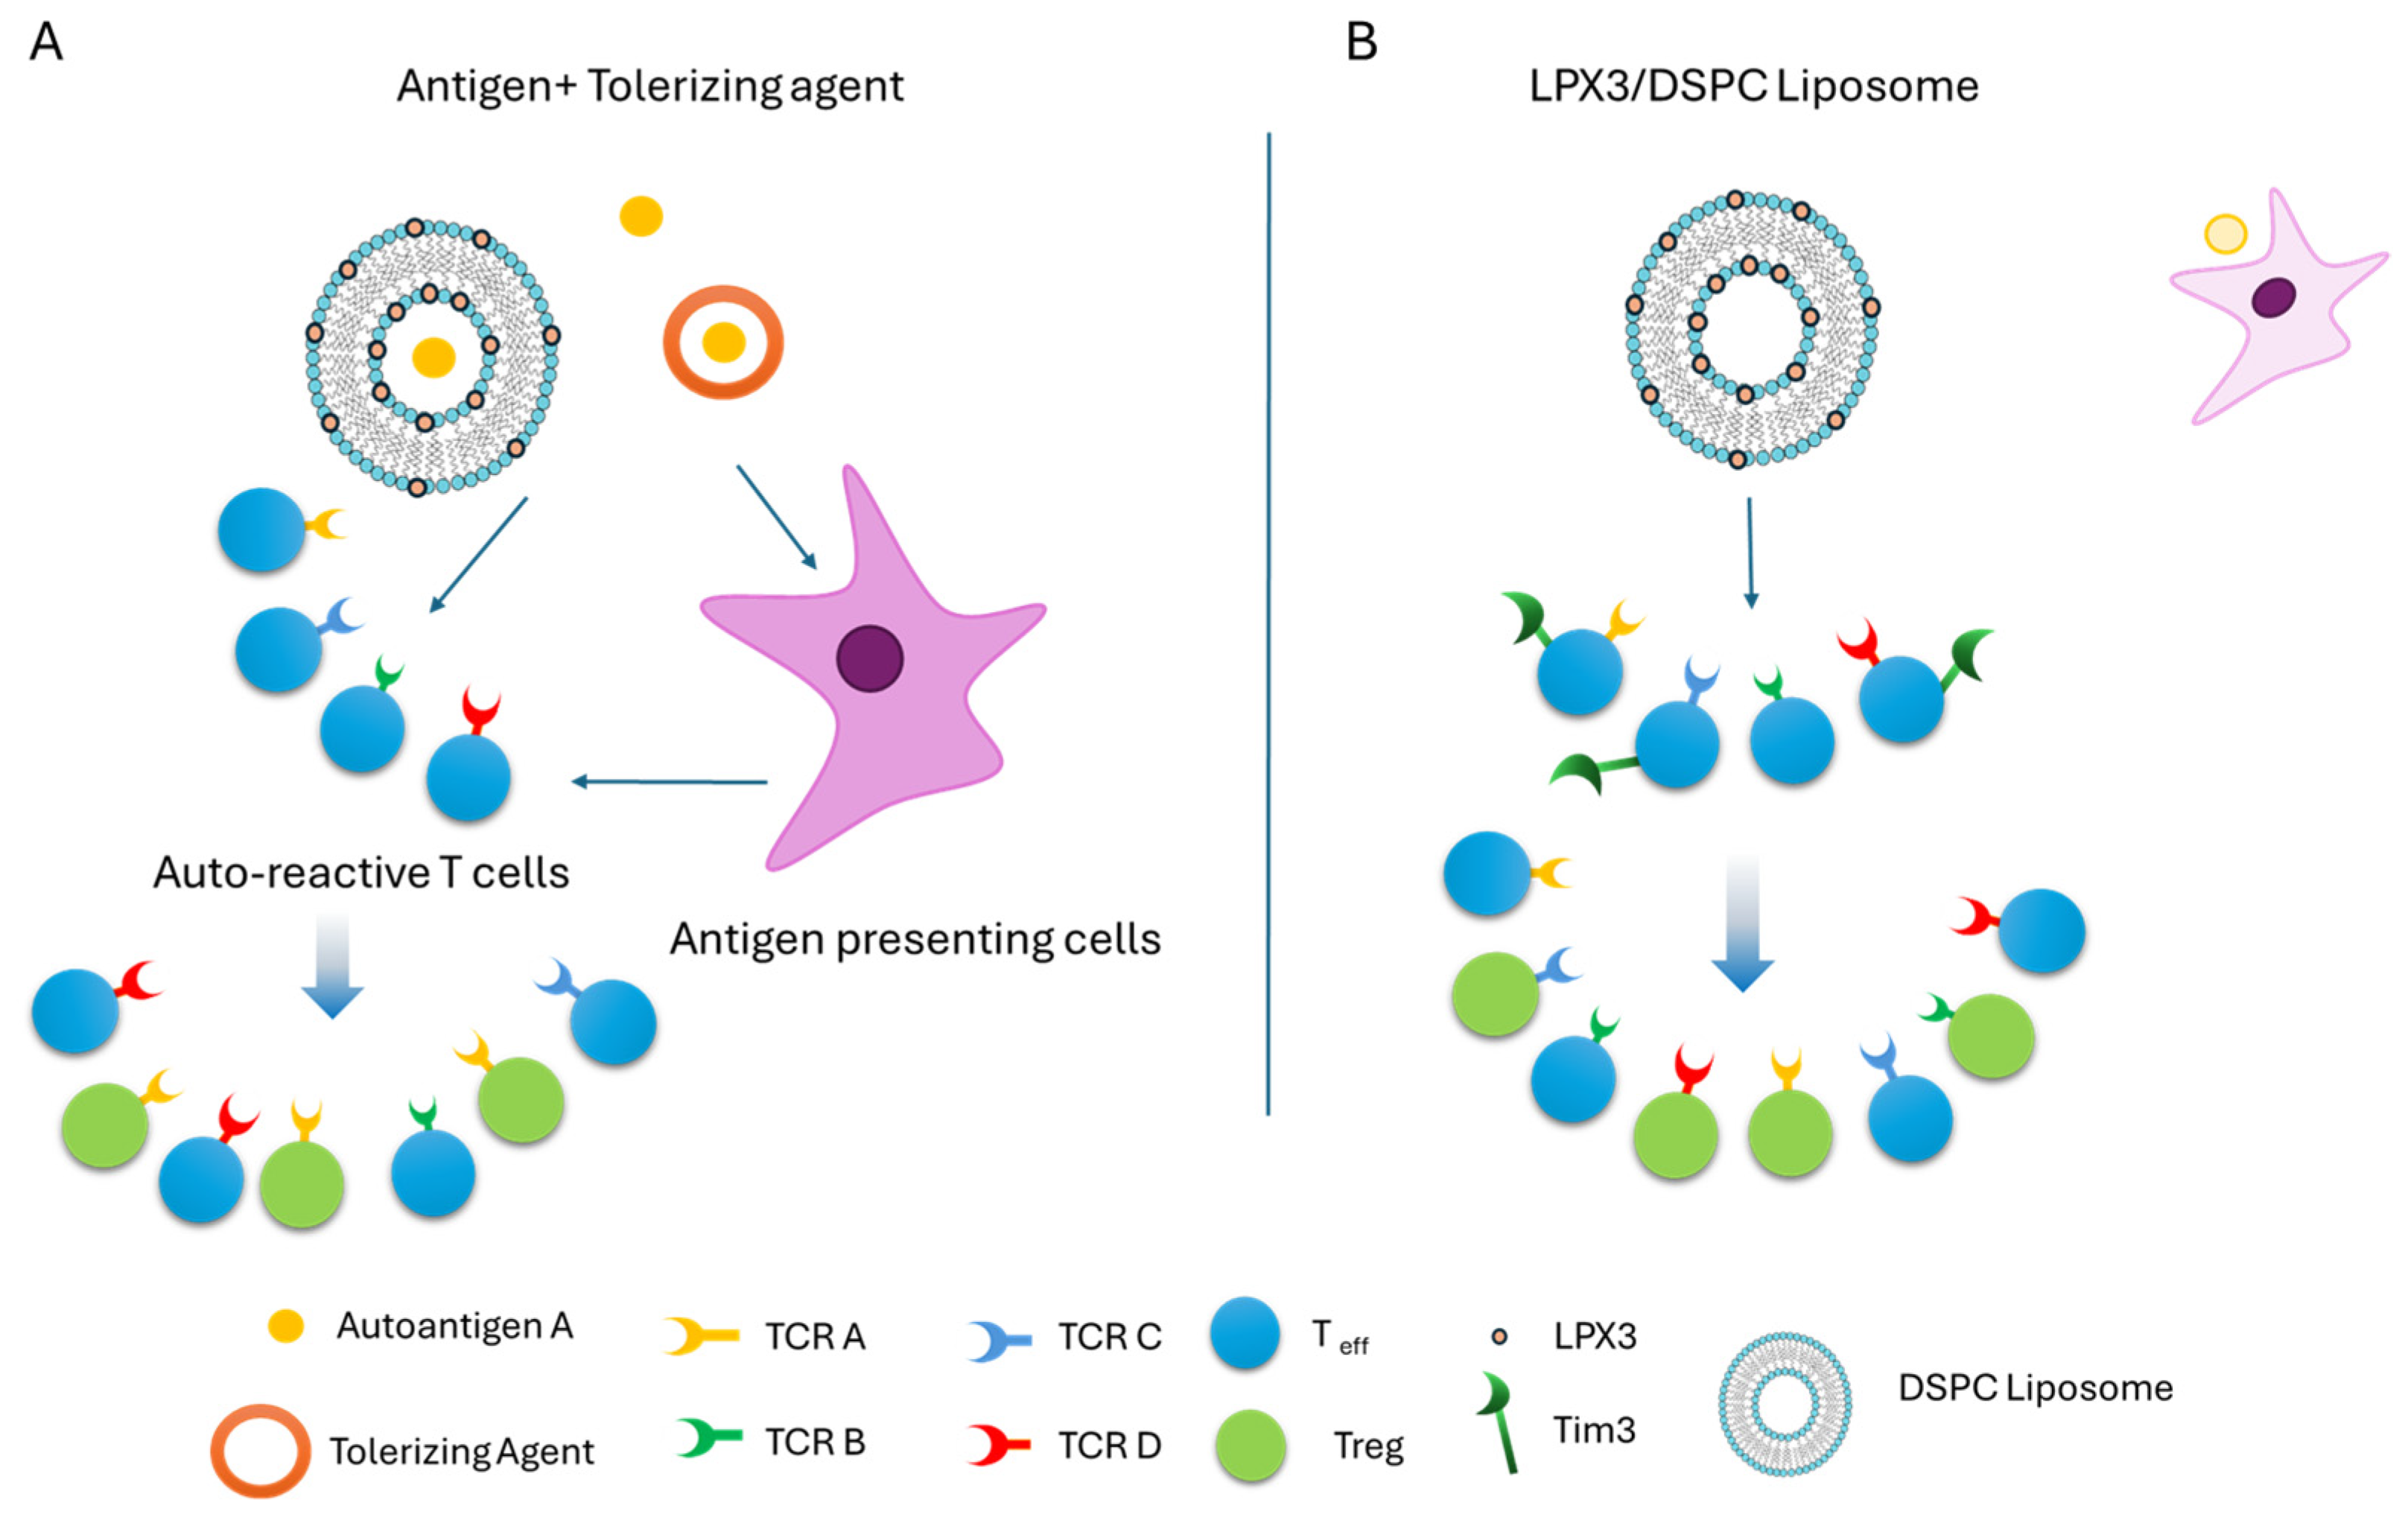
1. Introduction
2. Results
2.1. Optimization of DilC18(5) Dye Incorporation in Liposomes
2.2. Liposomal Formulations and Lymphatic Uptake
2.2.1. Relative Fluorescence Intensity by Lipid Type
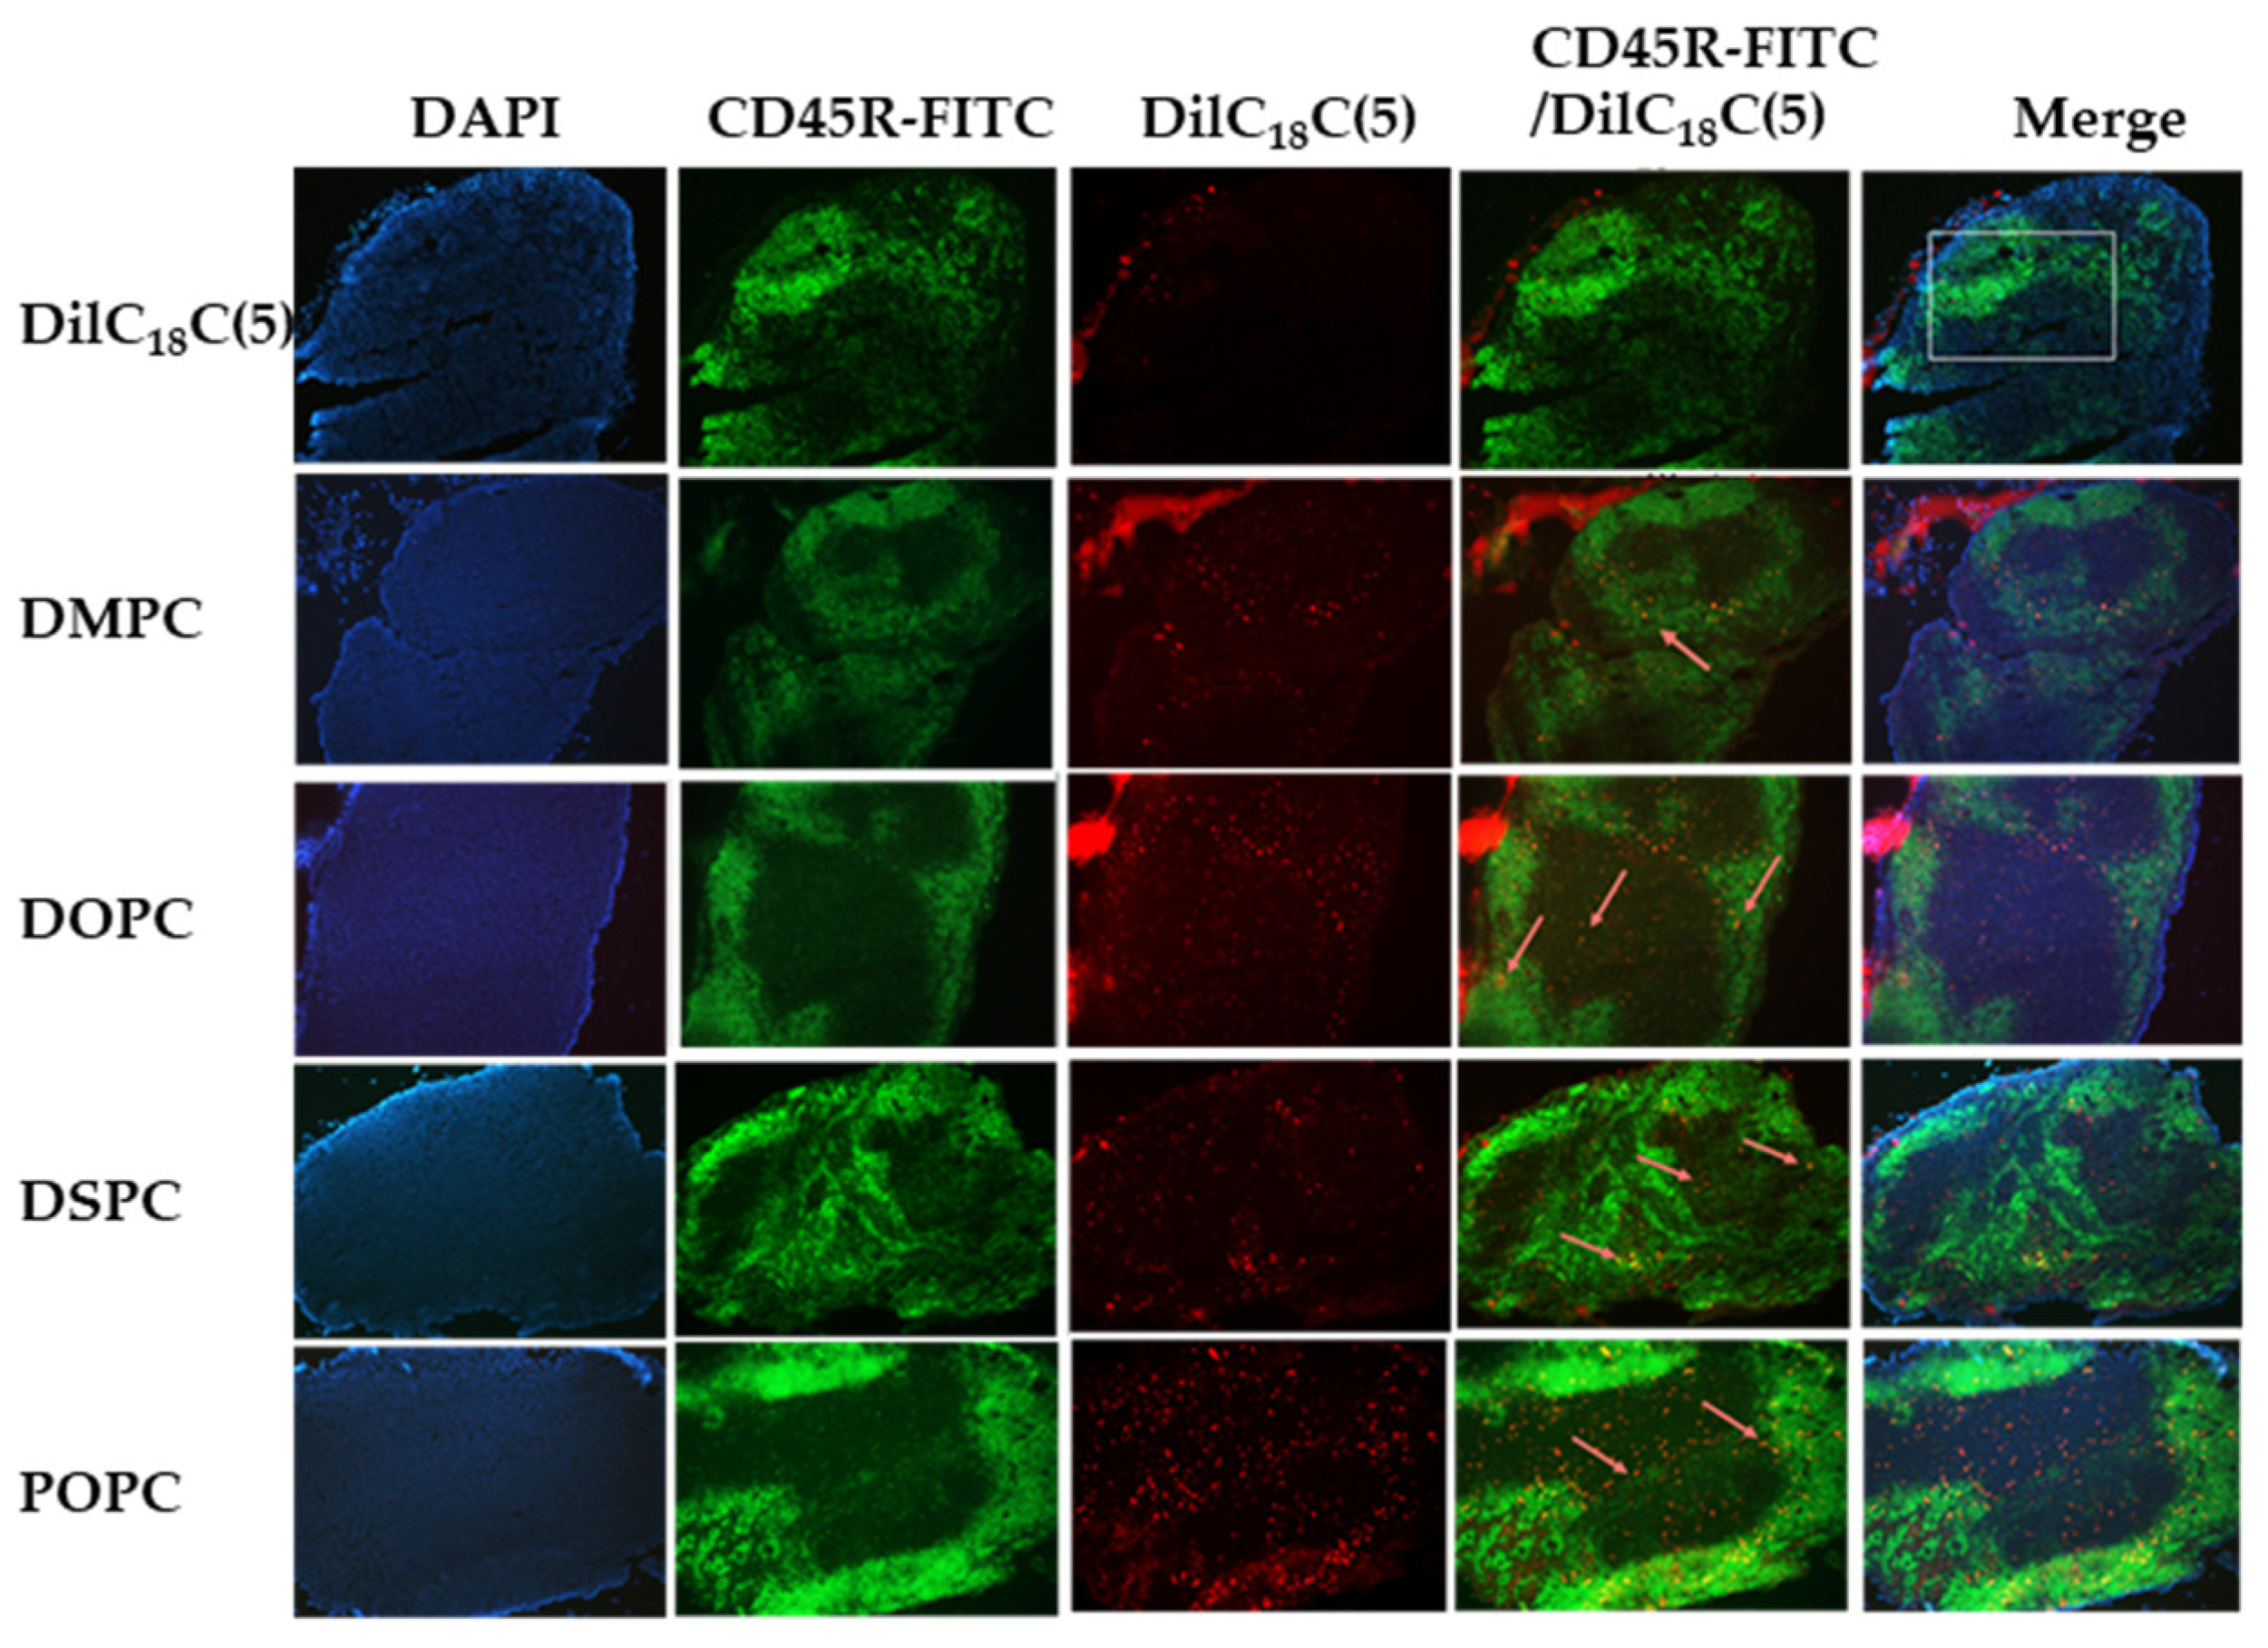
2.2.2. Fluorescent Immunohistochemistry and Free DilC18(5) Uptake
2.2.3. Liposome Uptake and Immune Cell Colocalization by Formulation
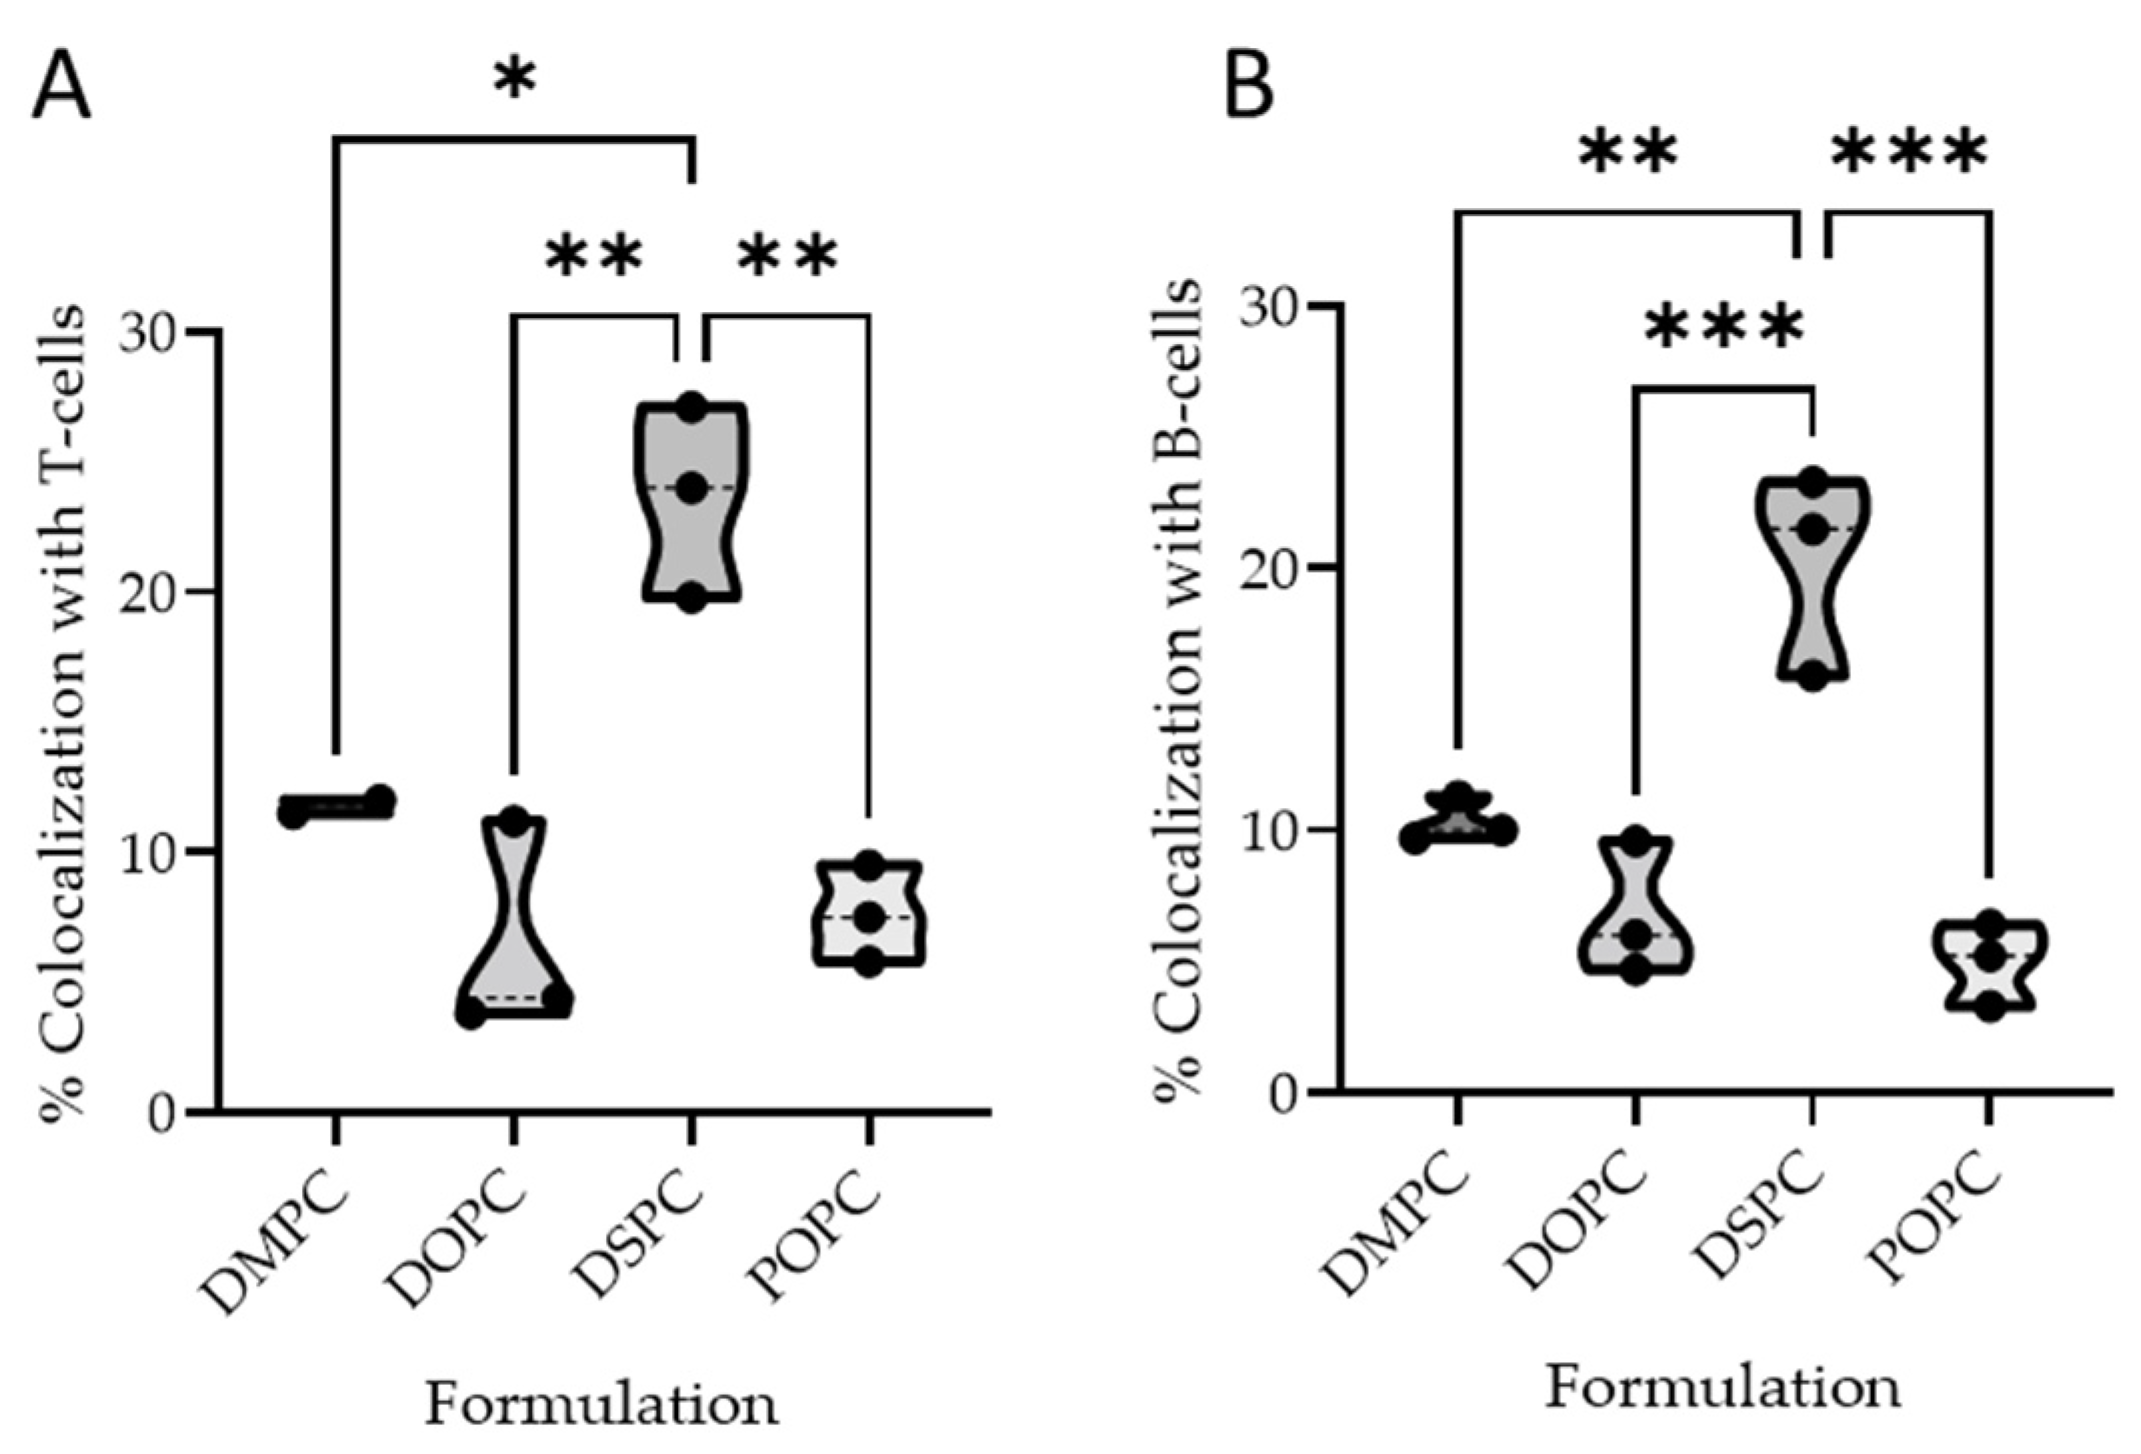
2.2.4. Quantitative Colocalization Analysis
B Cell Colocalization
T Cell Colocalization
2.3. Pharmacology of LPX3 Liposomes
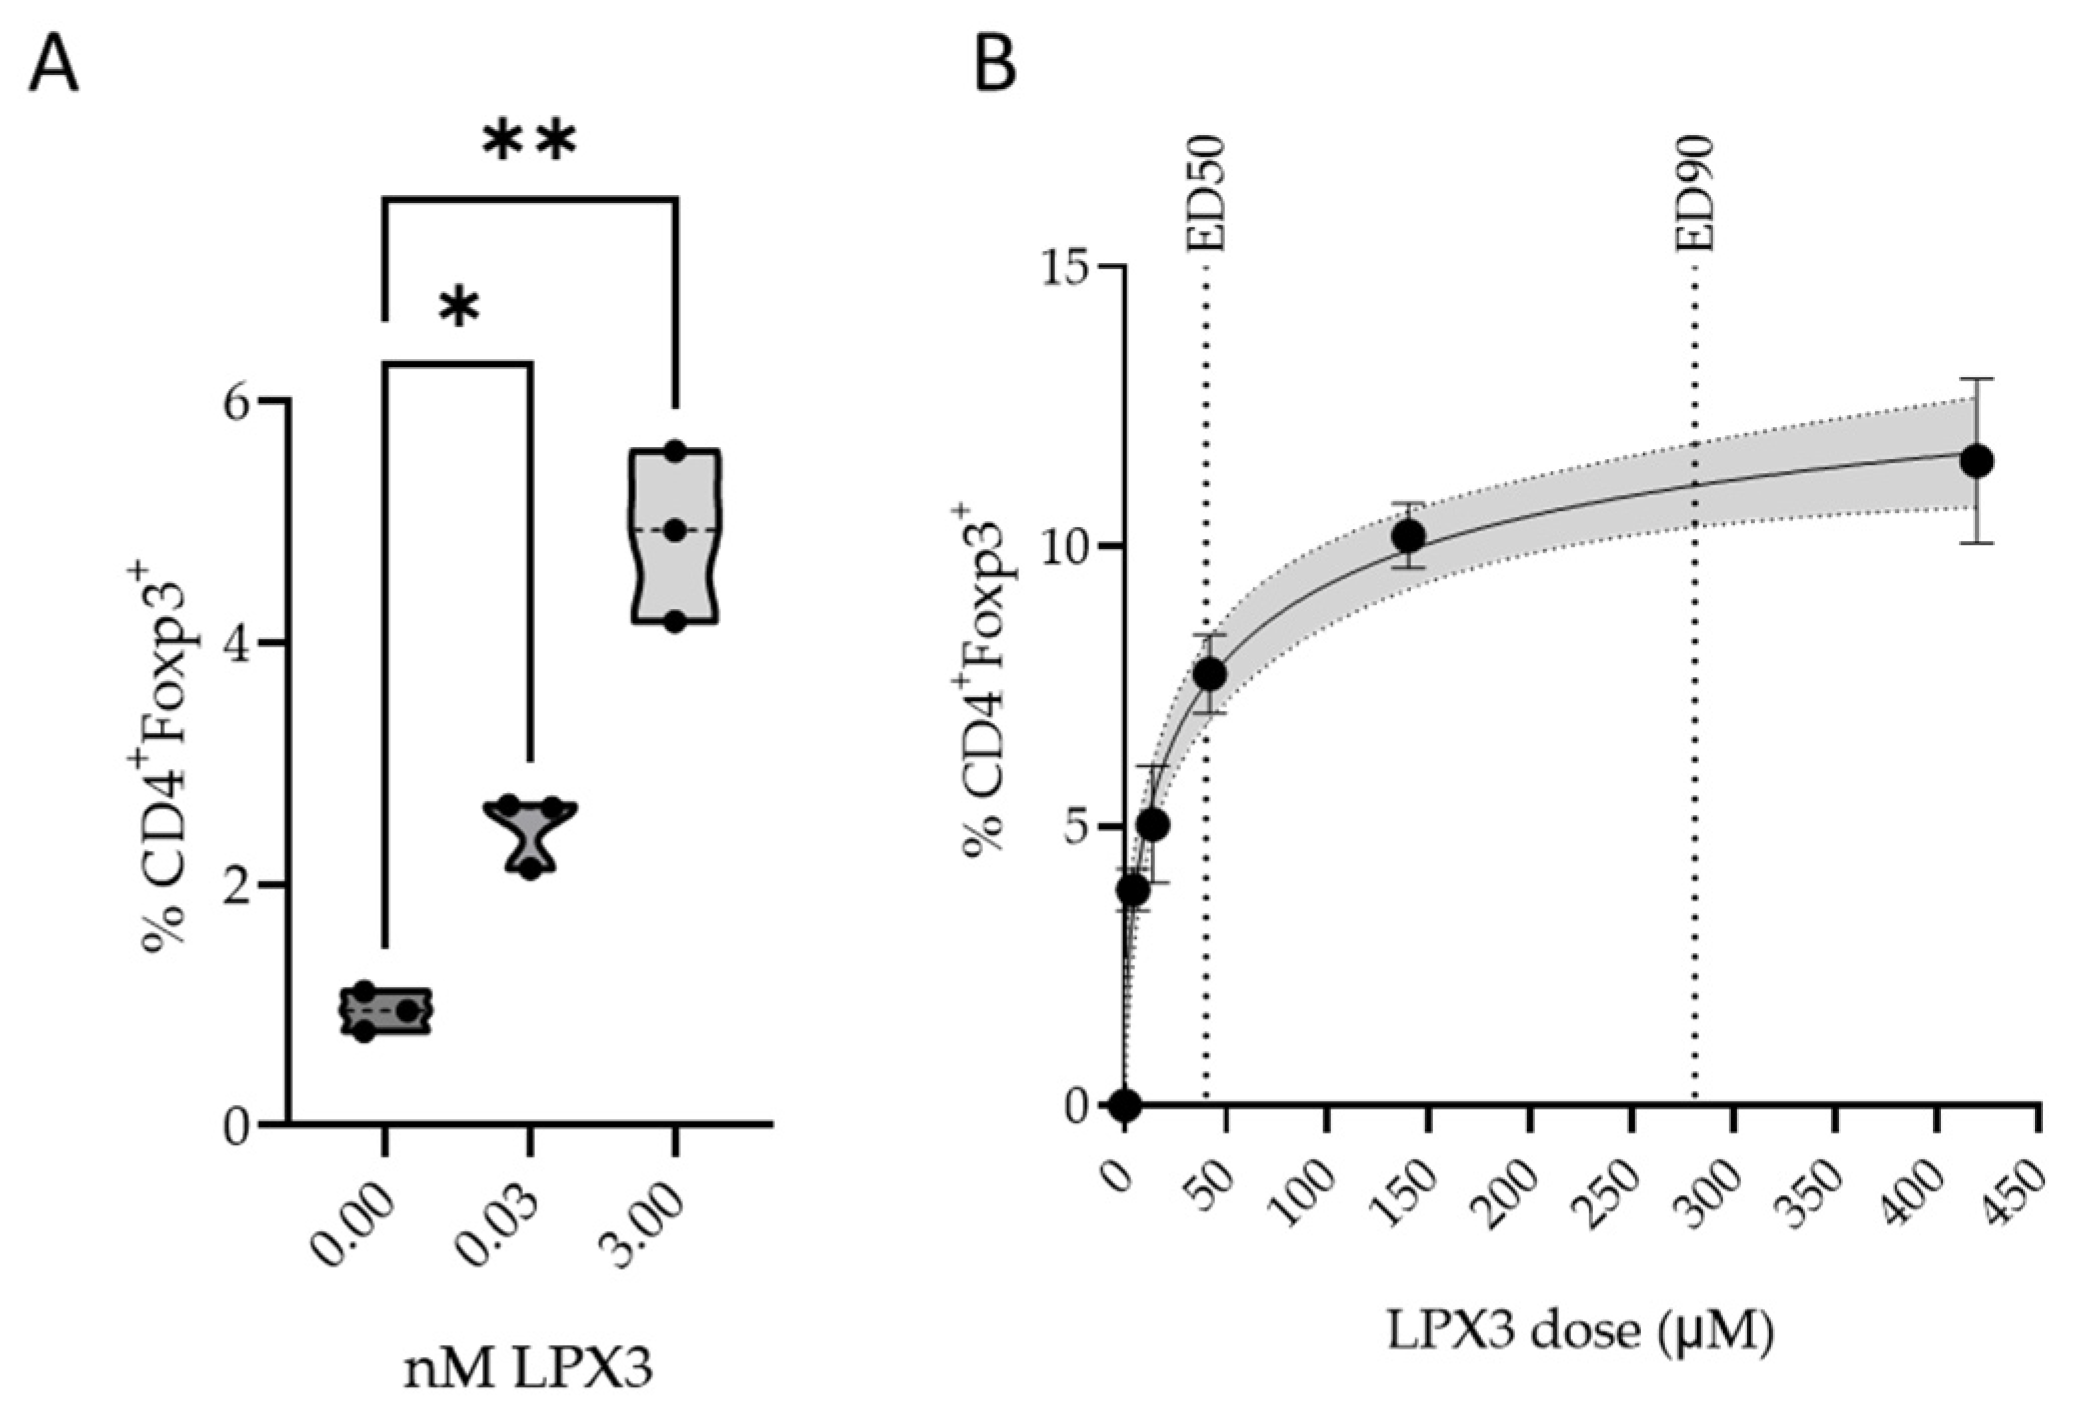
2.3.1. In Vitro Pharmacology
2.3.2. In Vivo Pharmacology
2.4. Effect of LPX3 Liposomes in MOG35–55 Experimental Autoimmune Encephalomyelitis (EAE) Model
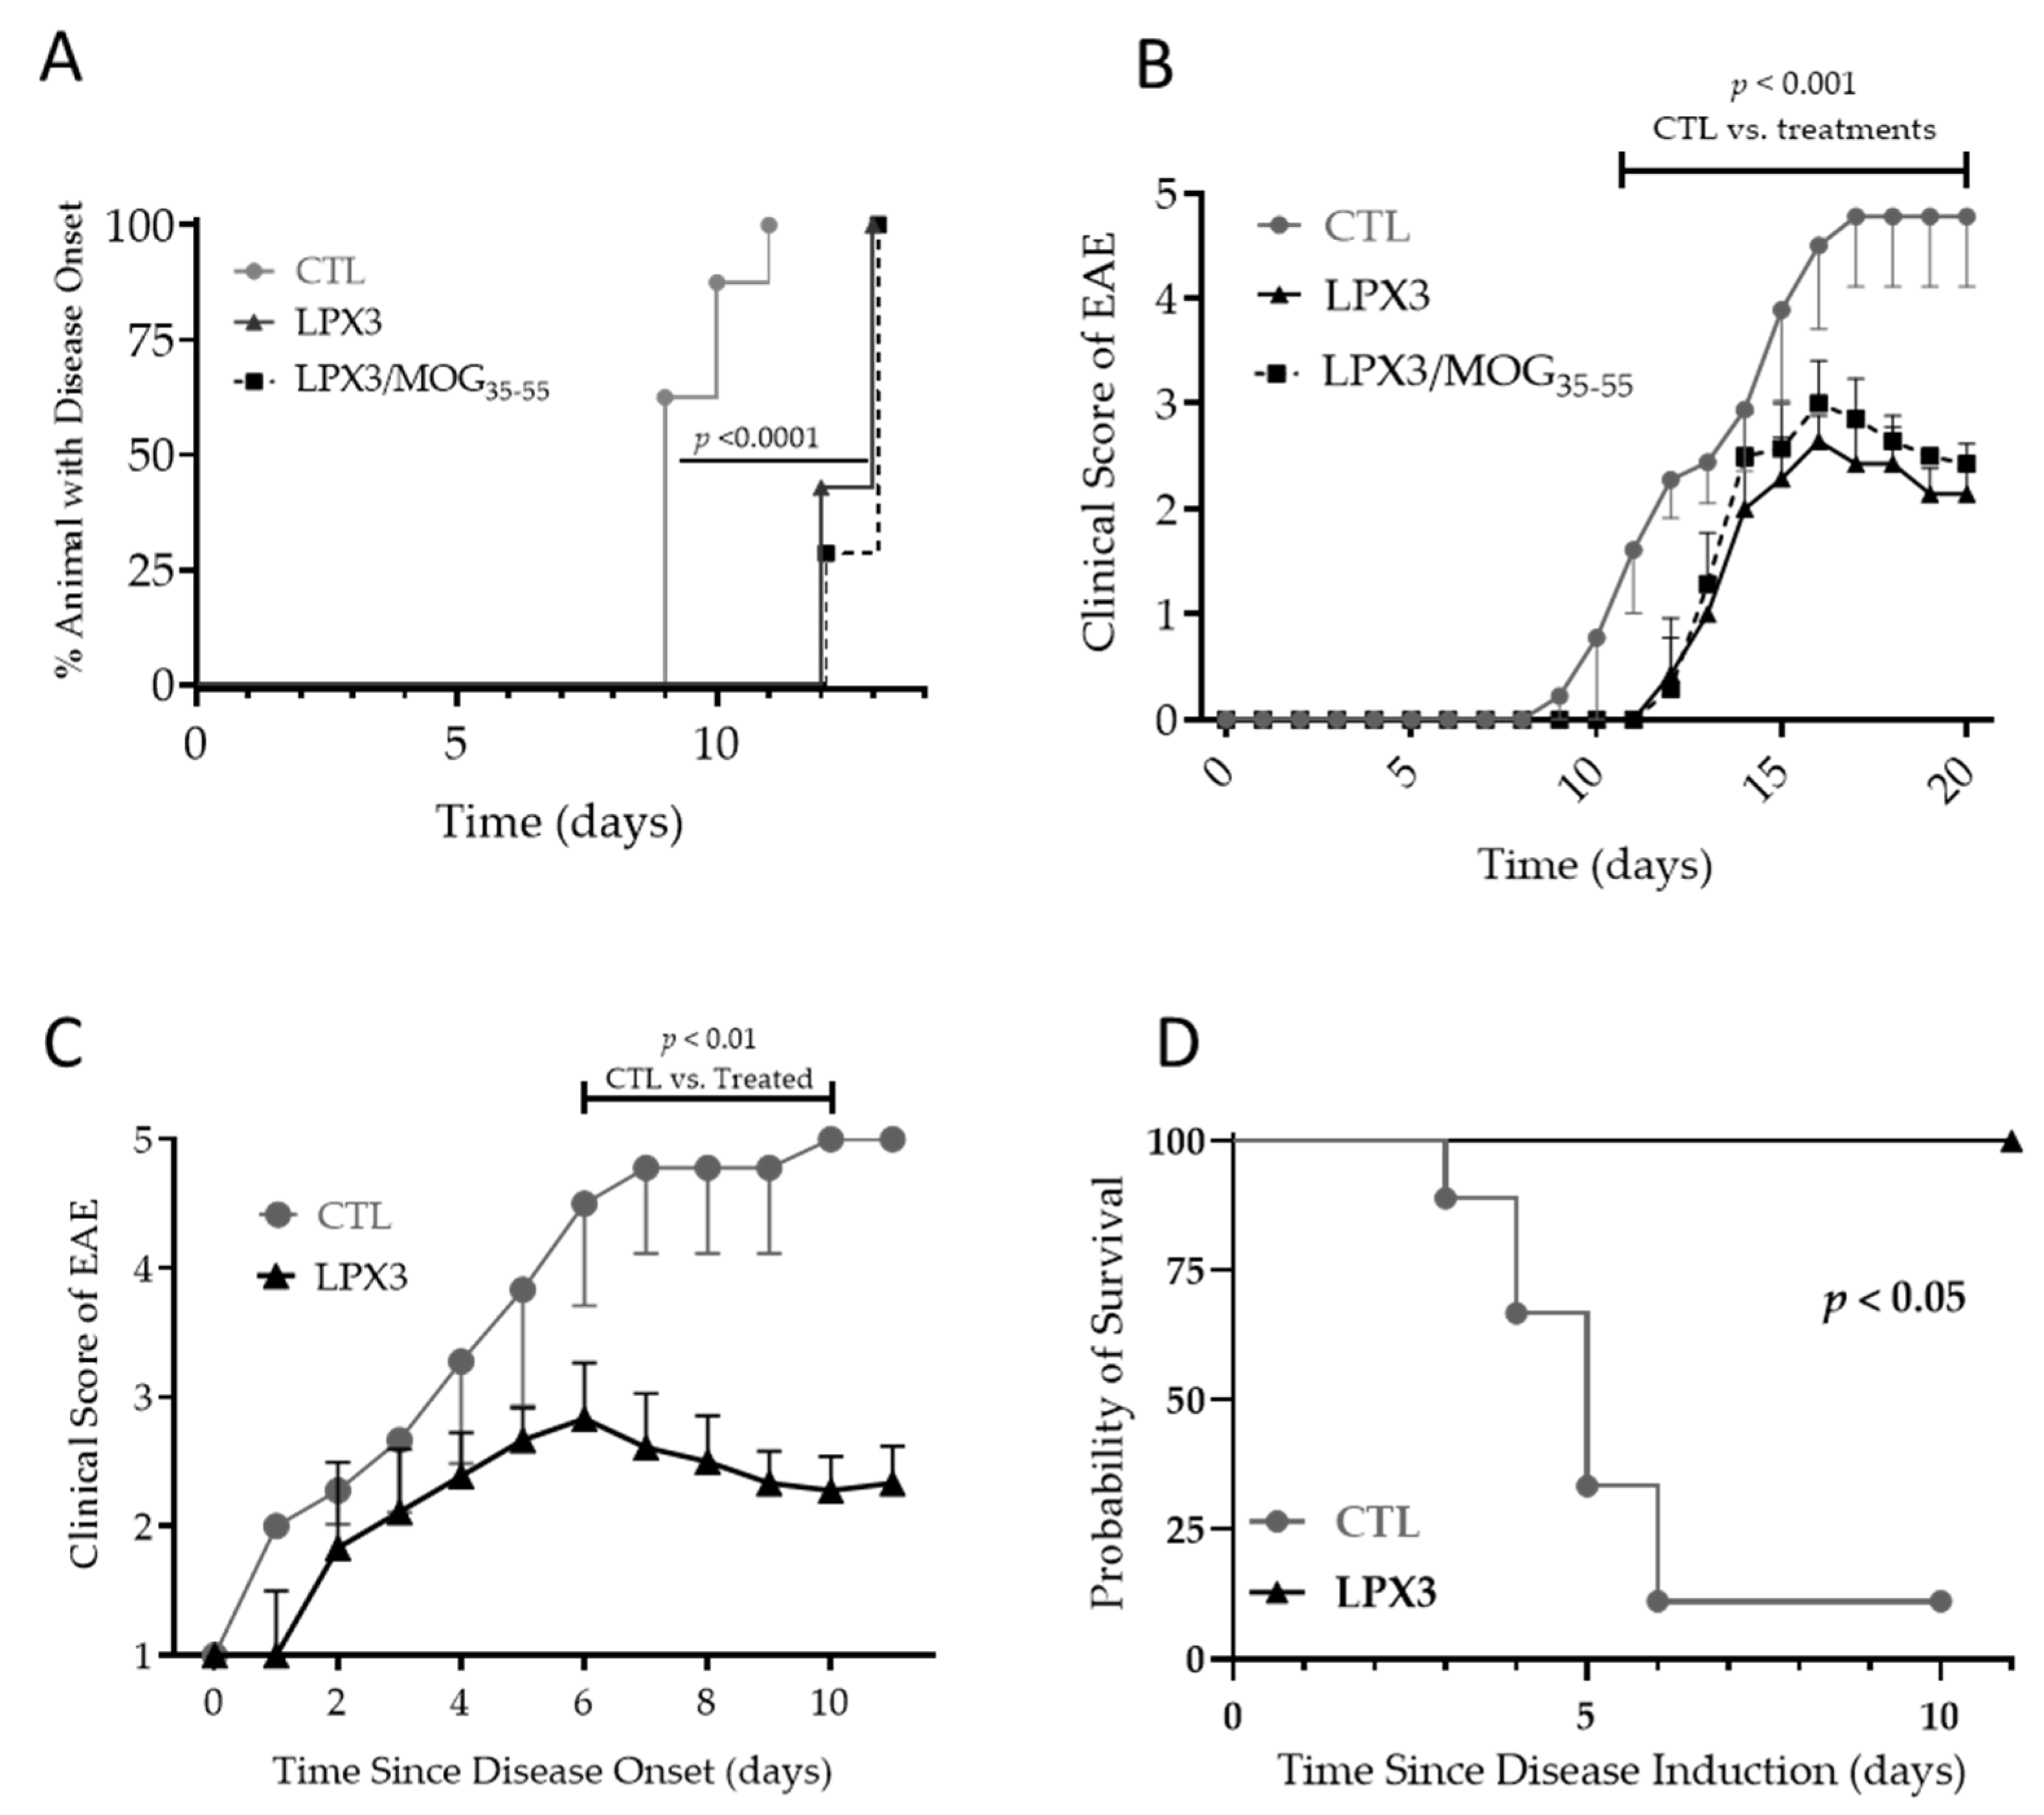
2.4.1. Prophylactic Effects of LPX3 and LPX3/MOG35–55 in the EAE Model
2.4.2. Therapeutic Effects of LPX3 in the EAE Model
Disease Progression and Clinical Scores
Overall Survival in Treated vs. Untreated Mice
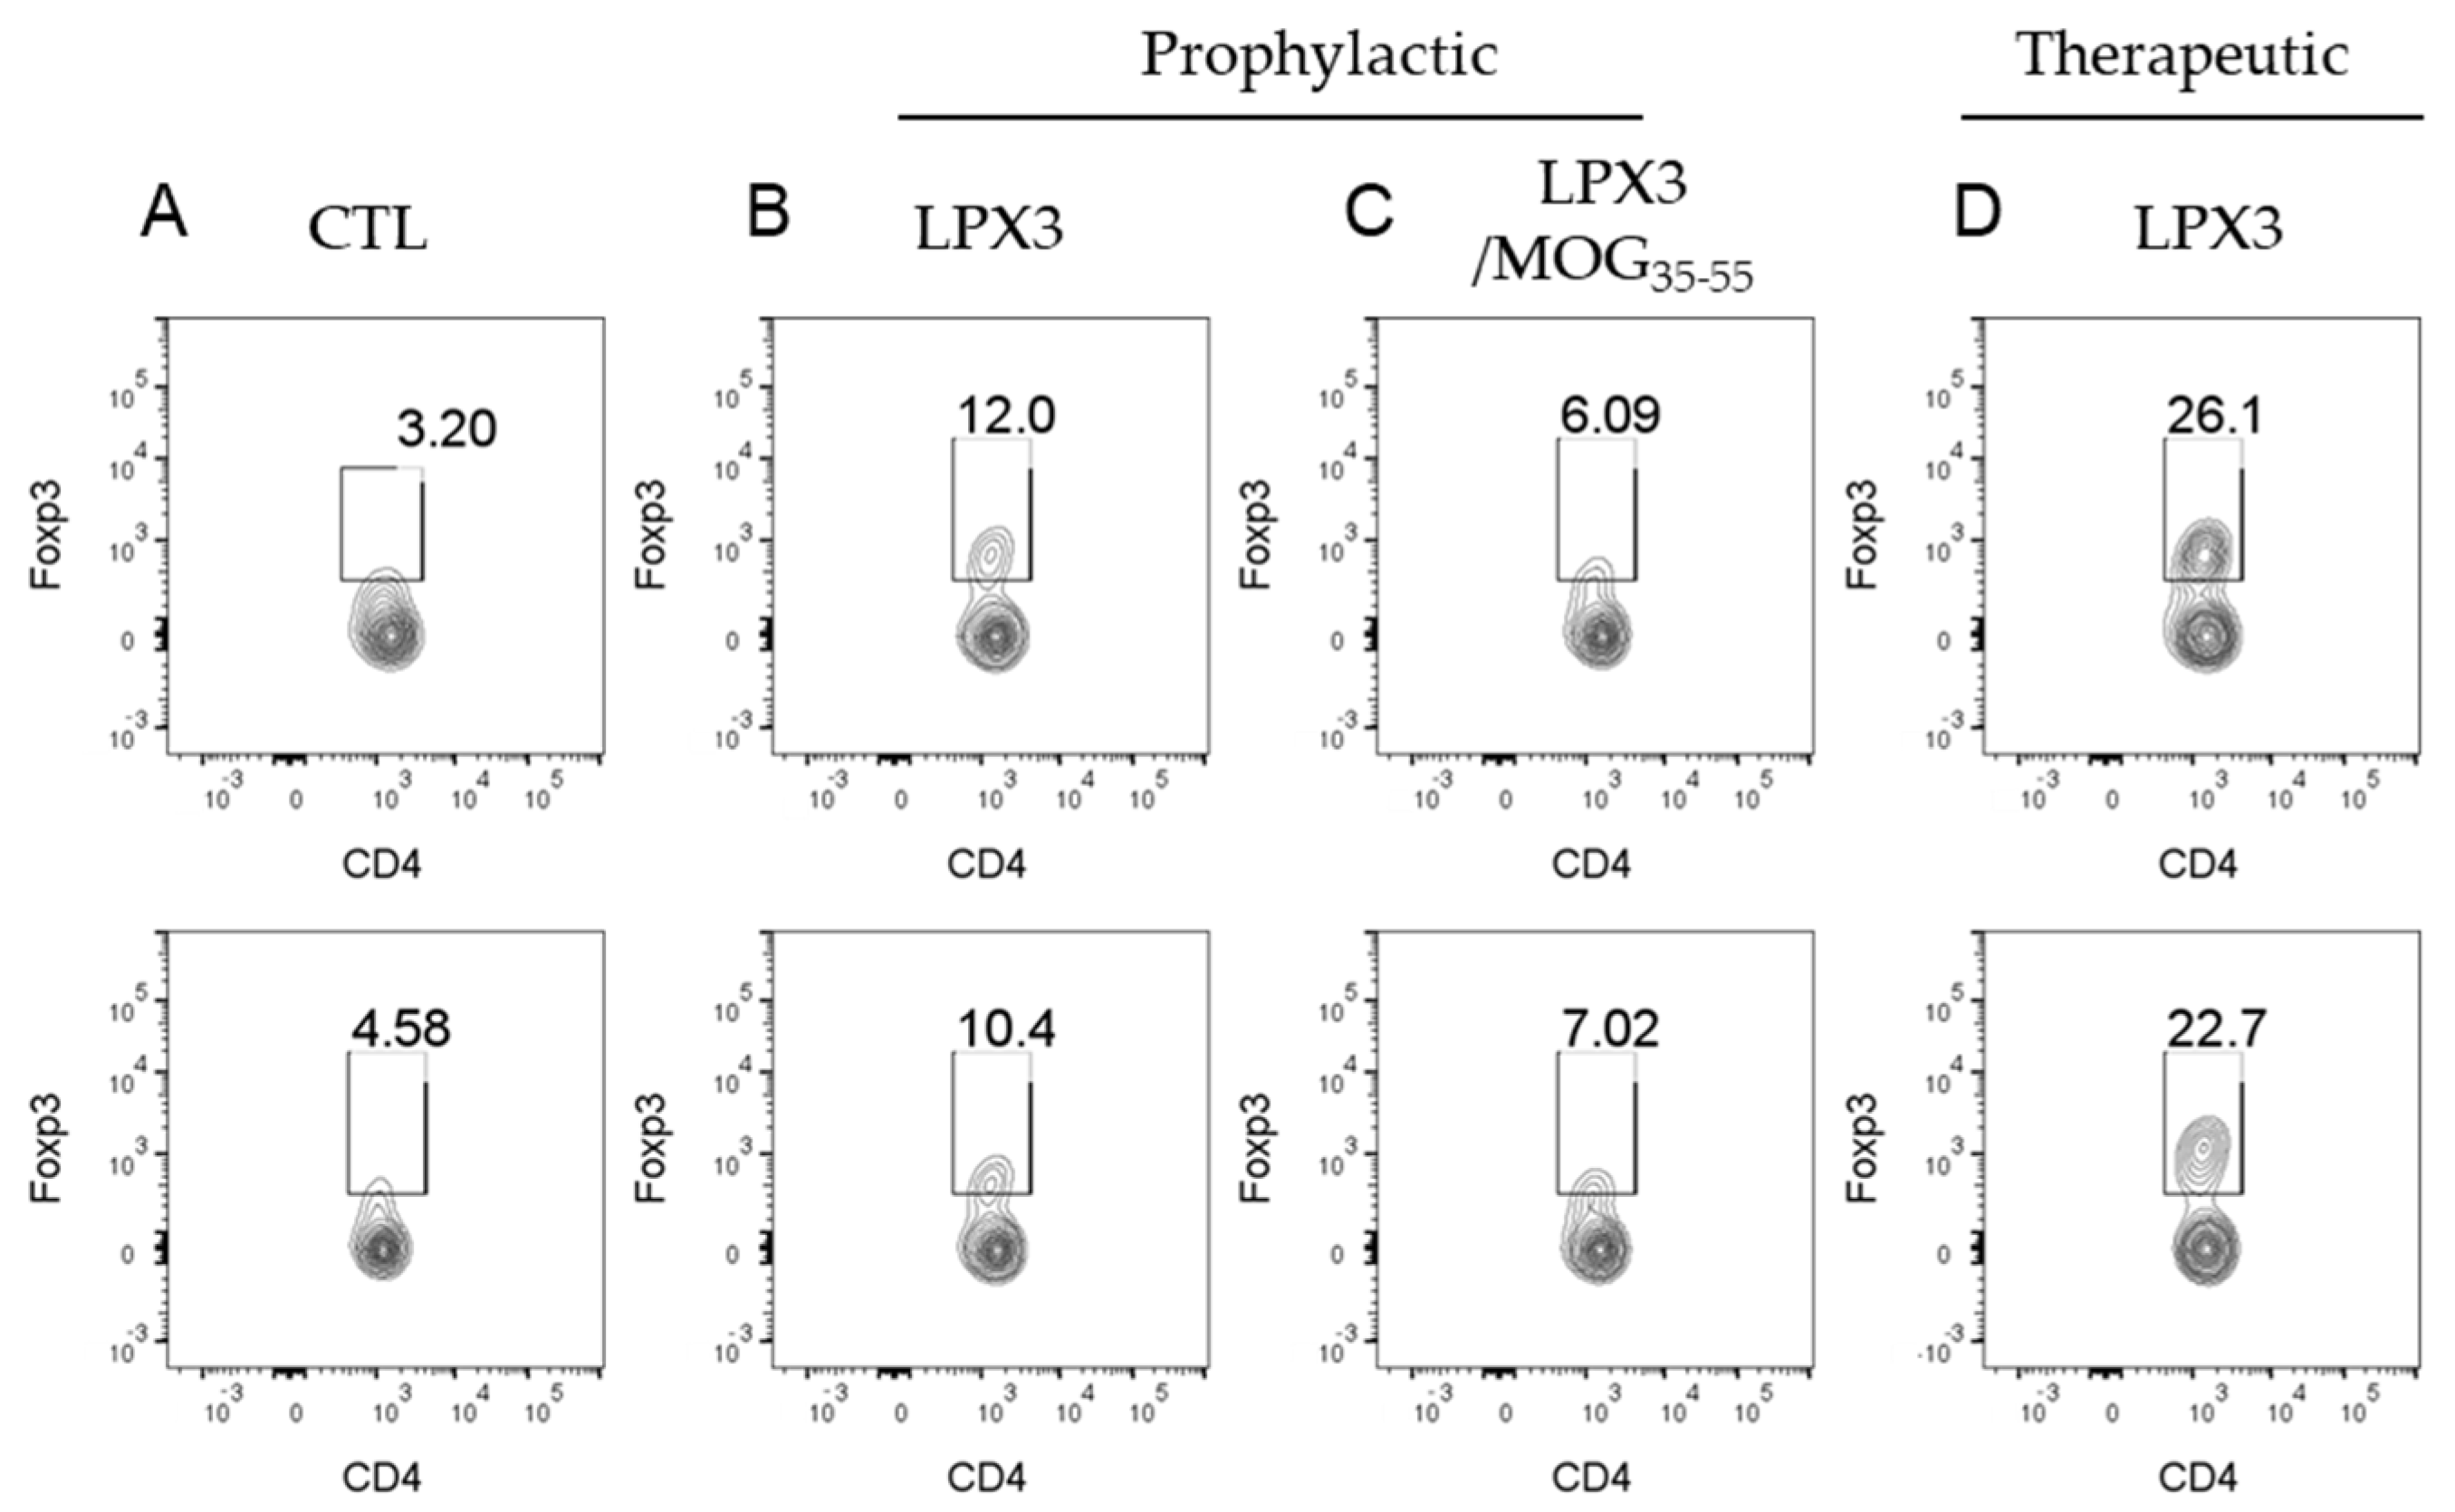
2.4.3. Ex Vivo Analysis of CD4+Foxp3+ T Cells in Treated vs. Untreated Mice
3. Discussion
4. Materials and Methods
4.1. Materials
4.2. Animal Housing and Handling
4.3. DilC18(5) Dye Screening
4.4. Liposomal Formulation Preparation for Colocalization Studies
4.5. Liposomal Formulation for MOG-EAE Studies
4.6. Lymphatic Uptake Quantification
4.6.1. Fluorescence Imaging
4.6.2. Colocalization Analysis
4.7. In Vivo Pharmacology
4.8. EAE Study
4.8.1. Group Assignment
Prophylactic
Therapeutic
Survival Analysis
4.8.2. Ex Vivo Splenocyte Isolation and Flow Cytometry Analysis
Author Contributions
Funding
Institutional Review Board Statement
Informed Consent Statement
Data Availability Statement
Acknowledgments
Conflicts of Interest
Abbreviations
| DMPC | 1,2-dimyristoyl-sn-glycero-3-phophocholine |
| DOPC | 1,2-dioleoyl-sn-glycero-3-phophocholine |
| DSPC | 1,2-distearoyl-sn-glycero-3-phophocholine |
| POPC | 1-palmitoyl-2oleoyl-sn-glycer-3-phosphocholine |
| MOG | Myelin oligodendrocyte glycoprotein |
References
- Danikowski, K.M.; Jayaraman, S.; Prabhakar, B.S. Regulatory T cells in multiple sclerosis and myasthenia gravis. J. Neuroinflamm. 2017, 14, 117. [Google Scholar] [CrossRef]
- Lock, C.; Hermans, G.; Pedotti, R.; Brendolan, A.; Schadt, E.; Garren, H.; Langer-Gould, A.; Strober, S.; Cannella, B.; Allard, J.; et al. Gene-microarray analysis of multiple sclerosis lesions yields new targets validated in autoimmune encephalomyelitis. Nat. Med. 2002, 8, 500–508. [Google Scholar] [CrossRef] [PubMed]
- van Langelaar, J.; Rijvers, L.; Janssen, M.; Wierenga-Wolf, A.F.; Melief, M.J.; Siepman, T.A.; de Vries, H.E.; Unger, P.-P.A.; van Ham, S.M.; Hintzen, R.Q.; et al. Induction of brain-infiltrating T-bet-expressing B cells in multiple sclerosis. Ann. Neurol. 2019, 86, 264–278. [Google Scholar] [CrossRef] [PubMed]
- Lassmann, H.; van Horssen, J.; Mahad, D. Progressive multiple sclerosis: Pathology and pathogenesis. Nat. Rev. Neurol. 2012, 8, 647–656. [Google Scholar] [CrossRef]
- Rostami, A.; Ciric, B. Role of Th17 cells in the pathogenesis of CNS inflammatory demyelination. J. Neurol. Sci. 2013, 333, 76–87. [Google Scholar] [CrossRef] [PubMed]
- Krishnamoorthy, G.; Saxena, A.; Mars, L.T.; Domingues, H.S.; Mentele, R.; Ben-Nun, A.; Lassmann, H.; Dornmair, K.; Kurschus, F.C.; Liblau, R.S.; et al. Myelin-specific T cells also recognize neuronal autoantigen in a transgenic mouse model of multiple sclerosis. Nat. Med. 2009, 15, 626–632. [Google Scholar] [CrossRef]
- Ramadan, A.; Lucca, L.E.; Carrié, N.; Desbois, S.; Axisa, P.P.; Hayder, M.; Bauer, J.; Liblau, R.S.; Mars, L.T. In situ expansion of T cells that recognize distinct self-antigens sustains autoimmunity in the CNS. Brain 2016, 139 Pt 5, 1433–1446. [Google Scholar] [CrossRef]
- Pender, M.P.; Burrows, S.R. Epstein-Barr virus and multiple sclerosis: Potential opportunities for immunotherapy. Clin. Transl. Immunol. 2014, 3, e27. [Google Scholar] [CrossRef]
- Lang, H.L.; Jacobsen, H.; Ikemizu, S.; Andersson, C.; Harlos, K.; Madsen, L.; Hjorth, P.; Sondergaard, L.; Svejgaard, A.; Wucherpfennig, K.; et al. A functional and structural basis for TCR cross-reactivity in multiple sclerosis. Nat. Immunol. 2002, 3, 940–943. [Google Scholar] [CrossRef]
- Steinman, L.; Ho, P.P.; Robinson, W.H.; Utz, P.J.; Villoslada, P. Antigen-specific tolerance to self-antigens in protein replacement therapy, gene therapy and autoimmunity. Curr. Opin. Immunol. 2019, 61, 46–53. [Google Scholar] [CrossRef]
- Lutterotti, A.; Hayward-Koennecke, H.; Sospedra, M.; Martin, R. Antigen-Specific Immune Tolerance in Multiple Sclerosis—Promising Approaches and How to Bring Them to Patients. Front. Immunol. 2021, 12, 640935. [Google Scholar] [CrossRef] [PubMed]
- Alabed, M.; Sultana Shaik, A.; Saheb Sharif-Askari, N.; Saheb Sharif-Askari, F.; Hafezi, S.; Mdkhana, B.; Ratemi, E.; Al-Muhsen, S.; Hamid, Q.; Halwani, R. Enhanced Infiltration of Central Memory T Cells to the Lung Tissue during Allergic Lung Inflammation. Int. Arch. Allergy Immunol. 2022, 183, 127–141. [Google Scholar] [CrossRef] [PubMed]
- Monney, L.; Sabatos, C.A.; Gaglia, J.L.; Ryu, A.; Waldner, H.; Chernova, T.; Manning, S.; Greenfield, E.A.; Coyle, A.J.; Sobel, R.A.; et al. Th1-specific cell surface protein Tim-3 regulates macrophage activation and severity of an autoimmune disease. Nature 2002, 415, 536–541. [Google Scholar] [CrossRef] [PubMed]
- Sabatos, C.A.; Chakravarti, S.; Cha, E.; Schubart, A.; Sánchez-Fueyo, A.; Zheng, X.X.; Coyle, A.J.; Strom, T.B.; Freeman, G.J.; Kuchroo, V.K. Interaction of Tim-3 and Tim-3 ligand regulates T helper type 1 responses and induction of peripheral tolerance. Nat. Immunol. 2003, 4, 1102–1110. [Google Scholar] [CrossRef]
- Rodriguez-Manzanet, R.; Dekruyff, R.; Kuchroo, V.K.; Umetsu, D.T. The costimulatory role of TIM molecules. Immunol. Rev. 2009, 229, 259–270. [Google Scholar] [CrossRef]
- Moser, T.; Akgün, K.; Proschmann, U.; Sellner, J.; Ziemssen, T. The role of TH17 cells in multiple sclerosis: Therapeutic implications. Autoimmun. Rev. 2020, 19, 102647. [Google Scholar] [CrossRef]
- Wolf, Y.; Anderson, A.C.; Kuchroo, V.K. TIM3 comes of age as an inhibitory receptor. Nat. Rev. Immunol. 2020, 20, 173–185. [Google Scholar] [CrossRef]
- Joller, N.; Kuchroo, V.K. Tim-3, Lag-3, and TIGIT. Curr. Top. Microbiol. Immunol. 2017, 410, 127–156. [Google Scholar]
- Birge, R.B.; Boeltz, S.; Kumar, S.; Carlson, J.; Wanderley, J.; Calianese, D.; Barcinski, M.; A Brekken, R.; Huang, X.; Hutchins, J.T.; et al. Phosphatidylserine is a global immunosuppressive signal in efferocytosis, infectious disease, and cancer. Cell Death Differ. 2016, 23, 962–978. [Google Scholar] [CrossRef]
- Joller, N.; Peters, A.; Anderson, A.C.; Kuchroo, V.K. Immune checkpoints in central nervous system autoimmunity. Immunol. Rev. 2012, 248, 122–139. [Google Scholar] [CrossRef]
- Ramadan, A.; Rao, P.; Allababidi, S.; Khashan, R.; Fathallah, A.M. Tolerization with a Novel Dual-Acting Liposomal Tim Agonist Prepares the Immune System for the Success of Gene Therapy. Int. J. Mol. Sci. 2025, 26, 3830. [Google Scholar] [CrossRef] [PubMed]
- Rezende, R.M.; Weiner, H.L. Oral tolerance: An updated review. Immunol. Lett. 2022, 245, 29–37. [Google Scholar] [CrossRef] [PubMed]
- Tordesillas, L.; Berin, M.C. Mechanisms of Oral Tolerance. Clin. Rev. Allergy Immunol. 2018, 55, 107–117. [Google Scholar] [CrossRef] [PubMed]
- Alqahtani, M.S.; Kazi, M.; Alsenaidy, M.A.; Ahmad, M.Z. Advances in Oral Drug Delivery. Front. Pharmacol. 2021, 12, 618411. [Google Scholar] [CrossRef]
- Li, M.; Itoh, A.; Xi, J.; Yu, C.; Wu, Y.; Ridgway, W.M.; Liu, H. Enhancing Antigen Presentation and Inducing Antigen-Specific Immune Tolerance with Amphiphilic Peptides. J. Immunol. 2021, 207, 2051–2059. [Google Scholar] [CrossRef]
- Albert, M.L. Death-defying immunity: Do apoptotic cells influence antigen processing and presentation? Nat. Rev. Immunol. 2004, 4, 223–231. [Google Scholar] [CrossRef]
- Kuchroo, V.K.; Meyers, J.H.; Umetsu, D.T.; DeKruyff, R.H. TIM family of genes in immunity and tolerance. Adv. Immunol. 2006, 91, 227–249. [Google Scholar]
- Yang, L.; Anderson, D.E.; Kuchroo, J.; Hafler, D.A. Lack of TIM-3 immunoregulation in multiple sclerosis. J. Immunol. 2008, 180, 4409–4414. [Google Scholar] [CrossRef]
- Koguchi, K.; Anderson, D.E.; Yang, L.; O’Connor, K.C.; Kuchroo, V.K.; Hafler, D.A. Dysregulated T cell expression of TIM3 in multiple sclerosis. J. Exp. Med. 2006, 203, 1413–1418. [Google Scholar] [CrossRef]
- Meyers, J.H.; Sabatos, C.A.; Chakravarti, S.; Kuchroo, V.K. The TIM gene family regulates autoimmune and allergic diseases. Trends Mol. Med. 2005, 11, 362–369. [Google Scholar] [CrossRef]
- Fathallah, A.M.; Ramakrishnan, R.; Balu-Iyer, S.V. O-phospho-l-serine mediates hyporesponsiveness toward FVIII in hemophilia A-murine model by inducing tolerogenic properties in dendritic cells. J. Pharm. Sci. 2014, 103, 3457–3463. [Google Scholar] [CrossRef] [PubMed]
- Mani, S.; Toapanta, F.R.; McArthur, M.A.; Qadri, F.; Svennerholm, A.M.; Devriendt, B.; Phalipon, A.; Cohen, D.; Sztein, M.B. Role of antigen specific T and B cells in systemic and mucosal immune responses in ETEC and Shigella infections, and their potential to serve as correlates of protection in vaccine development. Vaccine 2019, 37, 4787–4793. [Google Scholar] [CrossRef] [PubMed]
- Nadafi, R.; Gago de Graça, C.; Keuning, E.D.; Koning, J.J.; de Kivit, S.; Konijn, T.; Henri, S.; Borst, J.; Reijmers, R.M.; van Baarsen, L.G.; et al. Lymph Node Stromal Cells Generate Antigen-Specific Regulatory T Cells and Control Autoreactive T and B Cell Responses. Cell Rep. 2020, 30, 4110–4123.e4. [Google Scholar] [CrossRef]
- Gleason, M.K.; Lenvik, T.R.; McCullar, V.; Felices, M.; O’Brien, M.S.; Cooley, S.A.; Verneris, M.R.; Cichocki, F.; Holman, C.J.; Panoskaltsis-Mortari, A.; et al. Tim-3 is an inducible human natural killer cell receptor that enhances interferon gamma production in response to galectin-9. Blood 2012, 119, 3064–3072. [Google Scholar] [CrossRef]
- Ndhlovu, L.C.; Lopez-Vergès, S.; Barbour, J.D.; Jones, R.B.; Jha, A.R.; Long, B.R.; Schoeffler, E.C.; Fujita, T.; Nixon, D.F.; Lanier, L.L. Tim-3 marks human natural killer cell maturation and suppresses cell-mediated cytotoxicity. Blood 2012, 119, 3734–3743. [Google Scholar] [CrossRef] [PubMed]
- Tang, L.; Li, G.; Zheng, Y.; Hou, C.; Gao, Y.; Hao, Y.; Gao, Z.; Mo, R.; Li, Y.; Shen, B.; et al. Tim-3 Relieves Experimental Autoimmune Encephalomyelitis by Suppressing MHC-II. Front. Immunol. 2021, 12, 770402. [Google Scholar] [CrossRef]
- Tang, R.; Rangachari, M.; Kuchroo, V.K. Tim-3: A co-receptor with diverse roles in T cell exhaustion and tolerance. Semin. Immunol. 2019, 42, 101302. [Google Scholar] [CrossRef]
- Papenfuss, T.L.; Rogers, C.J.; Gienapp, I.; Yurrita, M.; McClain, M.; Damico, N.; Valo, J.; Song, F.; Whitacre, C.C. Sex differences in experimental autoimmune encephalomyelitis in multiple murine strains. J. Neuroimmunol. 2004, 150, 59–69. [Google Scholar] [CrossRef]


Disclaimer/Publisher’s Note: The statements, opinions and data contained in all publications are solely those of the individual author(s) and contributor(s) and not of MDPI and/or the editor(s). MDPI and/or the editor(s) disclaim responsibility for any injury to people or property resulting from any ideas, methods, instructions or products referred to in the content. |
© 2025 by the authors. Licensee MDPI, Basel, Switzerland. This article is an open access article distributed under the terms and conditions of the Creative Commons Attribution (CC BY) license (https://creativecommons.org/licenses/by/4.0/).
Share and Cite
Karzoun, B.; Ramadan, A.; Allababidi, S.; Fathallah, A.M. Breaking the Triad: Immune Tolerance Induction Without Antigen Co-Presentation via Tim Agonist for the Treatment of Autoimmune Diseases. Int. J. Mol. Sci. 2025, 26, 5531. https://doi.org/10.3390/ijms26125531
Karzoun B, Ramadan A, Allababidi S, Fathallah AM. Breaking the Triad: Immune Tolerance Induction Without Antigen Co-Presentation via Tim Agonist for the Treatment of Autoimmune Diseases. International Journal of Molecular Sciences. 2025; 26(12):5531. https://doi.org/10.3390/ijms26125531
Chicago/Turabian StyleKarzoun, Basel, Abdulraouf Ramadan, Saleh Allababidi, and Anas M. Fathallah. 2025. "Breaking the Triad: Immune Tolerance Induction Without Antigen Co-Presentation via Tim Agonist for the Treatment of Autoimmune Diseases" International Journal of Molecular Sciences 26, no. 12: 5531. https://doi.org/10.3390/ijms26125531
APA StyleKarzoun, B., Ramadan, A., Allababidi, S., & Fathallah, A. M. (2025). Breaking the Triad: Immune Tolerance Induction Without Antigen Co-Presentation via Tim Agonist for the Treatment of Autoimmune Diseases. International Journal of Molecular Sciences, 26(12), 5531. https://doi.org/10.3390/ijms26125531