
Study of Retinoic Acid-Induced Osteoarthritis: Integrating RNA-Sequencing, Network Pharmacology, Molecular Docking, and Experimental Validation

 , , and
Abstract

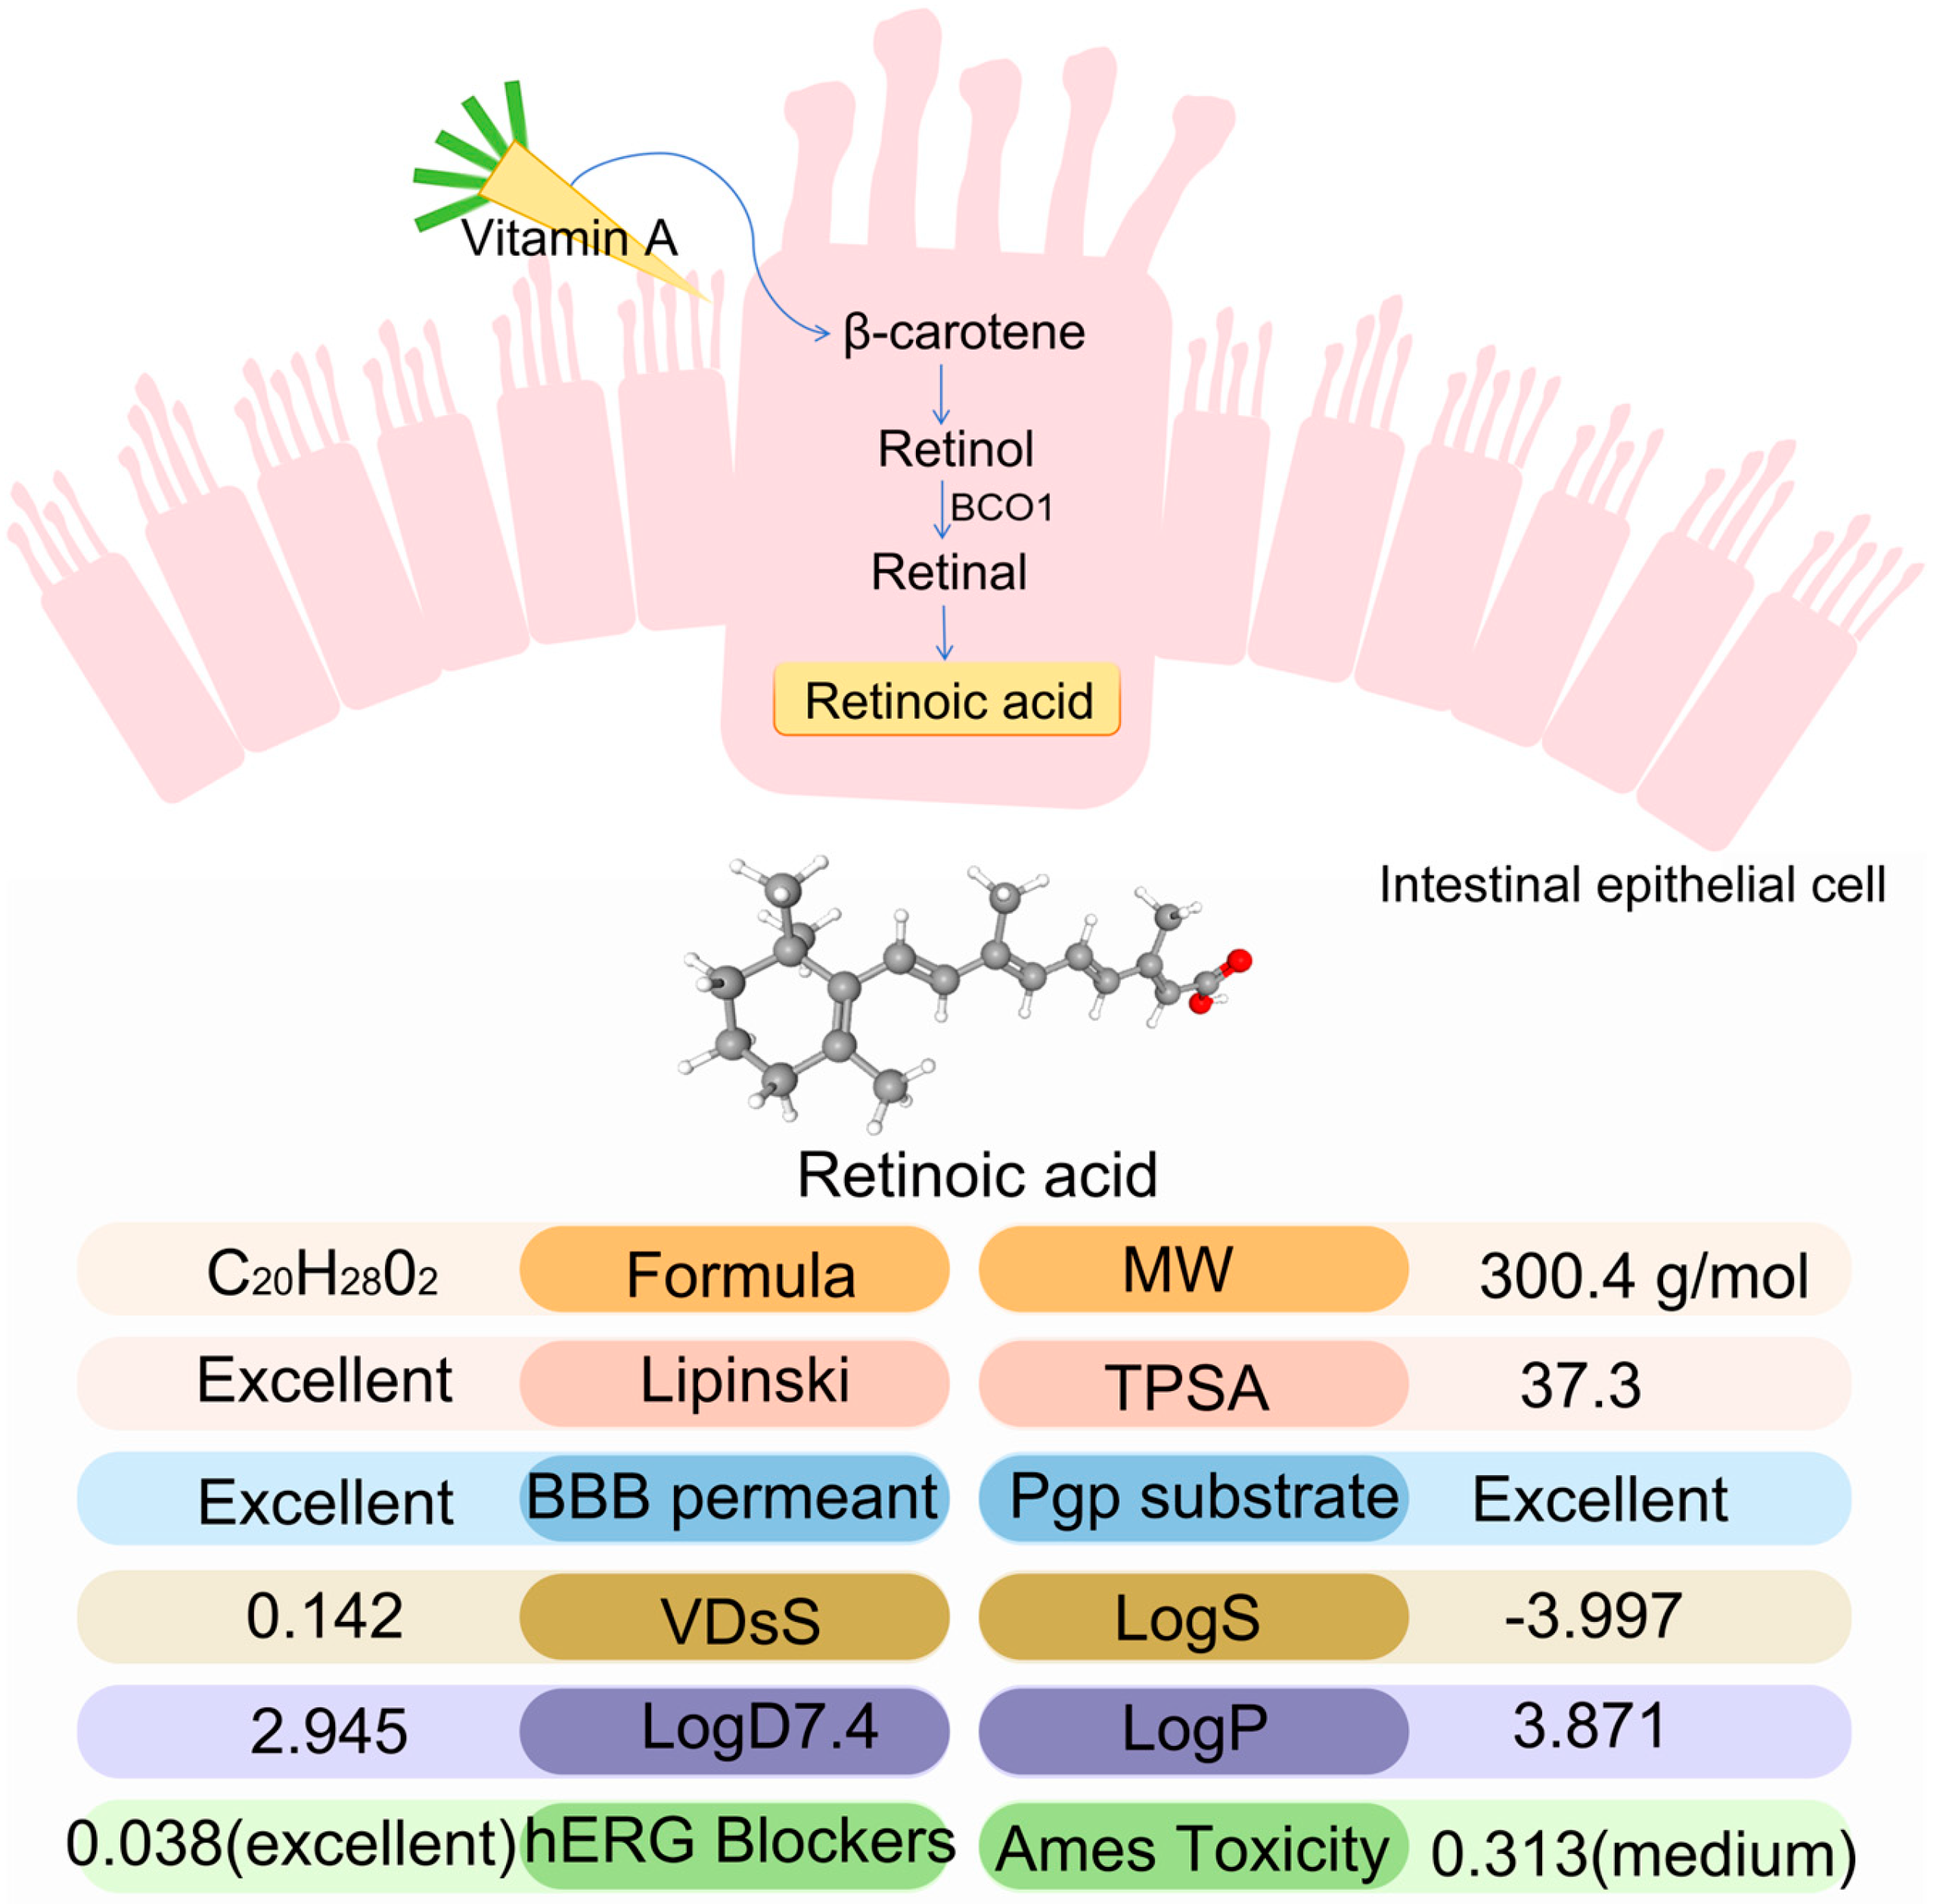
1. Introduction
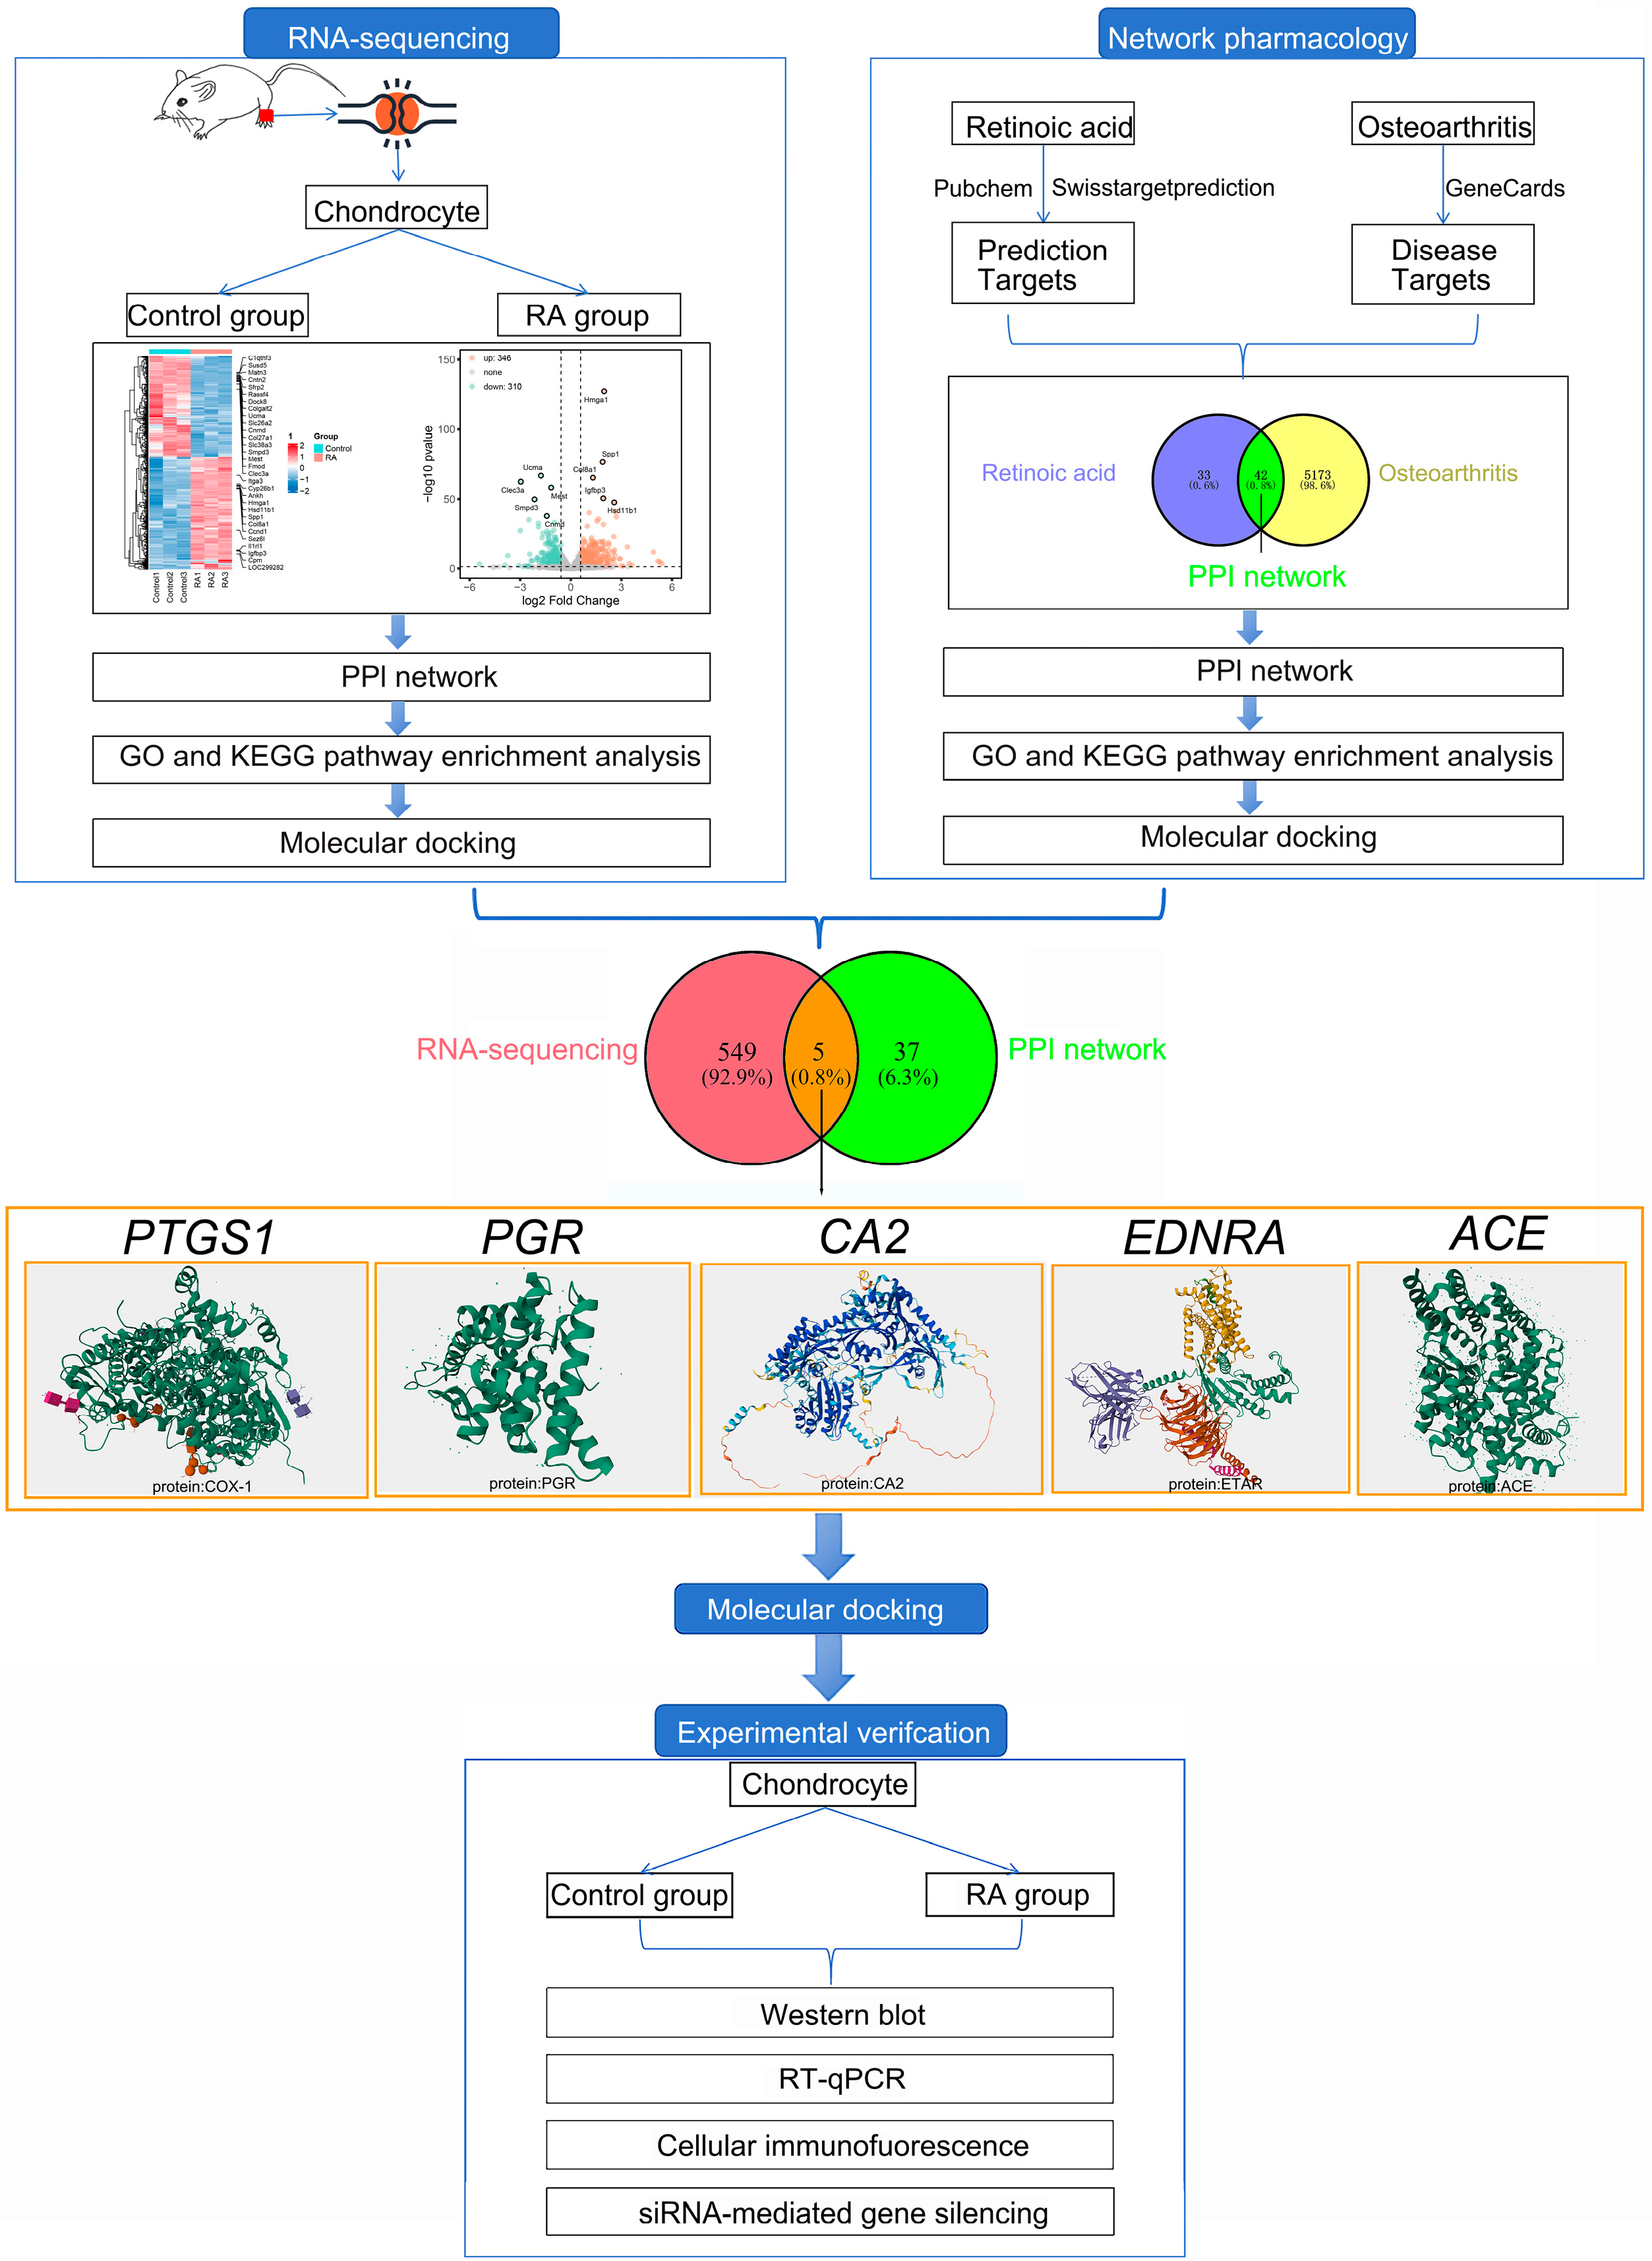
2. Results
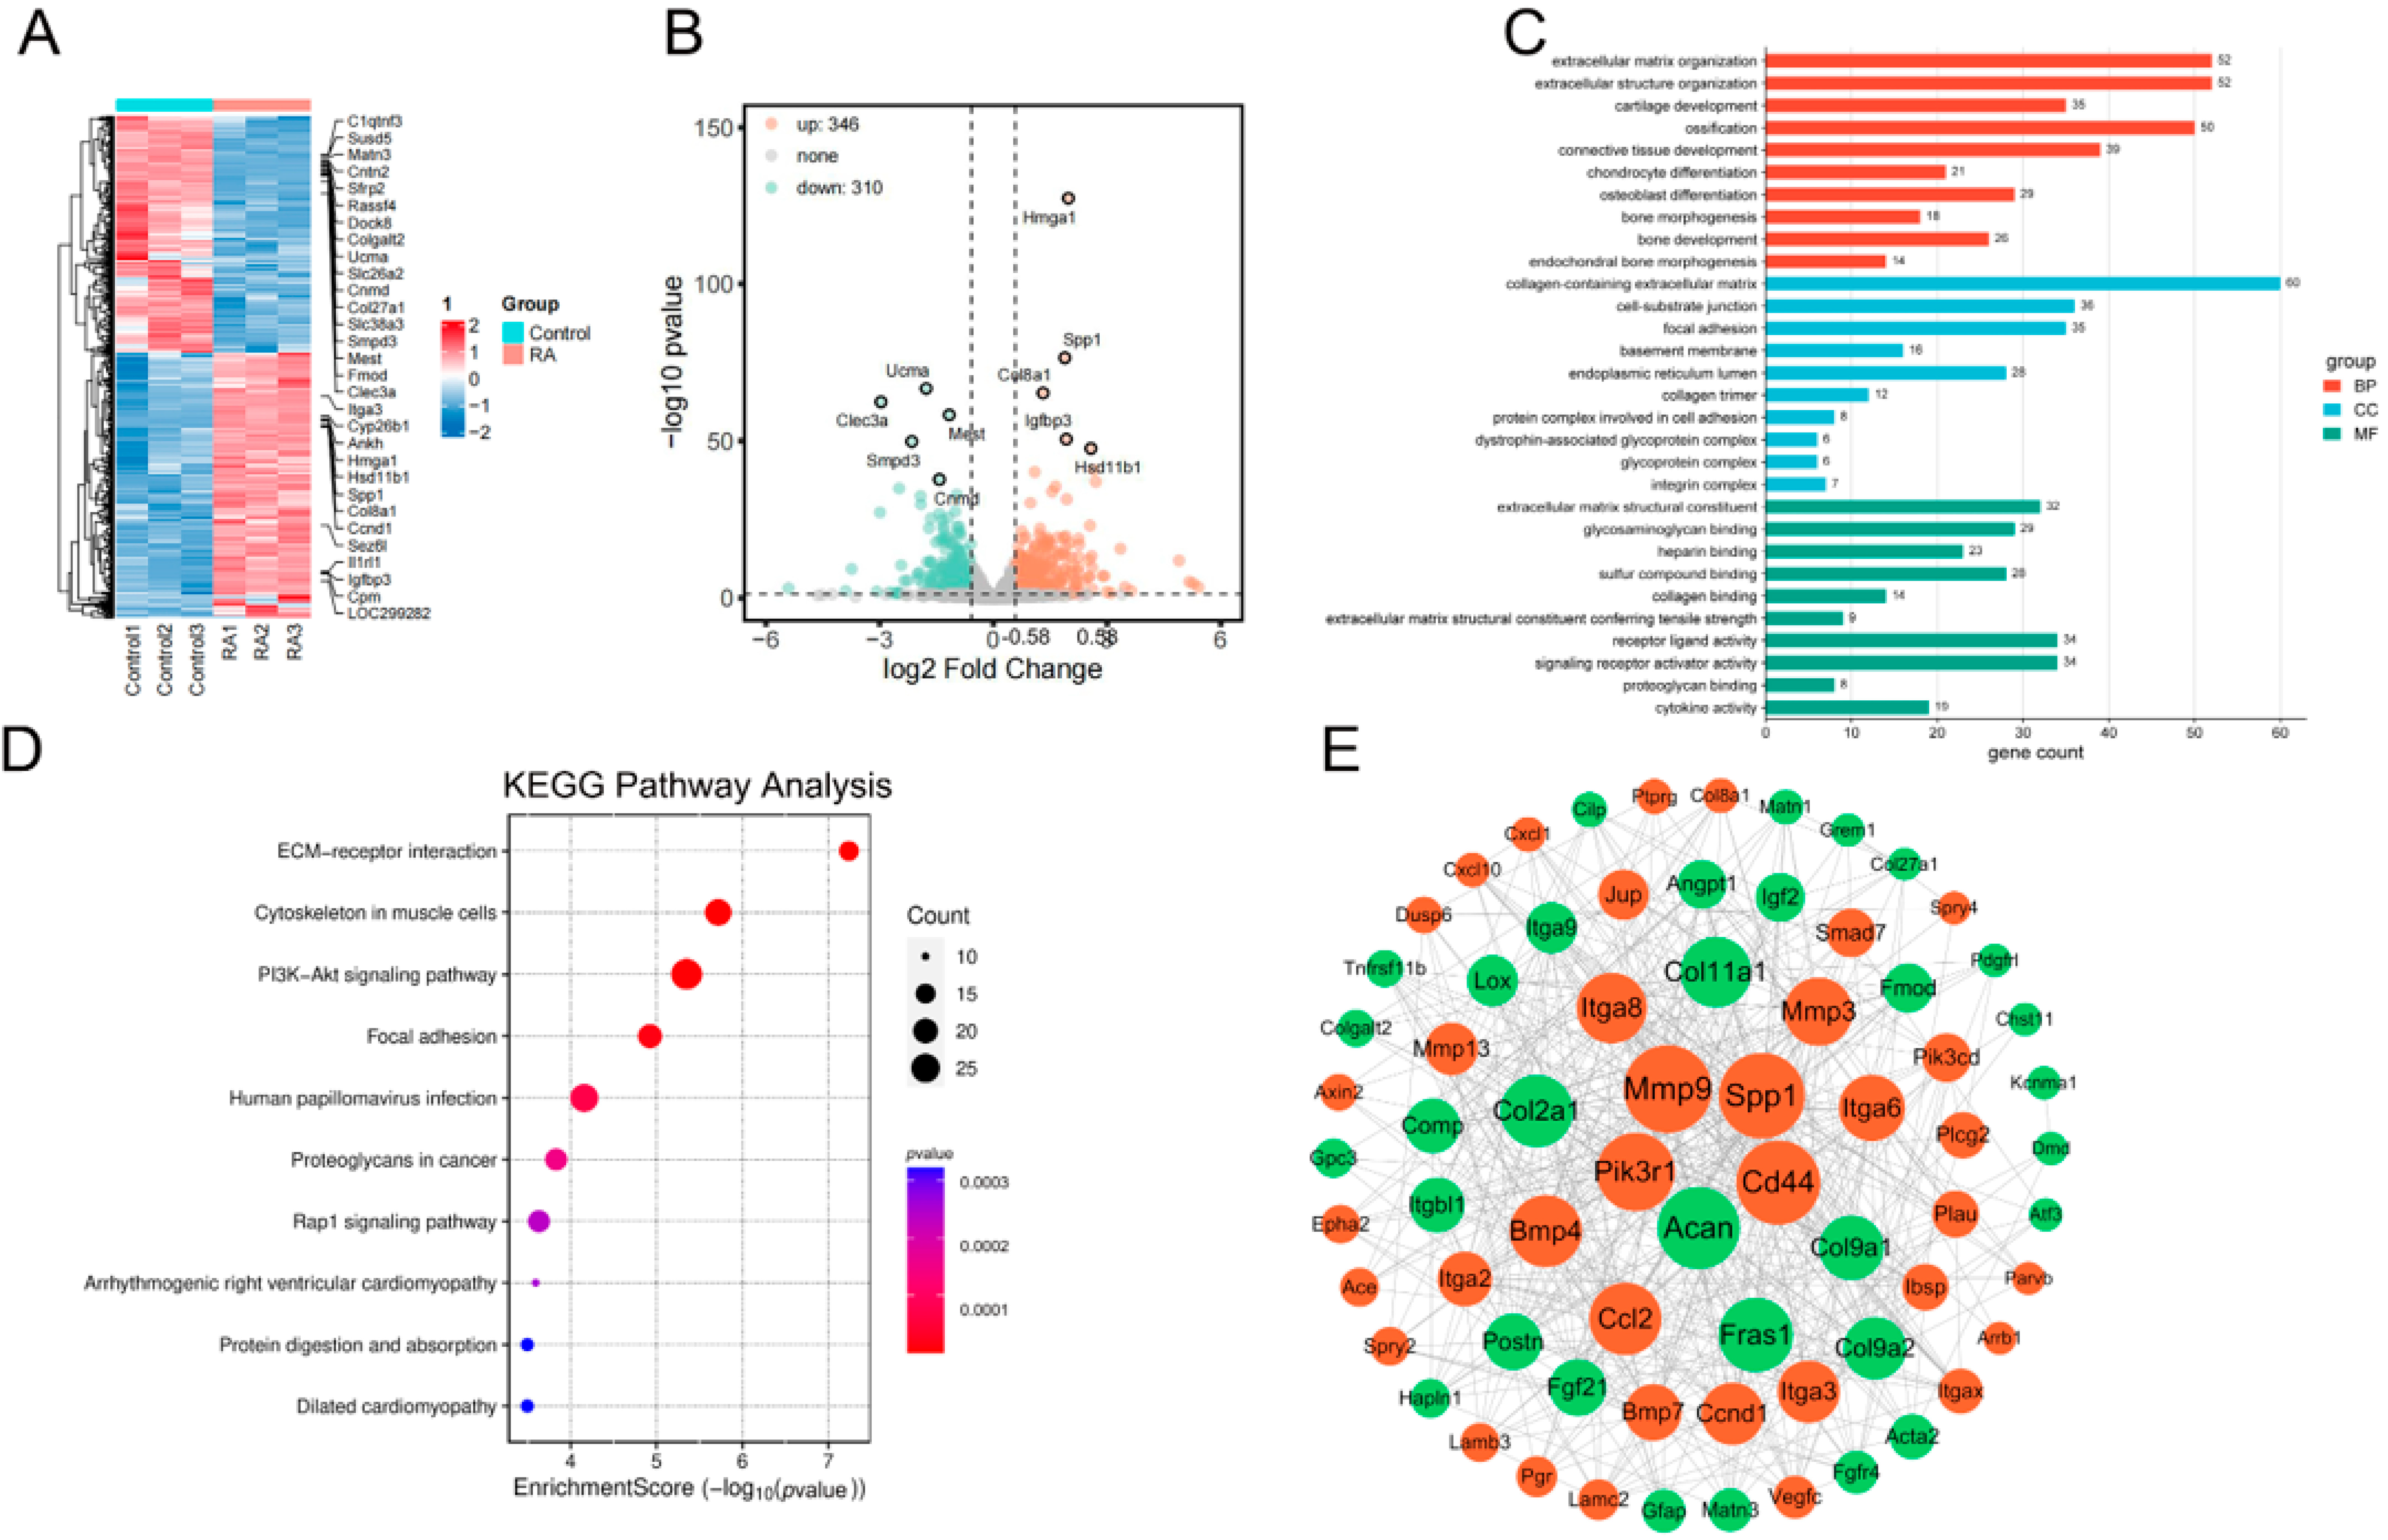
2.1. RNA-Seq Analyses Results
2.1.1. Visualization of RNA-Seq DEGs Results by Heatmap and Volcano Plot
2.1.2. PPI Network of RNA-Seq DEGs
2.1.3. GO and KEGG Pathway Analysis of RNA-Sequencing DEGs
2.1.4. Molecular Docking Validation Between RA and the Top 50 Genes Exhibiting the Largest Differential Expression in RNA-Seq DEGs
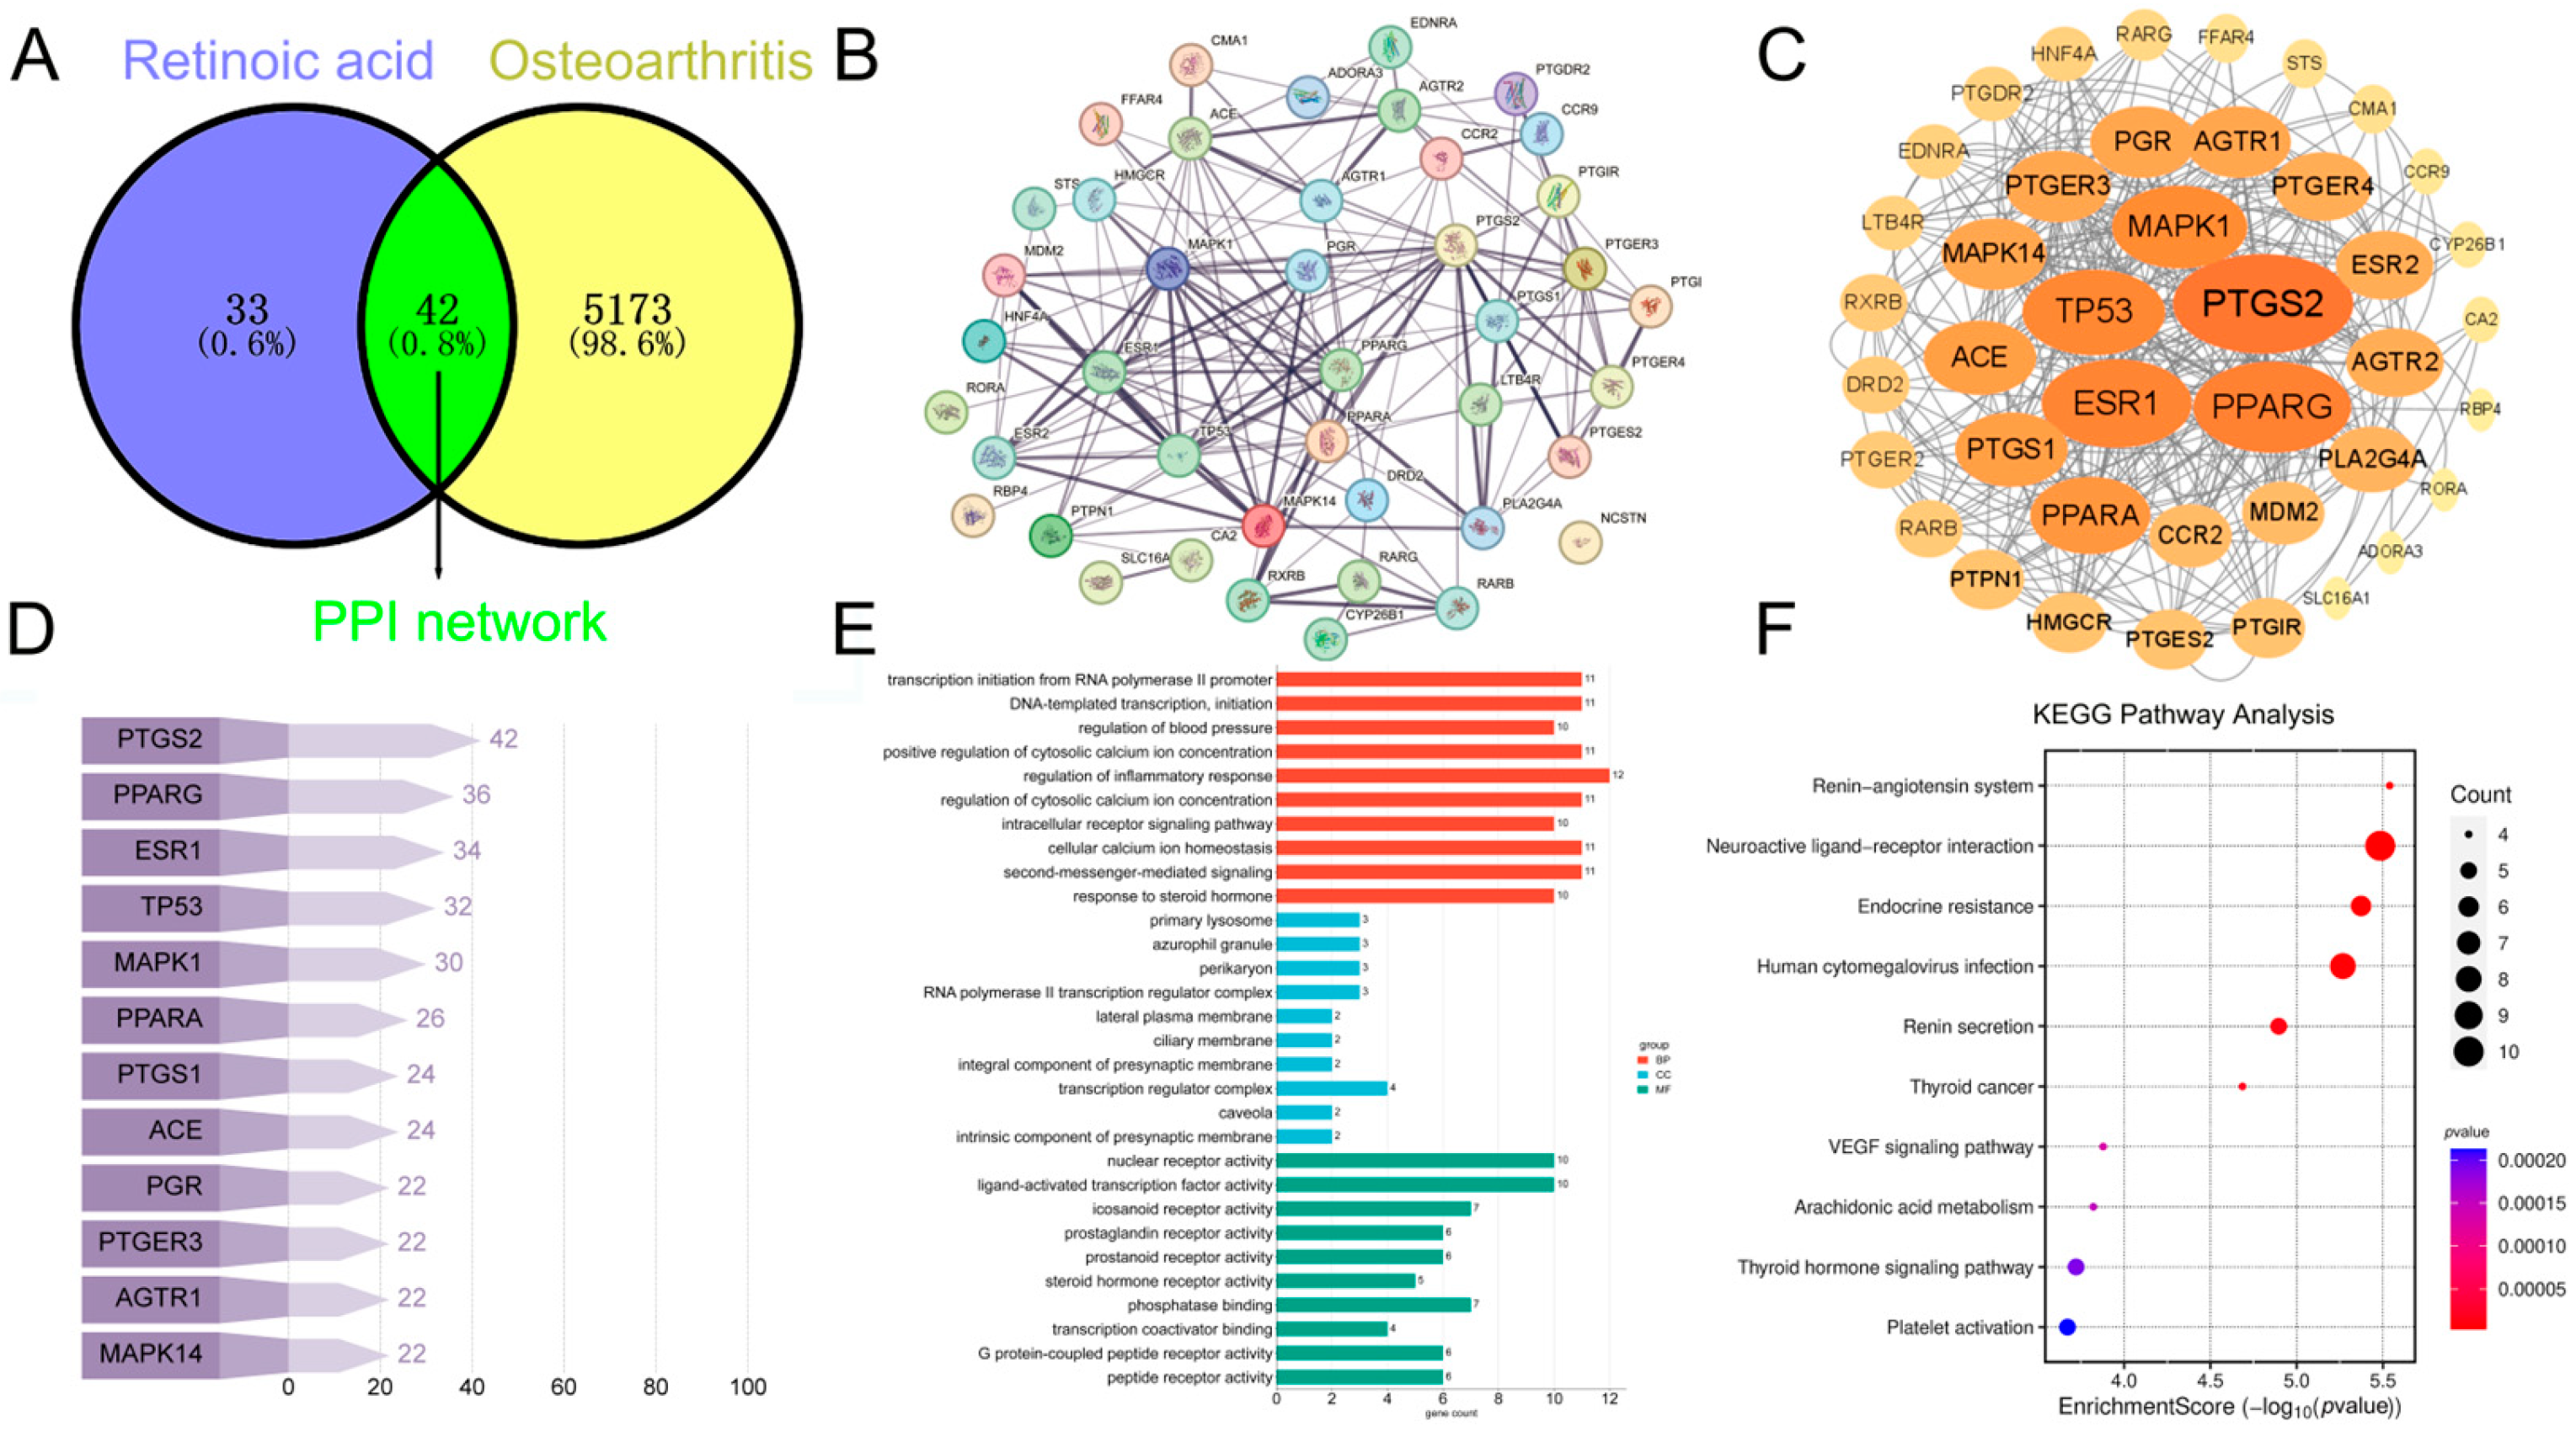
2.2. Network Pharmacology Analysis Results
2.2.1. Identification of Shared Targets Between RA and OA
2.2.2. Analyzing Core Molecular Targets Using PPI Network Analysis
2.2.3. GO and KEGG Pathway Analysis of DEGs in Chondrocytes Treated with RA
2.2.4. Molecular Docking Validation Between RA and 42 RA–OA Shared Targets Identified via Network Pharmacology Analysis
2.3. Molecular Docking Validation Between RA and the Intersecting Targets Identified by RNA-Seq and Network Pharmacology
2.4. Experimental Validation
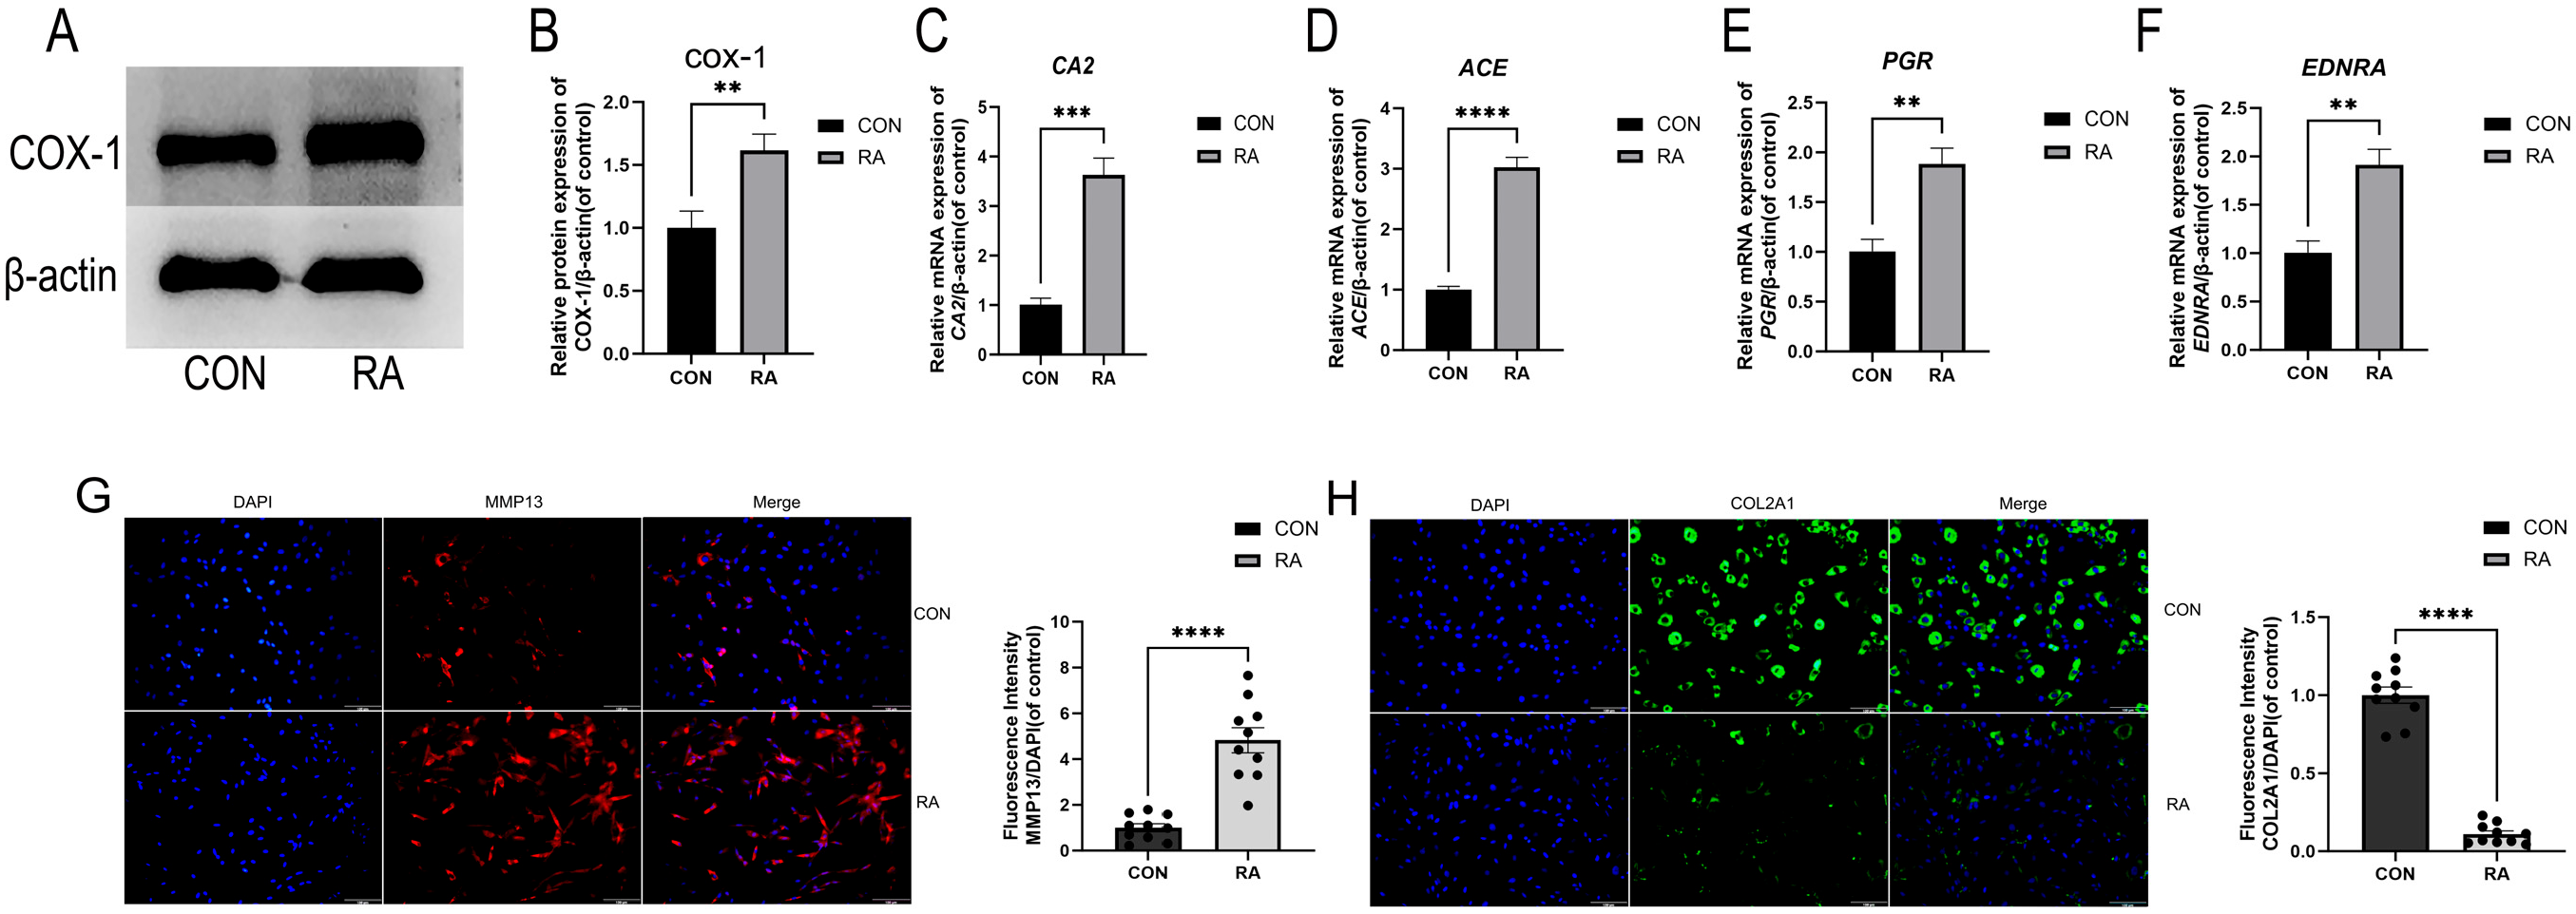
2.4.1. Analyzing the Expression of Representative DEGs and Target Genes Identified by RNA Sequencing and Network Pharmacology
2.4.2. Validation of Silencing Target Gene
3. Discussion
4. Materials and Methods
4.1. Chondrocyte Cell Culture
4.2. RNA-Seq
4.3. Network Pharmacology Analysis
4.4. Cross-Species Gene Symbol Switch
4.5. PPI Network Construction
4.6. GO and KEGG Pathway Enrichment Analysis
4.7. Molecular Docking
4.8. Western Blot
4.9. siRNA Experiments
4.10. RT-qPCR
4.11. Cellular Immunofluorescence
4.12. Statistical Analysis
5. Conclusions
Supplementary Materials
Author Contributions
Funding
Institutional Review Board Statement
Informed Consent Statement
Data Availability Statement
Acknowledgments
Conflicts of Interest
Abbreviations
| ACE | Angiotensin Converting Enzyme |
| APL | Acute promyelocytic leukemia |
| BBB | Blood–brain barrier |
| ATRA | All-trans retinoic acid |
| BCO1 | β-carotene oxygenase 1 |
| BP | Biological processes |
| CA2 | Carbonic Anhydrase 2 |
| CC | Cellular components |
| COL2A1 | Collagen type II alpha 1 chain |
| DEGs | Differentially expressed genes |
| DMEM | Dulbecco’s Modified Eagle’s Medium |
| ECM | Extracellular matrix |
| EDNRA | Endothelin Receptor Type A |
| FC | Fold change |
| GO | Gene ontology |
| KEGG | Kyoto Encyclopedia of Genes and Genomes |
| MF | Molecular function |
| MMP13 | Matrix metalloproteinase 13 |
| OA | Osteoarthritis |
| PGR | Progesterone Receptor |
| PPI | Protein-protein interaction |
| PTGS1 | Prostaglandin-Endoperoxide Synthase 1 |
| RA | Retinoic acid |
| RNA-Seq | RNA-sequencing |
| RP | Ribosomal Proteins |
| RPT | Receptor Type Protein Tyrosine Phosphatases |
| RS | Recursive Splicing |
| SPF | Specific pathogen-free |
| TGFα | Transforming growth factor alpha |
| siRNA | small interfering RNA |
References
- Hunter, D.J.; March, L.; Chew, M. Osteoarthritis in 2020 and beyond: A Lancet Commission. Lancet 2020, 396, 1711–1712. [Google Scholar] [CrossRef] [PubMed]
- Zheng, L.; Lu, Z.; Xu, G.; Niu, X.; Zhao, J. Dual-targeted disease-modifying therapies for osteoarthritis. Lancet 2024, 403, 2591. [Google Scholar] [CrossRef] [PubMed]
- Hunter, D.J.; Bierma-Zeinstra, S. Osteoarthritis. Lancet 2019, 393, 1745–1759. [Google Scholar] [CrossRef] [PubMed]
- Stewart, H.L.; Gilbert, D.; Stefanovski, D.; Garman, Z.; Albro, M.B.; Bais, M.; Grinstaff, M.W.; Snyder, B.D.; Schaer, T.P. A missed opportunity: A scoping review of the effect of sex and age on osteoarthritis using large animal models. Osteoarthr. Cartil. 2024, 32, 501–513. [Google Scholar] [CrossRef]
- Godziuk, K.; Hawker, G.A. Obesity and body mass index: Past and future considerations in osteoarthritis research. Osteoarthr. Cartil. 2024, 32, 452–459. [Google Scholar] [CrossRef]
- Bjerre-Bastos, J.J.; Hamrouni, N.; Henrotin, Y.; Thudium, C.S.; Bihlet, A.R. Joint biomarker response to mechanical stimuli in osteoarthritis—A scoping review. Osteoarthr. Cart. Open 2023, 5, 100390. [Google Scholar] [CrossRef]
- Harris, E.C.; Coggon, D. HIP osteoarthritis and work. Best Pract. Res. Clin. Rheumatol. 2015, 29, 462–482. [Google Scholar] [CrossRef]
- Mustari, M.N.; Massi, M.N.; Usman, M.A.; Fikry, A.; Bukhari, A.; Idris, I.; Zainuddin, A.A.; Adnan, E.; Bakri, S.; Hatta, M. Dynamic interaction of obesity, age, MCP-1 Level, and ACE-1 gene with the severity of knee osteoarthritis: A cross-sectional study. Ann. Med. Surg. 2023, 85, 3845–3851. [Google Scholar] [CrossRef]
- Oliveira, L.M.; Teixeira, F.; Sato, M.N. Impact of Retinoic Acid on Immune Cells and Inflammatory Diseases. Mediat. Inflamm. 2018, 2018, 3067126. [Google Scholar] [CrossRef]
- Jakaria, M.; Belaidi, A.A.; Bush, A.I.; Ayton, S. Vitamin A metabolites inhibit ferroptosis. Biomed. Pharmacother. 2023, 164, 114930. [Google Scholar] [CrossRef]
- de The, H.; Chomienne, C.; Lanotte, M.; Degos, L.; Dejean, A. The t(15;17) translocation of acute promyelocytic leukaemia fuses the retinoic acid receptor alpha gene to a novel transcribed locus. Nature 1990, 347, 558–561. [Google Scholar] [CrossRef] [PubMed]
- Borrow, J.; Goddard, A.D.; Sheer, D.; Solomon, E. Molecular analysis of acute promyelocytic leukemia breakpoint cluster region on chromosome 17. Science 1990, 249, 1577–1580. [Google Scholar] [CrossRef] [PubMed]
- Nau, H. Retinoid teratogenesis: Toxicokinetics and structure-specificity. Arch. Toxicol. Suppl. 1994, 16, 118–127. [Google Scholar] [CrossRef]
- Sass, J.O.; Zimmermann, B.; Ruhl, R.; Nau, H. Effects of all-trans-retinoyl-beta-D-glucuronide and all-trans-retinoic acid on chondrogenesis and retinoid metabolism in mouse limb bud mesenchymal cells in vitro. Arch. Toxicol. 1997, 71, 142–150. [Google Scholar] [CrossRef]
- Ellis, C.N.; Madison, K.C.; Pennes, D.R.; Martel, W.; Voorhees, J.J. Isotretinoin therapy is associated with early skeletal radiographic changes. J. Am. Acad. Dermatol. 1984, 10, 1024–1029. [Google Scholar] [CrossRef]
- Gerber, L.H.; Helfgott, R.K.; Gross, E.G.; Hicks, J.E.; Ellenberg, S.S.; Peck, G.L. Vertebral abnormalities associated with synthetic retinoid use. J. Am. Acad. Dermatol. 1984, 10, 817. [Google Scholar] [CrossRef]
- Lee, A.S.; Ellman, M.B.; Yan, D.; Kroin, J.S.; Cole, B.J.; van Wijnen, A.J.; Im, H.J. A current review of molecular mechanisms regarding osteoarthritis and pain. Gene 2013, 527, 440–447. [Google Scholar] [CrossRef]
- Jacobsen, S.; Ladefoged, S.; Berg, L.C. Production of serum amyloid A in equine articular chondrocytes and fibroblast-like synoviocytes treated with proinflammatory cytokines and its effects on the two cell types in culture. Am. J. Vet. Res. 2016, 77, 50–58. [Google Scholar] [CrossRef]
- Zhang, H.; Cai, D.; Bai, X. Macrophages regulate the progression of osteoarthritis. Osteoarthr. Cartil. 2020, 28, 555–561. [Google Scholar] [CrossRef]
- Fu, L.; Shi, S.; Yi, J.; Wang, N.; He, Y.; Wu, Z.; Peng, J.; Deng, Y.; Wang, W.; Wu, C.; et al. ADMETlab 3.0: An updated comprehensive online ADMET prediction platform enhanced with broader coverage, improved performance, API functionality and decision support. Nucleic Acids Res. 2024, 52, W422–W431. [Google Scholar] [CrossRef]
- Brown, P.D.; Benya, P.D. Alterations in chondrocyte cytoskeletal architecture during phenotypic modulation by retinoic acid and dihydrocytochalasin B-induced reexpression. J. Cell Biol. 1988, 106, 171–179. [Google Scholar] [CrossRef] [PubMed]
- Yu, Z.; Xing, Y. All-trans retinoic acid inhibited chondrogenesis of mouse embryonic palate mesenchymal cells by down-regulation of TGF-beta/Smad signaling. Biochem. Biophys. Res. Commun. 2006, 340, 929–934. [Google Scholar] [CrossRef] [PubMed]
- Pacifici, M. Retinoid roles and action in skeletal development and growth provide the rationale for an ongoing heterotopic ossification prevention trial. Bone 2018, 109, 267–275. [Google Scholar] [CrossRef] [PubMed]
- Feneck, E.; Logan, M. The Role of Retinoic Acid in Establishing the Early Limb Bud. Biomolecules 2020, 10, 312. [Google Scholar] [CrossRef]
- Kawata, M.; Mori, D.; Kanke, K.; Hojo, H.; Ohba, S.; Chung, U.I.; Yano, F.; Masaki, H.; Otsu, M.; Nakauchi, H.; et al. Simple and Robust Differentiation of Human Pluripotent Stem Cells toward Chondrocytes by Two Small-Molecule Compounds. Stem Cell Rep. 2019, 13, 530–544. [Google Scholar] [CrossRef]
- Mancini, F.E.; Humphreys, P.; Woods, S.; Bates, N.; Cuvertino, S.; O’Flaherty, J.; Biant, L.; Domingos, M.; Kimber, S.J. Effect of a retinoic acid analogue on BMP-driven pluripotent stem cell chondrogenesis. Sci. Rep. 2024, 14, 2696. [Google Scholar] [CrossRef]
- Horton, W.E.; Yamada, Y.; Hassell, J.R. Retinoic acid rapidly reduces cartilage matrix synthesis by altering gene transcription in chondrocytes. Dev. Biol. 1987, 123, 508–516. [Google Scholar] [CrossRef]
- Flannery, C.R.; Little, C.B.; Caterson, B.; Hughes, C.E. Effects of culture conditions and exposure to catabolic stimulators (IL-1 and retinoic acid) on the expression of matrix metalloproteinases (MMPs) and disintegrin metalloproteinases (ADAMs) by articular cartilage chondrocytes. Matrix Biol. 1999, 18, 225–237. [Google Scholar] [CrossRef]
- Loeser, R.F.; Goldring, S.R.; Scanzello, C.R.; Goldring, M.B. Osteoarthritis: A disease of the joint as an organ. Arthritis Rheum. 2012, 64, 1697–1707. [Google Scholar] [CrossRef]
- Horvath, E.; Solyom, A.; Szekely, J.; Nagy, E.E.; Popoviciu, H. Inflammatory and Metabolic Signaling Interfaces of the Hypertrophic and Senescent Chondrocyte Phenotypes Associated with Osteoarthritis. Int. J. Mol. Sci. 2023, 24, 16468. [Google Scholar] [CrossRef]
- Li, Z.; Dai, A.; Yang, M.; Chen, S.; Deng, Z.; Li, L. p38MAPK Signaling Pathway in Osteoarthritis: Pathological and Therapeutic Aspects. J. Inflamm. Res. 2022, 15, 723–734. [Google Scholar] [CrossRef] [PubMed]
- Kawahata, H.; Sotobayashi, D.; Aoki, M.; Shimizu, H.; Nakagami, H.; Ogihara, T.; Morishita, R. Continuous infusion of angiotensin II modulates hypertrophic differentiation and apoptosis of chondrocytes in cartilage formation in a fracture model mouse. Hypertens. Res. 2015, 38, 382–393. [Google Scholar] [CrossRef] [PubMed]
- Lehenkari, P.; Hentunen, T.A.; Laitala-Leinonen, T.; Tuukkanen, J.; Vaananen, H.K. Carbonic anhydrase II plays a major role in osteoclast differentiation and bone resorption by effecting the steady state intracellular pH and Ca2+. Exp. Cell Res. 1998, 242, 128–137. [Google Scholar] [CrossRef]
- Natua, S.; Dhamdhere, S.G.; Mutnuru, S.A.; Shukla, S. Interplay within tumor microenvironment orchestrates neoplastic RNA metabolism and transcriptome diversity. Wiley Interdiscip. Rev.-RNA 2022, 13, e1676. [Google Scholar] [CrossRef]
- Gao, P.; Gao, P.; Zhao, J.; Shan, S.; Luo, W.; Slivano, O.J.; Zhang, W.; Tabuchi, A.; LeMaire, S.A.; Maegdefessel, L.; et al. MKL1 cooperates with p38MAPK to promote vascular senescence, inflammation, and abdominal aortic aneurysm. Redox Biol. 2021, 41, 101903. [Google Scholar] [CrossRef]
- Wang, C.; Wang, F.; Lin, F.; Duan, X.; Bi, B. Naproxen attenuates osteoarthritis progression through inhibiting the expression of prostaglandinl-endoperoxide synthase 1. J. Cell. Physiol. 2019, 234, 12771–12785. [Google Scholar] [CrossRef]
- Dai, C.; Jia, J.; Kot, A.; Liu, X.; Liu, L.; Jiang, M.; Lane, N.E.; Wise, B.L.; Yao, W. Selective inhibition of progesterone receptor in osteochondral progenitor cells, but not in mature chondrocytes, modulated subchondral bone structures. Bone 2020, 132, 115196. [Google Scholar] [CrossRef]
- Duan, X.; Cai, L.; Schmidt, E.J.; Shen, J.; Tycksen, E.D.; O’Keefe, R.J.; Cheverud, J.M.; Rai, M.F. RNA-seq analysis of chondrocyte transcriptome reveals genetic heterogeneity in LG/J and SM/J murine strains. Osteoarthr. Cartil. 2020, 28, 516–527. [Google Scholar] [CrossRef]
- Schutte, D.L.; Mukhopadhyay, N.; Holwerda, T.; Sluka, K.; Rakel, B.; Govil, M. Genetic Predictors of Knee Pain in Persons with Mild to Moderate Osteoarthritis. Res. Gerontol. Nurs. 2020, 13, 191–202. [Google Scholar] [CrossRef]
- Usmani, S.E.; Appleton, C.T.; Beier, F. Transforming growth factor-alpha induces endothelin receptor A expression in osteoarthritis. J. Orthop. Res. 2012, 30, 1391–1397. [Google Scholar] [CrossRef]
- Chen, G.; Hu, S.; Lai, Z.; Qiu, B. Association between ACE gene I/D polymorphism and knee osteoarthritis in a Chinese population. Biosci. Rep. 2019, 39, BSR20181713. [Google Scholar] [CrossRef] [PubMed]
- Mustari, M.N.; Massi, M.N.; Usman, M.A.; Bukhari, A.; Idris, I.; Zainuddin, A.; Adnan, E.; Bakri, S.; Hatta, M.; Rasyid, H.; et al. Association between angiotensin-converting enzyme (ACE) gene I/D polymorphism with the risk of knee OA: A systematic review, meta-analysis, and meta-regression. F1000Research 2024, 13, 146. [Google Scholar] [CrossRef] [PubMed]
- Li, N.; Xu, Y.; Zhang, H.; Gao, L.; Li, J.; Wang, Y.; Gao, Z.; Pan, X.; Liu, X.; Li, X.; et al. Excessive retinoic acid impaired proliferation and differentiation of human fetal palatal chondrocytes (hFPCs). Birth Defects Res. B Dev. Reprod. Toxicol. 2014, 101, 276–282. [Google Scholar] [CrossRef] [PubMed]
- Kim, S.; Chen, J.; Cheng, T.; Gindulyte, A.; He, J.; He, S.; Li, Q.; Shoemaker, B.A.; Thiessen, P.A.; Yu, B.; et al. PubChem in 2021: New data content and improved web interfaces. Nucleic Acids Res. 2021, 49, D1388–D1395. [Google Scholar] [CrossRef]
- Daina, A.; Michielin, O.; Zoete, V. SwissTargetPrediction: Updated data and new features for efficient prediction of protein targets of small molecules. Nucleic Acids Res. 2019, 47, W357–W364. [Google Scholar] [CrossRef]
- Stelzer, G.; Rosen, N.; Plaschkes, I.; Zimmerman, S.; Twik, M.; Fishilevich, S.; Stein, T.I.; Nudel, R.; Lieder, I.; Mazor, Y.; et al. The GeneCards Suite: From Gene Data Mining to Disease Genome Sequence Analyses. Curr. Protoc. Bioinform. 2016, 54, 1–30. [Google Scholar] [CrossRef]
- Szklarczyk, D.; Kirsch, R.; Koutrouli, M.; Nastou, K.; Mehryary, F.; Hachilif, R.; Gable, A.L.; Fang, T.; Doncheva, N.T.; Pyysalo, S.; et al. The STRING database in 2023: Protein-protein association networks and functional enrichment analyses for any sequenced genome of interest. Nucleic Acids Res. 2023, 51, D638–D646. [Google Scholar] [CrossRef]
- Sherman, B.T.; Hao, M.; Qiu, J.; Jiao, X.; Baseler, M.W.; Lane, H.C.; Imamichi, T.; Chang, W. DAVID: A web server for functional enrichment analysis and functional annotation of gene lists (2021 update). Nucleic Acids Res. 2022, 50, W216–W221. [Google Scholar] [CrossRef]
- Tang, D.; Chen, M.; Huang, X.; Zhang, G.; Zeng, L.; Zhang, G.; Wu, S.; Wang, Y. SRplot: A free online platform for data visualization and graphing. PLoS ONE 2023, 18, e294236. [Google Scholar] [CrossRef]
- O’Boyle, N.M.; Banck, M.; James, C.A.; Morley, C.; Vandermeersch, T.; Hutchison, G.R. Open Babel: An open chemical toolbox. J. Cheminform. 2011, 3, 33. [Google Scholar] [CrossRef]
- The UniProt Consortium. Uniprot UniProt: The Universal Protein Knowledgebase in 2023. Nucleic Acids Res. 2023, 51, D523–D531. [Google Scholar] [CrossRef] [PubMed]
- Berman, H.M.; Westbrook, J.; Feng, Z.; Gilliland, G.; Bhat, T.N.; Weissig, H.; Shindyalov, I.N.; Bourne, P.E. The Protein Data Bank. Nucleic Acids Res. 2000, 28, 235–242. [Google Scholar] [CrossRef] [PubMed]
- Jain, A.N. Surflex-Dock 2.1: Robust performance from ligand energetic modeling, ring flexibility, and knowledge-based search. J. Comput.-Aided Mol. Des. 2007, 21, 281–306. [Google Scholar] [CrossRef] [PubMed]


| NO. | Gene | Protein Names | Total Score | Expression Level | Regulation Direction | NO. | Gene | Protein Names | Total Score | Expression Level | Regulation Direction |
|---|---|---|---|---|---|---|---|---|---|---|---|
| 1 | FGF21 | FGF21 | 5.07 | −1.275093649 | ↓ | 26 | CA12 | CAXII | 5.81 | −1.653209118 | ↓ |
| 2 | GSTM5 | GSTM5 | 4.77 | −3.89975587 | ↓ | 27 | MATN3 | MATN3 | 5.26 | −1.649267097 | ↓ |
| 3 | CNTN2 | TAG-1 | 6.44 | −2.994323357 | ↓ | 28 | CLEC3B | TETRANECTIN | 5.47 | −1.568581179 | ↓ |
| 4 | CLEC3A | CLEC3A | 3.73 | −2.965716164 | ↓ | 29 | KRT15 | KRT15 | 4.53 | −1.535326314 | ↓ |
| 5 | RPS29 | RPS29 | 3.4 | 2.002043011 | ↓ | 30 | ENHO | ADROPIN | 2.01 | −1.513834939 | ↓ |
| 6 | ARMCX1 | ALEX1 | 5.18 | −2.51049428 | ↓ | 31 | ACAN | ACAN | 7.64 | −1.508346707 | ↓ |
| 7 | SFRP2 | SFRP2 | 6.96 | −2.487056425 | ↓ | 32 | ABI3BP | ABI3BP | 5.47 | −1.481523265 | ↓ |
| 8 | KANSL2 | NSL2 | 6.97 | −2.469070952 | ↓ | 33 | COL27A1 | COL27A1 | 6.04 | −1.426276819 | ↓ |
| 9 | ART3 | ART3 | 5.31 | −2.436647379 | ↓ | 34 | CNMD | CHM | 3.26 | −1.425761422 | ↓ |
| 10 | CHRDL2 | CHRDL2 | 4.66 | −2.350714841 | ↓ | 35 | MGLL | MGLL | 0.83 | −1.406530896 | ↓ |
| 11 | SNX22 | SNX22 | 4.11 | −2.261867748 | ↓ | 36 | ANXA8 | ANXA8 | 5.61 | −1.404279806 | ↓ |
| 12 | SMPD3 | SMPD3 | 4.85 | −2.152491655 | ↓ | 37 | IGSF11 | IGSF11 | 4.1 | −1.366905518 | ↓ |
| 13 | MAGEL2 | MAGE-L2 | 4.81 | −1.998949503 | ↓ | 38 | ERG | ERG | 4.92 | −1.359516692 | ↓ |
| 14 | SMIM5 | TMBIM5 | 3.19 | −1.960175369 | ↑ | 39 | INHBE | INHBE | 5.74 | −1.351823894 | ↓ |
| 15 | SLC38A3 | SNAT3 | 5.44 | −1.920830616 | ↓ | 40 | RASSF4 | RASSF4 | 5.19 | −1.35158272 | ↓ |
| 16 | COLGALT2 | COLGALT2 | 5.36 | −1.913873314 | ↓ | 41 | CRYGA | GAMMA-CRYSTALLIN A | 5.36 | −1.338521637 | ↓ |
| 17 | LYPD6B | LYPD6B | 4.96 | −1.860922982 | ↓ | 42 | NCMAP | NCMAP | 3.17 | −1.338181175 | ↓ |
| 18 | EPYC | DSPG3 | 3.05 | −1.750839641 | ↓ | 43 | PCOLCE2 | PCPE2 | 4.62 | −1.330137352 | ↓ |
| 19 | RPL32 | RPL32 | 3.88 | −1.748371841 | ↓ | 44 | C1QTNF3 | CTRP3 | 4.06 | −1.32979187 | ↑ |
| 20 | GRAMD2A | GRAMD2A | 3.97 | −1.698220337 | ↓ | 45 | NR0B1 | DAX1 | 3.2 | −1.323829573 | ↑ |
| 21 | RPL35A | RPL35A | 5.65 | −1.685224194 | ↓ | 46 | MIA | MIA | 4.13 | −1.312747989 | ↓ |
| 22 | ZNF648 | ZNF648 | 4.66 | −1.667062981 | ↓ | 47 | HAPLN1 | HAPLN1 | 5.84 | −1.299373455 | ↓ |
| 23 | FGFR4 | FGFR4 | 5.07 | −1.664759977 | ↓ | 48 | GLIS1 | GLIS1 | 4.43 | −1.290628079 | ↓ |
| 24 | KCTD4 | KCTD4 | 4.55 | −1.663897339 | ↓ | 49 | EEF1AKMT3 | METTL21B | 3.79 | −1.286673416 | ↓ |
| 25 | FASLG | TNFSF6 | 4.22 | −1.657606623 | ↓ | 50 | POSTN | POSTN | 5.73 | −1.285222679 | ↓ |
| NO. | Gene | Protein Names | Total Score | NO. | Gene | Protein Names | Total Score |
|---|---|---|---|---|---|---|---|
| 1 | RXRB | RXRB | 4.98 | 22 | AGTR1 | AT1R | 4.59 |
| 2 | RARG | RARG | 4.51 | 23 | PTGER3 | EP3R | 6.64 |
| 3 | RARB | RARB | 6.33 | 24 | PGR | PGR | 5.82 |
| 4 | ADORA3 | ADORA3 | 5.56 | 25 | HNF4A | HNF4α | 6.28 |
| 5 | MAPK1 | MAPK1 | 6.93 | 26 | PLA2G4A | cPLA2α | 4.54 |
| 6 | RORA | RORA | 4.33 | 27 | DRD2 | DRD2 | 4.53 |
| 7 | MAPK14 | p38α | 8.01 | 28 | PTGIR | IPR | 6.25 |
| 8 | PTPN1 | PTP1B | 4.69 | 29 | PTGS1 | COX-1 | 5.74 |
| 9 | RBP4 | RBP4 | 4.93 | 30 | PTGS2 | COX-2 | 6.14 |
| 10 | PPARA | PPARA | 6.29 | 31 | CMA1 | CMA1 | 5.04 |
| 11 | SLC16A1 | MCT1 | 4.96 | 32 | FFAR4 | GPR120 | 5.89 |
| 12 | PPARG | PPARG | 6.5 | 33 | CA2 | CAII | 7.44 |
| 13 | CYP26B1 | Cyp26B1 | 6.28 | 34 | HMGCR | HMGCR | 5.79 |
| 14 | PTGER4 | EP4 | 5.63 | 35 | CCR2 | CCR2 | 6.91 |
| 15 | PTGER2 | PTGER2 | 4.74 | 36 | ESR1 | ERα | 6.29 |
| 16 | PTGES2 | PGES2 | 5.67 | 37 | ESR2 | ERβ | 4.7 |
| 17 | LTB4R | BLT1 | 4.75 | 38 | TP53 | p53 | 5.7 |
| 18 | PTGDR2 | CRTH2 | 5.24 | 39 | ACE | ACE | 6.54 |
| 19 | MDM2 | MDM2 | 5.57 | 40 | STS | STS | 5.99 |
| 20 | CCR9 | CCR9 | 6 | 41 | EDNRA | ETAR | 4.82 |
| 21 | AGTR2 | AT2R | 6.93 | 42 | NCSTN | NCSTN | 5.9 |
| Genes | Sequences |
|---|---|
| PGR | F: 5′-ACAAAGCCCGACACTTCC-3′ |
| R: 5′-CCTCTCGCCTAGTTGGTTG-3′ | |
| CA2 | F: 5′-TACCTCTCACCCATTGTGC-3′ |
| R: 5′-GCCCTAAGTCAACCACCA-3′ | |
| EDNRA | F: 5′-GGCCCTTGGAGACCTTAT-3′ |
| R: 5′-GGAACAGCTTGCAGAGAAA-3′ | |
| ACE | F: 5′-AGAGTCCAGTCGCGTCAAC-3′ |
| R: 5′-GGAAGAGCAGCACCCACT-3′ |
Disclaimer/Publisher’s Note: The statements, opinions and data contained in all publications are solely those of the individual author(s) and contributor(s) and not of MDPI and/or the editor(s). MDPI and/or the editor(s) disclaim responsibility for any injury to people or property resulting from any ideas, methods, instructions or products referred to in the content. |
© 2025 by the authors. Licensee MDPI, Basel, Switzerland. This article is an open access article distributed under the terms and conditions of the Creative Commons Attribution (CC BY) license (https://creativecommons.org/licenses/by/4.0/).
Share and Cite
Lu, T.; Liu, Z.-Y.; Ge, Y.-S.; Jiang, S.-Y.; Zhao, Q.-A.; Ding, D.-F. Study of Retinoic Acid-Induced Osteoarthritis: Integrating RNA-Sequencing, Network Pharmacology, Molecular Docking, and Experimental Validation. Int. J. Mol. Sci. 2025, 26, 5519. https://doi.org/10.3390/ijms26125519
Lu T, Liu Z-Y, Ge Y-S, Jiang S-Y, Zhao Q-A, Ding D-F. Study of Retinoic Acid-Induced Osteoarthritis: Integrating RNA-Sequencing, Network Pharmacology, Molecular Docking, and Experimental Validation. International Journal of Molecular Sciences. 2025; 26(12):5519. https://doi.org/10.3390/ijms26125519
Chicago/Turabian StyleLu, Tao, Zi-Yi Liu, Yang-Shuo Ge, Shuai-Yu Jiang, Qing-Ao Zhao, and Dao-Fang Ding. 2025. "Study of Retinoic Acid-Induced Osteoarthritis: Integrating RNA-Sequencing, Network Pharmacology, Molecular Docking, and Experimental Validation" International Journal of Molecular Sciences 26, no. 12: 5519. https://doi.org/10.3390/ijms26125519
APA StyleLu, T., Liu, Z.-Y., Ge, Y.-S., Jiang, S.-Y., Zhao, Q.-A., & Ding, D.-F. (2025). Study of Retinoic Acid-Induced Osteoarthritis: Integrating RNA-Sequencing, Network Pharmacology, Molecular Docking, and Experimental Validation. International Journal of Molecular Sciences, 26(12), 5519. https://doi.org/10.3390/ijms26125519