Article

Sequential Plasma Metabolome and Proteome Analyses to Develop a Novel Monitoring Strategy for Patients with Epithelial Ovarian Cancer: A Pilot Study

1
Advanced Research Center for Innovations in Next-Generation Medicine, Tohoku University, Sendai 980-8573, Japan
2
Tohoku Medical Megabank Organization, Tohoku University, Sendai 980-8573, Japan
3
Department of Gynecology, Graduate School of Medicine, Tohoku University, Sendai 980-8574, Japan
4
Systems Bioinformatics, Graduate School of Information Sciences, Tohoku University, Sendai 980-8579, Japan
5
Department of Obstetrics and Gynecology, Hachinohe City Hospital, Hachinohe 031-8555, Japan
6
Division of Molecular and Cellular Oncology, Miyagi Cancer Center, Natori 981-1293, Japan
*
Author to whom correspondence should be addressed.
These authors contributed equally to this work.
Int. J. Mol. Sci. 2025, 26(12), 5435; https://doi.org/10.3390/ijms26125435
Submission received: 2 April 2025 / Revised: 3 June 2025 / Accepted: 4 June 2025 / Published: 6 June 2025
(This article belongs to the Special Issue Biomarkers and Early Detection Strategies of Ovarian Tumors)

Abstract

Epithelial ovarian cancer (EOC) is diagnosed at an advanced stage in over half of the patients and its prognosis remains unfavorable. CA125, one of the most frequent positive tumor markers in patients with EOC, has certain limitations. Therefore, more accurate clinical biomarkers are needed. Liquid biopsy with cancer related molecules, such as circulating tumor DNA, is a new option for cancer diagnosis and prognosis. We explored the potential of plasma metabolomic and proteomic analyses as novel monitoring methods for the patients with EOC. Of seven patients, six experienced disease recurrence or progression. CA125 plasma measurements were conducted for disease monitoring. Plasma metabolome and proteome analyses were performed using liquid chromatography–tandem mass spectrometry. Ten and four metabolome indicators were significantly increased and decreased in association with chemotherapeutic resistance, respectively. In addition, thirty-seven and nine proteins displayed high and low levels associated with chemotherapeutic resistance, respectively. Several metabolome pathways and protein concentrations corresponded to the clinical course of each patient. This pilot study suggested the potential of the assessment of metabolome and proteome analysis as a useful tool for developing novel monitoring biomarkers for patients with recurrent EOC.

1. Introduction

More than half of patients with epithelial ovarian cancer (EOC) are diagnosed at the advanced stage, with 70% of advanced (stage III/IV) EOC relapsing within 3 years [1]. Recent international phase III trials have shown that maintenance therapy with bevacizumab and/or PARP inhibitors improves progression-free survival in patients with advanced EOC who have responded to initial chemotherapy, but disease recurrence is still inevitable, and a cure is difficult to achieve in many patients with advanced EOC [2,3,4,5,6].
CA125 is one of the tumor markers with a high positivity rate in patients with EOC, with 80–85% positivity when a cut-off value of 35 U/mL is used [7,8]. Regarding disease recurrence, more than 80% of patients with recurrent EOC are positive for a doubling of CA125 from the upper limit [9]. Both the National Institutes of Health consensus statement and European Society of Medical Oncology consensus conference recommend the measurement of CA125 levels, as well as medical consultation and physical examinations as a routine follow-up after initial treatment for EOC [1,10]. In addition, CA125 is universally used as a marker for monitoring therapeutic response [11,12,13]. However, CA125 can be affected by benign diseases, such as endometriosis and inflammation, and sensitivity and specificity of CA125 are not high enough for it to be used as a single clinical biomarker [14]. There is a need for the establishment of more reliable clinical biomarkers.
With the advances in omics technologies, liquid biopsies have attracted attention as a new option for cancer diagnosis and monitoring [15,16]. Particularly, emerging evidence supports the potential of monitoring tumor DNA circulating in the peripheral blood (ctDNA) as a novel clinical biomarker for various carcinomas [17,18,19]. Importantly, ctDNA and a variety of cancer-associated molecules, including metabolites and proteins, are notable targets for liquid biopsy in oncology [20,21,22].
In contrast to nucleic acid analyses, metabolomics and proteomics require mass spectrometry. Applying a comprehensive analysis of circulating cancer-associated proteins or metabolites to clinical biomarkers has long been challenging owing to the difficulty in standardizing analytic processes, including sample preparation, column selection, and quantification methods [21,23,24]. Recently, we demonstrated the significant difference in plasma metabolomic profile between patients with major gynecologic cancer and healthy controls using the MxP® Quant 500 kit, a liquid chromatography–tandem mass spectrometry (UHPLC-MS/MS)-based product, which quantifies more than 500 metabolites with good reproducibility [25,26,27,28]. In addition, advances in proteomics have enabled researchers to perform analyses with high accuracy and reproducibility [29,30].
To overcome the current limitations in the therapeutic monitoring using CA125 measurements for patients with EOC, this pilot study was launched to identify novel monitoring strategies for EOC by analyzing sequentially collected plasma samples from seven patients using metabolome and proteome analyses. In this study, each plasma sample was classified into two groups according to treatment response, and the metabolomic and proteomic profiles were compared to evaluate the association between plasma metabolites and proteins and clinical response.

2. Results

2.1. Patient Characteristics and Clinical Course

Seven patients were enrolled in the study. Patient characteristics are summarized in Table 1. During the study period, six of the seven patients experienced disease recurrence or progression. No recurrence was observed in one patient who was treated with niraparib maintenance therapy after confirmation of a clinical complete response with the primary treatment. The clinical course and transition of CA125 and ctDNA in each patient are summarized in Figure S1. Information on the probes used to detect ctDNA in each patient is summarized in Table S1. Somatic mutations detected in the seven patients were also summarized in Table S2.
Each of the seven patients had multiple blood samplings, and plasma samples at each time point were classified into two groups: good-response and poor-response. The number of samples in the good- and poor-response groups for each patient is shown in Table 2.

2.2. Data Processing for Metabolome and Proteome Analysis

The 222 metabolism indicators and 399 proteins were selected on the basis of <20% of missing values for the statistical analysis. In addition, 208 metabolic indices and 399 proteins were selected for volcano plot analysis because they contained at least three significant values in each group. The ratio of metabolome indicators to protein levels relative to the time of blood sampling prior to cancer resection was statistically analyzed, as the results of the principal competent analysis (PCA) indicated that metabolomic and proteomic data varied widely among individuals (Figure 1).

2.3. Comparison of Metabolism Indicators Between Poor Good Response to Chemotherapy

Fourteen metabolism indicators were detected in the two groups (poor and good response to chemotherapy, FDR-adjusted p < 0.05, log2 fold change > 1 or <−1; Table 3). Ten metabolism indicators (polyamine synthesis, sum of polyamines, sum of unconjugated primary bile acids, putrescine synthesis, sum of unconjugated bile acids, serotonin synthesis, phospholipase A2 (PLA2) activity, sum of saturated triglycerides, sum of neurotransmitters, and lactate dehydrogenase activity) were displayed at a high level, and four metabolism indicators (2-methylbutyrylglycinuria, ratio of conjugated secondary bile acids to unconjugated secondary bile acids, glycine conjugation of deoxycholic acid, and glycodeoxycholic acid synthesis from cholic acid) were indicated at a low level in poor-response samples (Figure 2). Box plots with individual data points for these indicators are also shown in Figure 3.

2.4. Comparison of Protein Profiles Between Poor and Good Response to Chemotherapy

Forty-six proteins were detected in the two groups (poor and good response to chemotherapy, FDR-adjusted p < 0.05, log2 fold change > 1 or <−1; Table 4). Thirty-seven proteins displayed high levels, and nine (regulator of telomere elongation helicase 1, putative trypsin-6, contactin-1, exostosin-like 2, adhesion G-protein coupled receptor G6, immunoglobulin heavy variable 3-7, cathepsin D, aminopeptidase N, and keratin, and type I cytoskeletal 9) showed low levels in poor-response samples (Figure 4). The eight proteins that satisfy the conditions VIP score > 2, log2 fold change > 1 or <−1, and FDR-adjusted p-value < 0.05 are shown in Figure 5.
The pathways identified in the enrichment analysis of the 37 proteins at high level in the poor-response group were cancer-associated, including high-kinase activity BRAF mutant, RAF1 mutant, paradoxical activation of RAF by kinase-inactive BRAF, downstream RAS mutant, moderate kinase activity BRAF mutant, RAS mutants, BRAF and RAF1 fusion, and oncogenic MAPK signaling (Table 5). Integrin beta-3, integrin alpha-IIb, vinculin, actin, cytoplasmic 1, Ras-related protein Rap-1b, and Talin-1 were implicated in these pathways. The enrichment analysis of the nine low-level proteins in the poor-response group showed that the metabolism of angiotensinogen to angiotensins was associated with aminopeptidase N and cathepsin (Table 6).

3. Discussion

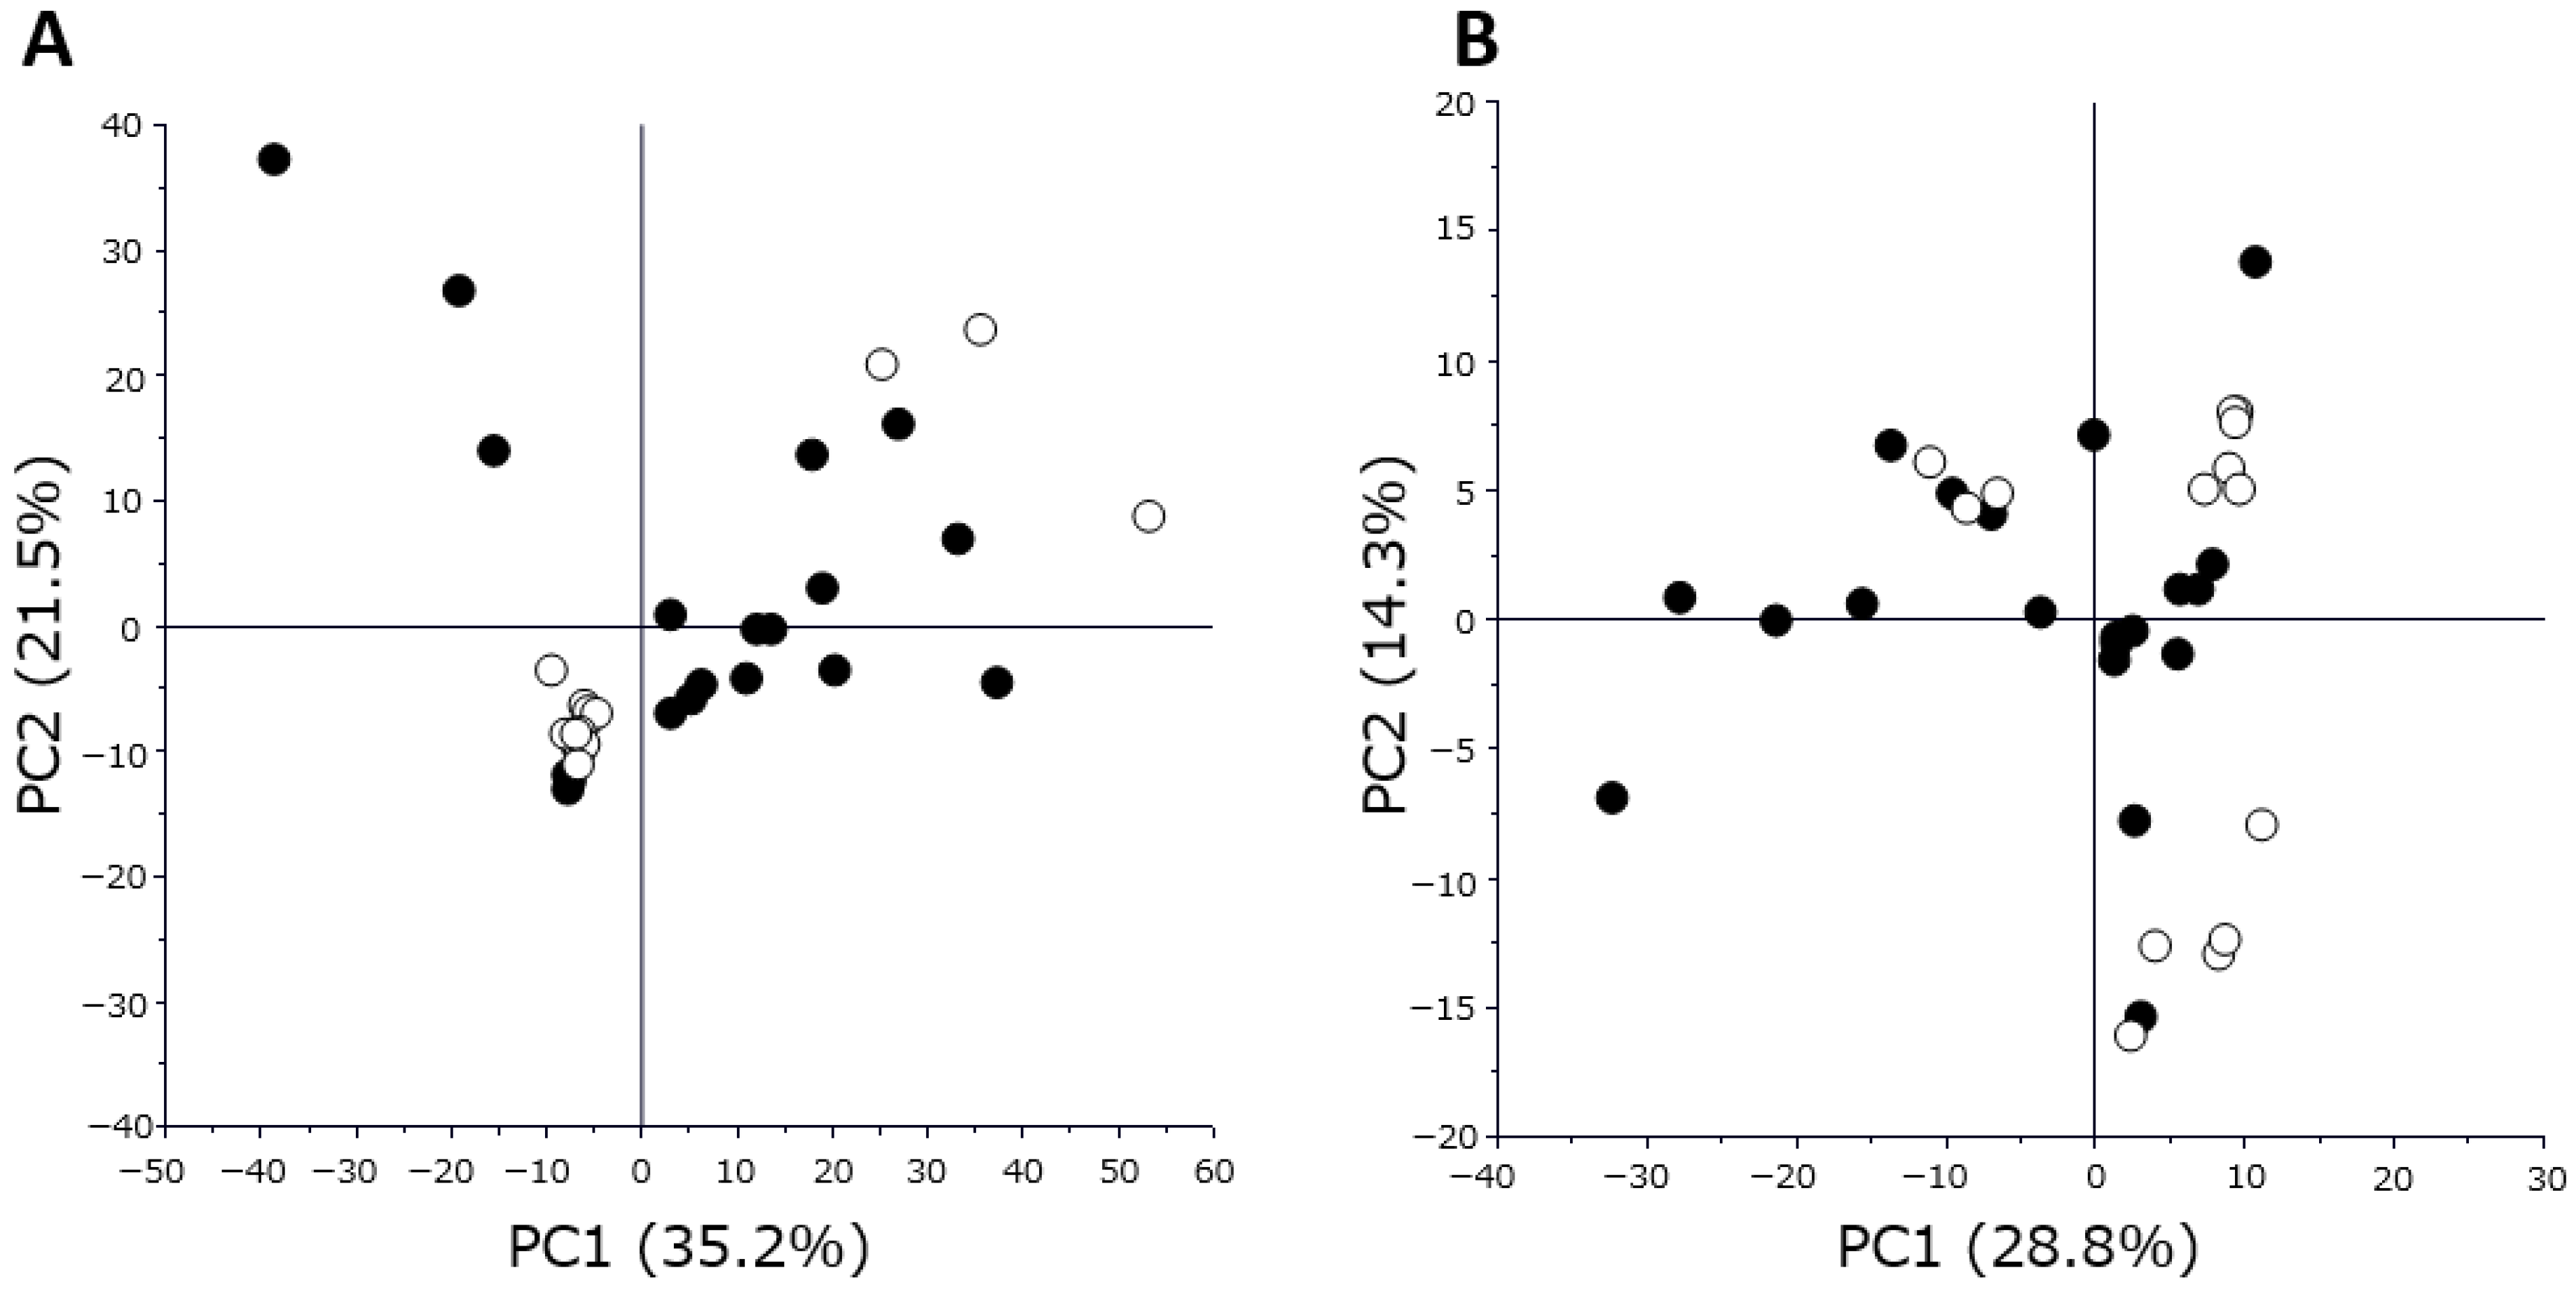
The current study demonstrated that the profiles of plasma metabolites and proteins were well discriminated based on disease recurrence or the therapeutic response. Together with the results of subsequent analyses for the sequential monitoring of selected metabolite and protein indicators, plasma metabolomic and proteomic analyses may be considered effective strategies for identifying novel clinical biomarkers for monitoring early disease recurrence or therapeutic response in patients with EOC.
The advantage of liquid biopsy is not only accurate disease monitoring but also tailoring therapeutic interventions. Regarding ctDNA in colorectal cancer, some studies, including a phase II randomized clinical study, have indicated the potential benefit of ctDNA as a decision-making marker for the application of adjuvant chemotherapy [31,32]. A phase III trial is also underway to investigate the benefit of adjuvant therapy in patients with stage II–IV radically resectable colorectal cancer presenting positive ctDNA four weeks after surgery [33]. The results of the current study, in combination with that of our previous work on EOC [26], indicate that plasma metabolomic and/or proteomic analysis may also be useful for personalizing therapeutic strategies for patients with EOC.
Another potential benefit of liquid biopsy is early intervention at the time of disease recurrence. A randomized controlled trial (MRC OV5/EORTC55955 study) examining the benefit of early therapeutic intervention based solely on CA125 elevation without any evidence of disease on clinical imaging did not demonstrate an advantage of early intervention in patient prognosis [34]. As mentioned in the introduction, the sensitivity and specificity of CA125 are not sufficiently high to accurately detect disease recurrence. Metabolomic and/or proteomic analysis, ctDNA liquid biopsy, or a combination of these may enable clinicians to detect at or before disease recurrence more precisely than CA125. Recently, molecular targeted therapies, such as anti-angiogenic agents and PARP inhibitors, have been implemented in clinical practice for patients with advanced or recurrent EOC, and the development of antibody-drug conjugates is being accelerated. Despite the discouraging outcome of the MRC OV5/EORTC55955 study, patients with advanced or recurrent EOC now have more treatment options. Therefore, if it becomes possible to diagnose recurrence earlier and more accurately using, for example, metabolomic and/or proteomic analysis, early intervention for recurrent EOC may contribute to extending the overall survival of advanced EOC; then, it may be worth re-evaluating the significance of early treatment intervention based on extremely early diagnosis of recurrence.
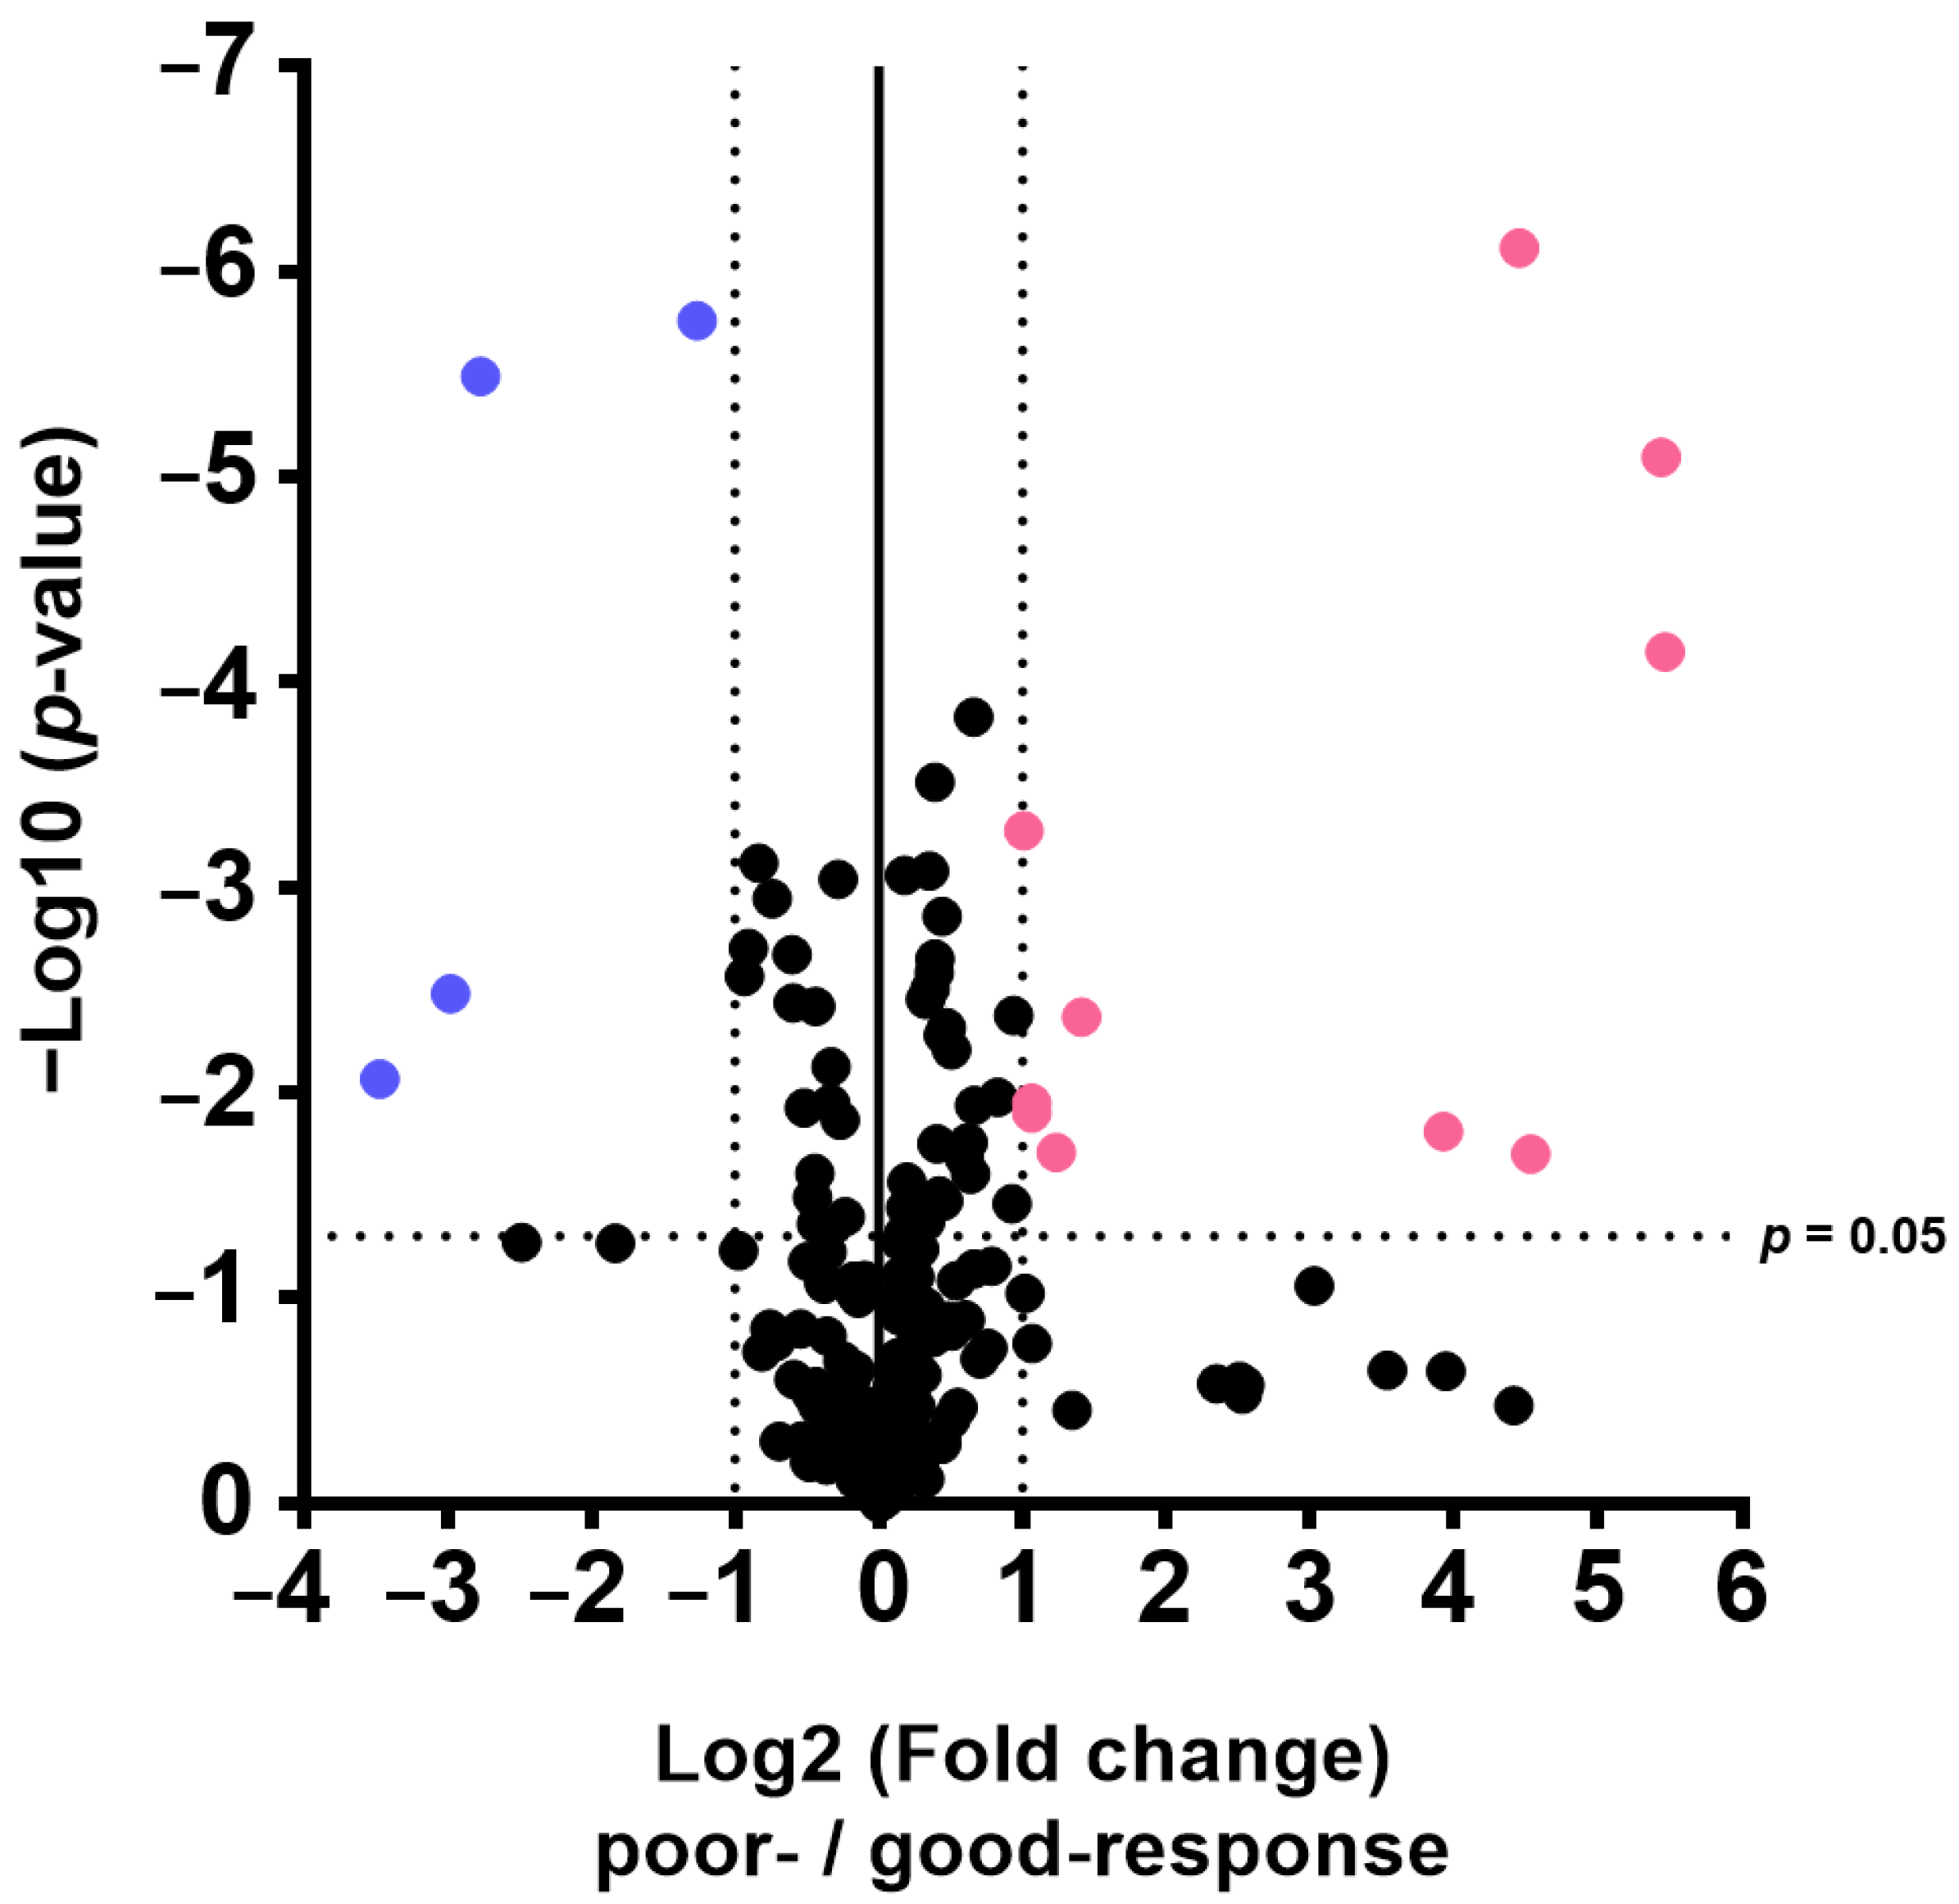
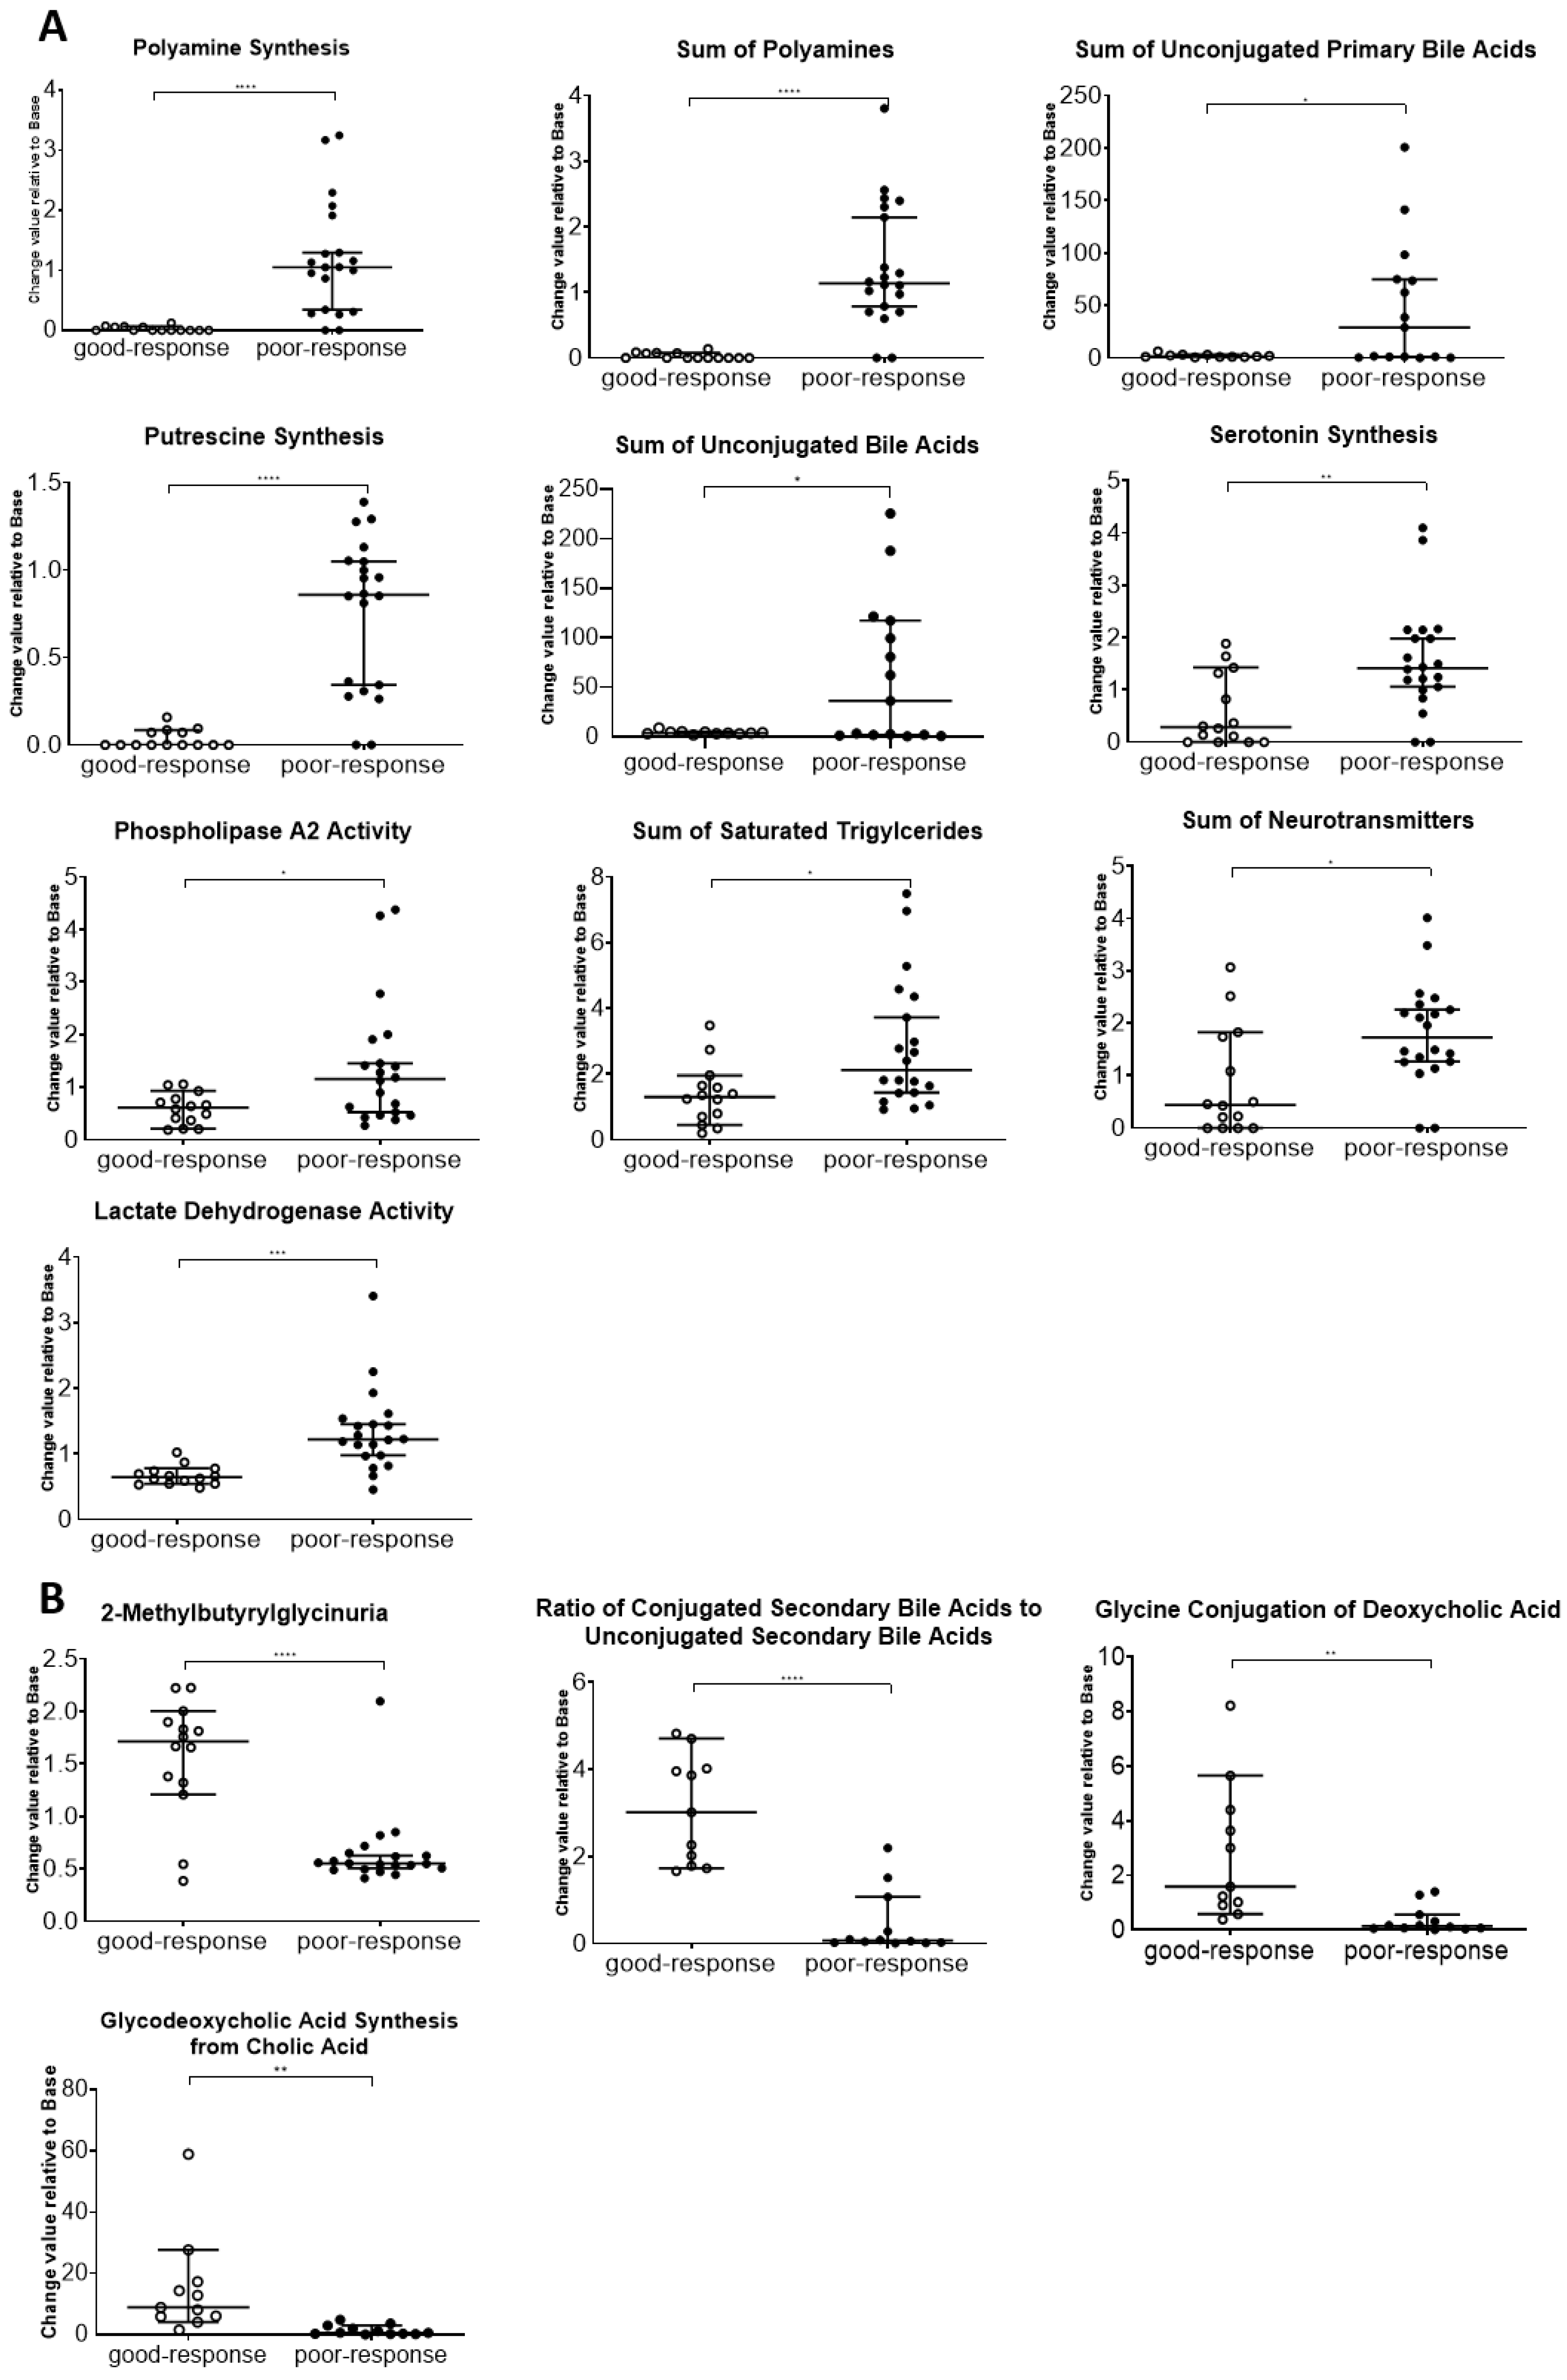
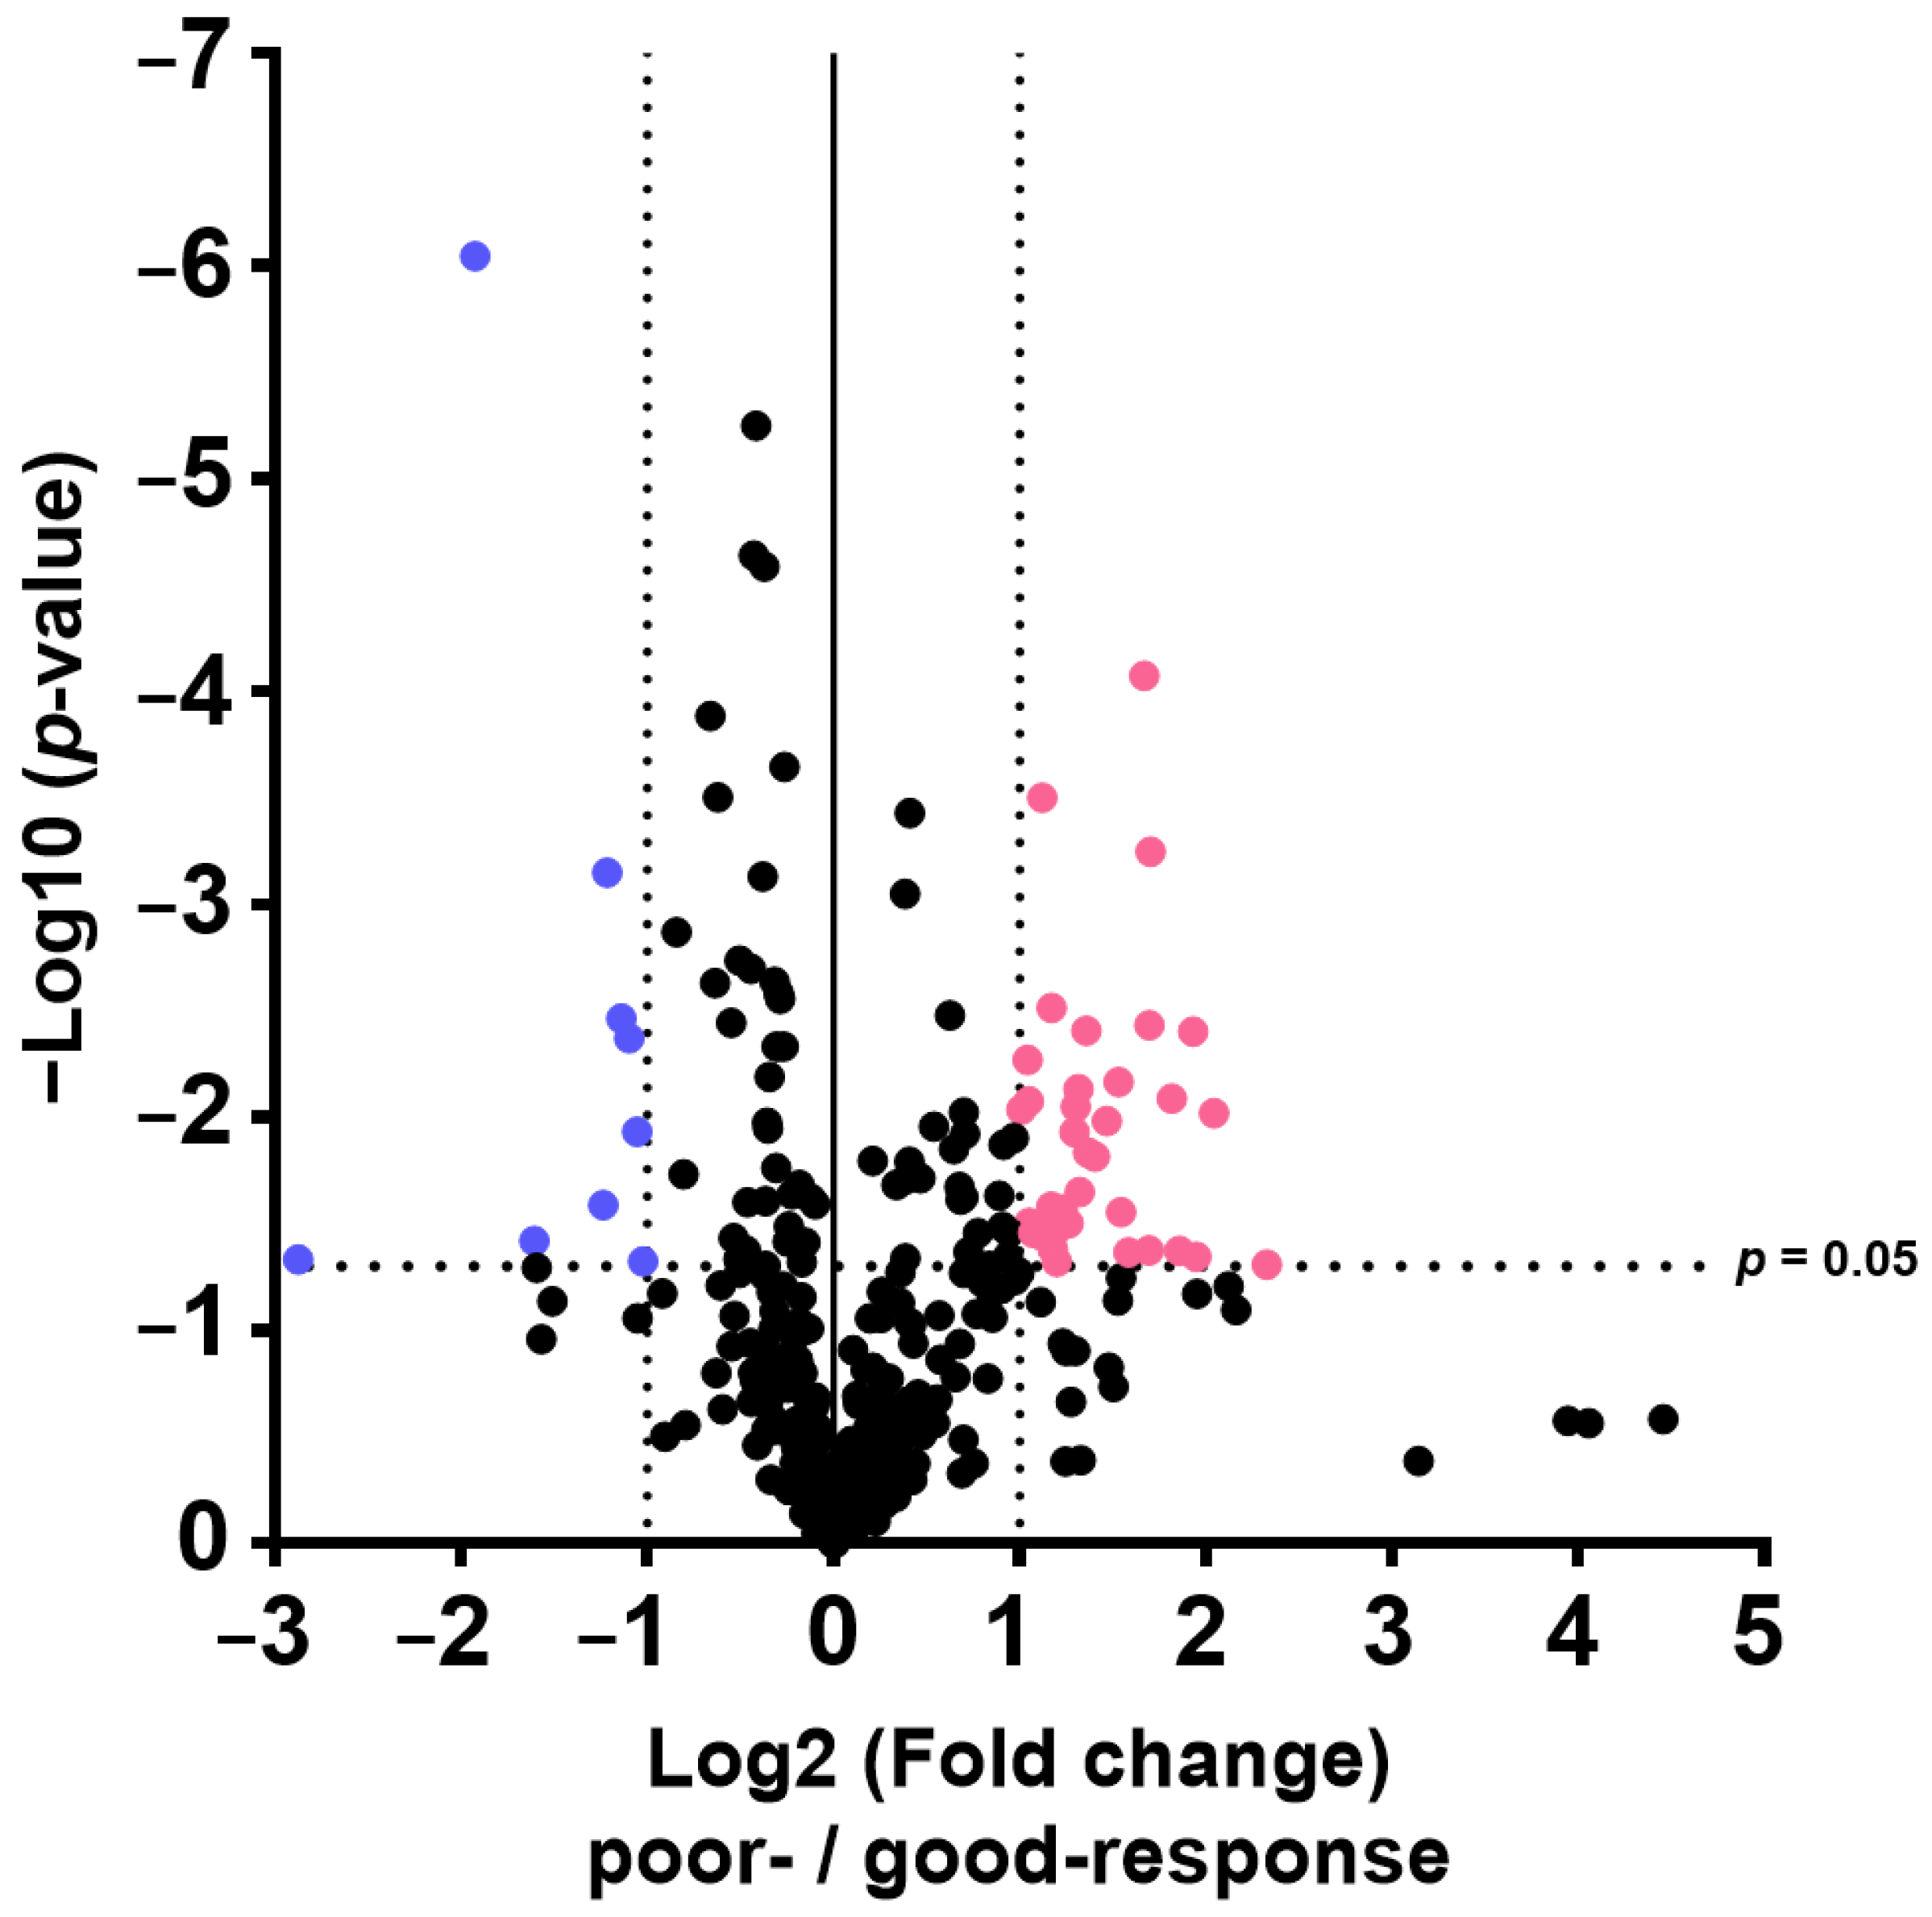
The results of this study also indicate that plasma metabolome and proteome analysis would help reveal the mechanisms of chemoresistance or identify vulnerabilities of recurrent EOC. We demonstrated that the 14 metabolite and 46 protein indicators were significantly altered in response to chemotherapy in patients with EOC, after excluding highly abundant proteins using the MxP® Quant 500 and iST-BCT kits combined with abundant protein depletion columns.
Metabolomic reprogramming in cancer cells, including enhancement of glycolysis in ovarian cancer cells, is well known. Enhanced glycolysis in cancer cells is known as the Warburg effect, discovered in the 1920s, and is considered beneficial for proliferation, invasion, metastasis, and chemotherapy resistance by providing by-products from the glycolytic pathway [35,
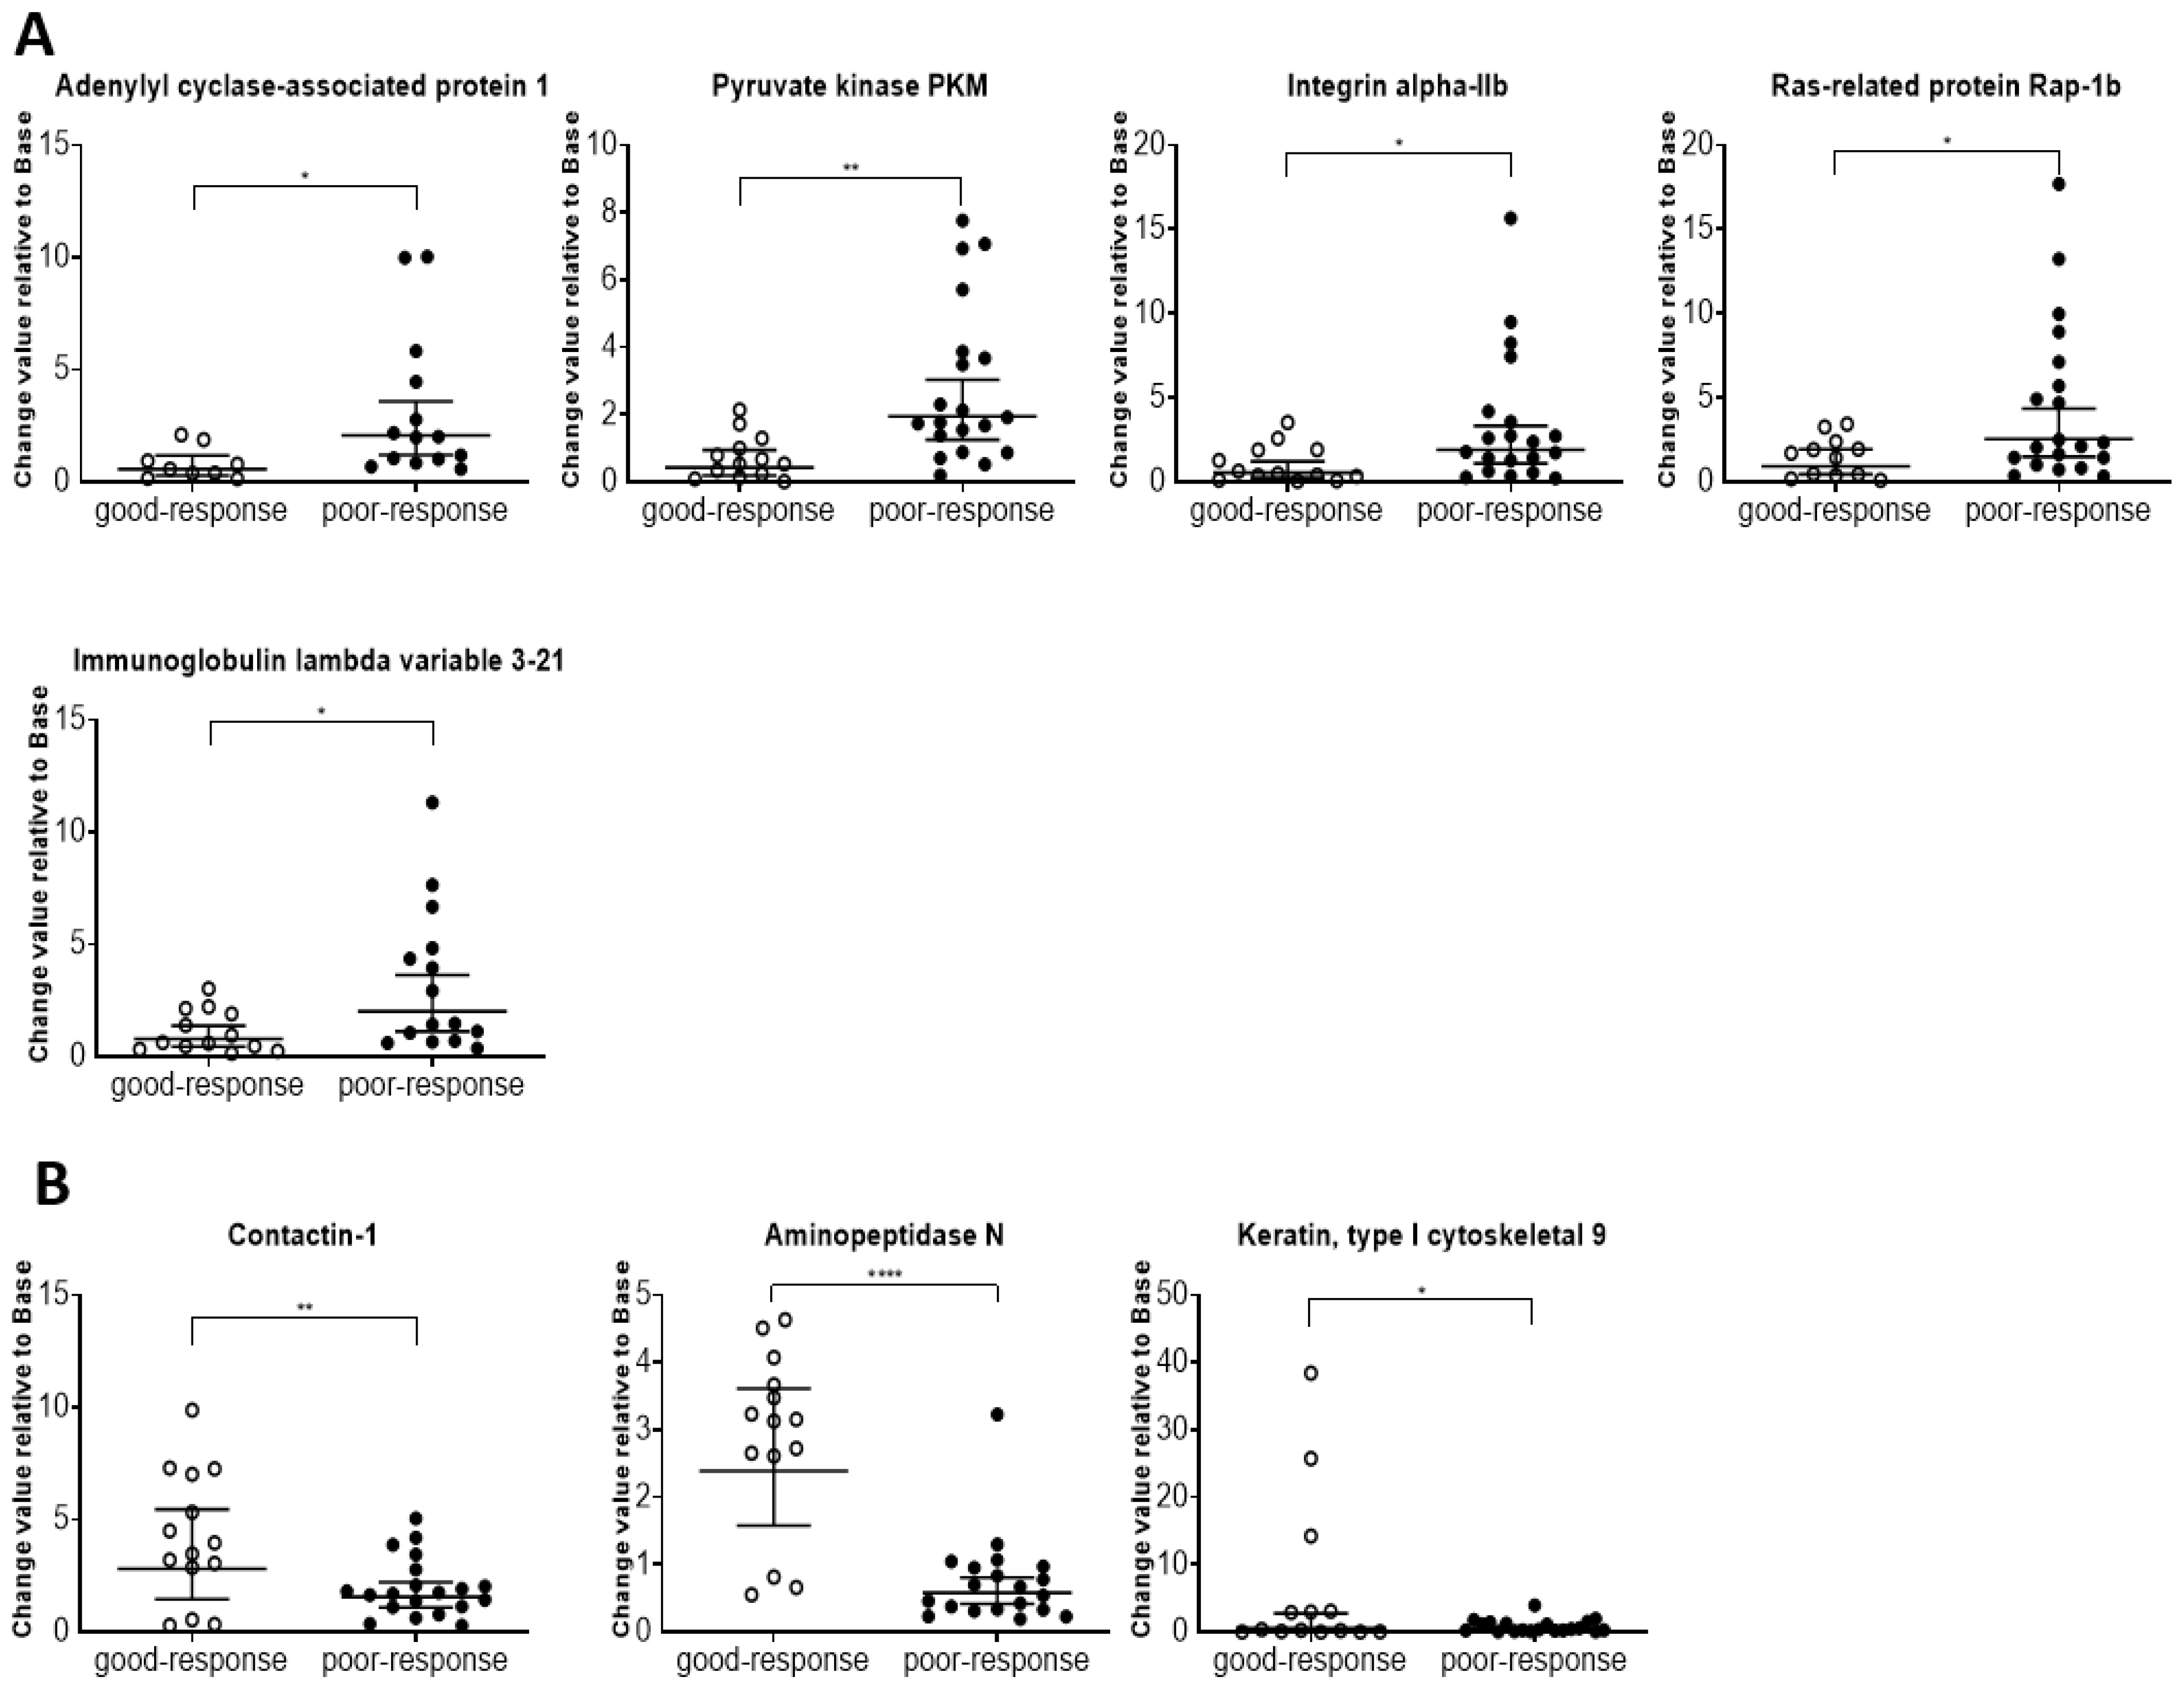
36]. Consistently, our study indicated that the activities of phosphoglycerate kinase 1, pyruvate kinase PKM, glyceraldehyde-3-phosphate dehydrogenase, alpha-enolase, and lactate dehydrogenase were higher in the poor-response group than in the good-response group. In addition, the facilitation of polyamine synthesis in cancer cells is known as metabolic reprogramming. High levels of polyamines in tumor cells have been reported to be caused by dysregulated metabolism and increased uptake from the extracellular environment [37,38,39,40,41]. The upregulation of MYC expression observed in many cancer cells induces ornithine decarboxylase expression, which enhances polyamine synthesis [38,42,43]. Our results also showed high levels of polyamines, including putrescin, which is consistent with previous reports. Thus, these results suggest that the enhancement of glycolysis and elevated polyamine levels in the plasma reflect the rapid proliferation of cancer cells, indicating poor response to chemotherapy. Serotonin, a neurotransmitter, is mitogenic in ovarian cancer [44]. Nocito et al. reported that angiogenesis is induced by a decrease in the production of circulating angiostatin caused by the reduction in matrix metallopeptidase 12 (MMP-12) expression in tumor-associated macrophages at the early stages of tumor development [45]. Furthermore, peripheral serotonin eventually leads to cancer cell growth by suppressing the growth and function of tumor-associated CD8+ T cells and promoting PD-L1 expression in tumor cells in the tumor microenvironment [46]. Growth of ovarian cancer cell lines was suppressed by treatment with a serotonin antagonist [47]. In line with all these findings, our results suggest that high plasma serotonin levels induce cancer cell proliferation and indicate a poor response to chemotherapy.
Triglycerides, the principal energy source in the human body, are reserved in adipocytes and peripheral tissues [48]. We previously indicated that the level of triglycerides in the plasma of patients with EOC was higher than that in healthy controls [26]. Additionally, the uncontrolled proliferation of cancer cells necessitates a substantial quantity of lipids to form the cell membranes and organelles of daughter cells [49]. Therefore, in poor-response samples, higher levels of saturated triglycerides compared with those in good-response samples were considered to support the findings of previous studies. For acylcarnitines known to be related to fatty acid metabolism, the sum of monosaturated fatty acid acylcarnitine and the ratio of valerylcarnitine to propionylcarnitine were significantly different between the poor- and good-responders in this study. These changes in the ratio of carnitines resulted in low levels of valerylcarnitine and high levels of propionylcarnitine in the poor-response cases. Huang et al. reported a higher propionylcarnitine level in plasma of patients with ovarian cancer than that in healthy controls [50]. Additionally, carnitine palmitoyltransferase 1A (CPT1A), which is a rate-limiting enzyme of fatty acid β-oxidation, was upregulated in ovarian cancer cells [51]. Thus, this alteration of carnitine species in the poor-responders group is likely a part of lipid remodeling in ovarian cancer cells.
PLA2 activity, which is an indicator of the hydrolysis of phosphatidylcholine (PC) aa C36:5 into lysophosphatidylcholine (LPC) a C16:1 and arachidonic acid, a polyunsaturated omega-6 fatty acid 20:4, was higher in the poor-response than that in good-response cases. In a previous study, PLA2 activity was upregulated in ovarian cancer compared with that in normal and benign tissues [52], and high and low levels of LPCs and PCs, respectively, were reported by Zhang et al. [53]. Our data also showed lower PC aa C36:5 and higher LPC a C16:1 levels. Additionally, arachidonic acid produced through PLA2 activity, which promotes the occurrence and development of tumors [54], has been reported to be higher in the plasma of patients with ovarian cancer than that in controls [55]. This suggests that increased PLA2 activity reflects tumor progression.
Our results showed that unconjugated bile acid levels were high in the plasma of patients with poor response. Unconjugated bile acids are products of primary bile acids produced by the gut microbiota [56]. Dysbiosis, known as oncobiosis, has been observed in the gut microbiota of patients with ovarian cancer, which induces resistance to chemotherapy [57,58]. In addition, the enterohepatic circulation of bile acids changes and resolution of bile acids is inhibited in patients with ovarian cancer [59]. Thus, this alteration in unconjugated bile acids indicates oncobiosis caused by ovarian cancer.
Regulators of telomere elongation helicase 1 (RTEL1) are of high interest because RTEL1 is related to the telomere region, which contributes to cancer cell proliferation. RTEL1 induces both deficiency and overexpression, leading to instability of the genome and triggering oncogenic transformations [60]. The metabolism of angiotensinogen to angiotensins found in the enrichment analysis involved nine low-level proteins that were considered to be related to cachexia caused by cancer [61]. Additionally, cancer disease pathways showed 37 proteins at high levels, including integrin beta-3, integrin alpha-IIb, vinculin, actin, cytoplasmic 1, Ras-related protein Rap-1b, and talin-1. Thus, these protein profiles seem to indicate the patient’s condition and have potential applications in chemotherapy management.
The sample size was a major limitation of the current study from the perspective of clinical application. It should also be noted that the transition of neither CA125, ctDNA, proteins, nor metabolomic indicators measured in this study perfectly corresponded to the clinical course of the seven patients, suggesting the importance of investigating combination markers for a more reliable liquid biopsy. In the future, it is also expected that the alterations in metabolites and proteins in the plasma shown in the present study will be verified in an in vitro experimental system. Based on the results of this pilot study, we integrated candidate profiles from metabolic and proteomic analyses, and were able to find the possibility of establishing a combination of highly sensitive and specific clinical monitoring markers for the early diagnosis of recurrence and the construction of disease monitoring markers for predicting treatment efficacy of EOC. To optimize and verify the plasma metabolic and proteomic profiles related to early diagnosis of recurrence and prediction of treatment efficacy, it is necessary to introduce innovative new technologies such as artificial intelligence and to strategically build up a series of step-by-step verifications.

4. Materials and Methods

4.1. Ethical Considerations

This study was approved by the internal review board of the Tohoku University School of Medicine (approval number: 2021-1-607).

4.2. Patient Enrollment

Patients who were being treated for recurrent disease, undergoing maintenance therapy, or on routine follow-up after primary or recurrent treatment at Tohoku University Hospital (Sendai, Japan) with a diagnosis of primary ovarian, fallopian tube, or peritoneal carcinoma were eligible for this study. The patients were enrolled between December 2021 and March 2022. After obtaining written informed consent, plasma was collected from patients at each visit or on day 1 of each chemotherapy cycle until the end of March 2023. Plasma was stored in the Tohoku University Clinical Biobank (TUCB) until metabolomic and proteomic analyses or liquid biopsy of ctDNA.

4.3. Clinical Information

Clinical information was extracted from clinical records and databases, including age at enrollment, International Federation of Gynecology and Obstetrics 2014 stage, histological subtype, and treatment history before enrollment [62]. Serum CA125 levels, treatment context, tumor response to treatment, and patient outcomes were monitored during the study period. Tumor response was evaluated in accordance with the criteria defined by Response Evaluation Criteria in Solid Tumors Version 1.1.

4.4. Chemical Reagents

The following reagents were purchased: pyridine (TCI, Tokyo, Japan), ethanol (Nacalai Tesque, Kyoto, Japan), methanol (Kanto Kagaku, Tokyo, Japan), phenyl isothiocyanate, formic acid, ammonium acetate (all from Wako Pure Chemical Industries, Osaka, Japan), and ammonium bicarbonate (Cell Science & Technology Institute, Inc., Miyagi, Japan), all of which were of the highest quality commercially available. Pooled healthy human plasma was purchased from Innovative Research (Lot No. 26393, Innovative Research, Novi, MI, USA) and aliquoted as the global quality control plasma sample.

4.5. Genomic Sequencing

DNA was extracted from the primary tumor specimen and blood cells of each patient were stored at TUCB. DNA was subjected to whole-exome sequencing (WES) or whole-genome sequencing (WGS) to identify somatic variants. WES was performed at the Tohoku University Advanced Research Center for Innovations in Next-Generation Medicine. WGS was obtained from Haplo Pharma, Inc. (Sendai, Japan). The sequencing data were mapped using bwa-mem 0.1.17. Somatic variant calls were made using the GATK Best Practice Workflow for Somatic short variant discovery. Pathogenic genomic variants in the tumors of each patient were determined using ClinVar, ToMMo 38KJPN, and snpEff [63,64,65].

4.6. ctDNA Measurement

ctDNA was quantified as previously described [17]. Briefly, the ctDNA was extracted from 10 mL of blood stored in PAX gene Blood ccf tubes (QIAGEN, Hilden, Germany) using the QIAamp Circulating Nucleic Acid Kit (QIAGEN). Based on the results of somatic gene alteration, the corresponding BIORAD Droplet digital PCR (ddPCR) mutation assay primers and probes were prepared for each patient. The ddPCR was performed using a QX200 AutoDG Droplet Digital PCR IVD System (Bio-Rad, Hercules, CA, USA) according to the manufacturer’s instructions. DNA extracted from primary tumor specimens was used as positive control in each case.

4.7. Sample Preparation for Metabolomics

Wide target metabolomics was performed using a MxP® Quant 500 kit (Biocrates Life Science AG, Innsbruck, Austria) with an ultra-performance liquid chromatograph (ACQUITY UPLC I-Class, Waters Corporation, Milford, MA, USA) connected to a triple quadrupole mass spectrometer (MS; Xevo TQ-XS, Waters Corporation) as previously described [66,67,68]. The blank solution (10 μL), calibration standard solutions, quality control solutions, and plasma samples were prepared and measured according to the MxP® Quant 500 kit manual. Metabolite concentrations were calculated from the exported raw files using MetIDQTM version Oxygen software (Biocrates Life Science AG).

4.8. Sample Preparation for Proteomics

Proteomics was performed using a previously reported method, with several modifications [69]. To remove the high-abundance proteins in the plasma samples, 10 μL of plasma sample was treated with the Pierce® Top 14 Abundant Protein Depletion Spin Columns Kit (Thermo Fisher Scientific, Waltham, MA, USA), and then the protein concentration was determined with a Pierce® BCA Protein Assay kit (Thermo Fisher Scientific) according to the manufacturer’s instructions. The plasma proteins obtained from the Top 14 kit were digested in solution using an iST-BCT kit (PreOmics GmbH, Planegg-Martinsried, Germany). Plasma protein (30 μg) was transferred to another tube redissolved in LYSE buffer after being vacuum-dried. To cleave disulfide bonds, reduction and alkylation were carried out for 10 min at 95 °C. The reduced and alkylated protein solutions were enzymatically digested by adding 50 μL of DIGEST solution for 3 h at 37 °C. After digestion, the sample peptides were purified using a cartridge and two types of WASH solutions. Purified peptides were vacuum-dried and resuspended in 60 μL of LOAD solution to reach a final protein concentration of 0.5 μg/μL.
The sample solutions were analyzed under the following instrument conditions: liquid chromatography–mass spectrometry analysis was performed using an EASY-nLC 1000 UPLC system (Thermo Fisher Scientific) and Orbitrap FusionTM TribridTM mass spectrometer (Thermo Fisher Scientific). The peptide sample (2 µL) was loaded in eluent A (0.1% FA) into a trap column (C18, 3 μm particle, 2 cm length, 75 μm ID, Acclaim PepMap 100; Thermo Fisher Scientific) and separated using a reverse-phase analytical column (Nano HPLC CAPILLARY COLUMN, 75 μm × 12.5 cm, 3 μm, ODS; Nikkyo Technos, Co., Ltd., Tokyo, Japan) on a Nanospray Flex Ion Source system (Thermo Fisher Scientific). The 1 μg of peptide was separated using a gradient program for 60 min with eluents A and B (0.1% FA in 80% acetonitrile) at a constant flow rate of 300 nL/min. The gradient program was set as follows: an initial elution with 5% B for 1 min, a gradient to 40% B for 61 min, a climbing period of 95% for 63 min, and a holding period of 95% for 80 min. To detect peptides ionized by electrospray voltage at 2.0 kV, primary MS was performed using an Orbitrap at 60,000 mass resolution in the scan range of 375–1600 m/z. The automatic gain control (AGC) was set to 4 × 10⁶, and the maximum injection time (MIT) was set to 50 ms. The maximum intensity threshold was set to 1 × 10²⁰ and the dynamic exclusion duration was set to 20 s to prevent the precursor ions from being repeatedly scanned. Data were collected in data-dependent acquisition mode. Secondary MS was performed using a quadrupole at a 0.7 isolation window. Activation was induced using collision dissociation at 35% collision energy for 10 ms in the fixed collision energy mode. The detector used an ion trap with an MIT of 35 ms and a target AGC value of 1 × 10⁵. The third MS was conducted using a quadrupole with an isolation window of 0.7 and HCD activation at a 55% collision energy in the fixed collision energy mode. The detector used an Orbitrap at 50,000 mass resolution in the scanning range of 100–500 m/z. The AGC was set to 15 × 104, and the MIT was set to 86 ms.

4.9. Statistical Analysis

Proteome and metabolome data analyses were performed using GraphPad Prism 8 software (GraphPad Software Inc., San Diego, CA, USA) for volcano plot analysis and boxplot drawing. The PCA, orthogonal partial least squares discriminant analysis, and variable importance for projection were performed using SIMCA software Version 13.0.3 (Sartorius, San Francisco, CA, USA). p-values were calculated using Wilcoxon rank sum test. Differences with p < 0.05 were considered statistically significant.

5. Conclusions

This pilot study clarified the potential of the assessment of metabolic and proteomic analysis as a useful tool for developing novel monitoring biomarkers for patients with recurrent EOC. Further studies are warranted to apply these techniques for the detection of early disease recurrence or the prediction of efficacy of therapeutic interventions in clinical practice.

Supplementary Materials

The supporting information can be downloaded at https://www.mdpi.com/article/10.3390/ijms26125435/s1.

Author Contributions

Conceptualization: E.H., S.S., and M.S.; Methodology: E.H., N.M., Y.O., and T.M.; Formal analysis and Investigation: E.H., S.S., N.M., Y.O., I.N.M., T.M., Y.S., J.Y., and M.S.; Data Curation: E.H., S.S., N.M., and I.N.M.; Writing—Original Draft: E.H., S.S., N.M., and M.S.; Writing—Review and Editing: E.H., S.S., and M.S.; Supervision: K.K., S.K., and M.S.; Funding Acquisition: E.H., S.S., J.Y., K.K., S.K., and M.S. All authors have read and agreed to the published version of the manuscript.

Funding

This research was funded by the Tohoku Medical Megabank Project (Tohoku University) of the MEXT and the Japan Agency for Medical Research and Development (AMED; grant number JP21tm0124005); sharing and administrative network for research equipment (MEXT); the Research Support Project for Life Science and Drug Discovery (Basis for Supporting Innovative Drug Discovery and Life Science Research (BINDS)) from AMED (grant numbers JP24ama121019 and JP24ama121038); and the Japan Society for the Promotion of Science (JSPS) KAKENHI (grant numbers 20K18211, 23K06688, and JP22H03219). This research was supported in part by INGEM grant.

Institutional Review Board Statement

The study was conducted in accordance with the Declaration of Helsinki and approved by the Institutional Review Board of the Tohoku University School of Medicine (approval number: 2021-1-607).

Informed Consent Statement

Informed consent was obtained from all subjects involved in the study.

Data Availability Statement

The data that support the findings of this study are available on request from the corresponding author. The data are not publicly available due to privacy or ethical restrictions. In addition, the data about identifiable human research participants cannot be openly shared.

Acknowledgments

The authors would like to thank Naoko Hashimoto for supporting the ctDNA measurements. The authors would also like to thank all the participants in this study.

Conflicts of Interest

The authors declare no conflicts of interest.

Abbreviations

The following abbreviations are used in this manuscript:
AGCautomatic gain control
CTclinical trial
ctDNAcirculating tumor DNA
DCdocetaxel plus carboplatin
EOCepithelial ovarian cancer
Gemgemcitabine
MITmaximum injection time
MSmass spectrometry
Nirniraparib
NOGnogitecan
NOGBevnogitecan plus bevacizumab
Olaolaparib
PCAprincipal component analysis
PLDBevpegylated liposomal doxorubicin plus bevacizumab
TCpaclitaxel plus carboplatin
WESwhole-exome sequencing
WGSwhole-genome sequencing
wTBevweekly paclitaxel plus bevacizumab

References

  1. González-Martín, A.; Harter, P.; Leary, A.; Lorusso, D.; Miller, R.E.; Pothuri, B.; Ray-Coquard, I.; Tan, D.S.P.; Bellet, E.; Oaknin, A.; et al. Newly Diagnosed and Relapsed Epithelial Ovarian Cancer: ESMO Clinical Practice Guideline for Diagnosis, Treatment and Follow-up. Ann. Oncol. 2023, 34, 833–848. [Google Scholar] [CrossRef] [PubMed]
  2. Burger, R.A.; Brady, M.F.; Bookman, M.A.; Fleming, G.F.; Monk, B.J.; Huang, H.; Mannel, R.S.; Homesley, H.D.; Fowler, J.; Greer, B.E.; et al. Incorporation of Bevacizumab in the Primary Treatment of Ovarian Cancer. N. Engl. J. Med. 2011, 365, 2473–2483. [Google Scholar] [CrossRef]
  3. González-Martín, A.; Pothuri, B.; Vergote, I.; DePont Christensen, R.; Graybill, W.; Mirza, M.R.; McCormick, C.; Lorusso, D.; Hoskins, P.; Freyer, G.; et al. Niraparib in Patients with Newly Diagnosed Advanced Ovarian Cancer. N. Engl. J. Med. 2019, 381, 2391–2402. [Google Scholar] [CrossRef] [PubMed]
  4. Moore, K.; Colombo, N.; Scambia, G.; Kim, B.G.; Oaknin, A.; Friedlander, M.; Lisyanskaya, A.; Floquet, A.; Leary, A.; Sonke, G.S.; et al. Maintenance Olaparib in Patients with Newly Diagnosed Advanced Ovarian Cancer. N. Engl. J. Med. 2018, 379, 2495–2505. [Google Scholar] [CrossRef]
  5. Perren, T.J.; Swart, A.M.; Pfisterer, J.; Ledermann, J.A.; Pujade-Lauraine, E.; Kristensen, G.; Carey, M.S.; Beale, P.; Cervantes, A.; Kurzeder, C.; et al. A Phase 3 Trial of Bevacizumab in Ovarian Cancer. N. Engl. J. Med. 2011, 365, 2484–2496. [Google Scholar] [CrossRef]
  6. Ray-Coquard, I.; Leary, A.; Pignata, S.; Cropet, C.; González-Martín, A.; Marth, C.; Nagao, S.; Vergote, I.; Colombo, N.; Mäenpää, J.; et al. Olaparib Plus Bevacizumab as First-Line Maintenance in Ovarian Cancer. N. Engl. J. Med. 2019, 381, 2416–2428. [Google Scholar] [CrossRef] [PubMed]
  7. Bast, R.C., Jr.; Klug, T.L.; St John, E.; Jenison, E.; Niloff, J.M.; Lazarus, H.; Berkowitz, R.S.; Leavitt, T.; Griffiths, C.T.; Parker, L.; et al. A Radioimmunoassay using a Monoclonal Antibody to Monitor the Course of Epithelial Ovarian Cancer. N. Engl. J. Med. 1983, 309, 883–887. [Google Scholar] [CrossRef]
  8. Einhorn, N.; Sjövall, K.; Knapp, R.C.; Hall, P.; Scully, R.E.; Bast, R.C., Jr.; Zurawski, V.R., Jr. Prospective Evaluation of Serum CA 125 Levels for Early Detection of Ovarian Cancer. Obstet. Gynecol. 1992, 80, 14–18. [Google Scholar] [CrossRef]
  9. Rustin, G.J.; Nelstrop, A.E.; Tuxen, M.K.; Lambert, H.E. Defining Progression of Ovarian Carcinoma During Follow-Up According to CA 125: A North Thames Ovary Group Study. Ann. Oncol. 1996, 7, 361–364. [Google Scholar] [CrossRef]
  10. National Comprehensive Cancer Network. Ovarian Cancer Including Fallopian Tube Cancer and Primary Peritoneal Cancer (Version 3). Available online: https://www.nccn.org/guidelines/category_1 (accessed on 7 December 2024).
  11. Moss, E.L.; Hollingworth, J.; Reynolds, T.M. The Role of CA125 in Clinical Practice. J. Clin. Pathol. 2005, 58, 308–312. [Google Scholar] [CrossRef]
  12. Tjokrowidjaja, A.; Friedlander, M.L.; Ledermann, J.A.; Coleman, R.L.; Mirza, M.R.; Matulonis, U.A.; Pujade-Lauraine, E.; Lord, S.J.; Scott, C.L.; Goble, S.; et al. Poor Concordance Between Cancer Antigen-125 and RECIST Assessment for Progression in Patients with Platinum-Sensitive Relapsed Ovarian Cancer On Maintenance Therapy with a Poly(ADP-ribose) Polymerase Inhibitor. J. Clin. Oncol. 2024, 42, 1301–1310. [Google Scholar] [CrossRef]
  13. Zebic, D.S.; Tjokrowidjaja, A.; Francis, K.E.; Friedlander, M.; Gebski, V.; Lortholary, A.; Joly, F.; Hasenburg, A.; Mirza, M.; Denison, U.; et al. Discordance between GCIG CA-125 Progression and RECIST Progression in the CALYPSO Trial of Patients with Platinum-Sensitive Recurrent Ovarian Cancer. Br. J. Cancer 2024, 130, 425–433. [Google Scholar] [CrossRef]
  14. Tuxen, M.K.; Sölétormos, G.; Dombernowsky, P. Tumor Markers in the Management of Patients with Ovarian Cancer. Cancer Treat. Rev. 1995, 21, 215–245. [Google Scholar] [CrossRef]
  15. Alix-Panabières, C.; Pantel, K. Liquid Biopsy: From Discovery to Clinical Application. Cancer Discov. 2021, 11, 858–873. [Google Scholar] [CrossRef]
  16. Lone, S.N.; Nisar, S.; Masoodi, T.; Singh, M.; Rizwan, A.; Hashem, S.; El-Rifai, W.; Bedognetti, D.; Batra, S.K.; Haris, M.; et al. Liquid biopsy, a step closer to transform diagnosis, prognosis and future of cancer treatments. Mol. Cancer 2022, 21, 79. [Google Scholar] [CrossRef]
  17. Minato, T.; Ito, S.; Li, B.; Fujimori, H.; Mochizuki, M.; Yamaguchi, K.; Tamai, K.; Shimada, M.; Tokunaga, H.; Shigeta, S.; et al. Liquid Biopsy with Droplet Digital PCR Targeted To Specific Mutations in Plasma Cell-Free Tumor DNA can Detect Ovarian Cancer Recurrence Earlier than CA125. Gynecol. Oncol. Rep. 2021, 38, 100847. [Google Scholar] [CrossRef] [PubMed]
  18. Parkinson, C.A.; Gale, D.; Piskorz, A.M.; Biggs, H.; Hodgkin, C.; Addley, H.; Freeman, S.; Moyle, P.; Sala, E.; Sayal, K.; et al. Exploratory Analysis of TP53 Mutations in Circulating Tumour DNA as Biomarkers of Treatment Response for Patients with Relapsed High-Grade Serous Ovarian Carcinoma: A Retrospective Study. PLoS Med. 2016, 13, e1002198. [Google Scholar] [CrossRef]
  19. Zhu, J.W.; Charkhchi, P.; Akbari, M.R. Potential Clinical Utility of Liquid Biopsies in Ovarian Cancer. Mol. Cancer 2022, 21, 114. [Google Scholar] [CrossRef] [PubMed]
  20. Ahn, H.S.; Yeom, J.; Yu, J.; Kwon, Y.I.; Kim, J.H.; Kim, K. Convergence of Plasma Metabolomics and Proteomics Analysis to Discover Signatures of High-Grade Serous Ovarian Cancer. Cancers 2020, 12, 3447. [Google Scholar] [CrossRef]
  21. Bhawal, R.; Oberg, A.L.; Zhang, S.; Kohli, M. Challenges and Opportunities in Clinical Applications of Blood-Based Proteomics in Cancer. Cancers 2020, 12, 2428. [Google Scholar] [CrossRef] [PubMed]
  22. Wang, W.; Rong, Z.; Wang, G.; Hou, Y.; Yang, F.; Qiu, M. Cancer Metabolites: Promising Biomarkers for Cancer Liquid Biopsy. Biomark. Res. 2023, 11, 66. [Google Scholar] [CrossRef] [PubMed]
  23. Danzi, F.; Pacchiana, R.; Mafficini, A.; Scupoli, M.T.; Scarpa, A.; Donadelli, M.; Fiore, A. To Metabolomics and Beyond: A Technological Portfolio to Investigate Cancer Metabolism. Signal Transduct. Target. Ther. 2023, 8, 137. [Google Scholar] [CrossRef] [PubMed]
  24. Gerszten, R.E.; Accurso, F.; Bernard, G.R.; Caprioli, R.M.; Klee, E.W.; Klee, G.G.; Kullo, I.; Laguna, T.A.; Roth, F.P.; Sabatine, M.; et al. Challenges in Translating Plasma Proteomics from Bench to Bedside: Update from the NHLBI Clinical Proteomics Programs. Am. J. Physiol. Lung Cell. Mol. Physiol. 2008, 295, L16–L22. [Google Scholar] [CrossRef]
  25. Hishinuma, E.; Shimada, M.; Matsukawa, N.; Li, B.; Motoike, I.N.; Hagihara, T.; Shigeta, S.; Tokunaga, H.; Saigusa, D.; Kinoshita, K.; et al. Identification of Predictive Biomarkers for Diagnosis and Radiation Sensitivity of Uterine Cervical Cancer using Wide-Targeted Metabolomics. J. Obstet. Gynaecol. Res. 2023, 49, 2109–2117. [Google Scholar] [CrossRef]
  26. Hishinuma, E.; Shimada, M.; Matsukawa, N.; Saigusa, D.; Li, B.; Kudo, K.; Tsuji, K.; Shigeta, S.; Tokunaga, H.; Kumada, K.; et al. Wide-targeted Metabolome Analysis Identifies Potential Biomarkers for Prognosis Prediction of Epithelial Ovarian Cancer. Toxins 2021, 13, 461. [Google Scholar] [CrossRef]
  27. Hishinuma, E.; Shimada, M.; Matsukawa, N.; Shima, Y.; Li, B.; Motoike, I.N.; Shibuya, Y.; Hagihara, T.; Shigeta, S.; Tokunaga, H.; et al. Identification of Predictive Biomarkers for Endometrial Cancer Diagnosis and Treatment Response Monitoring using Plasma Metabolome Profiling. Cancer Metab. 2023, 11, 16. [Google Scholar] [CrossRef] [PubMed]
  28. Narita, D.; Hishinuma, E.; Ebina-Shibuya, R.; Miyauchi, E.; Matsukawa, N.; Motoike, I.N.; Kinoshita, K.; Koshiba, S.; Tsukita, Y.; Notsuda, H.; et al. Histological and Genetic Features and Therapeutic Responses of Lung Cancers Explored via the Global Analysis of their Metabolome Profile. Lung Cancer 2025, 200, 108082. [Google Scholar] [CrossRef]
  29. Budnik, B.; Amirkhani, H.; Forouzanfar, M.H.; Afshin, A. Novel Proteomics-Based Plasma Test for Early Detection of Multiple Cancers in the General Population. BMJ Oncol. 2024, 3, e000073. [Google Scholar] [CrossRef]
  30. Geyer, P.E.; Holdt, L.M.; Teupser, D.; Mann, M. Revisiting Biomarker Discovery by Plasma Proteomics. Mol. Syst. Biol. 2017, 13, 942. [Google Scholar] [CrossRef]
  31. Kotani, D.; Oki, E.; Nakamura, Y.; Yukami, H.; Mishima, S.; Bando, H.; Shirasu, H.; Yamazaki, K.; Watanabe, J.; Kotaka, M.; et al. Molecular Residual Disease and Efficacy of Adjuvant Chemotherapy in Patients with Colorectal Cancer. Nat. Med. 2023, 29, 127–134. [Google Scholar] [CrossRef]
  32. Tie, J.; Cohen, J.D.; Lahouel, K.; Lo, S.N.; Wang, Y.; Kosmider, S.; Wong, R.; Shapiro, J.; Lee, M.; Harris, S.; et al. Circulating Tumor DNA Analysis Guiding Adjuvant Therapy in Stage II Colon Cancer. N. Engl. J. Med. 2022, 386, 2261–2272. [Google Scholar] [CrossRef] [PubMed]
  33. Shirasu, H.; Taniguchi, H.; Matsuhashi, N.; Kotaka, M.; Nakamura, Y.; Oki, E.; Miyamoto, Y.; Masuishi, T.; Komatsu, Y.; Teraishi, F.; et al. A Randomized, Double-Blind, Phase III Study Comparing Trifluridine/Tipiracil Hydrochloride Therapy Versus Placebo in Resected Colorectal Cancer Patients Who are Positive for Blood Circulating Tumor DNA after Standard Adjuvant Therapy (EPOC 1905): ALTAIR trial in CIRCULATE-Japan (trial in progress). J. Clin. Oncol. 2022, 40, TPS215. [Google Scholar] [CrossRef]
  34. Rustin, G.J.; van der Burg, M.E.; Griffin, C.L.; Guthrie, D.; Lamont, A.; Jayson, G.C.; Kristensen, G.; Mediola, C.; Coens, C.; Qian, W.; et al. Early Versus Delayed Treatment of relapsed Ovarian Cancer (MRC OV05/EORTC 55955): A Randomised Trial. Lancet 2010, 376, 1155–1163. [Google Scholar] [CrossRef] [PubMed]
  35. Ocaña, M.C.; Martínez-Poveda, B.; Quesada, A.R.; Medina, M.Á. Metabolism within the Tumor Microenvironment and its Implication on Cancer Progression: An Ongoing Therapeutic Target. Med. Res. Rev. 2019, 39, 70–113. [Google Scholar] [CrossRef]
  36. Sun, L.; Suo, C.; Li, S.T.; Zhang, H.; Gao, P. Metabolic Reprogramming for Cancer Cells and their Microenvironment: Beyond the Warburg Effect. Biochim. Biophys. Acta Rev. Cancer. 2018, 1870, 51–66. [Google Scholar] [CrossRef]
  37. Bae, D.H.; Lane, D.J.R.; Jansson, P.J.; Richardson, D.R. The Old and New Biochemistry of Polyamines. Biochim. Biophys. Acta Gen. Subj. 2018, 1862, 2053–2068. [Google Scholar] [CrossRef] [PubMed]
  38. Casero, R.A., Jr.; Murray Stewart, T.; Pegg, A. Polyamine Metabolism and Cancer: Treatments, Challenges and Opportunities. Nat. Rev. Cancer 2018, 18, 681–695. [Google Scholar] [CrossRef]
  39. Casero, R.A.; Pegg, A.E. Polyamine Catabolism and Disease. Biochem. J. 2009, 421, 323–338. [Google Scholar] [CrossRef]
  40. Fahrmann, J.F.; Irajizad, E.; Kobayashi, M.; Vykoukal, J.; Dennison, J.B.; Murage, E.; Wu, R.; Long, J.P.; Do, K.A.; Celestino, J.; et al. A MYC-Driven Plasma Polyamine Signature for Early Detection of Ovarian Cancer. Cancers 2021, 13, 913. [Google Scholar] [CrossRef]
  41. Igarashi, K.; Kashiwagi, K. The Functional Role of Polyamines in Eukaryotic Cells. Int. J. Biochem. Cell Biol. 2019, 107, 104–115. [Google Scholar] [CrossRef]
  42. Bachmann, A.S.; Geerts, D. Polyamine Synthesis as a Target of MYC Oncogenes. Int. J. Biochem. Cell Biol. 2018, 293, 18757–18769. [Google Scholar] [CrossRef] [PubMed]
  43. Bello-Fernandez, C.; Packham, G.; Cleveland, J.L. The Ornithine Decarboxylase Gene is a Transcriptional Target of c-Myc. Proc. Natl. Acad. Sci. USA 1993, 90, 7804–7808. [Google Scholar] [CrossRef]
  44. Christensen, D.K.; Armaiz-Pena, G.N.; Ramirez, E.; Matsuo, K.; Zimmerman, B.; Zand, B.; Shinn, E.; Goodheart, M.J.; Bender, D.; Thaker, P.H.; et al. SSRI Use and Clinical Outcomes in Epithelial Ovarian Cancer. Oncotarget 2016, 7, 33179–33191. [Google Scholar] [CrossRef]
  45. Nocito, A.; Dahm, F.; Jochum, W.; Jang, J.H.; Georgiev, P.; Bader, M.; Graf, R.; Clavien, P.A. Serotonin Regulates Macrophage-Mediated Angiogenesis in a Mouse Model of Colon Cancer Allografts. Cancer Res. 2008, 68, 5152–5158. [Google Scholar] [CrossRef] [PubMed]
  46. Schneider, M.A.; Heeb, L.; Beffinger, M.M.; Pantelyushin, S.; Linecker, M.; Roth, L.; Lehmann, K.; Ungethüm, U.; Kobold, S.; Graf, R.; et al. Attenuation of Peripheral Serotonin Inhibits Tumor Growth and Enhances Immune Checkpoint Blockade Therapy in Murine Tumor Models. Sci. Transl. Med. 2021, 13, eabc8188. [Google Scholar] [CrossRef]
  47. Lee, J.Y.; Yang, C.; Lim, W.; Song, G. Methiothepin Suppresses Human Ovarian Cancer Cell Growth by Repressing Mitochondrion-Mediated Metabolism and Inhibiting Angiogenesis In Vivo. Pharmaceutics 2020, 12, 686. [Google Scholar] [CrossRef] [PubMed]
  48. Al-Sulaiti, H.; Diboun, I.; Banu, S.; Al-Emadi, M.; Amani, P.; Harvey, T.M.; Dömling, A.S.; Latiff, A.; Elrayess, M.A. Triglyceride Profiling in Adipose Tissues From Obese Insulin Sensitive, Insulin Resistant and Type 2 Diabetes Mellitus Individuals. J. Transl. Med. 2018, 16, 175. [Google Scholar] [CrossRef]
  49. Corn, K.C.; Windham, M.A.; Rafat, M. Lipids in the Tumor Microenvironment: From Cancer Progression to Treatment. Prog. Lipid Res. 2020, 80, 101055. [Google Scholar] [CrossRef]
  50. Huang, Y.; Lin, W.; Zheng, X. Causal Association between 637 Human Metabolites and Ovarian Cancer: A Mendelian Randomization Study. BMC Genom. 2024, 25, 97. [Google Scholar] [CrossRef]
  51. Shao, H.; Mohamed, E.M.; Xu, G.G.; Waters, M.; Jing, K.; Ma, Y.; Zhang, Y.; Spiegel, S.; Idowu, M.O.; Fang, X. Carnitine Palmitoyltransferase 1A Functions to Repress FoxO Transcription Factors to Allow Cell Cycle Progression in Ovarian Cancer. Oncotarget 2016, 7, 3832–3846. [Google Scholar] [CrossRef]
  52. Cai, Q.; Zhao, Z.; Antalis, C.; Yan, L.; Del Priore, G.; Hamed, A.H.; Stehman, F.B.; Schilder, J.M.; Xu, Y. Elevated and Secreted Phospholipase A2 Activities as New Potential Therapeutic Targets in Human Epithelial Ovarian Cancer. FASEB J. 2012, 26, 3306–3320. [Google Scholar] [CrossRef] [PubMed]
  53. Zhang, Y.; Liu, Y.; Li, L.; Wei, J.; Xiong, S.; Zhao, Z. High Resolution Mass Spectrometry Coupled with Multivariate Data Analysis Revealing Plasma Lipidomic Alteration in Ovarian Cancer in Asian Women. Talanta 2016, 150, 88–96. [Google Scholar] [CrossRef]
  54. Xia, Q.; Gao, W.; Yang, J.; Xing, Z.; Ji, Z. The Deregulation of Arachidonic Acid Metabolism in Ovarian Cancer. Front. Oncol. 2024, 14, 1381894. [Google Scholar] [CrossRef] [PubMed]
  55. Zhong, X.; Ran, R.; Gao, S.; Shi, M.; Shi, X.; Long, F.; Zhou, Y.; Yang, Y.; Tang, X.; Lin, A.; et al. Complex Metabolic Interactions between Ovary, Plasma, Urine, and Hair in Ovarian Cancer. Front. Oncol. 2022, 12, 916375. [Google Scholar] [CrossRef]
  56. Zhang, M.; Li, H.; Tan, T.; Lu, L.; Mi, J.; Rehman, A.; Yan, Y.; Ran, L. Anthocyanins from Lycium ruthenicum Murray Attenuates High-Fat Diet-Induced Hypercholesterolemia in ApoE(-/-) Mice are Related to the Modulation of Gut Microbiota and the Ratio of Conjugated to Unconjugated Bile Acids in Fecal Bile Acid Profile. Food Sci. Nutr. 2024, 12, 2379–2392. [Google Scholar] [CrossRef]
  57. Chambers, L.M.; Esakov Rhoades, E.L.; Bharti, R.; Braley, C.; Tewari, S.; Trestan, L.; Alali, Z.; Bayik, D.; Lathia, J.D.; Sangwan, N.; et al. Disruption of the Gut Microbiota Confers Cisplatin Resistance in Epithelial Ovarian Cancer. Cancer Res. 2022, 82, 4654–4669. [Google Scholar] [CrossRef]
  58. Sipos, A.; Ujlaki, G.; Mikó, E.; Maka, E.; Szabó, J.; Uray, K.; Krasznai, Z.; Bai, P. The Role of the Microbiome in Ovarian Cancer: Mechanistic Insights into Oncobiosis and to Bacterial Metabolite Signaling. Mol. Med. 2021, 27, 33. [Google Scholar] [CrossRef] [PubMed]
  59. Larsen, H.M.; Borre, M.; Christensen, P.; Mohr Drewes, A.; Laurberg, S.; Krogh, K.; Fassov, J. Clinical Evaluation and Treatment of Chronic Bowel Symptoms following Cancer in the Colon and Pelvic Organs. Acta Oncol. 2019, 58, 776–781. [Google Scholar] [CrossRef]
  60. Wang, G.; Ren, X.; Li, J.; Cui, R.; Zhao, X.; Sui, F.; Liu, J.; Chwn, P.; Yang, Q.; Ji, M.; et al. High Expression of RTEL1 Predicates Worse Progression in Gliomas and Promotes Tumorigenesis through JNK/ELK1 Cascade. BMC Cancer 2024, 24, 385. [Google Scholar] [CrossRef]
  61. Saha, S.; Singh, P.K.; Roy, P.; Kakar, S.S. Cardiac Cachexia: Unaddressed Aspect in Cancer Patients. Cells 2022, 11, 990. [Google Scholar] [CrossRef]
  62. Prat, J.; FIGO Committee on Gynecologic Oncology. Staging Classification for Cancer of the Ovary, Fallopian Tube, and Peritoneum. Int. J. Gynaecol. Obstet. 2014, 124, 1–5. [Google Scholar] [CrossRef] [PubMed]
  63. Cingolani, P.; Platts, A.; Wang, L.L.; Coon, M.; Nguyen, T.; Wang, L.; Land, S.J.; Lu, X.; Ruden, D.M. A Program for Annotating and Predicting the Effects of Single Nucleotide Polymorphisms, SnpEff: SNPs in the Genome of Drosophila melanogaster Strain w1118; iso-2; iso-3. Fly 2012, 6, 80–92. [Google Scholar] [CrossRef] [PubMed]
  64. Landrum, M.J.; Lee, J.M.; Riley, G.R.; Jang, W.; Rubinstein, W.S.; Church, D.M.; Maglott, D.R. ClinVar: Public Archive of Relationships among Sequence Variation and Human Phenotype. Nucleic Acids Res. 2014, 42, D980–D985. [Google Scholar] [CrossRef] [PubMed]
  65. Tadaka, S.; Kawashima, J.; Hishinuma, E.; Saito, S.; Okamura, Y.; Otsuki, A.; Kojima, K.; Komaki, S.; Aoiki, Y.; Kanno, T.; et al. jMorp: Japanese Multi-Omics Reference Panel Update Report 2023. Nucleic Acids Res. 2024, 52, D622–D632. [Google Scholar] [CrossRef]
  66. Saigusa, D.; Hishinuma, E.; Matsukawa, N.; Takahashi, M.; Inoue, J.; Tadaka, S.; Motoike, I.N.; Hozawa, A.; Izumi, Y.; Bamba, T.; et al. Comparison of Kit-Based Metabolomics with Other Methodologies in a Large Cohort, Towards Establishing Reference Values. Metabolites 2021, 11, 652. [Google Scholar] [CrossRef]
  67. Saigusa, D.; Matsukawa, N.; Hishinuma, E.; Koshiba, S. Identification of Biomarkers to Diagnose Diseases and Find Adverse Drug Reactions by Metabolomics. Drug Metab. Pharmacokinet. 2021, 37, 100373. [Google Scholar] [CrossRef]
  68. Sato, M.; Hishinuma, E.; Matsukawa, N.; Shima, Y.; Saigusa, D.; Motoike, I.N.; Kogure, M.; Nakaya, N.; Hozawa, A.; Kuriyama, S.; et al. Dietary Habits and Plasma Lipid Concentrations in a General Japanese Population. Metabolomics 2024, 20, 34. [Google Scholar] [CrossRef]
  69. Miyoshi, K.; Hishinuma, E.; Matsukawa, N.; Shirasago, Y.; Watanabe, M.; Sato, T.; Sato, Y.; Kumondai, M.; Kikuchi, M.; Koshiba, S.; et al. Global Proteomics for Identifying the Alteration Pathway of Niemann-Pick Disease Type C using Hepatic Cell Models. Int. J. Mol. Sci. 2023, 24, 15642. [Google Scholar] [CrossRef]
Figure 1. Statistical analysis of good- and poor-response groups using metabolome and proteome data. (A) PCA score plot of metabolome data. (B) PCA score plot of proteome data. White and black circles indicate the good- and poor-response groups, respectively.
Ijms 26 05435 g001
Figure 2. Volcano plot analysis using metabolite indicators. FDR-adjusted p < 0.05, log2 fold change > 1 or <−1 was considered significant. The pink and blue plots show the indexes that increased and decreased in the poor-response group, respectively.
Ijms 26 05435 g002
Figure 3. Box plots with individual data points for metabolite indicators in the good- and poor-response groups. The 14 indicators that showed significant differences in the volcano plot analysis are shown. (A) Metabolite indicators significantly increased in the poor-response group. (B) Metabolite indicators significantly decreased in the poor-response group. * p < 0.05, ** p < 0.01, *** p < 0.005, and **** p < 0.001.
Ijms 26 05435 g003
Figure 4. Volcano plot analysis using quantitative protein values. FDR-adjusted p < 0.05, log2 fold change > 1 or <−1 was considered significant. The pink and blue plots show the indexes that increased and decreased in the poor-response group, respectively.
Ijms 26 05435 g004
Figure 5. Box plots with individual data points for proteins in the good- and poor-response groups. Eight proteins that meet the following conditions are shown: VIP score > 2, log2 fold change > 1 or <−1, FDR-adjusted p < 0.05. (A) Proteins with significantly increased amounts in the poor-response group. (B) Proteins with significantly decreased amounts in the poor-response group. * p < 0.05, ** p < 0.01, and **** p < 0.001.
Ijms 26 05435 g005
Table 1. Main characteristics of patients with epithelial ovarian cancer enrolled in this study.
Range (Median)
Total (n) 7
Age 63–65 (67)
Number of patients
Diagnosis
Ovarian cancer4
Fallopian tube cancer2
Peritoneal cancer1
Histology
High-grade serous carcinoma5
Clear cell carcinoma1
Mucinous carcinoma1
Disease recurrence/progression during the study period
Yes6
No1
Table 2. Number of points for good- and poor-response groups per patient.
Case No.Good-ResponsePoor-Response
135
251
303
403
501
607
7 (No recurrence)60
Total1420
Table 3. Metabolism indicators detected based on FDR-adjusted p < 0.05, log2 fold change > 1 or <−1.
Metabolism IndicatorLog2 Fold ChangeFDR
Polyamine Synthesis5.47 2.00 × 10⁻⁴
Sum of Polyamines5.44 2.81 × 10⁻⁵
Sum of Unconjugated Primary Bile Acids *4.53 1.98 × 10⁻²
Putrescine Synthesis4.45 1.08 × 10⁻⁵
Sum of Unconjugated Bile Acids *3.92 1.80 × 10⁻²
Serotonin Synthesis1.41 7.47 × 10⁻³
Phospholipase A2 Activity1.23 2.10 × 10⁻²
Sum of Saturated Trigylcerides1.06 1.59 × 10⁻²
Sum of Neurotransmitters1.06 1.57 × 10⁻²
Lactate Dehydrogenase Activity1.01 1.23 × 10⁻³
2-Methylbutyrylglycinuria−1.25 1.22 × 10⁻⁵
Ratio of Conjugated Secondary Bile Acids to Unconjugated Secondary Bile Acids−2.74 1.51 × 10⁻⁵
Glycine Conjugation of Deoxycholic Acid−2.94 6.56 × 10⁻³
Glycodeoxycholic Acid Synthesis from Cholic Acid *−3.47 1.33 × 10⁻²
*: VIP score > 2.
Table 4. Proteins detected based on FDR-adjusted p < 0.05, log2 fold change > 1 or <−1.
AccessionDescriptionLog2 Fold ChangeFDR
Q14766Latent-transforming growth factor beta-binding protein 12.33 4.89 × 10⁻²
P00558Phosphoglycerate kinase 12.05 2.31 × 10⁻²
Q01518Adenylyl cyclase-associated protein 1 *1.95 4.92 × 10⁻²
P14618Pyruvate kinase PKM *1.93 1.81 × 10⁻²
P06702Protein S100-A91.86 4.85 × 10⁻²
P50552Vasodilator-stimulated phosphoprotein1.82 2.50 × 10⁻²
P08567Pleckstrin1.70 6.46 × 10⁻³
P04406Glyceraldehyde-3-phosphate dehydrogenase1.70 2.11 × 10⁻²
P08514Integrin alpha-IIb *1.69 4.95 × 10⁻²
Q05682Caldesmon1.67 1.93 × 10⁻³
P61224Ras-related protein Rap-1b *1.58 4.80 × 10⁻²
P80748Immunoglobulin lambda variable 3–21 *1.54 4.41 × 10⁻²
Q13201Multimerin-11.53 2.40 × 10⁻²
P07996Thrombospondin-11.47 2.39 × 10⁻²
Q9Y490Talin-11.41 2.91 × 10⁻²
O95810Caveolae-associated protein 21.37 2.92 × 10⁻²
P04040Catalase1.36 2.00 × 10⁻²
P06753-2Isoform 2 of Tropomyosin alpha-3 chain1.32 4.12 × 10⁻²
P05106Integrin beta-31.32 2.41 × 10⁻²
Q15166Serum paraoxonase/lactonase 31.30 2.40 × 10⁻²
P02775Platelet basic protein1.29 2.45 × 10⁻²
P21333Filamin-A1.26 4.50 × 10⁻²
P09493-8Isoform 8 of Tropomyosin alpha-1 chain1.23 4.44 × 10⁻²
P05109Protein S100-A81.20 4.86 × 10⁻²
P35579Myosin-91.19 4.66 × 10⁻²
P07737Profilin-11.19 4.65 × 10⁻²
P06733Alpha-enolase1.18 5.04 × 10⁻²
P18206Vinculin1.18 4.46 × 10⁻²
Q15485Ficolin-21.17 2.33 × 10⁻²
P16671Platelet glycoprotein 41.17 4.45 × 10⁻²
P10599Thioredoxin1.12 4.81 × 10⁻³
P12814Alpha-actinin-11.11 4.54 × 10⁻²
P20742Pregnancy zone protein1.07 4.56 × 10⁻²
O14950Myosin regulatory light chain 12B1.05 4.61 × 10⁻²
P48059LIM and senescent cell antigen-like-containing domain protein 11.05 2.40 × 10⁻²
P02786Transferrin receptor protein 11.04 2.05 × 10⁻²
P60709Actin, cytoplasmic 11.01 2.33 × 10⁻²
Q9NZ71Regulator of telomere elongation helicase 1−1.03 4.93 × 10⁻²
Q8NHM4Putative trypsin-6−1.06 2.54 × 10⁻²
Q12860Contactin-1 *−1.09 1.76 × 10⁻²
Q9UBQ6Exostosin-like 2−1.15 2.24 × 10⁻²
Q86SQ4Adhesion G-protein coupled receptor G6−1.22 6.49 × 10⁻²
P01780Immunoglobulin heavy variable 3-7−1.25 4.55 × 10⁻²
P07339Cathepsin D−1.60 4.71 × 10⁻²
P15144Aminopeptidase N *−1.94 4.12 × 10⁻⁵
P35527Keratin, type I cytoskeletal 9 *−2.84 4.95 × 10⁻²
*: VIP score > 2.
Table 5. Enrichment analysis of the proteins at high level in the poor-response group using the reactome pathway tool (FDR-adjusted p-value < 0.001).
Reactome Pathway IDPathway NameEntities p-ValueEntities FDR
R-HSA-114608Platelet degranulation2.22 × 10−164.90 × 10⁻¹⁴
R-HSA-76005Response to elevated platelet cytosolic Ca2+3.33 × 10−164.90 × 10⁻¹⁴
R-HSA-76002Platelet activation, signaling and aggregation7.13 × 10−146.99 × 10⁻¹²
R-HSA-109582Hemostasis3.98 × 10−102.90 × 10⁻⁸
R-HSA-6802948Signaling by high-kinase activity BRAF mutants2.80 × 10−91.65 × 10⁻⁷
R-HSA-446353Cell-extracellular matrix interactions4.50 × 10−92.13 × 10⁻⁷
R-HSA-5674135MAP2K and MAPK activation5.13 × 10−92.13 × 10⁻⁷
R-HSA-9656223Signaling by RAF1 mutants5.91 × 10−92.13 × 10⁻⁷
R-HSA-6802955Paradoxical activation of RAF signaling by kinase inactive BRAF1.15 × 10−82.75 × 10⁻⁷
R-HSA-9649948Signaling downstream of RAS mutants1.15 × 10−82.75 × 10⁻⁷
R-HSA-6802946Signaling by moderate kinase activity BRAF mutants1.15 × 10−82.75 × 10⁻⁷
R-HSA-6802949Signaling by RAS mutants1.15 × 10−82.75 × 10⁻⁷
R-HSA-6802952Signaling by BRAF and RAF1 fusions8.40 × 10−81.85 × 10⁻⁶
R-HSA-372708p130Cas linkage to MAPK signaling for integrins2.05 × 10−73.49 × 10⁻⁶
R-HSA-354194GRB2:SOS provides linkage to MAPK signaling for integrins2.05 × 10−73.49 × 10⁻⁶
R-HSA-6802957Oncogenic MAPK signaling3.42 × 10−75.47 × 10⁻⁶
R-HSA-354192Integrin signaling2.42 × 10−63.38 × 10⁻⁵
R-HSA-70171Glycolysis6.72 × 10−69.41 × 10⁻⁵
R-HSA-76009Platelet aggregation (plug formation)9.78 × 10−61.27 × 10−4
R-HSA-70326Glucose metabolism1.25 × 10−51.50 × 10⁻⁴
R-HSA-445355Smooth muscle contraction1.42 × 10−51.70 × 10⁻⁴
R-HSA-168249Innate Immune System1.56 × 10−51.71 × 10⁻⁴
R-HSA-6798695Neutrophil degranulation2.02 × 10−52.22 × 10⁻⁴
R-HSA-5602498MyD88 deficiency (TLR2/4)3.63 × 10−53.63 × 10−4
R-HSA-5603041IRAK4 deficiency (TLR2/4)4.22 × 10−54.03 × 10−4
R-HSA-446728Cell junction organization4.29 × 10−54.03 × 10⁻⁴
R-HSA-195258RHO GTPase effectors4.47 × 10−54.03 × 10⁻⁴
R-HSA-9636667Manipulation of host energy metabolism4.74 × 10−54.26 × 10⁻⁴
R-HSA-5627123RHO GTPases activate PAKs4.87 × 10−54.39 × 10⁻⁴
R-HSA-5686938Regulation of TLR by endogenous ligand5.59 × 10−54.47 × 10⁻⁴
R-HSA-422475Axon guidance6.28 × 10−55.02 × 10⁻⁴
R-HSA-9675108Nervous system development8.93 × 10−57.14 × 10⁻⁴
R-HSA-70263Gluconeogenesis9.14 × 10−57.15 × 10⁻⁴
R-HSA-3000170Syndecan interactions1.02 × 10−47.15 × 10⁻⁴
Table 6. Enrichment analysis of the proteins at low level in the poor-response group using the reactome pathway tool (FDR-adjusted p-value < 0.01).
Reactome Pathway IDPathway NameEntities p-ValueEntities FDR
R-HSA-2022377Metabolism of angiotensinogen to angiotensins7.38 × 10−56.4 × 10⁻³
Disclaimer/Publisher’s Note: The statements, opinions and data contained in all publications are solely those of the individual author(s) and contributor(s) and not of MDPI and/or the editor(s). MDPI and/or the editor(s) disclaim responsibility for any injury to people or property resulting from any ideas, methods, instructions or products referred to in the content.

