
Towards Precision Medicine in Obesity: Genetic Copy Number Variations Profiling Linked to Specific Metabolic Dysregulation Patterns

 , ,
, ,  , , , and
Abstract
1. Introduction
2. Results
3. Discussion
4. Materials and Methods
5. Conclusions
Supplementary Materials
Author Contributions
Funding
Institutional Review Board Statement
Informed Consent Statement
Data Availability Statement
Conflicts of Interest
References
- Nowakowska, B. Clinical interpretation of copy number variants in the human genome. J. Appl. Genet. 2017, 58, 449–457. [Google Scholar] [CrossRef] [PubMed]
- Mahmoud, R.; Kimonis, V.; Butler, M.G. Genetics of Obesity in Humans: A Clinical Review. Int. J. Mol. Sci. 2022, 23, 11005. [Google Scholar] [CrossRef] [PubMed]
- Phillips, M.; Babu, J.R.; Wang, X.; Geetha, T. DNA copy number and structural variation (CNV) contributions to adult and childhood obesity. Biochem. Soc. Trans. 2020, 48, 1819–1828. [Google Scholar] [CrossRef] [PubMed]
- Cucoreanu, C.; Tigu, A.-B.; Nistor, M.; Moldovan, R.-C.; Pralea, I.-E.; Iacobescu, M.; Iuga, C.-A.; Szabo, R.; Dindelegan, G.-C.; Ciuce, C. Epigenetic and Molecular Alterations in Obesity: Linking CRP and DNA Methylation to Systemic Inflammation. Curr. Issues Mol. Biol. 2024, 46, 7430–7446. [Google Scholar] [CrossRef]
- Loos, R.J.F.; Yeo, G.S.H. The genetics of obesity: From discovery to biology. Nat. Rev. Genet. 2022, 23, 120–133. [Google Scholar] [CrossRef]
- Lu, Y.; Day, F.R.; Gustafsson, S.; Buchkovich, M.L.; Na, J.; Bataille, V.; Cousminer, D.L.; Dastani, Z.; Drong, A.W.; Esko, T.; et al. New loci for body fat percentage reveal link between adiposity and cardiometabolic disease risk. Nat. Commun. 2016, 7, 10495. [Google Scholar] [CrossRef]
- Zillikens, M.C.; Demissie, S.; Hsu, Y.-H.; Yerges-Armstrong, L.M.; Chou, W.-C.; Stolk, L.; Livshits, G.; Broer, L.; Johnson, T.; Koller, D.L.; et al. Large meta-analysis of genome-wide association studies identifies five loci for lean body mass. Nat. Commun. 2017, 8, 80. [Google Scholar] [CrossRef]
- Chu, A.Y.; Deng, X.; Fisher, V.A.; Drong, A.; Zhang, Y.; Feitosa, M.F.; Liu, C.T.; Weeks, O.; Choh, A.C.; Duan, Q.; et al. Multiethnic genome-wide meta-analysis of ectopic fat depots identifies loci associated with adipocyte development and differentiation. Nat. Genet. 2017, 49, 125–130. [Google Scholar] [CrossRef]
- Kilpeläinen, T.O.; Zillikens, M.C.; Stančákova, A.; Finucane, F.M.; Ried, J.S.; Langenberg, C.; Zhang, W.; Beckmann, J.S.; Luan, J.A.; Vandenput, L.; et al. Genetic variation near IRS1 associates with reduced adiposity and an impaired metabolic profile. Nat. Genet. 2011, 43, 753–760. [Google Scholar] [CrossRef]
- Ahangar, O.G.; Javanrouh, N.; Daneshpour, M.S.; Barzin, M.; Valizadeh, M.; Azizi, F.; Hosseinpanah, F. Genetic markers and continuity of healthy metabolic status: Tehran cardio-metabolic genetic study (TCGS). Sci. Rep. 2020, 10, 13600. [Google Scholar]
- GRADE Working Group. Grading quality of evidence and strength of recommendations. BMJ 2004, 328, 1490. [Google Scholar] [CrossRef] [PubMed]
- von Schnurbein, J.; Heni, M.; Moss, A.; Nagel, S.; Machann, J.; Muehleder, H.; Debatin, K.; Farooqi, S.; Wabitsch, M. Rapid Improvement of Hepatic Steatosis after Initiation of Leptin Substitution in a Leptin-Deficient Girl. Horm. Res. Paediatr. 2013, 79, 310–317. [Google Scholar] [CrossRef] [PubMed]
- Ahima, R.S.; Prabakaran, D.; Mantzoros, C.; Qu, D.; Lowell, B.; Maratos-Flier, E.; Flier, J.S. Role of leptin in the neuroendocrine response to fasting. Nature 1996, 382, 250–252. [Google Scholar] [CrossRef] [PubMed]
- Scott, M.M.; Lachey, J.L.; Sternson, S.M.; Lee, C.E.; Elias, C.F.; Friedman, J.M.; Elmquist, J.K. Leptin targets in the mouse brain. J. Comp. Neurol. 2009, 514, 518–532. [Google Scholar] [CrossRef]
- Kleinendorst, L.; Abawi, O.; van Der Kamp, H.J.; Alders, M.; Meijers-Heijboer, H.E.; van Rossum, E.F.; van Den Akker, E.L.; van Haelst, M.M. Leptin receptor deficiency: A systematic literature review and prevalence estimation based on population genetics. Eur. J. Endocrinol. 2020, 182, 47–56. [Google Scholar] [CrossRef]
- Nunziata, A.; Funcke, J.-B.; Borck, G.; von Schnurbein, J.; Brandt, S.; Lennerz, B.; Moepps, B.; Gierschik, P.; Fischer-Posovszky, P.; Wabitsch, M. Functional and Phenotypic Characteristics of Human Leptin Receptor Mutations. J. Endocr. Soc. 2019, 3, 27–41. [Google Scholar] [CrossRef]
- Chagnon, Y.C.; Chung, W.K.; Perusse, L.; Chagnon, M.; Leibel, R.L.; Bouchard, C. Linkages and associations between the leptin receptor (LEPR) gene and human body composition in the Québec Family Study. Int. J. Obes. 1999, 23, 278–286. [Google Scholar] [CrossRef]
- Farooqi, I.S.; Wangensteen, T.; Collins, S.; Kimber, W.; Matarese, G.; Keogh, J.M.; Lank, E.; Bottomley, B.; Lopez-Fernandez, J.; Ferraz-Amaro, I.; et al. Clinical and Molecular Genetic Spectrum of Congenital Deficiency of the Leptin Receptor. N. Engl. J. Med. 2007, 356, 237–247. [Google Scholar] [CrossRef]
- Koerber-Rosso, I.; Brandt, S.; von Schnurbein, J.; Fischer-Posovszky, P.; Hoegel, J.; Rabenstein, H.; Siebert, R.; Wabitsch, M. A fresh look to the phenotype in mono-allelic likely pathogenic variants of the leptin and the leptin receptor gene. Mol. Cell Pediatr. 2021, 8, 10. [Google Scholar] [CrossRef]
- Mitu, I.; Dimitriu, C.D.; Preda, C.; Mitu, O.; Costache, I.I.; Ciocoiu, M. Adipokine profile and metabolic syndrome in patients with similar adipose tissue mass and distribution. Med. Surg. J. 2022, 126, 214–223. [Google Scholar] [CrossRef]
- Rui, L.; Carter-Su, C. Identification of SH2-Bβ as a potent cytoplasmic activator of the tyrosine kinase Janus kinase 2. Proc. Natl. Acad. Sci. USA 1999, 96, 7172–7177. [Google Scholar] [CrossRef] [PubMed]
- Rui, L.; Herrington, J.; Carter-Su, C. SH2-B, a Membrane-associated Adapter, Is Phosphorylated on Multiple Serines/Threonines in Response to Nerve Growth Factor by Kinases within the MEK/ERK Cascade. J. Biol. Chem. 1999, 274, 26485–26492. [Google Scholar] [CrossRef] [PubMed]
- Li, Z.; Zhou, Y.; Carter-Su, C.; Myers, M.G., Jr.; Rui, L. SH2B1 Enhances Leptin Signaling by Both Janus Kinase 2 Tyr813 Phosphorylation-Dependent and -Independent Mechanisms. Mol. Endocrinol. 2007, 21, 2270–2281. [Google Scholar] [CrossRef]
- Nelms, K.; O’Neill, T.J.; Li, S.; Hubbard, S.R.; Gustafson, T.A.; Paul, W.E. Alternative splicing, gene localization, and binding of SH2-B to the insulin receptor kinase domain. Mamm. Genome 1999, 10, 1160–1167. [Google Scholar] [CrossRef]
- Duan, C.; Yang, H.; White, M.F.; Rui, L. Disruption of the SH2-B Gene Causes Age—Dependent Insulin Resistance and Glucose Intolerance. Mol. Cell Biol. 2004, 24, 7435–7443. [Google Scholar] [CrossRef]
- Rui, L. SH2B1 regulation of energy balance, body weight, and glucose metabolism. World J. Diabetes 2014, 5, 511. [Google Scholar] [CrossRef]
- Taylor, C.M.; Smith, R.; Lehman, C.; Mitchel, M.W.; Singer, K.; Weaver, W.C.; Chung, W. 16p11.2 Recurrent Deletion. In Adam MP.; Feldman, J., Mirzaa, G.M., Pagon, R.A., Wallace, S.E., Amemiya, A., Eds.; GeneReviews® [Internet]; University of Washington: Seattle, WA, USA, 2021. [Google Scholar]
- Windholz, J.; Kovacs, P.; Schlicke, M.; Franke, C.; Mahajan, A.; Morris, A.P.; Lemke, J.R.; Klammt, J.; Kiess, W.; Schöneberg, T.; et al. Copy number variations in “classical” obesity candidate genes are not frequently associated with severe early-onset obesity in children. J. Pediatr. Endocrinol. Metab. 2017, 30, 507–515. [Google Scholar] [CrossRef] [PubMed]
- D’Angelo, C.S.; Varela, M.C.; de Castro, C.I.; Kim, C.A.; Bertola, D.R.; Lourenço, C.M.; Perez, A.B.A.; Koiffmann, C.P. Investigation of selected genomic deletions and duplications in a cohort of 338 patients presenting with syndromic obesity by multiplex ligation-dependent probe amplification using synthetic probes. Mol. Cytogenet. 2014, 7, 75. [Google Scholar] [CrossRef]
- D’Angelo, C.S.; Varela, M.C.; de Castro, C.I.E.; Otto, P.A.; Perez, A.B.A.; Lourenço, C.M.; Kim, C.A.; Bertola, D.R.; Kok, F.; Garcia-Alonso, L.; et al. Chromosomal microarray analysis in the genetic evaluation of 279 patients with syndromic obesity. Mol. Cytogenet. 2018, 11, 14. [Google Scholar] [CrossRef] [PubMed] [PubMed Central]
- Bochukova, E.G.; Huang, N.; Keogh, J.; Henning, E.; Purmann, C.; Blaszczyk, K.; Saeed, S.; Hamilton-Shield, J.; Clayton-Smith, J.; O’rahilly, S.; et al. Large, rare chromosomal deletions associated with severe early-onset obesity. Nature 2010, 463, 666–670. [Google Scholar] [CrossRef]
- Jarick, I.; Vogel, C.I.; Scherag, S.; Schäfer, H.; Hebebrand, J.; Hinney, A.; Scherag, A. Novel common copy number variation for early onset extreme obesity on chromosome 11q11 identified by a genome-wide analysis. Hum. Mol. Genet. 2011, 20, 840–852. [Google Scholar] [CrossRef] [PubMed]
- Jacquemont, S.; Reymond, A.; Zufferey, F.; Harewood, L.; Walters, R.G.; Kutalik, Z.; Martinet, D.; Shen, Y.; Valsesia, A.; Beckmann, N.D.; et al. Mirror extreme BMI phenotypes associated with gene dosage at the chromosome 16p11.2 locus. Nature 2011, 478, 97–102. [Google Scholar] [CrossRef] [PubMed]
- D’Angelo, D.; Lebon, S.; Chen, Q.; Martin-Brevet, S.; Snyder, L.G.; Hippolyte, L.; Hanson, E.; Maillard, A.M.; Faucett, W.A.; Macé, A.; et al. Defining the Effect of the 16p11.2 Duplication on Cognition, Behavior, and Medical Comorbidities. JAMA Psychiatry 2016, 73, 20. [Google Scholar] [CrossRef] [PubMed]
- da Silva Assis, I.S.; Salum, K.C.R.; Felício, R.F.M.; Palhinha, L.; de Medeiros Abreu, G.; Silva, T.; Mattos, F.C.C.; Rosado, E.L.; Zembrzuski, V.M.; Campos Junior, M.; et al. Genomic deletions on 16p11.2 associated with severe obesity in Brazil. Front. Endocrinol. 2025, 15, 1495534. [Google Scholar] [CrossRef] [PubMed] [PubMed Central]
- Bonnefond, A.; Raimondo, A.; Stutzmann, F.; Ghoussaini, M.; Ramachandrappa, S.; Bersten, D.C.; Durand, E.; Vatin, V.; Balkau, B.; Lantieri, O.; et al. Loss-of-function mutations in SIM1 contribute to obesity and Prader-Willi–like features. J. Clin. Investig. 2013, 123, 3037–3041. [Google Scholar] [CrossRef]
- Ramachandrappa, S.; Raimondo, A.; Cali, A.M.; Keogh, J.M.; Henning, E.; Saeed, S.; Thompson, A.; Garg, S.; Bochukova, E.G.; Brage, S.; et al. Rare variants in single-minded 1 (SIM1) are associated with severe obesity. J. Clin. Investig. 2013, 123, 3042–3050. [Google Scholar] [CrossRef]
- Tolson, K.P.; Gemelli, T.; Gautron, L.; Elmquist, J.K.; Zinn, A.R.; Kublaoui, B.M. Postnatal Sim1 Deficiency Causes Hyperphagic Obesity and Reduced Mc4r and Oxytocin Expression. J. Neurosci. 2010, 30, 3803–3812. [Google Scholar] [CrossRef]
- Xi, D.; Gandhi, N.; Lai, M.; Kublaoui, B.M. Ablation of Sim1 Neurons Causes Obesity through Hyperphagia and Reduced Energy Expenditure. PLoS ONE 2012, 7, e36453. [Google Scholar] [CrossRef]
- Blankinship, M.J.; Gregorevic, P.; Chamberlain, J.S. Gene Therapy Strategies for Duchenne Muscular Dystrophy Utilizing Recombinant Adeno-associated Virus Vectors. Mol. Ther. 2006, 13, 241–249. [Google Scholar] [CrossRef]
- Dzierlega, K.; Yokota, T. Optimization of antisense-mediated exon skipping for Duchenne muscular dystrophy. Gene Ther. 2020, 27, 407–416. [Google Scholar] [CrossRef]
- Takeda, S.; Clemens, P.R.; Hoffman, E.P. Exon-Skipping in Duchenne Muscular Dystrophy. J. Neuromuscul. Dis. 2021, 8 (Suppl. S2), S343–S358. [Google Scholar] [CrossRef] [PubMed]
- Matharu, N.; Rattanasopha, S.; Tamura, S.; Maliskova, L.; Wang, Y.; Bernard, A.; Hardin, A.; Eckalbar, W.L.; Vaisse, C.; Ahituv, N. CRISPR-mediated activation of a promoter or enhancer rescues obesity caused by haploinsufficiency. Science 2019, 363, eaau0629. [Google Scholar] [CrossRef] [PubMed]
- Sweatt, K.; Garvey, W.T.; Martins, C. Strengths and Limitations of BMI in the Diagnosis of Obesity: What is the Path Forward? Curr. Obes. Rep. 2024, 13, 584–595. [Google Scholar] [CrossRef] [PubMed]
- Gómez-Ambrosi, J.; Catalán, V.; Ramírez, B.; Salmón-Gómez, L.; Marugán-Pinos, R.; Rodríguez, A.; Becerril, S.; Aguas-Ayesa, M.; Yárnoz-Esquíroz, P.; Olazarán, L.; et al. Cardiometabolic risk stratification using a novel obesity phenotyping system based on body adiposity and waist circumference. Eur. J. Intern. Med. 2024, 124, 54–60. [Google Scholar] [CrossRef]
- Salmón-Gómez, L.; Catalán, V.; Frühbeck, G.; Gómez-Ambrosi, J. Relevance of body composition in phenotyping the obesities. Rev. Endocr. Metab. Disord. 2023, 24, 809–823. [Google Scholar] [CrossRef]
- Grundy, S.M.; Cleeman, J.I.; Daniels, S.R.; Donato, K.A.; Eckel, R.H.; Franklin, B.A.; Gordon, D.J.; Krauss, R.M.; Savage, P.J.; Smith, S.C., Jr.; et al. Diagnosis and management of the metabolic syndrome: An American Heart Association/National Heart, Lung, and Blood Institute Scientific Statement. Circulation 2005, 112, 2735–2752. [Google Scholar] [CrossRef]
- Matthews, D.R.; Hosker, J.P.; Rudenski, A.S.; Naylor, B.A.; Treacher, D.F.; Turner, R.C. Homeostasis model assessment: Insulin resistance and beta-cell function from fasting plasma glucose and insulin concentrations in man. Diabetologia 1985, 28, 412–419. [Google Scholar] [CrossRef]
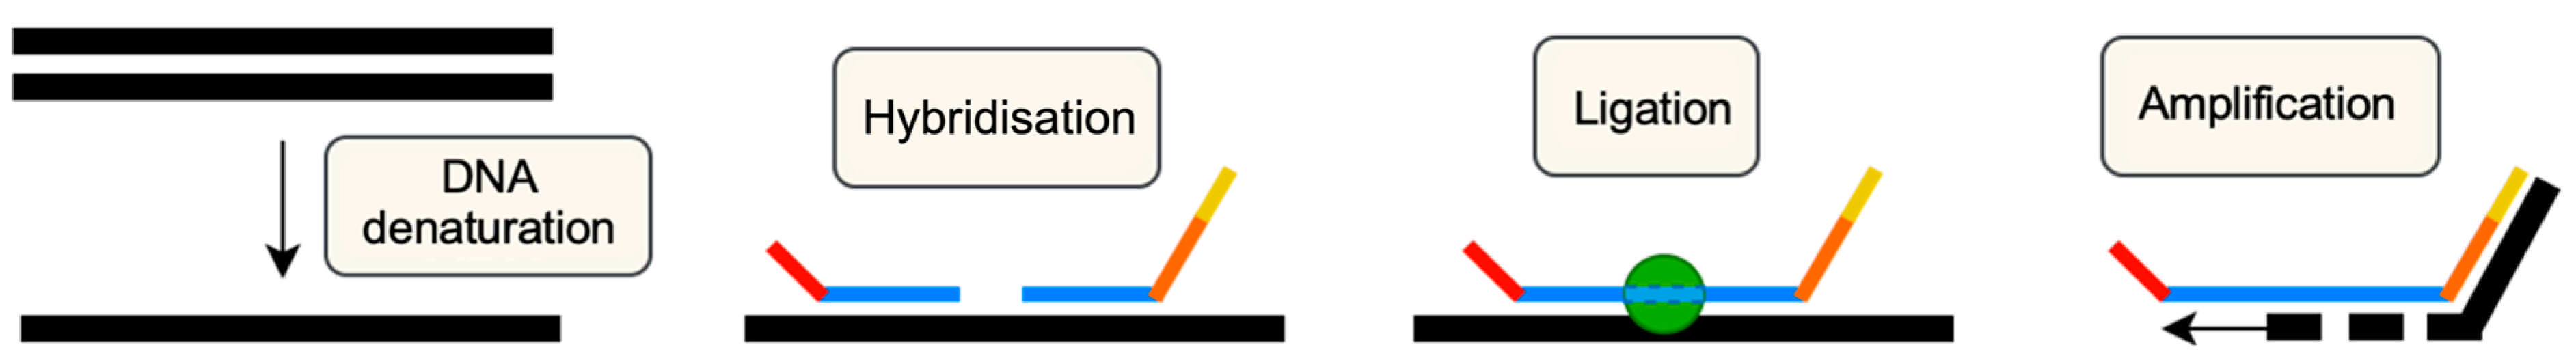
- MRC Holland. MLPA General Protocol. Available online: www.mrcholland.com (accessed on 25 March 2025).
- Amihăesei, I.C.; Chelaru, L. Metabolic syndrome a widespread threatening condition; risk factors, diagnostic criteria, therapeutic options, prevention and controversies: An overview. Med. Surg. J. 2014, 118, 896–900. [Google Scholar]


| Parameter | Frequency | Percent | |
|---|---|---|---|
| Residence | |||
| Urban | 37 | 62.7% | |
| Rural | 22 | 37.3% | |
| Gender | |||
| Female | 42 | 71.2% | |
| Male | 17 | 28.8% | |
| Current smoker | |||
| Yes | 8 | 13.6% | |
| No | 51 | 86.4% | |
| Parameter | Median (Q3–Q1) | Min | Max |
| Age | 58 (50–64) | 39 | 72 |
| Adiponectin | 12.30 (14.40–9.24) | 4.53 | 28.53 |
| Leptin | 29.10 (42.40–14) | 3.10 | 58.20 |
| Insulin | 17.30 (29.80–11.10) | 3.72 | 51.10 |
| Glucose | 101 (94–123) | 78 | 242 |
| HOMA-IR | 4.41 (8.94–2.89) | 0.81 | 27.25 |
| Total cholesterol | 196 (230–166) | 108 | 351 |
| LDL cholesterol | 124 (151–102.2) | 36.2 | 266 |
| Triglycerides | 170.58 (233–102) | 57 | 488 |
| CRP | 0.32 (0.16–0.53) | 0.04 | 2.51 |
| Parameter | Mean ± S.D. | C.I. for mean (95%) | |
| Lower bound | Upper bound | ||
| BMI | 34.25 ± 4.67 | 33.03 | 35.47 |
| Total adipose tissue (%) | 40.70 ± 5.81 | 39.19 | 42.21 |
| Trunk adipose tissue (%) | 41.31 ± 5.64 | 39.85 | 42.79 |
| HDL cholesterol | 50.07 ± 14.08 | 46.40 | 53.74 |
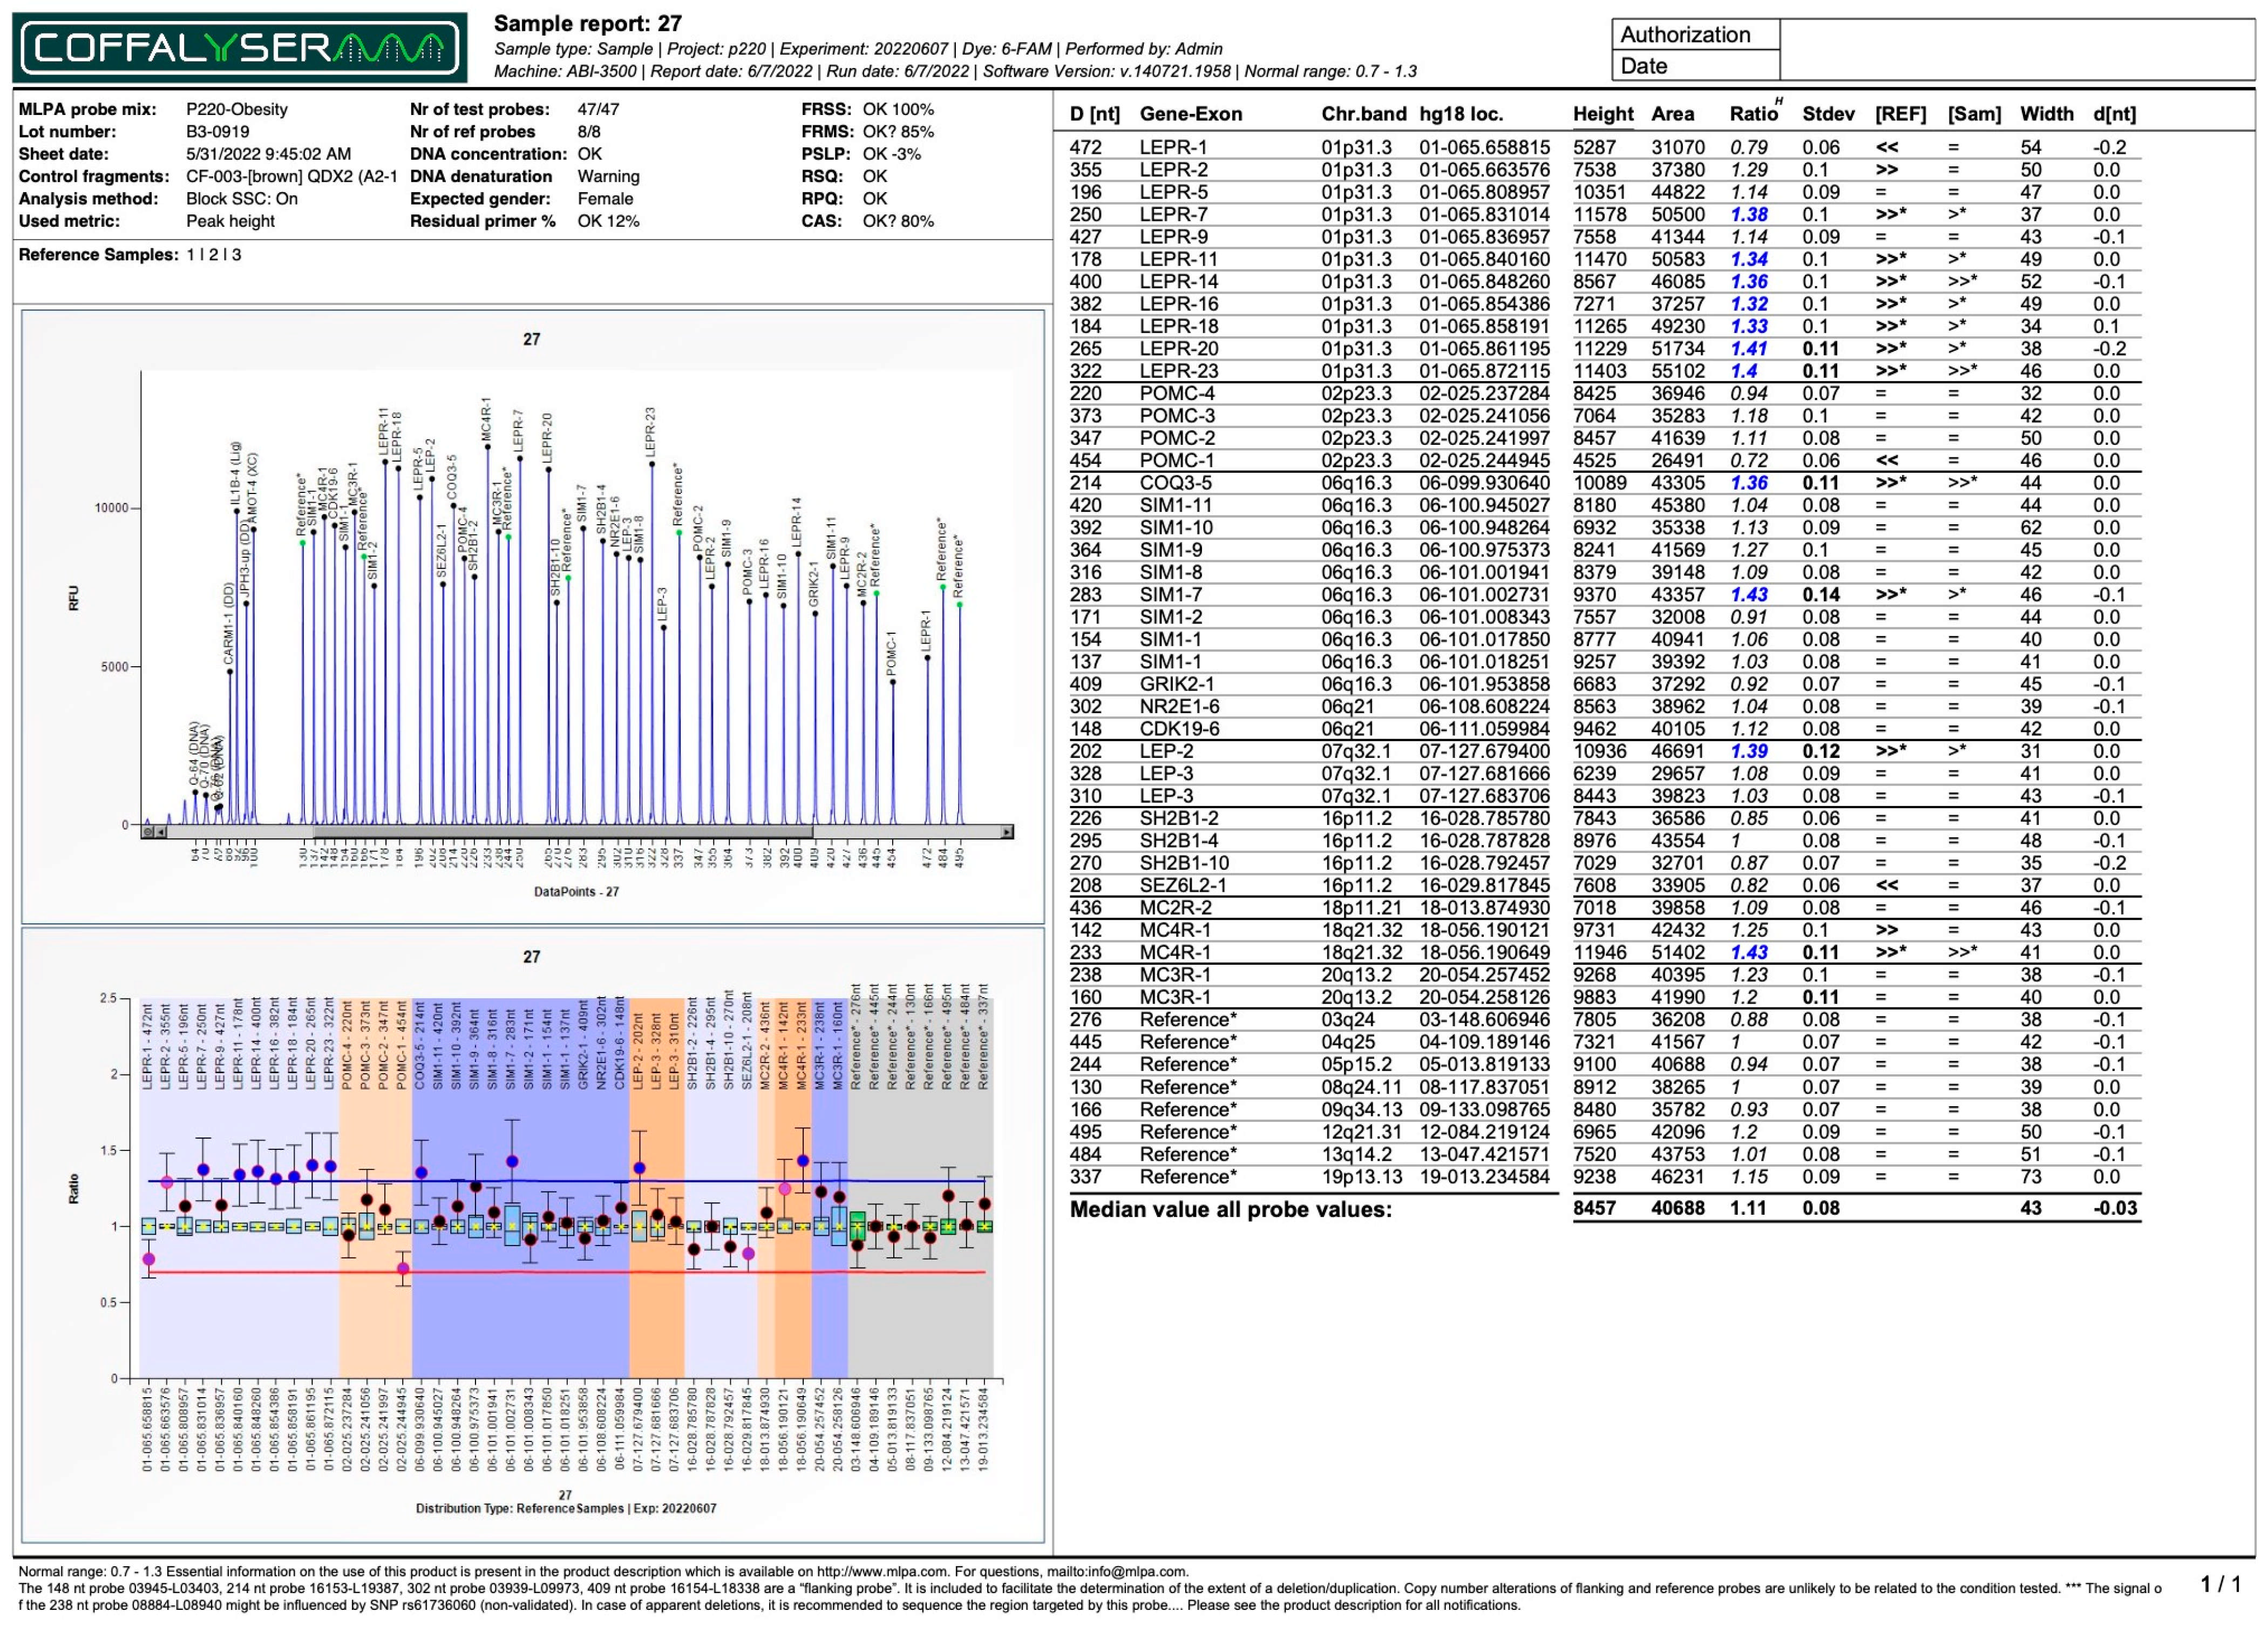
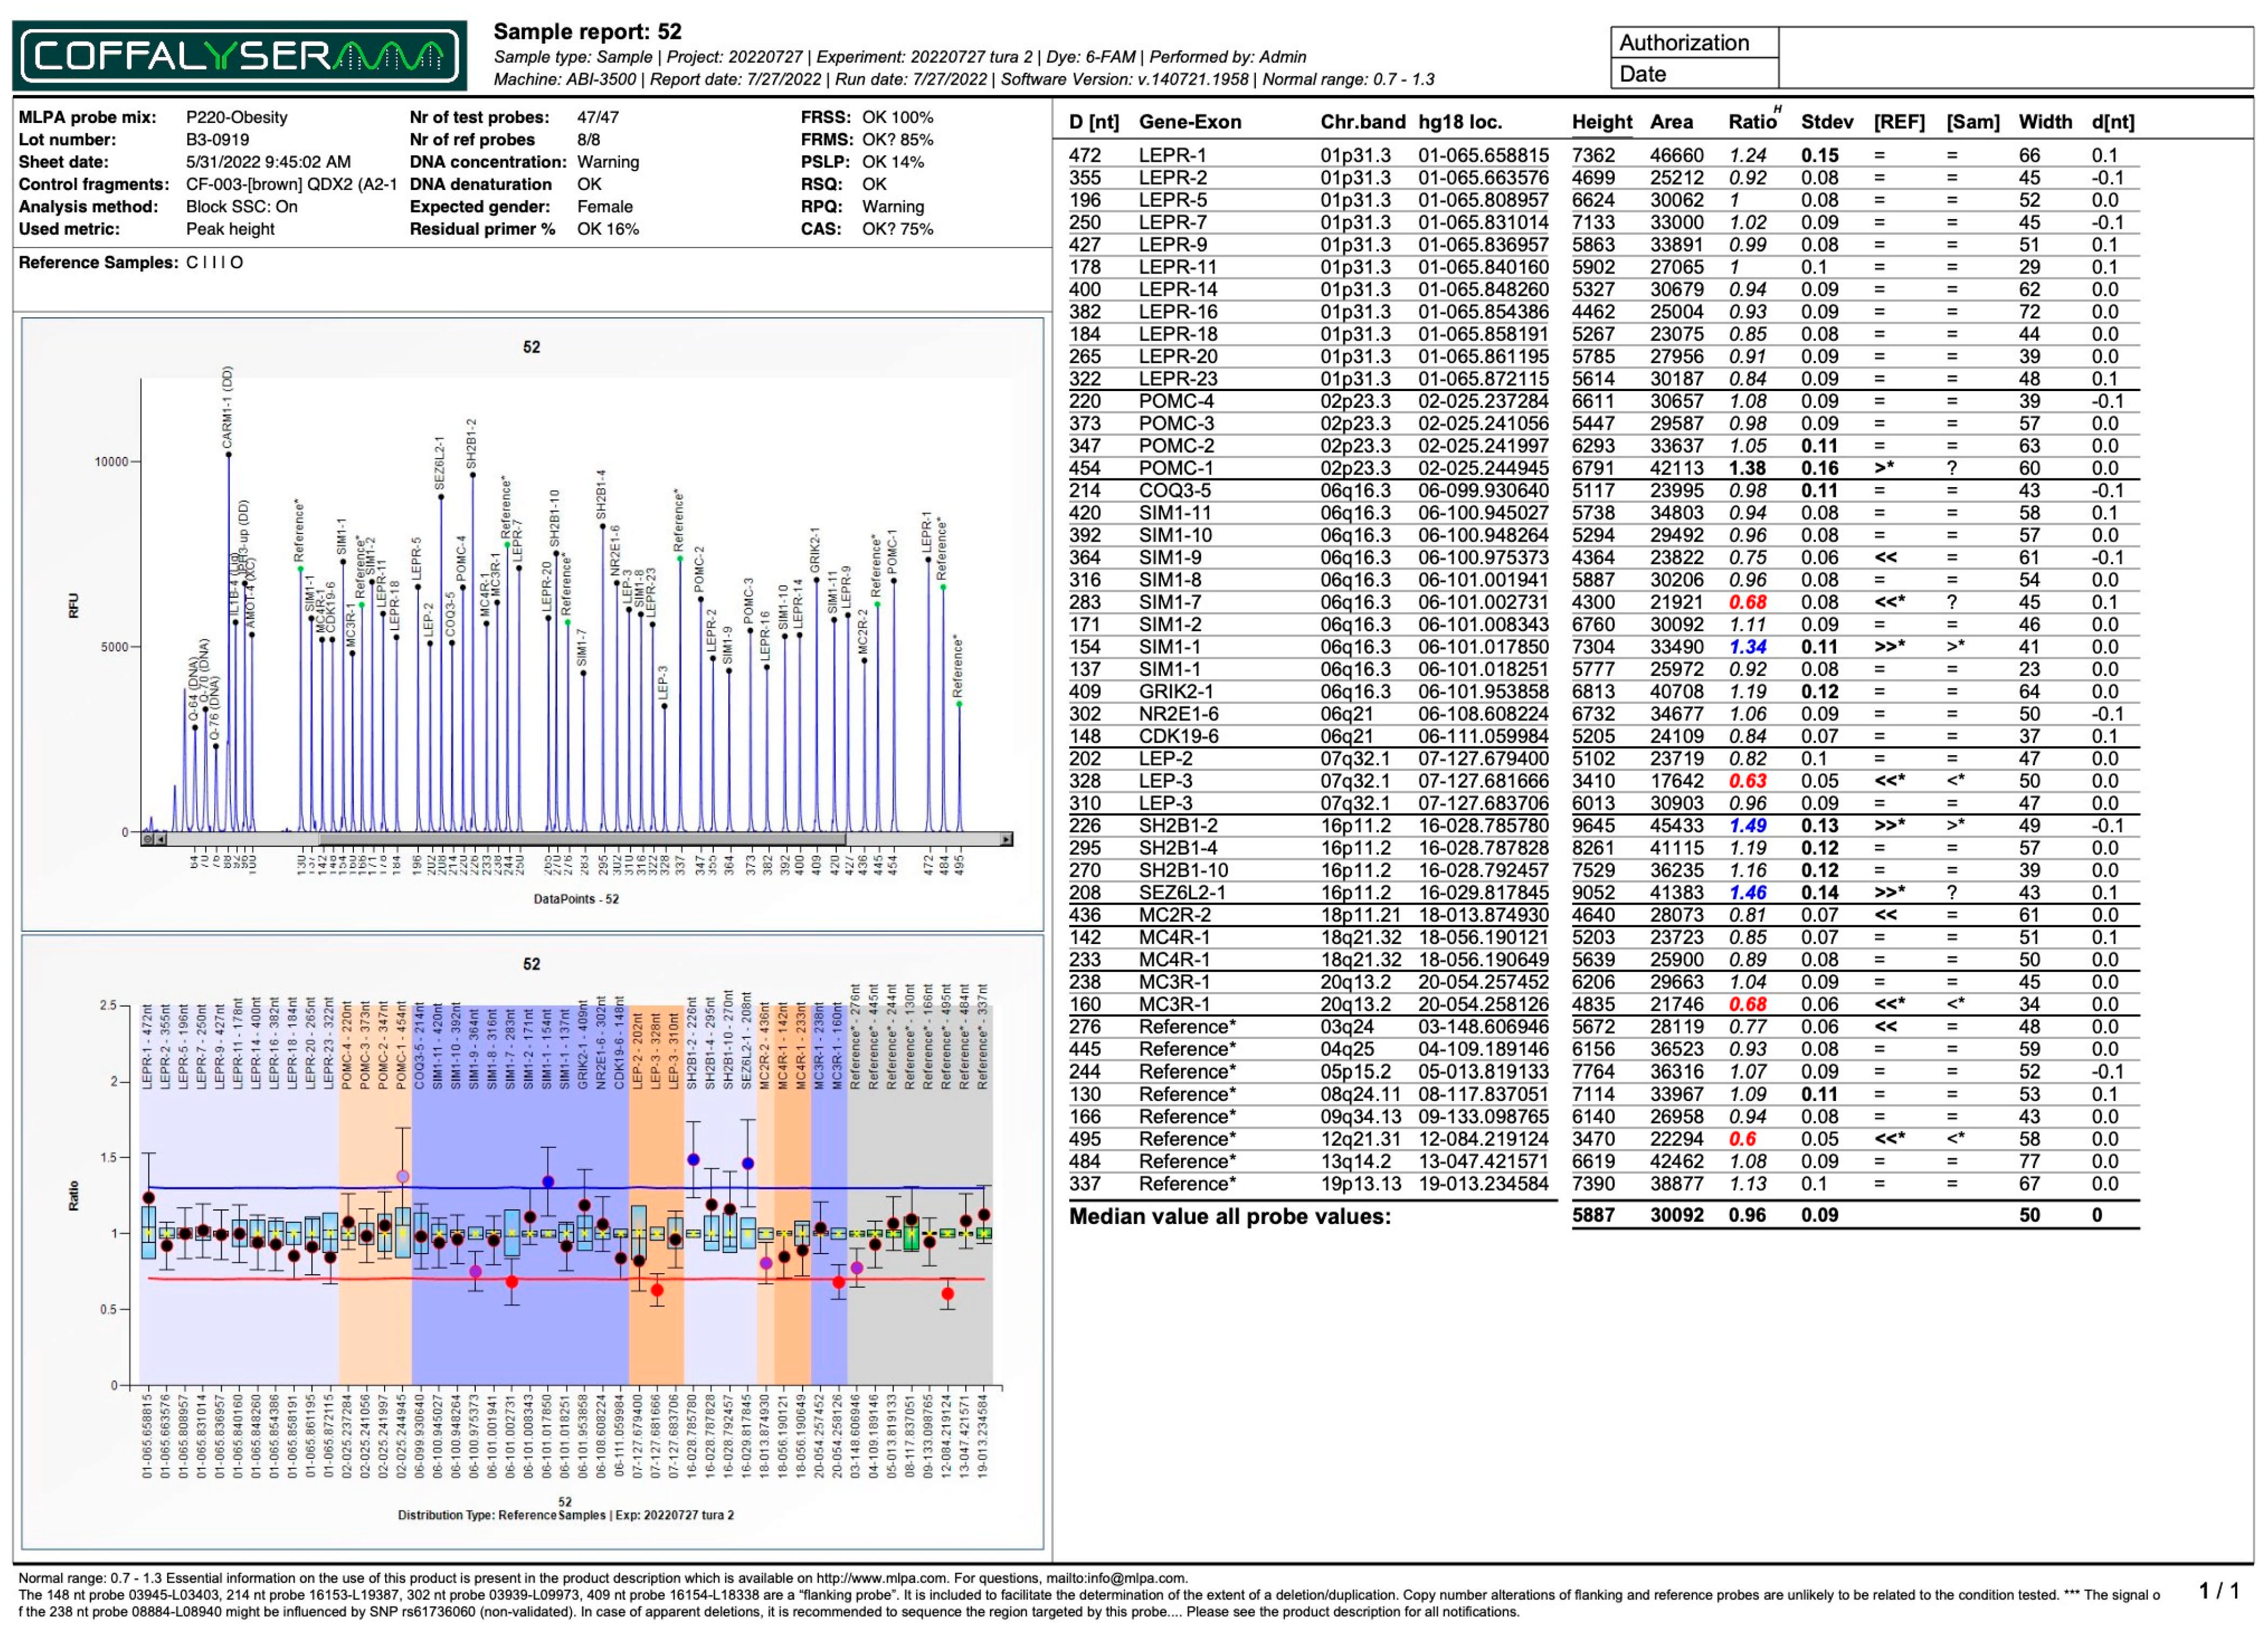
| Subject No. | 4 | 45 | 47 | 53 | 27 | 52 | 43 | |
|---|---|---|---|---|---|---|---|---|
| Parameter | ||||||||
| General characteristics | ||||||||
| Gender | Female | Male | Male | Female | Female | Female | Female | |
| Age | 52 | 71 | 61 | 56 | 49 | 63 | 63 | |
| BMI (kg/m2) | 32.97 | 36.52 | 35.34 | 34.30 | 35.70 | 34.20 | 39.27 | |
| Total adipose tissue (%) | 39.8 | 31.9 | 31.1 | 43.5 | 50.3 | 40.6 | 41.5 | |
| Trunk adipose tissue (%) | 40 | 34.1 | 33.6 | 37.8 | 50 | 39 | 41.1 | |
| Adiponectin (μg/dL) | 9.24 | 9.72 | 11.22 | 17.64 | 5.85 | 13.26 | 17.82 | |
| Leptin (ng/dL) | 19.87 | 18.7 | 13.9 | 46.8 | 44.29 | 22.3 | 13 | |
| Insulin (μUI/mL) | 15.9 | 51.1 | 32.4 | 15.9 | 12.2 | 35.8 | 6.76 | |
| Glucose (mg/dL) | 94 | 156 | 175 | 95 | 98 | 154 | 109 | |
| HOMA-IR | 3.69 | 19.68 | 14 | 3.73 | 2.95 | 13.61 | 1.82 | |
| Total cholesterol (mg/dL) | 240 | 138 | 188 | 237 | 143 | 242 | 298 | |
| LDL cholesterol (mg/dL) | 151 | 85 | 94 | 151 | 89 | 204 | 205 | |
| HDL cholesterol (mg/dL) | 82 | 27 | 20 | 76 | 30 | 50 | 59 | |
| Triglycerides (mg/dL) | 108 | 227 | 432 | 85 | 161 | 152 | 271 | |
| CRP (mg/dL) | 0.29 | 0.29 | 0.20 | 0.29 | 0.40 | 1.22 | 1.75 | |
| Genetic parameters | ||||||||
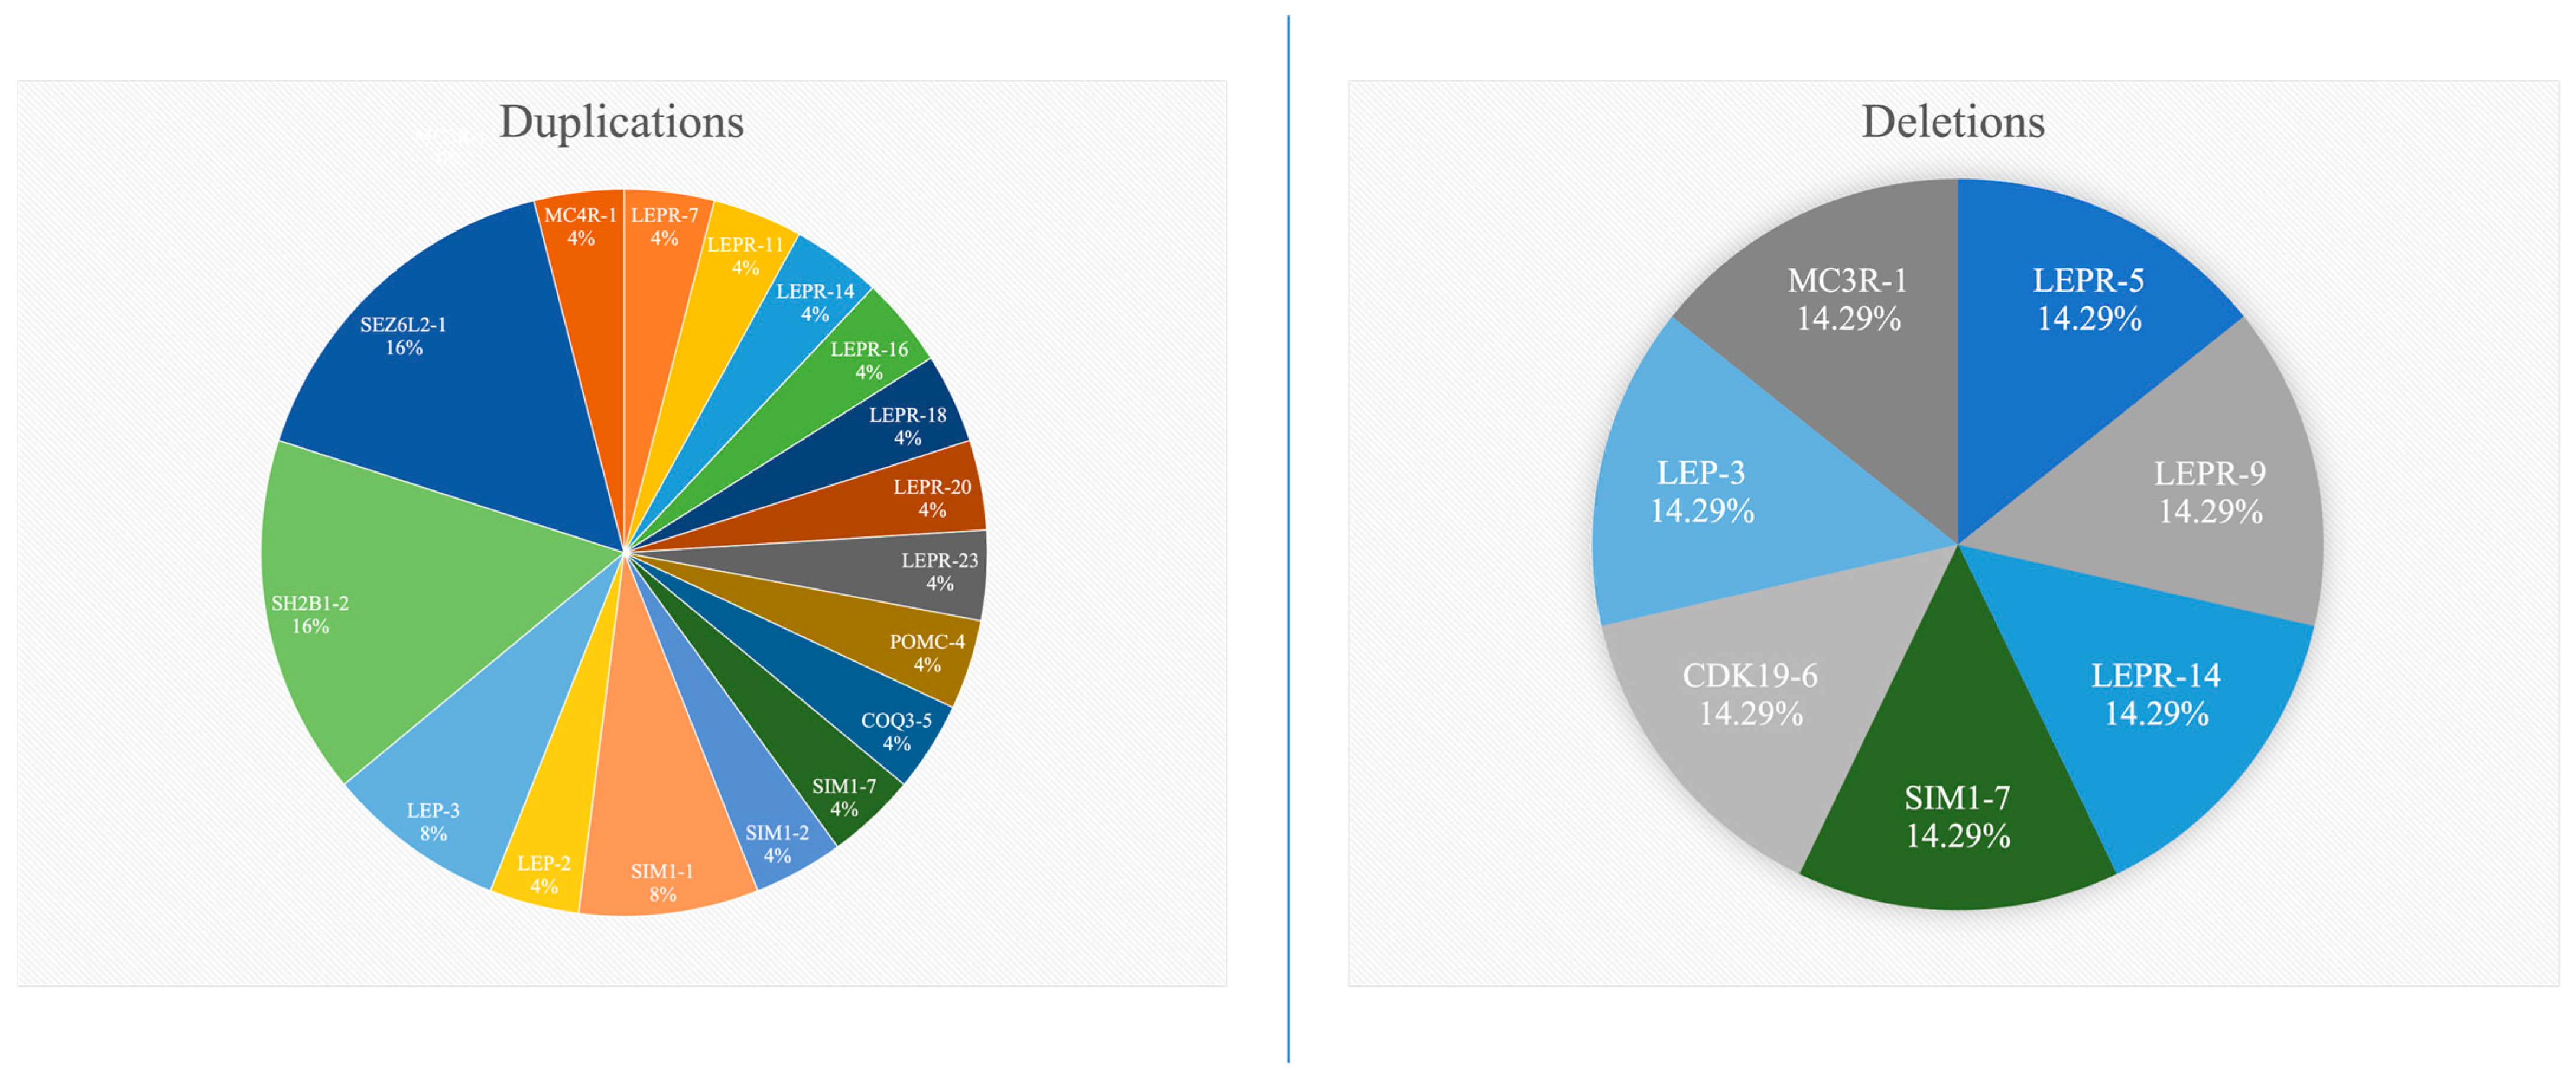
| No. of duplications | 1 | 2 | 2 | 3 | 11 | 3 | 3 | |
| No. of deletions | 0 | 0 | 0 | 0 | 0 | 3 | 4 | |
| LEPR | Dupl(7) e Dupl(11) f Dupl(14) g Dupl(16) h Dupl(18) i Dupl(20) j Dupl(23) k | Del(5) q Del(9) r Del(14) g | ||||||
| LEP | Dupl(3) a | Dupl(2) l | Del(3) a | Dupl(3) a | ||||
| SIM1 | Dupl(1) d | Dupl(7) m | Dupl(1) d Del(7) m | Dupl(2) s | ||||
| POMC | Dupl(4) t | |||||||
| COQ3 | Dupl(5) n | |||||||
| GRIK2 | - | |||||||
| NR2E1 | - | |||||||
| CDK19 | Del(6) u | |||||||
| SH2B1 | Dupl(2) b | Dupl(2) b | Dupl(2) b | Dupl(2) b | ||||
| SEZ6L2 | Dupl(1) c | Dupl(1) c | Dupl(1) c | Dupl(1) c | ||||
| MC4R | Dupl(1) o | |||||||
| MC3R | Del(1) p | |||||||
| MC2R | - | |||||||
Disclaimer/Publisher’s Note: The statements, opinions and data contained in all publications are solely those of the individual author(s) and contributor(s) and not of MDPI and/or the editor(s). MDPI and/or the editor(s) disclaim responsibility for any injury to people or property resulting from any ideas, methods, instructions or products referred to in the content. |
© 2025 by the authors. Licensee MDPI, Basel, Switzerland. This article is an open access article distributed under the terms and conditions of the Creative Commons Attribution (CC BY) license (https://creativecommons.org/licenses/by/4.0/).
Share and Cite
Mitu, I.; Ivanov, I.; Dragoș, L.; Nisioi, E.; Dimitriu, D.-C.; Miftode, L.-I.; Frăsinariu, O.; Trandafir, L.-M.; Popescu, R.; Jitaru, D. Towards Precision Medicine in Obesity: Genetic Copy Number Variations Profiling Linked to Specific Metabolic Dysregulation Patterns. Int. J. Mol. Sci. 2025, 26, 4782. https://doi.org/10.3390/ijms26104782
Mitu I, Ivanov I, Dragoș L, Nisioi E, Dimitriu D-C, Miftode L-I, Frăsinariu O, Trandafir L-M, Popescu R, Jitaru D. Towards Precision Medicine in Obesity: Genetic Copy Number Variations Profiling Linked to Specific Metabolic Dysregulation Patterns. International Journal of Molecular Sciences. 2025; 26(10):4782. https://doi.org/10.3390/ijms26104782
Chicago/Turabian StyleMitu, Ivona, Iuliu Ivanov, Loredana Dragoș, Elena Nisioi, Daniela-Cristina Dimitriu, Larisa-Ionela Miftode, Otilia Frăsinariu, Laura-Mihaela Trandafir, Roxana Popescu, and Daniela Jitaru. 2025. "Towards Precision Medicine in Obesity: Genetic Copy Number Variations Profiling Linked to Specific Metabolic Dysregulation Patterns" International Journal of Molecular Sciences 26, no. 10: 4782. https://doi.org/10.3390/ijms26104782
APA StyleMitu, I., Ivanov, I., Dragoș, L., Nisioi, E., Dimitriu, D.-C., Miftode, L.-I., Frăsinariu, O., Trandafir, L.-M., Popescu, R., & Jitaru, D. (2025). Towards Precision Medicine in Obesity: Genetic Copy Number Variations Profiling Linked to Specific Metabolic Dysregulation Patterns. International Journal of Molecular Sciences, 26(10), 4782. https://doi.org/10.3390/ijms26104782