
Multivariate Spectroscopic Analysis of Protein Secondary Structures in Gingival Crevicular Fluid: Insights from FTIR Amide III Band Across Oral Disease Stages

 ,
,  ,
,  , , and
Abstract
:1. Introduction
2. Results and Discussion
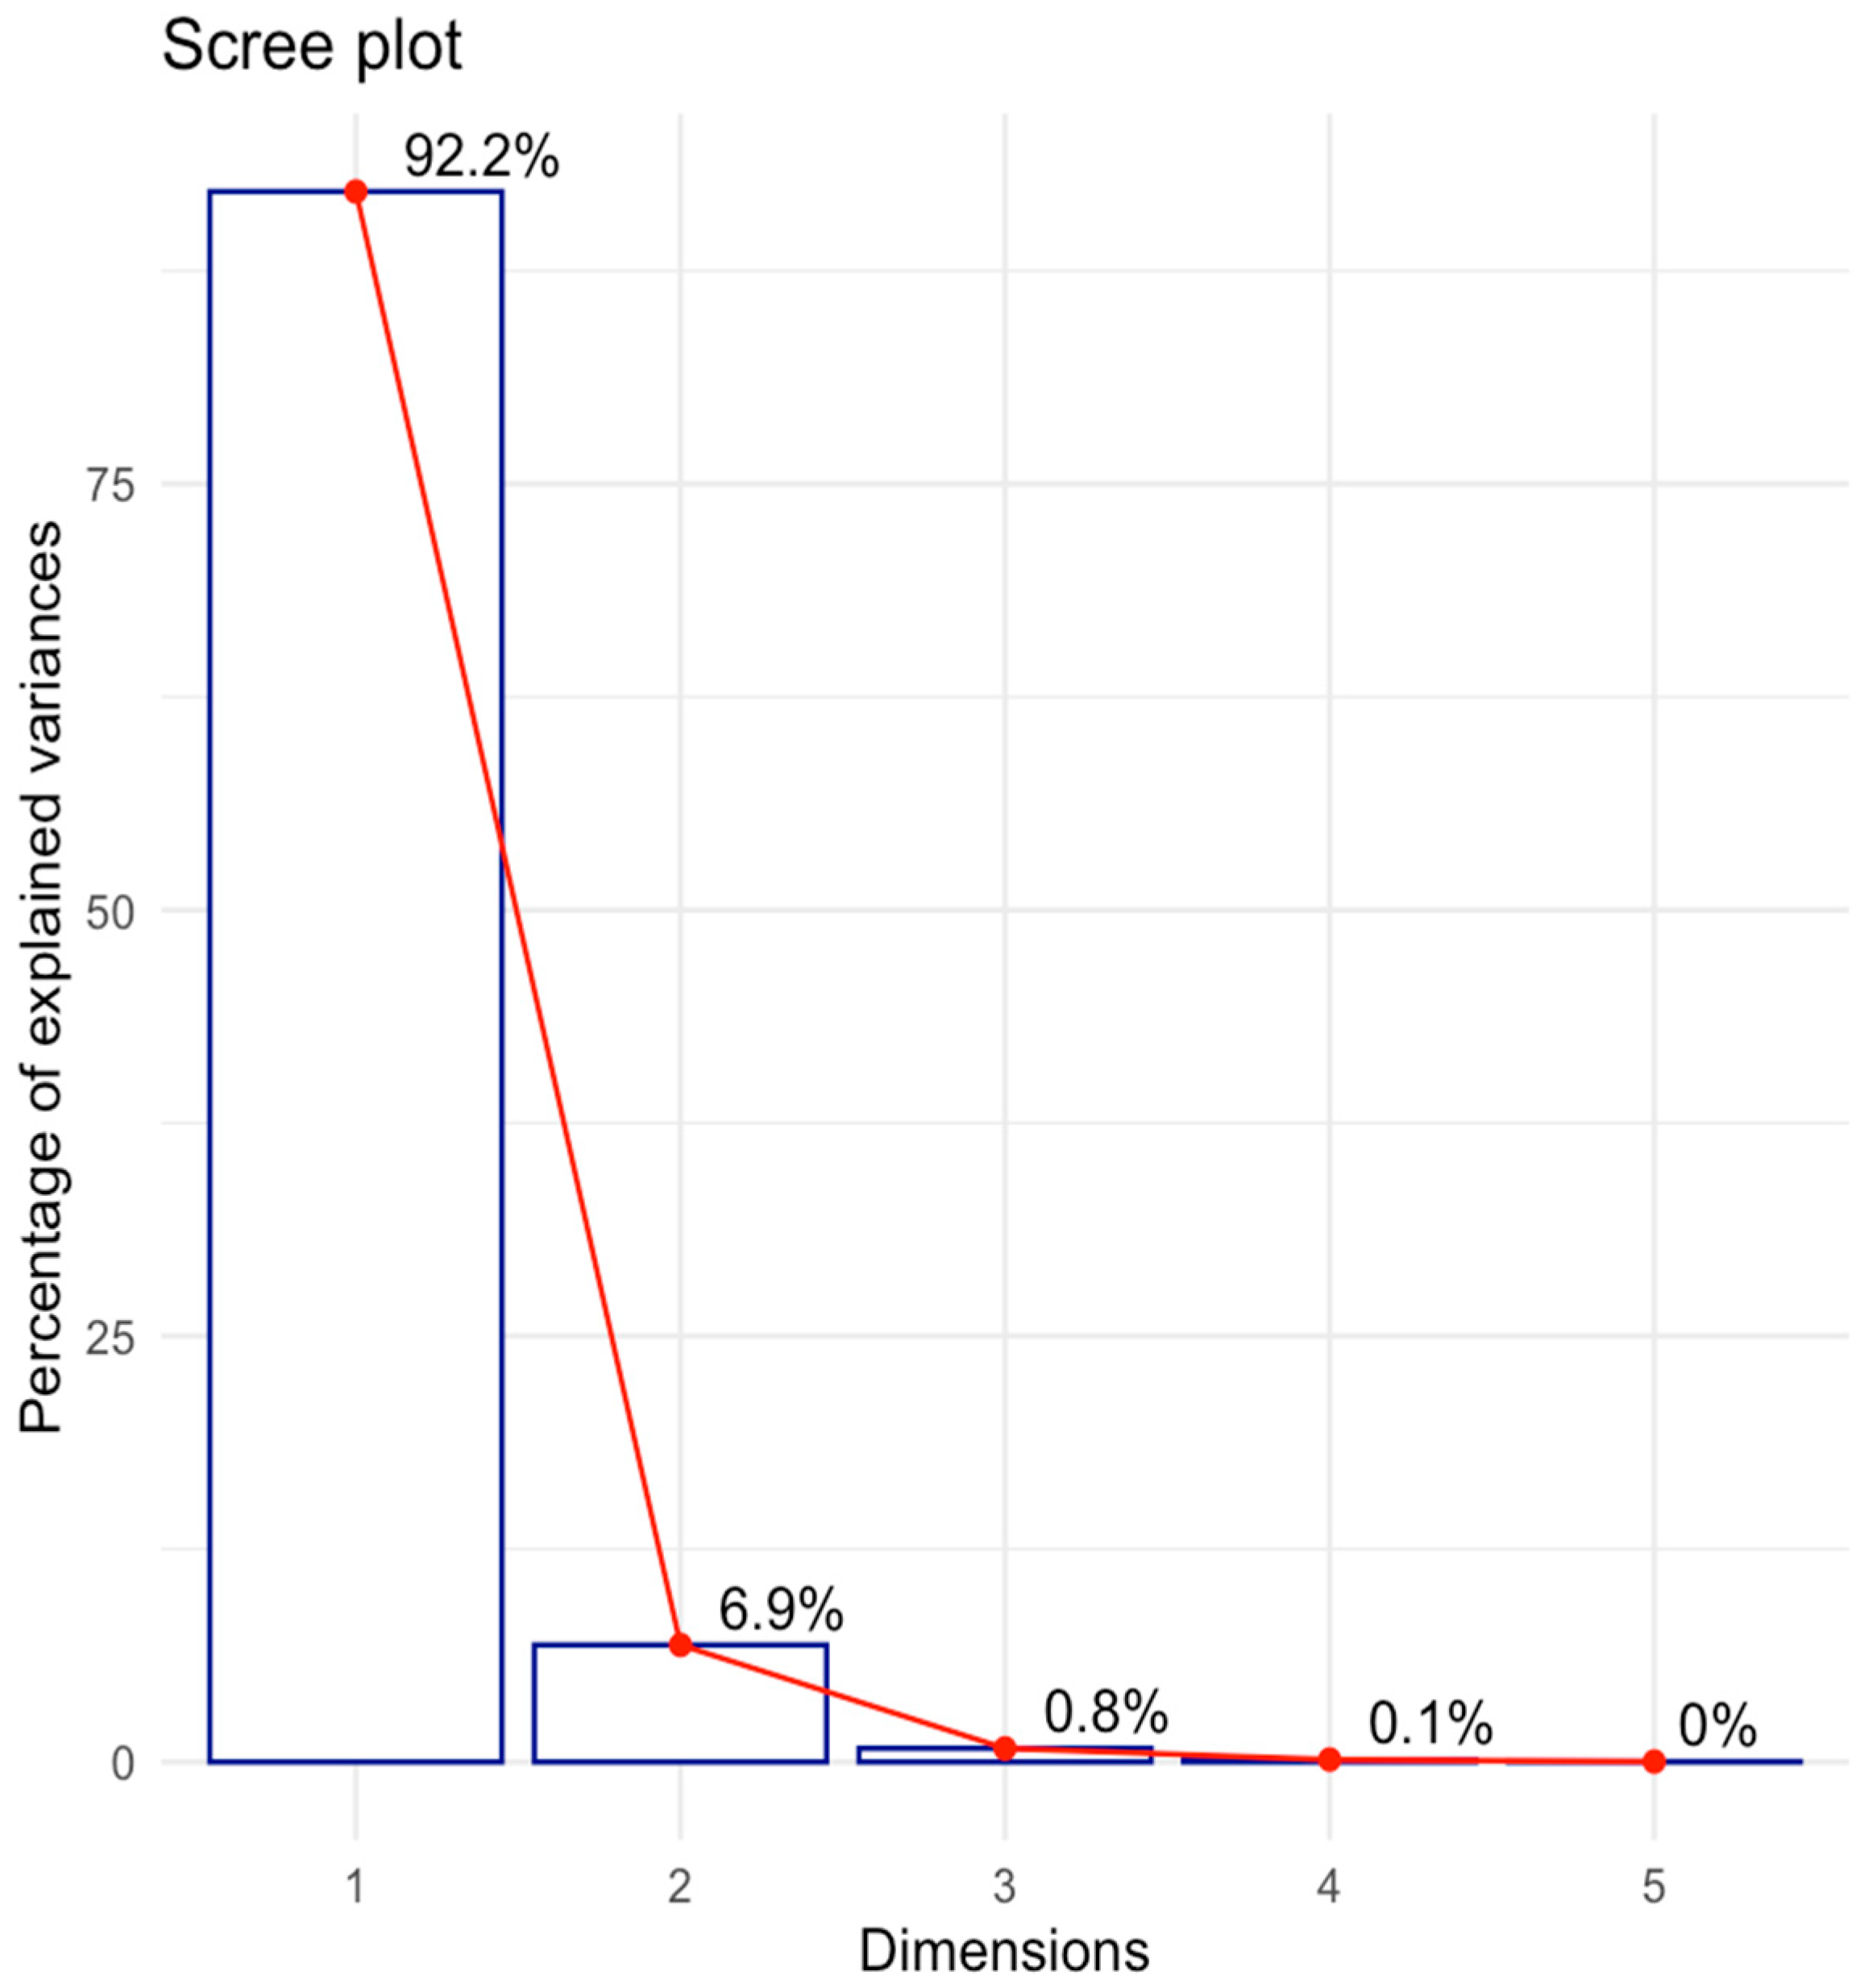
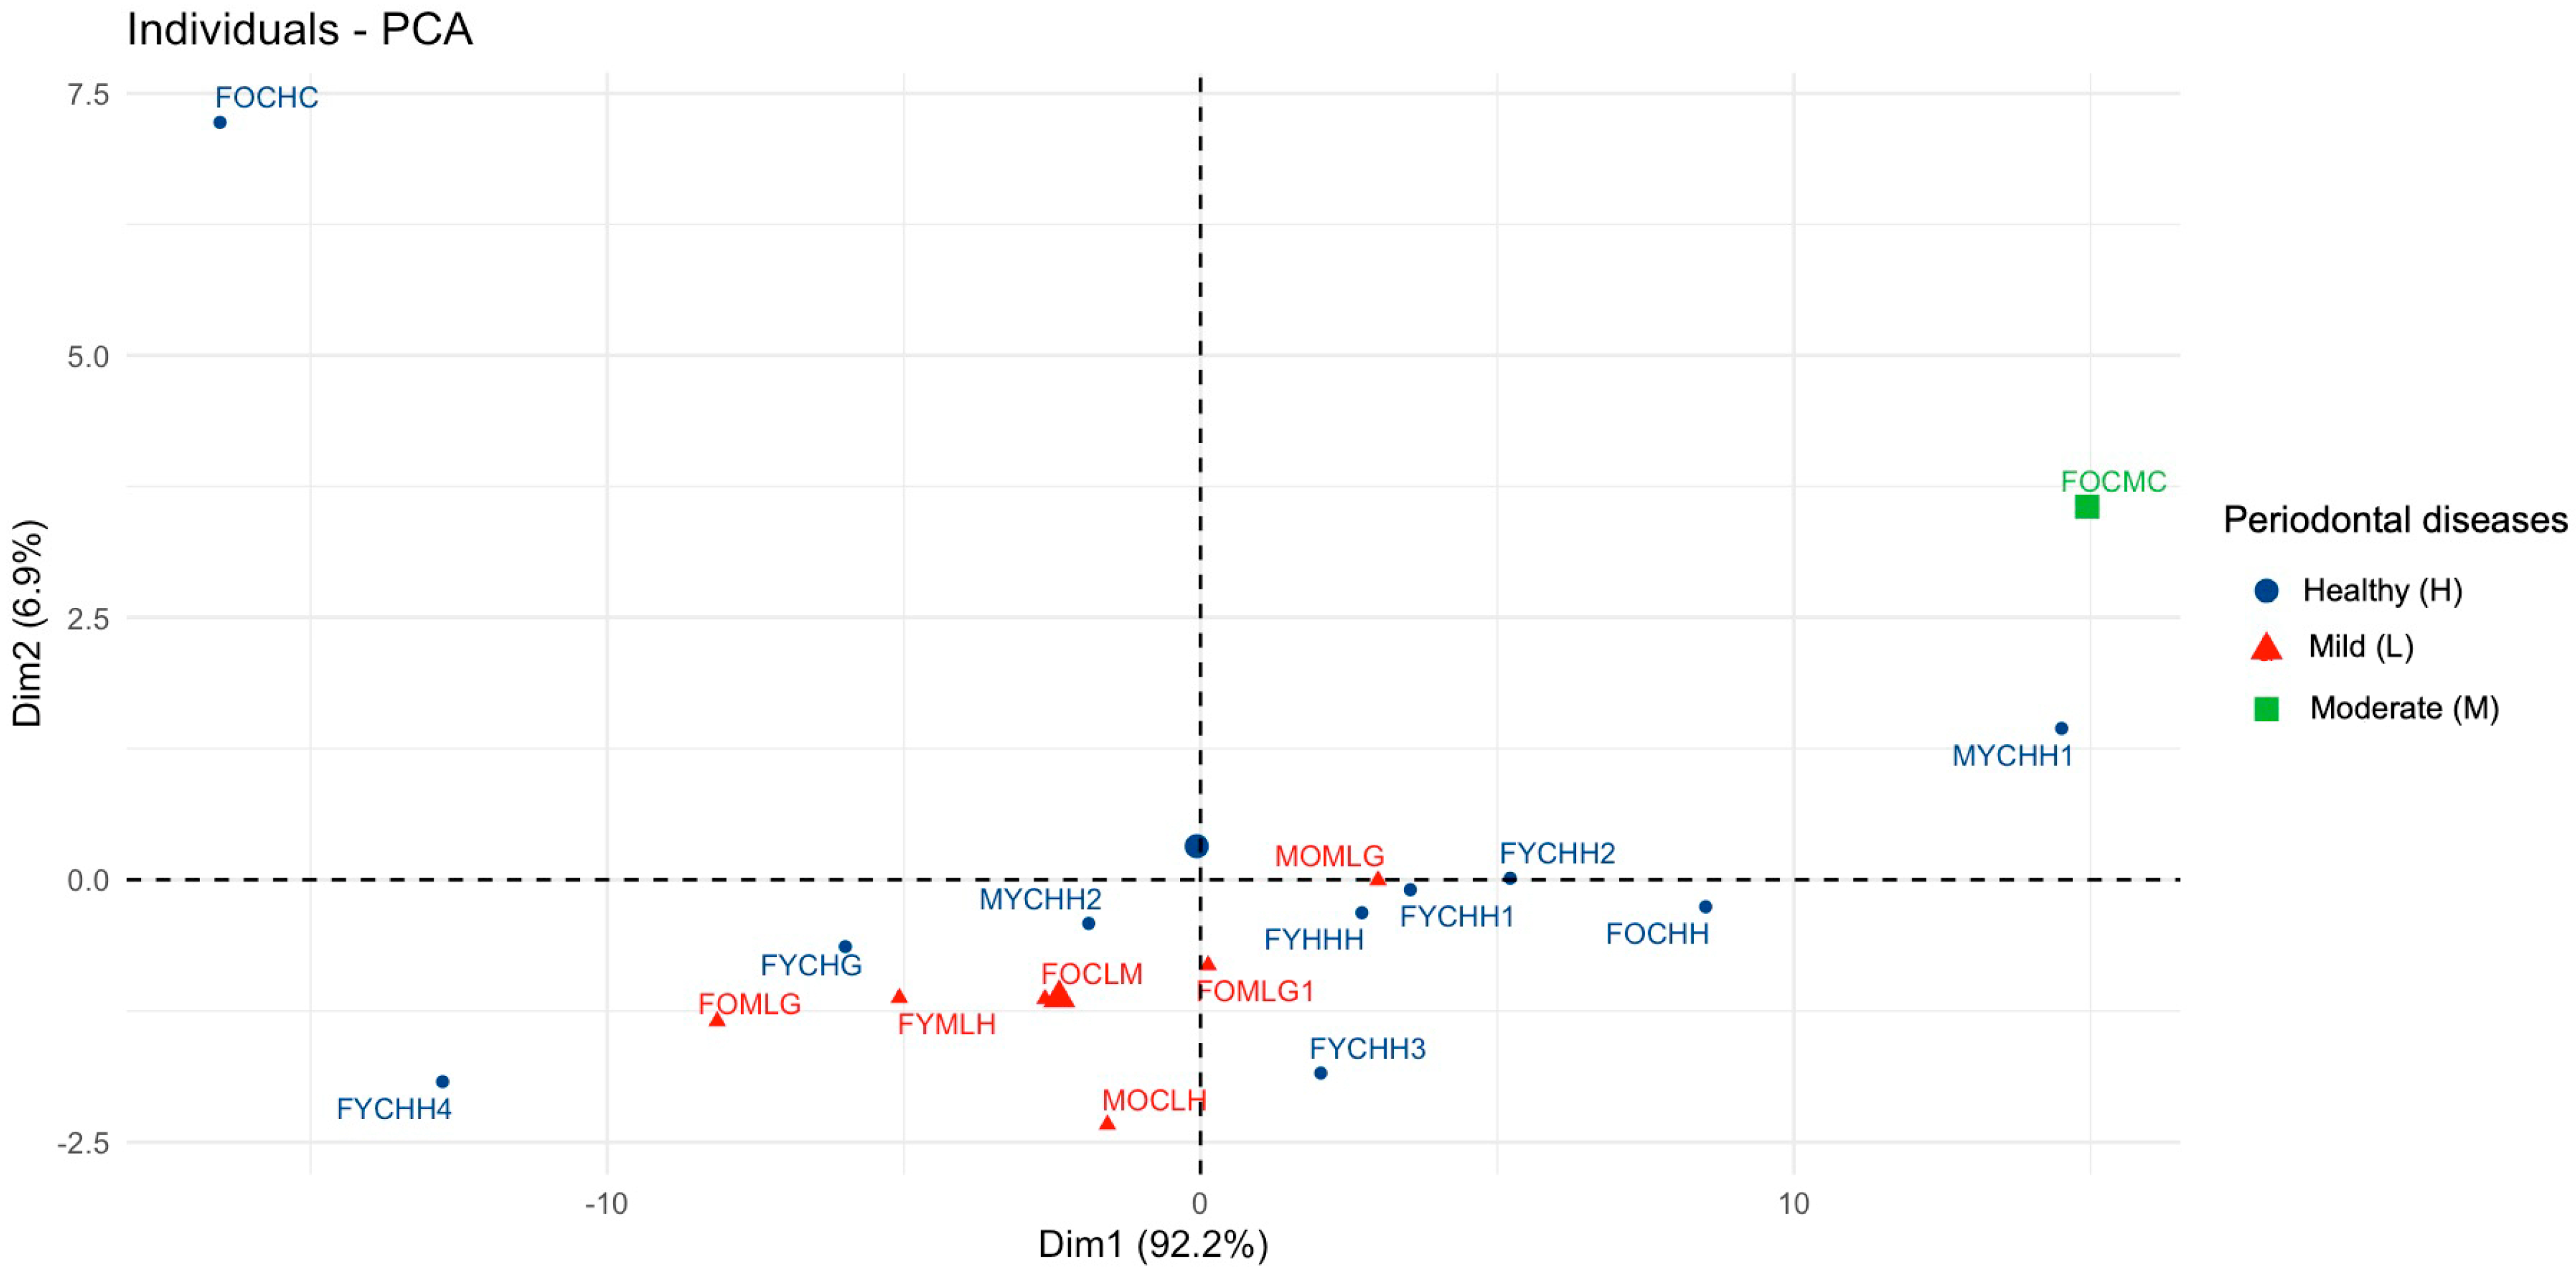
Multivariate Analysis to Uncover Hidden Features and Key Factors of Variation in Spectral Data
3. Materials and Methods
3.1. Experiment Design
3.2. Dataset Description
3.3. Collection of Gingival Crevicular Fluid
3.4. FTIR Spectroscopy
3.5. Spectra Processing
3.6. Methods of Data Analysis
4. Conclusions
Limitations
Author Contributions
Funding
Institutional Review Board Statement
Informed Consent Statement
Data Availability Statement
Acknowledgments
Conflicts of Interest
Abbreviations
| GCF | gingival crevicular fluid |
| FTIR | Fourier Transform Infrared |
| PCA | principal component analysis |
References
- Cuevas-González, M.V.; Cuevas-González, J.C.; Espinosa-Cristóbal, L.F.; Tovar-Carrillo, K.L.; Saucedo-Acuña, R.A.; García-Calderón, A.G.; Reyes-López, S.Y.; Zambrano-Galván, G. The Potential of Gingival Crevicular Fluid as a Tool for Molecular Diagnosis: A Systematic Review. BioMed Res. Int. 2024, 2024, 5560866. [Google Scholar] [CrossRef] [PubMed]
- Buduneli, N.; Bıyıkoğlu, B.; Kinane, D.F. Utility of Gingival Crevicular Fluid Components for Periodontal Diagnosis. Periodontology 2000 2024, 95, 156–175. [Google Scholar] [CrossRef] [PubMed]
- Torres, A.; Michea, M.A.; Végvári, Á.; Arce, M.; Pérez, V.; Alcota, M.; Morales, A.; Vernal, R.; Budini, M.; Zubarev, R.A.; et al. A Multi-Platform Analysis of Human Gingival Crevicular Fluid Reveals Ferroptosis as a Relevant Regulated Cell Death Mechanism during the Clinical Progression of Periodontitis. Int. J. Oral. Sci. 2024, 16, 43. [Google Scholar] [CrossRef] [PubMed]
- Camerlingo, C.; Portaccio, M.; d’Apuzzo, F.; Nucci, L.; Perillo, L.; Delfino, I.; Lepore, M. An Investigation on the Amide I Band in Vibrational Spectra of Gingival Crevicular Fluid during Orthodontic Treatments. In Translational Biophotonics: Diagnostics and Therapeutics III; Lilge, L.D., Huang, Z., Eds.; SPIE: Munich, Germany, 2023; p. 109. [Google Scholar]
- Papagerakis, P.; Zheng, L.; Kim, D.; Said, R.; Ehlert, A.A.; Chung, K.K.M.; Papagerakis, S. Saliva and Gingival Crevicular Fluid (GCF) Collection for Biomarker Screening. In Odontogenesis: Methods and Protocols; Papagerakis, P., Ed.; Springer: New York, NY, USA, 2019; pp. 549–562. ISBN 978-1-4939-9012-2. [Google Scholar]
- Bianchi, S.; Bernardi, S.; Simeone, D.; Torge, D.; Macchiarelli, G.; Marchetti, E. Proliferation and Morphological Assessment of Human Periodontal Ligament Fibroblast towards Bovine Pericardium Membranes: An In Vitro Study. Materials 2022, 15, 8284. [Google Scholar] [CrossRef]
- Baima, G.; Shin, H.-S.; Arrica, M.; Laforí, A.; Cordaro, M.; Romandini, M. The Co-Occurrence of the Two Main Oral Diseases: Periodontitis and Dental Caries. Clin. Oral Investig. 2023, 27, 6483–6492. [Google Scholar] [CrossRef]
- Yu, L.X.; Wang, X.; Feng, X.P.; Tai, B.J.; Hu, D.Y.; Wang, B.; Wang, C.X.; Zheng, S.G.; Liu, X.N.; Rong, W.S.; et al. The Relationship between Different Types of Caries and Periodontal Disease Severity in Middle-Aged and Elderly People: Findings from the 4th National Oral Health Survey of China. BMC Oral Health 2021, 21, 229. [Google Scholar] [CrossRef]
- Mi, J.; Zhi, M.; Kang, W.; Liang, Q.; Tang, D.; Wang, T.; Song, W.; Sun, T.; Li, M.; Shao, J.; et al. Succession of the Oral Microbiome with the Increasing Severity of Periodontitis. VIEW 2024, 5, 20230118. [Google Scholar] [CrossRef]
- Chen, W.; Jiang, Q.; Yan, G.; Yang, D. The Oral Microbiome and Salivary Proteins Influence Caries in Children Aged 6 to 8 Years. BMC Oral Health 2020, 20, 295. [Google Scholar] [CrossRef]
- Fadli, N.A.; Abdul Rahman, M.; Karsani, S.A.; Ramli, R. Oral and Gingival Crevicular Fluid Biomarkers for Jawbone Turnover Diseases: A Scoping Review. Diagnostics 2024, 14, 2184. [Google Scholar] [CrossRef]
- Khurshid, Z.; Mali, M.; Naseem, M.; Najeeb, S.; Zafar, M.S. Human Gingival Crevicular Fluids (GCF) Proteomics: An Overview. Dent. J. 2017, 5, 12. [Google Scholar] [CrossRef]
- Esberg, A.; Kindstedt, E.; Isehed, C.; Lindquist, S.; Holmlund, A.; Lundberg, P. LIGHT Protein: A Novel Gingival Crevicular Fluid Biomarker Associated with Increased Probing Depth after Periodontal Surgery. J. Clin. Periodontol. 2024, 51, 852–862. [Google Scholar] [CrossRef] [PubMed]
- Seredin, P.; Litvinova, T.; Ippolitov, Y.; Goloshchapov, D.; Peshkov, Y.; Kashkarov, V.; Ippolitov, I.; Chae, B. A Study of the Association between Primary Oral Pathologies (Dental Caries and Periodontal Diseases) Using Synchrotron Molecular FTIR Spectroscopy in View of the Patient’s Personalized Clinical Picture (Demographics and Anamnesis). Int. J. Mol. Sci. 2024, 25, 6395. [Google Scholar] [CrossRef] [PubMed]
- Lepore, M.; Portaccio, M.; d’Apuzzo, F.; Nucci, L.; Grassia, V.; Annunziata, M.; Camerlingo, C. Rapid Acquisition of Gingival Crevicular Fluid FT-IR Spectra for Monitoring Orthodontic Treatments. In Proceedings of the 2024 IEEE Sensors Applications Symposium (SAS), Naples, Italy, 23–25 July 2024; pp. 1–5. [Google Scholar]
- Santiago-Gómez, I.; Carrera-Lanestosa, A.; González-Alejo, F.A.; Guerra-Que, Z.; García-Alamilla, R.; Rivera-Armenta, J.L.; García-Alamilla, P. Pectin Extraction Process from Cocoa Pod Husk (Theobroma cacao L.) and Characterization by Fourier Transform Infrared Spectroscopy. ChemEngineering 2025, 9, 25. [Google Scholar] [CrossRef]
- Seredin, P.; Kashkarov, V.; Lukin, A.; Ippolitov, Y.; Julian, R.; Doyle, S. Local Study of Fissure Caries by Fourier Transform Infrared Microscopy and X-Ray Diffraction Using Synchrotron Radiation. J. Synchrotron Radiat. 2013, 20, 705–710. [Google Scholar] [CrossRef]
- Portaccio, M.; d’Apuzzo, F.; Perillo, L.; Grassia, V.; Errico, S.; Lepore, M. Infrared Microspectroscopy Characterization of Gingival Crevicular Fluid during Orthodontic Treatment. J. Mol. Struct. 2019, 1176, 847–854. [Google Scholar] [CrossRef]
- De Meutter, J.; Goormaghtigh, E. Searching for a Better Match between Protein Secondary Structure Definitions and Protein FTIR Spectra. Anal. Chem. 2021, 93, 1561–1568. [Google Scholar] [CrossRef]
- Seredin, P.; Goloshchapov, D.; Kashkarov, V.; Lukin, A.; Peshkov, Y.; Ippolitov, I.; Ippolitov, Y.; Litvinova, T.; Vongsvivut, J.; Chae, B.; et al. Changes in Dental Biofilm Proteins’ Secondary Structure in Groups of People with Different Cariogenic Situations in the Oral Cavity and Using Medications by Means of Synchrotron FTIR-Microspectroscopy. Int. J. Mol. Sci. 2023, 24, 15324. [Google Scholar] [CrossRef]
- Cai, S.; Singh, B.R. Identification of Beta-Turn and Random Coil Amide III Infrared Bands for Secondary Structure Estimation of Proteins. Biophys. Chem. 1999, 80, 7–20. [Google Scholar] [CrossRef]
- Elsharkawy, S.; Al-Jawad, M.; Pantano, M.F.; Tejeda-Montes, E.; Mehta, K.; Jamal, H.; Agarwal, S.; Shuturminska, K.; Rice, A.; Tarakina, N.V.; et al. Protein Disorder–Order Interplay to Guide the Growth of Hierarchical Mineralized Structures. Nat. Commun. 2018, 9, 2145. [Google Scholar] [CrossRef]
- Ye, S.; Li, H.; Yang, W.; Luo, Y. Accurate Determination of Interfacial Protein Secondary Structure by Combining Interfacial-Sensitive Amide I and Amide III Spectral Signals. J. Am. Chem. Soc. 2014, 136, 1206–1209. [Google Scholar] [CrossRef]
- Tołpa, B.; Paja, W.; Jakubczyk, P.; Łach, K.; Trojnar, E.; Gala-Błądzińska, A.; Kowal, A.; Klębowski, B.; Cebulski, J.; Depciuch, J. Differentiation of Glioblastoma G4 and Two Types of Meningiomas Using FTIR Spectra and Machine Learning. Anal. Biochem. 2025, 699, 115754. [Google Scholar] [CrossRef] [PubMed]
- Mishra, A.; Zehra, S.; Bharti, P.K.; Mathur, S.R.; Ranjan, P.; Batra, A.; Inampudi, K.K.; Modi, G.P.; Nikolajeff, F.; Kumar, S. Spectroscopic Insight into Breast Cancer: Profiling Small Extracellular Vesicles Lipids via Infrared Spectroscopy for Diagnostic Precision. Sci. Rep. 2024, 14, 9347. [Google Scholar] [CrossRef] [PubMed]
- Froelich, N.M.; Azcarate, S.M.; Goicoechea, H.C.; Campiglia, A.D. Differentiating Nylon Samples with Visually Indistinguishable Fluorescence Using Principal Component Analysis and Common Dimension Partial Least Squares Linear Discriminant Analysis with Synchronous Fluorescence Spectroscopy. Appl. Spectrosc. 2024, 78, 962–973. [Google Scholar] [CrossRef]
- Shehnaz, H.; Ashraf, A.; Majeed, M.I.; Nawaz, H.; Afzal, M.; Majeed, M.Z.; Jilani, M.I.; Akram, M.W.; Razaq, R.; Sultan, E.; et al. Identification of Adulterated Cooking Oil by Raman Spectroscopy. Food Anal. Methods 2024, 17, 997–1004. [Google Scholar] [CrossRef]
- Hasanuddin; Munawar, A.A. Distinguishing Weed Species Using Near Infrared Reflectance Spectroscopy and Principal Component Analysis. IJDNE 2024, 19, 779–785. [Google Scholar] [CrossRef]
- Szymańska-Chargot, M.; Pękala, P.; Siemińska-Kuczer, A.; Zdunek, A. A Determination of the Composition and Structure of the Polysaccharides Fractions Isolated from Apple Cell Wall Based on FT-IR and FT-Raman Spectra Supported by PCA Analysis. Food Hydrocoll. 2024, 150, 109688. [Google Scholar] [CrossRef]
- Guimarães, L.L.; Nita, L.P.M.D.S.R.; Toma, W.; Pacheco, M.T.T.; Silveira, L. Characterization of the Degradation of Dipyrone (Metamizole) in Expired Oral Pharmaceutical Products by Raman Spectroscopy and Principal Component Analysis (PCA). Instrum. Sci. Technol. 2023, 51, 479–494. [Google Scholar] [CrossRef]
- Siraji, M.A.; Rahman, M. Primer on Reproducible Research in R: Enhancing Transparency and Scientific Rigor. Clocks Sleep 2023, 6, 1–10. [Google Scholar] [CrossRef]
- Cattell, R.B. The Scree Test For The Number Of Factors. Multivar. Behav. Res. 1966, 1, 245–276. [Google Scholar] [CrossRef]
- Kutner, M.H. (Ed.) Applied Linear Statistical Models, 5th ed.; The McGraw-Hill/Irwin Series Operations and Decision Sciences; McGraw-Hill Irwin: Boston, MA, USA, 2005; ISBN 978-0-07-238688-2. [Google Scholar]
- Seredin, P.; Goloshchapov, D.; Kashkarov, V.; Nesterov, D.; Ippolitov, Y.; Ippolitov, I.; Vongsvivut, J. Effect of Exo/Endogenous Prophylaxis Dentifrice/Drug and Cariogenic Conditions of Patient on Molecular Property of Dental Biofilm: Synchrotron FTIR Spectroscopic Study. Pharmaceutics 2022, 14, 1355. [Google Scholar] [CrossRef]
- Orphanou, C.-M. The Detection and Discrimination of Human Body Fluids Using ATR FT-IR Spectroscopy. Forensic Sci. Int. 2015, 252, e10–e16. [Google Scholar] [CrossRef] [PubMed]
- Bel’skaya, L.V.; Sarf, E.A.; Solomatin, D.V. Age and Gender Characteristics of the Infrared Spectra of Normal Human Saliva. Appl. Spectrosc. 2020, 74, 536–543. [Google Scholar] [CrossRef] [PubMed]
- Lopes, J.; Correia, M.; Martins, I.; Henriques, A.G.; Delgadillo, I.; da Cruz e Silva, O.; Nunes, A. FTIR and Raman Spectroscopy Applied to Dementia Diagnosis Through Analysis of Biological Fluids. J. Alzheimer’s Dis. 2016, 52, 801–812. [Google Scholar] [CrossRef]
- Camerlingo, C.; Portaccio, M.; d’Apuzzo, F.; Nucci, L.; Perillo, L.; Lepore, M. μ-FTIR, μ-Raman, and SERS Analysis of Amide I Spectral Region in Oral Biofluid Samples during Orthodontic Treatment. Sensors 2022, 22, 7874. [Google Scholar] [CrossRef]
- d’Apuzzo, F.; Nucci, L.; Delfino, I.; Portaccio, M.; Minervini, G.; Isola, G.; Serino, I.; Camerlingo, C.; Lepore, M. Application of Vibrational Spectroscopies in the Qualitative Analysis of Gingival Crevicular Fluid and Periodontal Ligament during Orthodontic Tooth Movement. J. Clin. Med. 2021, 10, 1405. [Google Scholar] [CrossRef]
- Carrasquillo, K.G.; Sanchez, C.; Griebenow, K. Relationship between Conformational Stability and Lyophilization-Induced Structural Changes in Chymotrypsin. Biotechnol. Appl. Biochem. 2000, 31, 41. [Google Scholar] [CrossRef]
- Stani, C.; Vaccari, L.; Mitri, E.; Birarda, G. FTIR Investigation of the Secondary Structure of Type I Collagen: New Insight into the Amide III Band. Spectrochim. Acta Part. A Mol. Biomol. Spectrosc. 2020, 229, 118006. [Google Scholar] [CrossRef]
- Singh, B.R.; DeOliveira, D.B.; Fu, F.-N.; Fuller, M.P. Fourier Transform Infrared Analysis of Amide III Bands of Proteins for the Secondary Structure Estimation. In Biomolecular Spectroscopy III; Nafie, L.A., Mantsch, H.H., Eds.; SPIE: Los Angeles, CA, USA, 1993; pp. 47–55. [Google Scholar]
- Ling, S.; Qi, Z.; Knight, D.P.; Shao, Z.; Chen, X. Synchrotron FTIR Microspectroscopy of Single Natural Silk Fibers. Biomacromolecules 2011, 12, 3344–3349. [Google Scholar] [CrossRef]
- Ricciardi, V.; Portaccio, M.; Perna, G.; Lasalvia, M.; Capozzi, V.; Cammarata, F.P.; Pisciotta, P.; Petringa, G.; Delfino, I.; Manti, L.; et al. FT-IR Transflection Micro-Spectroscopy Study on Normal Human Breast Cells after Exposure to a Proton Beam. Appl. Sci. 2021, 11, 540. [Google Scholar] [CrossRef]
- Griebenow, K.; Santos, A.M.; Carrasquillo, K.G. Secondary Structure of Proteins in the Amorphous Dehydrated State Probed by FTIR Spectroscopy. Dehydration-Induced Structural Changes and Their Prevention. Internet J. Vib. Spectrosc. 1999, 3, 1–34. [Google Scholar]
- Lam, G.A.; Albarrak, H.; McColl, C.J.; Pizarro, A.; Sanaka, H.; Gomez-Nguyen, A.; Cominelli, F.; Paes Batista da Silva, A. The Oral-Gut Axis: Periodontal Diseases and Gastrointestinal Disorders. Inflamm. Bowel Dis. 2023, 29, 1153–1164. [Google Scholar] [CrossRef] [PubMed]
- Hajishengallis, G.; Chavakis, T. Local and Systemic Mechanisms Linking Periodontal Disease and Inflammatory Comorbidities. Nat. Rev. Immunol. 2021, 21, 426–440. [Google Scholar] [CrossRef] [PubMed]
- Ghimire, H.; Garlapati, C.; Janssen, E.A.M.; Krishnamurti, U.; Qin, G.; Aneja, R.; Perera, A.G.U. Protein Conformational Changes in Breast Cancer Sera Using Infrared Spectroscopic Analysis. Cancers 2020, 12, 1708. [Google Scholar] [CrossRef] [PubMed]
- Wei, X.; Wang, X.; Fang, Y.; Huang, Q. Comparison of Hair from Rectum Cancer Patients and from Healthy Persons by Raman Microspectroscopy and Imaging. J. Mol. Struct. 2013, 1048, 83–87. [Google Scholar] [CrossRef]
- Seredin, P.; Goloshchapov, D.; Ippolitov, Y.; Vongsvivut, J. Spectroscopic Signature of the Pathological Processes of Carious Dentine Based on FTIR Investigations of the Oral Biological Fluids. Biomed. Opt. Express 2019, 10, 4050–4058. [Google Scholar] [CrossRef]
- Toczewska, J.; Baczyńska, D.; Zalewska, A.; Maciejczyk, M.; Konopka, T. The mRNA Expression of Genes Encoding Selected Antioxidant Enzymes and Thioredoxin, and the Concentrations of Their Protein Products in Gingival Crevicular Fluid and Saliva during Periodontitis. Dent. Med. Probl. 2023, 60, 255–265. [Google Scholar] [CrossRef]
- Seredin, P.; Goloshchapov, D.; Ippolitov, Y.; Vongsvivut, J. Comparative Analysis of Dentine and Gingival Fluid Molecular Composition and Protein Conformations during Development of Dentine Caries: A Pilot Study. Vib. Spectrosc. 2020, 108, 103058. [Google Scholar] [CrossRef]
- Saloom, H.F.; Carpenter, G.H. Saliva and Gingival Crevicular Fluid: Contributions to Mucosal Defense. In Oral Mucosa in Health and Disease: A Concise Handbook; Bergmeier, L.A., Ed.; Springer International Publishing: Cham, Switzerland, 2018; pp. 91–103. ISBN 978-3-319-56065-6. [Google Scholar]
- Husson, F.; Lê, S.; Pagès, J. Exploratory Multivariate Analysis by Example Using R, 2nd ed.; Computer Science and Data Analysis Series; CRC Press Taylor & Francis Group: Boca Raton, FL, USA; London, UK; New York, NY, USA, 2017; ISBN 978-0-367-65802-1. [Google Scholar]
- FactoMineR: Catdes. Available online: http://factominer.free.fr/factomethods/categories-description.html (accessed on 11 April 2024).
- Kassambara, A.; Mundt, F. Factoextra: Extract and Visualize the Results of Multivariate Data Analyses. Available online: https://kassambara.r-universe.dev/factoextra/factoextra.pdf (accessed on 11 May 2025).
- Arnholt, A.; Evans, B. BSDA: Basic Statistics and Data Analysis. Available online: https://cran.r-project.org/web/packages/BSDA/BSDA.pdf (accessed on 11 May 2025).
- Lee, S.; Lee, D.K. What Is the Proper Way to Apply the Multiple Comparison Test? Korean J. Anesthesiol. 2018, 71, 353–360. [Google Scholar] [CrossRef]
- Wickham, H. Ggplot2: Elegant Graphics for Data Analysis, 2nd ed.; Use R! Springer International Publishing: Cham, Switzerland, 2016; ISBN 978-3-319-24277-4. [Google Scholar]


| Factor (Categorical Variable) | Factor Levels with Corresponding Distance Values | |||
|---|---|---|---|---|
| Gender | Female | Male | ||
| 1.08 | 3.53 | |||
| Age | Old | Young | ||
| 0.7 | 0.6 | |||
| Caries | Healthy | Initial | Multiple | |
| 2.8 | 0.6 | 2.7 | ||
| Periodontal diseases | Healthy | Mild periodontitis | Moderate periodontitis | |
| 0.4 | 2.65 | 15.42 | ||
| Comorbidities | Oncological disease | Gastrointestinal diseases | Healthy | Multiple pathologies |
| 5.47 | 2.89 | 1.7 | 2.85 | |
| Participant Identifier | Gender | Age | Caries | Periodontal Diseases | Comorbidities |
|---|---|---|---|---|---|
| FYHHH | F | Y | H | H | H |
| FOCHH | F | O | C | H | H |
| FOCMC | F | O | C | M | C |
| FOMLG | F | O | M | L | G |
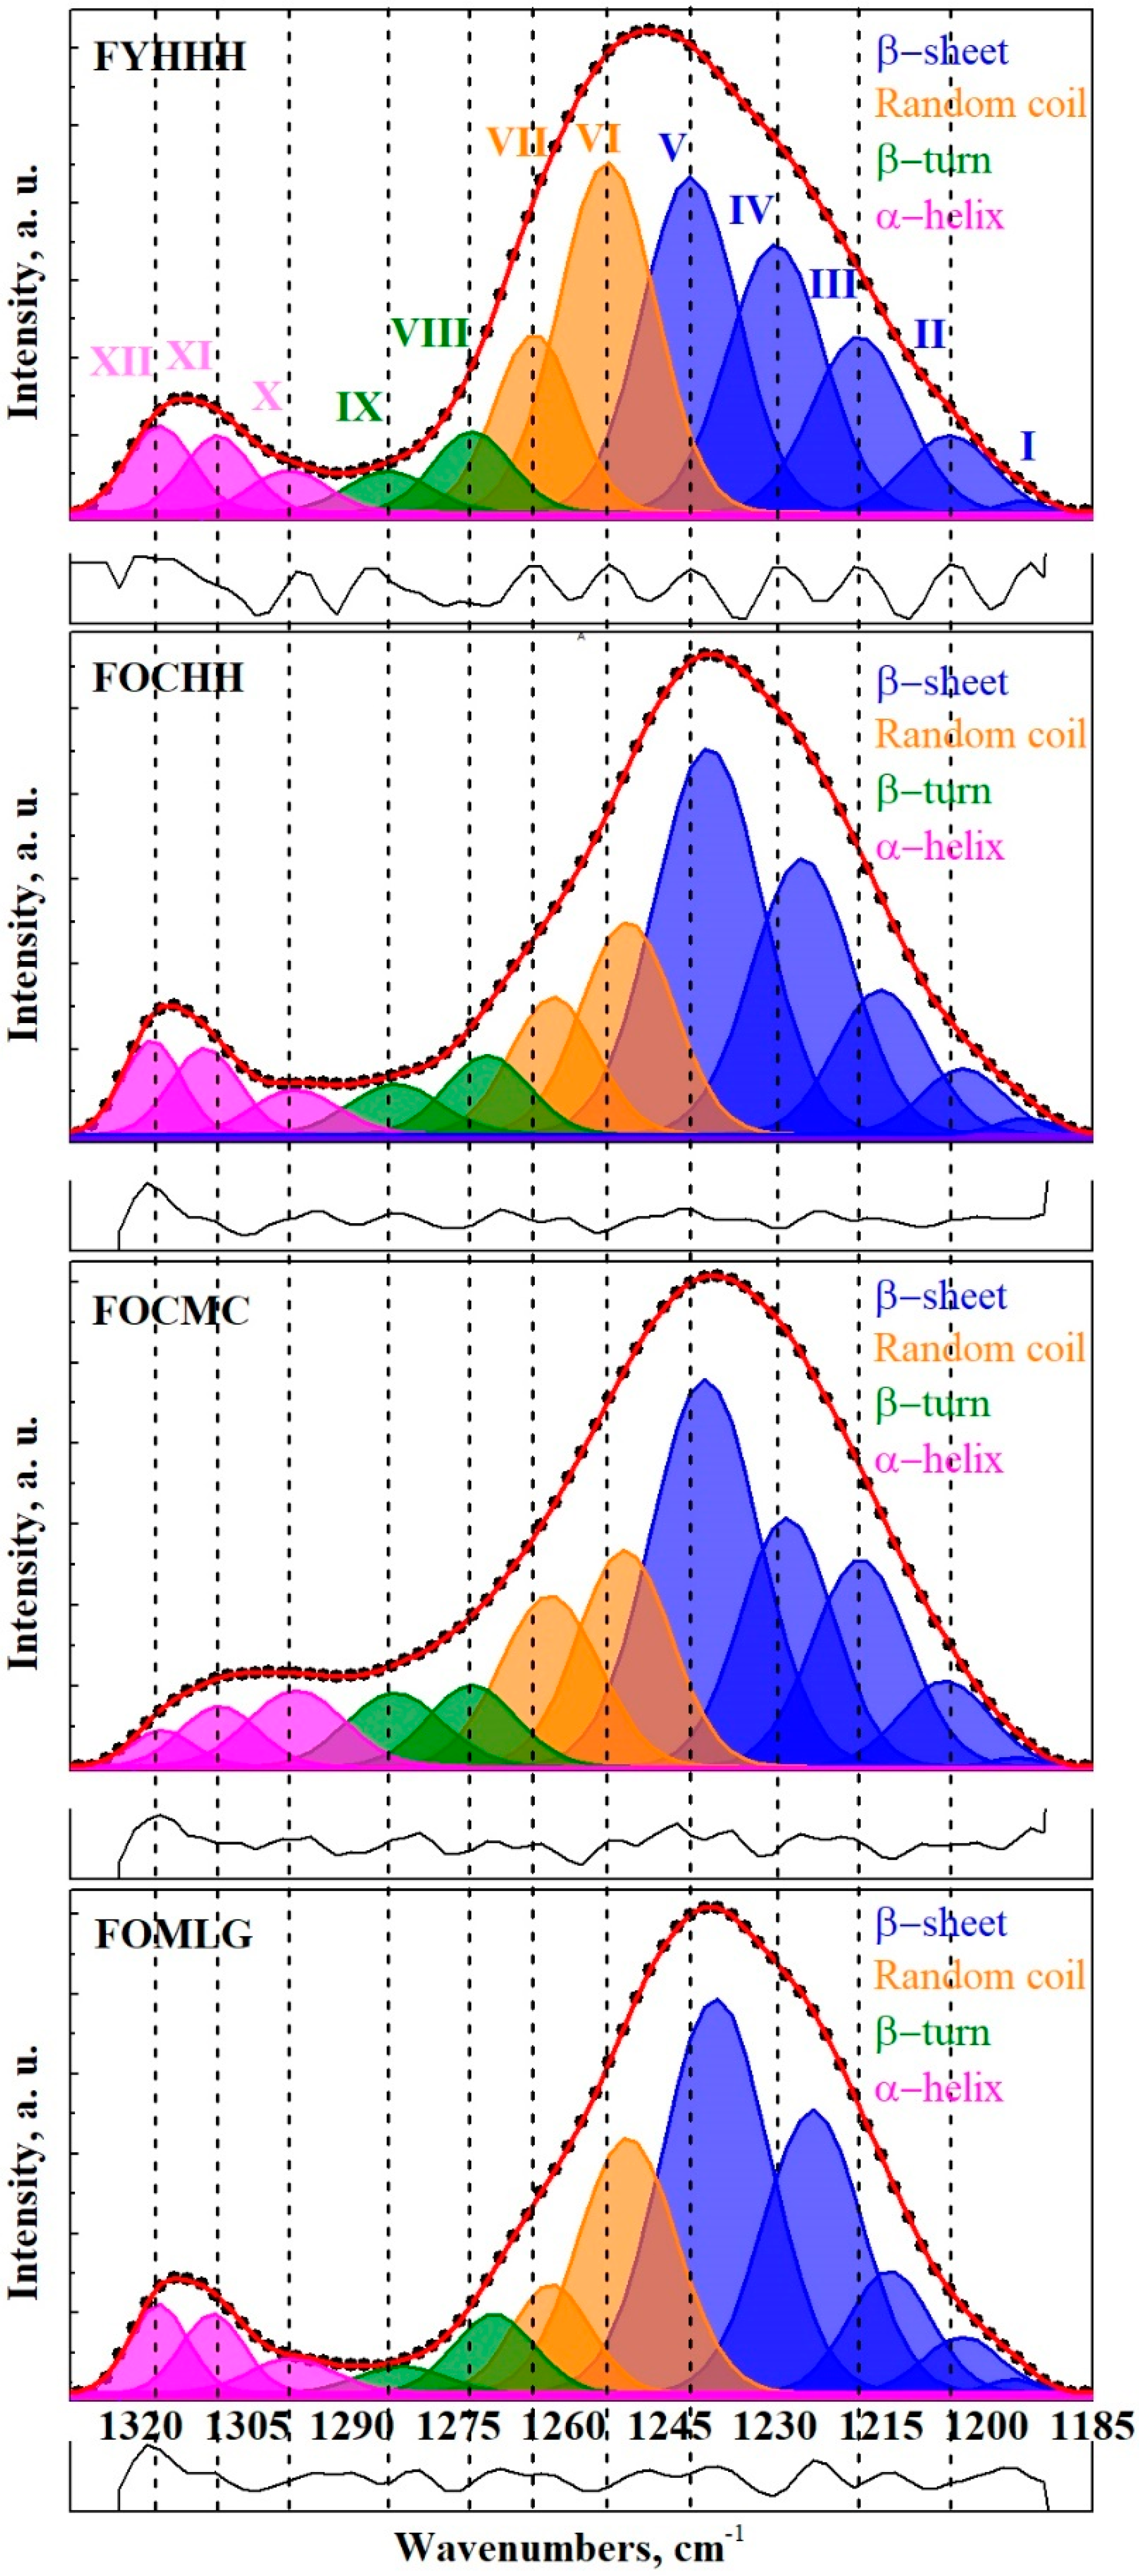
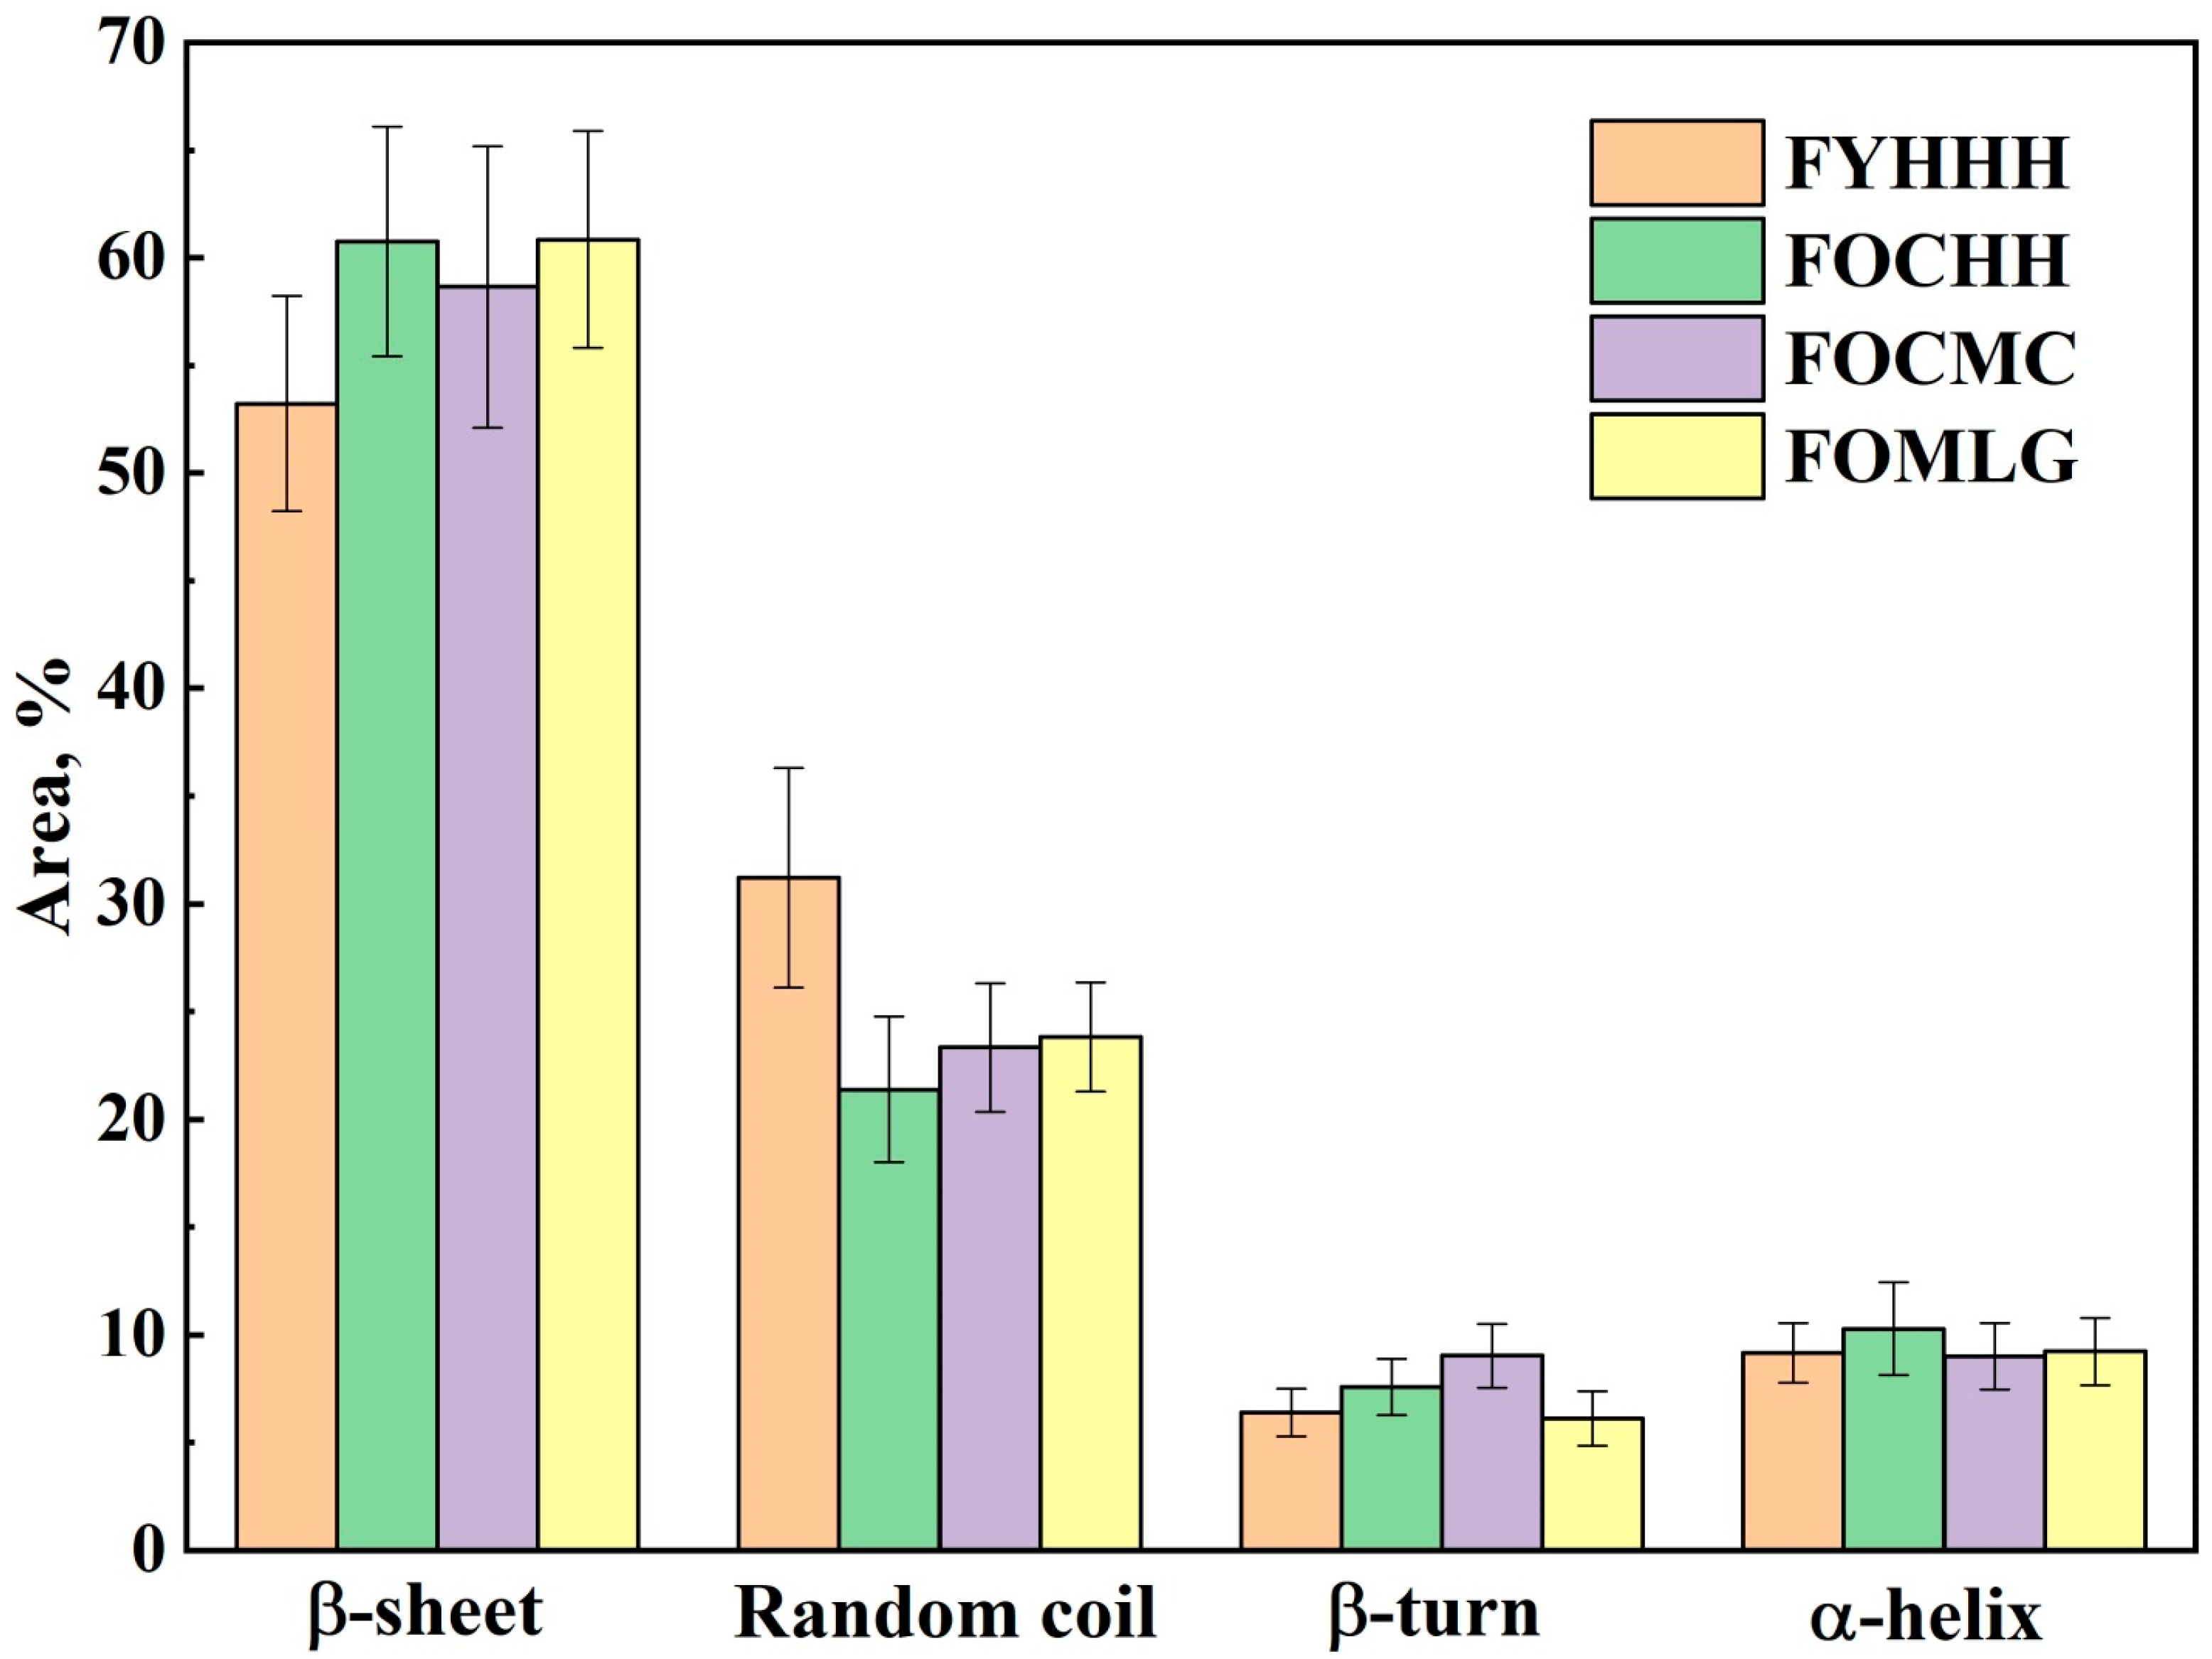
| Component | Assignment [21,22,23,40,41,42,43] | FYHHH | FOCHH | FOCMC | FOMLG |
|---|---|---|---|---|---|
| Wavenumber, cm−1 Integ. Int., % FWHM, cm−1 | Wavenumber, cm−1 Integ. Int., % FWHM, cm−1 | Wavenumber, cm−1 Integ. Int., % FWHM, cm−1 | Wavenumber, cm−1 Integ. Int., % FWHM, cm−1 | ||
| XII | α-helix | 1317.3 (±0.7) | 1318.4 (±0.9) | 1317.0 (±0.9) | 1317.5 (±0.8) |
| 3.7 (±0.60) | 3.8 (±0.35) | 1.4 (±0.15 | 3.6 (±0.68) | ||
| 7.4 (±0.5) | 9.2 (±0.3) | 8.0 (±0.4) | 8.1 (±0.4) | ||
| XI | α-helix | 1309.2 (±0.6) | 1310.9 (±0.9) | 1308.8 (±0.7) | 1309.8 (±0.8) |
| 3.4 (±0.30) | 4.0 (±1.05) | 3.0 (±0.31) | 3.5 (±0.34) | ||
| 14.3 (±0.4) | 13.7 (±0.5) | 15.0 (±0.3) | 13.0 (±0.6) | ||
| X | α-helix | 1299.0 (±0.7) | 1298.1 (±0.6) | 1298.0 (±0.7) | 1298.6 (±0.6) |
| 2.1 (±0.30) | 2.5 (±0.35) | 4.6 (±0.76) | 2.1 (±0.34) | ||
| 15.7 (±0.5) | 15.3 (±0.6) | 16.0 (±0.3) | 13.9 (±0.6) | ||
| IX | β-turn | 1285.0 (±0.9) | 1283.9 (±1.0) | 1284.0 (±0.6) | 1283.0 (±1.1) |
| 2.2 (±0.30) | 3.1 (±0.35) | 4.5 (±0.61) | 1.6 (±0.34) | ||
| 16.0 (±0.6) | 16.8 (±0.5) | 15.5 (±0.7) | 16.5 (±0.4) | ||
| VIII | β-turn | 1273.0 (±0.8) | 1270.8 (±0.9) | 1273.0 (±0.6) | 1269.9 (±0.6) |
| 4.2 (±0.60) | 4.5 (±0.70) | 4.6 (±0.76) | 4.5 (±0.68) | ||
| 16.0 (±0.5) | 18.0 (±0.5) | 18.0 (±0.6) | 18.0 (±0.5) | ||
| VII | Random coil | 1264.2 (±0.7) | 1261.5 (±0.7) | 1262.0 (±0.8) | 1261.8 (±0.9) |
| 9.3 (±1.51) | 8.0 (±1.74) | 10.6 (±1.22) | 6.0 (±0.68) | ||
| 16.0 (±0.4) | 15.4 (±0.5) | 15.6 (±0.6) | 16.4 (±0.6) | ||
| VI | Random coil | 1253.9 (±0.8) | 1251.0 (±1.0) | 1251.5 (±0.6) | 1251.0 (±0.9) |
| 21.9 (±2.72) | 13.4 (±1.39) | 12.8 (±1.53) | 17.8 (±1.36) | ||
| 13.3 (±0.5) | 14.2 (±0.7) | 16.3 (±0.6) | 13.0 (±0.7) | ||
| V | β-sheet | 1242.1 (±0.9) | 1239.5 (±0.6) | 1240.0 (±1.1) | 1238.5 (±0.7) |
| 21.0 (±2.12) | 28.4 (±2.09) | 26.4 (±3.06) | 30.2 (±1.70) | ||
| 13.1 (±0.5) | 13.9 (±0.4) | 14.8 (±0.3) | 13.4 (±0.5) | ||
| IV | β-sheet | 1230.0 (±0.7) | 1226.2 (±0.8) | 1228.4 (±0.7) | 1224.7 (±0.6) |
| 16.8 (±0.91) | 19.0 (±1.39) | 14.6 (±1.22) | 19.9 (±1.36) | ||
| 14.0 (±0.6) | 15.2 (±0.5) | 16.0 (±0.6) | 14.3 (±0.6) | ||
| III | β-sheet | 1218.1 (±0.9) | 1215.0 (±1.0) | 1218.0 (±0.6) | 1213.8 (±0.8) |
| 10.8 (±0.60) | 9.1 (±0.35) | 12.5 (±0.61) | 7.2 (±0.68) | ||
| 12.7 (±0.5) | 14.0 (±0.3) | 16.0 (±0.5) | 14.2 (±0.4) | ||
| II | β-sheet | 1205.3 (±0.8) | 1203.4 (±1.0) | 1206.0 (±0.9) | 1203.5 (±1.1) |
| 4.3 (±0.30) | 3.7 (±0.35) | 4.9 (±0.31) | 3.1 (±0.34) | ||
| 11.1 (±0.6) | 11.3 (±0.7) | 12.9 (±0.4) | 10.4 (±0.3) | ||
| I | β-sheet | 1195.0 (±0.9) | 1194.5 (±0.7) | 1196.0 (±0.8) | 1196.4 (±0.8) |
| 0.3 (±0.30) | 0.6 (±0.35) | 0.3 (±0.15) | 0.5 (±0.34) | ||
| 11.0 (±0.7) | 9.8 (±0.5) | 10.5 (±0.6) | 9.6 (±0.5) |
| Participant Identifier | Gender | Age | Caries | Periodontal Diseases | Comorbidities |
|---|---|---|---|---|---|
| FYHHH | F | Y | H | H | H |
| FYCHH | F | Y | C | H | H |
| FYCHH | F | Y | C | H | H |
| FOCHH | F | O | C | H | H |
| MYCLG | M | Y | C | L | G |
| MOCLH | M | O | C | L | H |
| FOCMC | F | O | C | M | C |
| FYCHG | F | Y | C | H | G |
| MYCLH | M | Y | C | L | H |
| FYCHM | F | Y | C | H | M |
| FOMLG | F | O | M | L | G |
| MOMLG | M | O | M | L | G |
| FOMHC | F | O | M | H | C |
| FOMLM | F | O | M | L | M |
| FOMLG | F | O | M | L | G |
| FYMLM | F | Y | M | L | M |
| FYCHH | F | Y | C | H | H |
Disclaimer/Publisher’s Note: The statements, opinions and data contained in all publications are solely those of the individual author(s) and contributor(s) and not of MDPI and/or the editor(s). MDPI and/or the editor(s) disclaim responsibility for any injury to people or property resulting from any ideas, methods, instructions or products referred to in the content. |
© 2025 by the authors. Licensee MDPI, Basel, Switzerland. This article is an open access article distributed under the terms and conditions of the Creative Commons Attribution (CC BY) license (https://creativecommons.org/licenses/by/4.0/).
Share and Cite
Seredin, P.; Litvinova, T.; Ippolitov, Y.; Goloshchapov, D.; Peshkov, Y.; Chae, B.; Freitas, R.O.; Maia, F.C.B. Multivariate Spectroscopic Analysis of Protein Secondary Structures in Gingival Crevicular Fluid: Insights from FTIR Amide III Band Across Oral Disease Stages. Int. J. Mol. Sci. 2025, 26, 4693. https://doi.org/10.3390/ijms26104693
Seredin P, Litvinova T, Ippolitov Y, Goloshchapov D, Peshkov Y, Chae B, Freitas RO, Maia FCB. Multivariate Spectroscopic Analysis of Protein Secondary Structures in Gingival Crevicular Fluid: Insights from FTIR Amide III Band Across Oral Disease Stages. International Journal of Molecular Sciences. 2025; 26(10):4693. https://doi.org/10.3390/ijms26104693
Chicago/Turabian StyleSeredin, Pavel, Tatiana Litvinova, Yuri Ippolitov, Dmitry Goloshchapov, Yaroslav Peshkov, Boknam Chae, Raul O. Freitas, and Francisco C. B. Maia. 2025. "Multivariate Spectroscopic Analysis of Protein Secondary Structures in Gingival Crevicular Fluid: Insights from FTIR Amide III Band Across Oral Disease Stages" International Journal of Molecular Sciences 26, no. 10: 4693. https://doi.org/10.3390/ijms26104693
APA StyleSeredin, P., Litvinova, T., Ippolitov, Y., Goloshchapov, D., Peshkov, Y., Chae, B., Freitas, R. O., & Maia, F. C. B. (2025). Multivariate Spectroscopic Analysis of Protein Secondary Structures in Gingival Crevicular Fluid: Insights from FTIR Amide III Band Across Oral Disease Stages. International Journal of Molecular Sciences, 26(10), 4693. https://doi.org/10.3390/ijms26104693