

Reusing Kaolin Residue from the Mining Industry to Produce PCL-Based Composites: Accelerating the Crystallization Process and Improving Mechanical Properties
 , , ,
, , ,  and
and
Abstract
1. Introduction
2. Results and Discussion
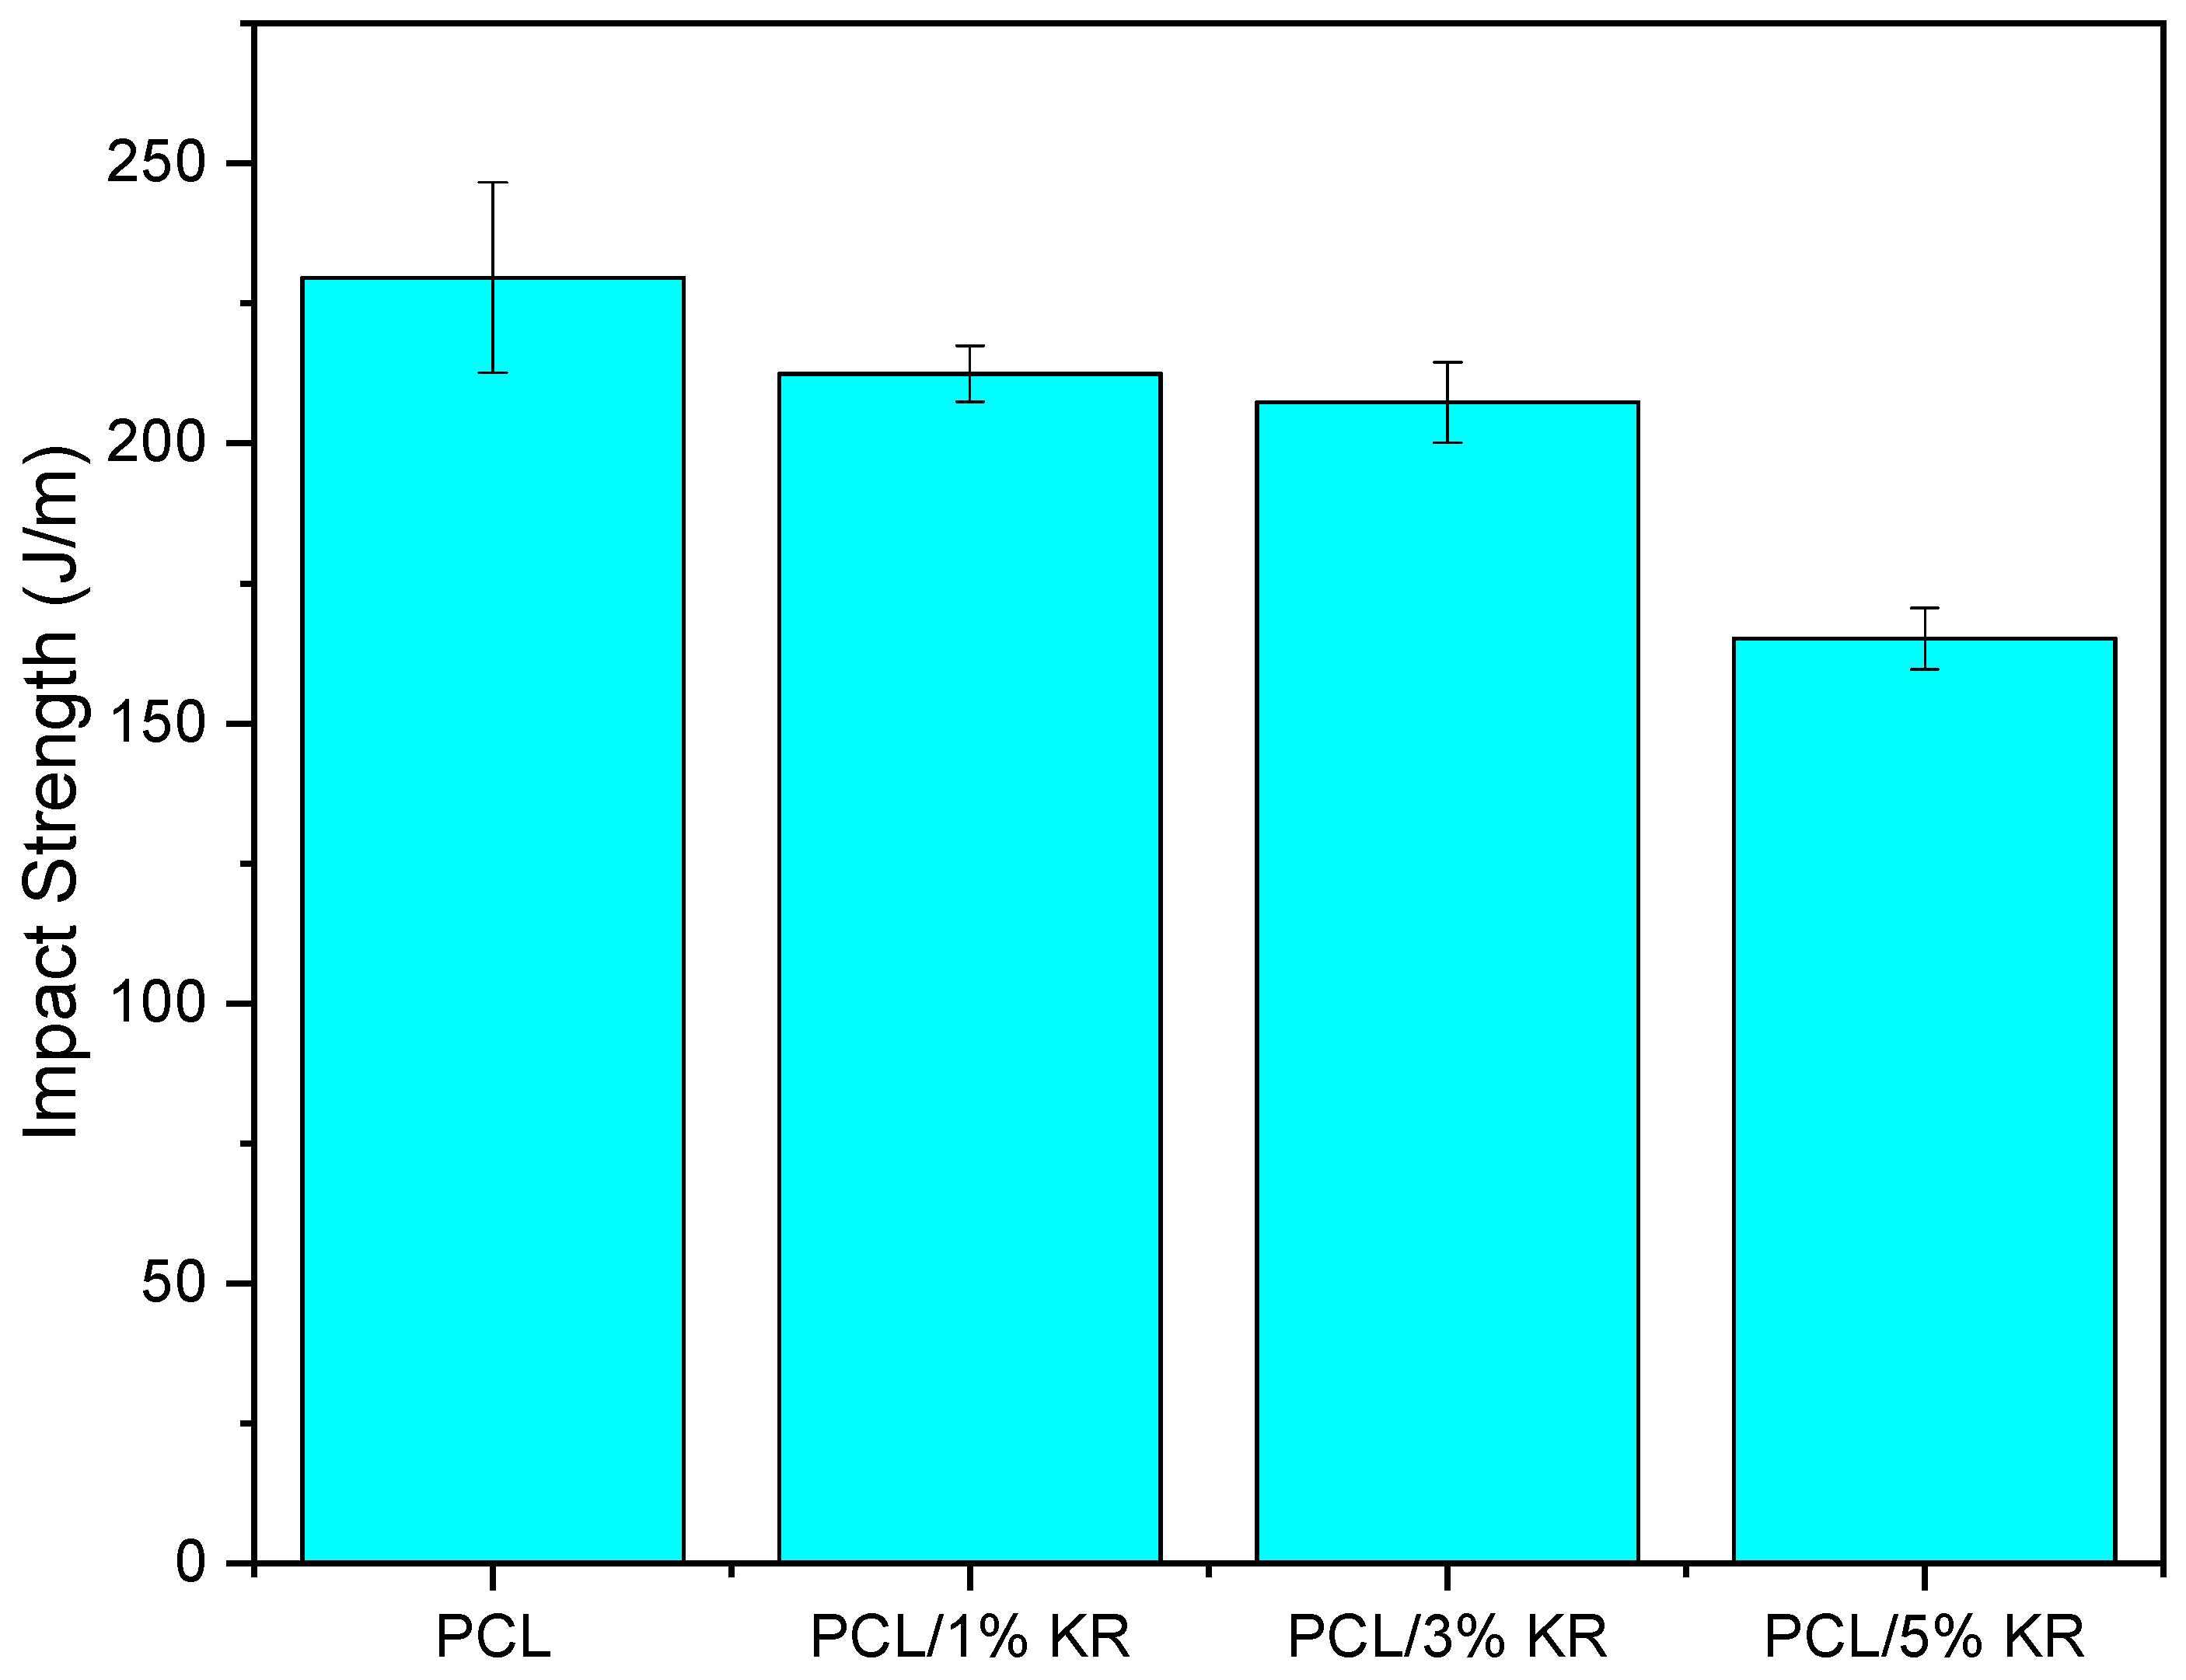
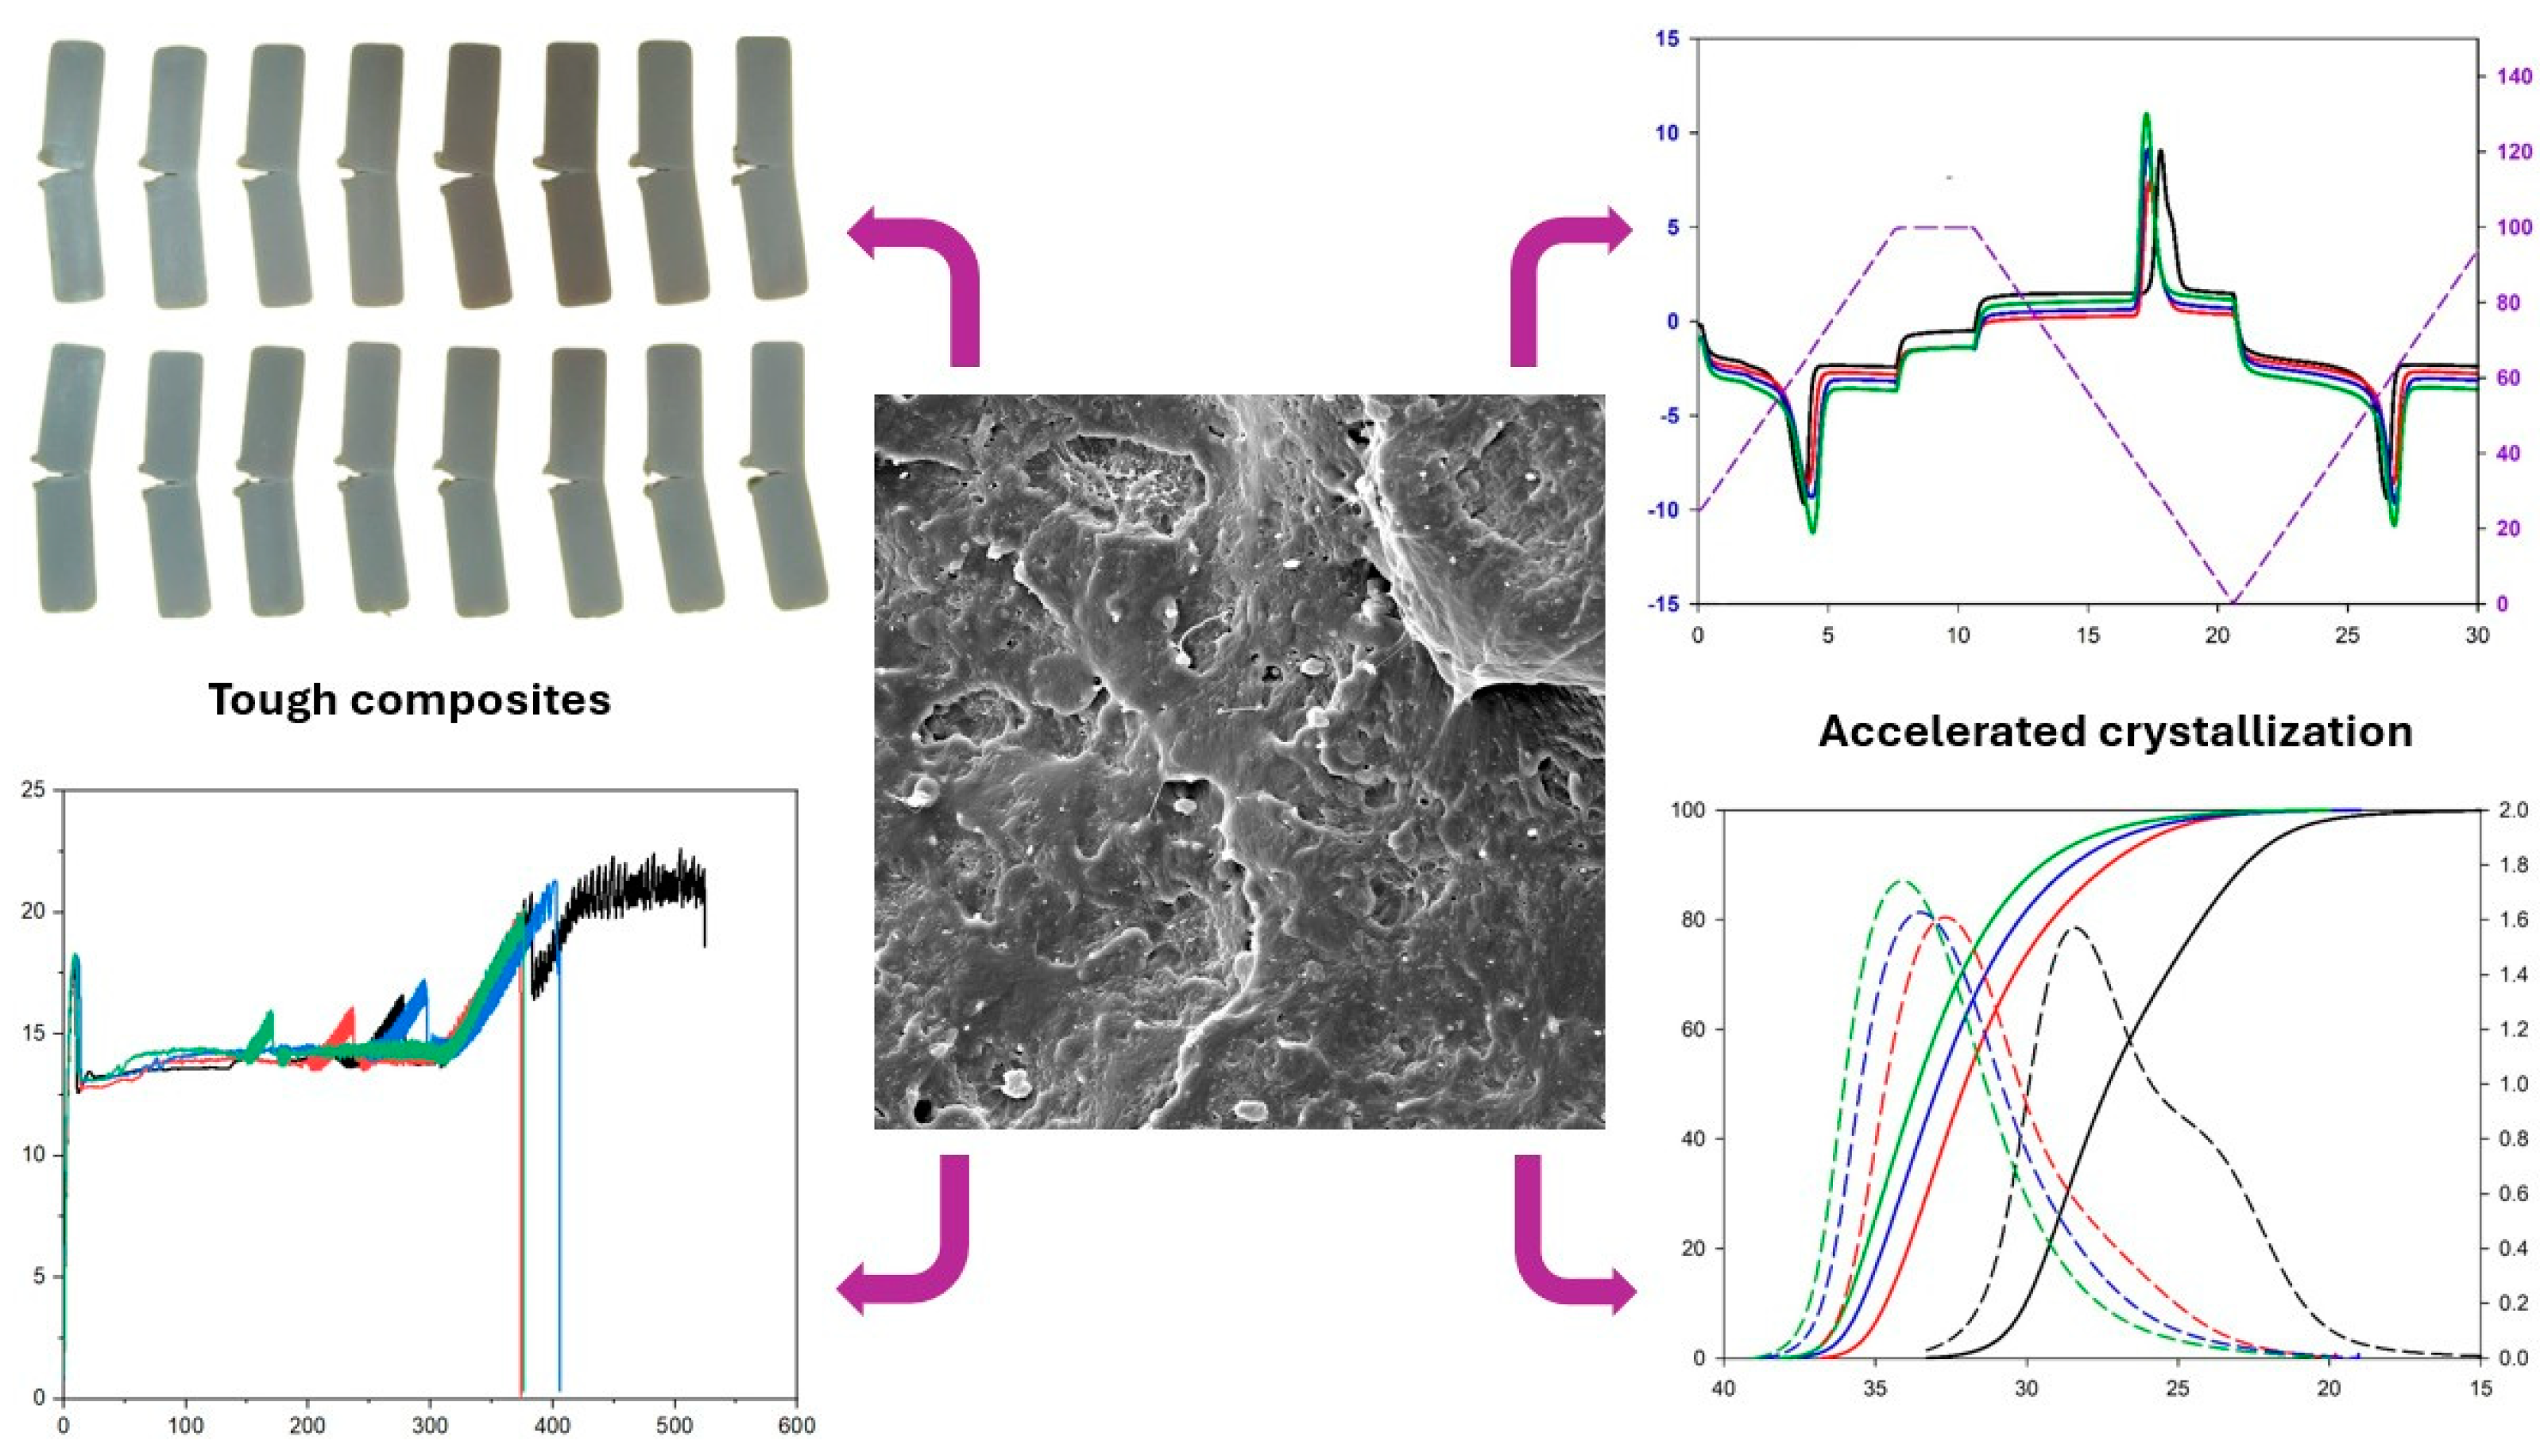
2.1. Impact Strength
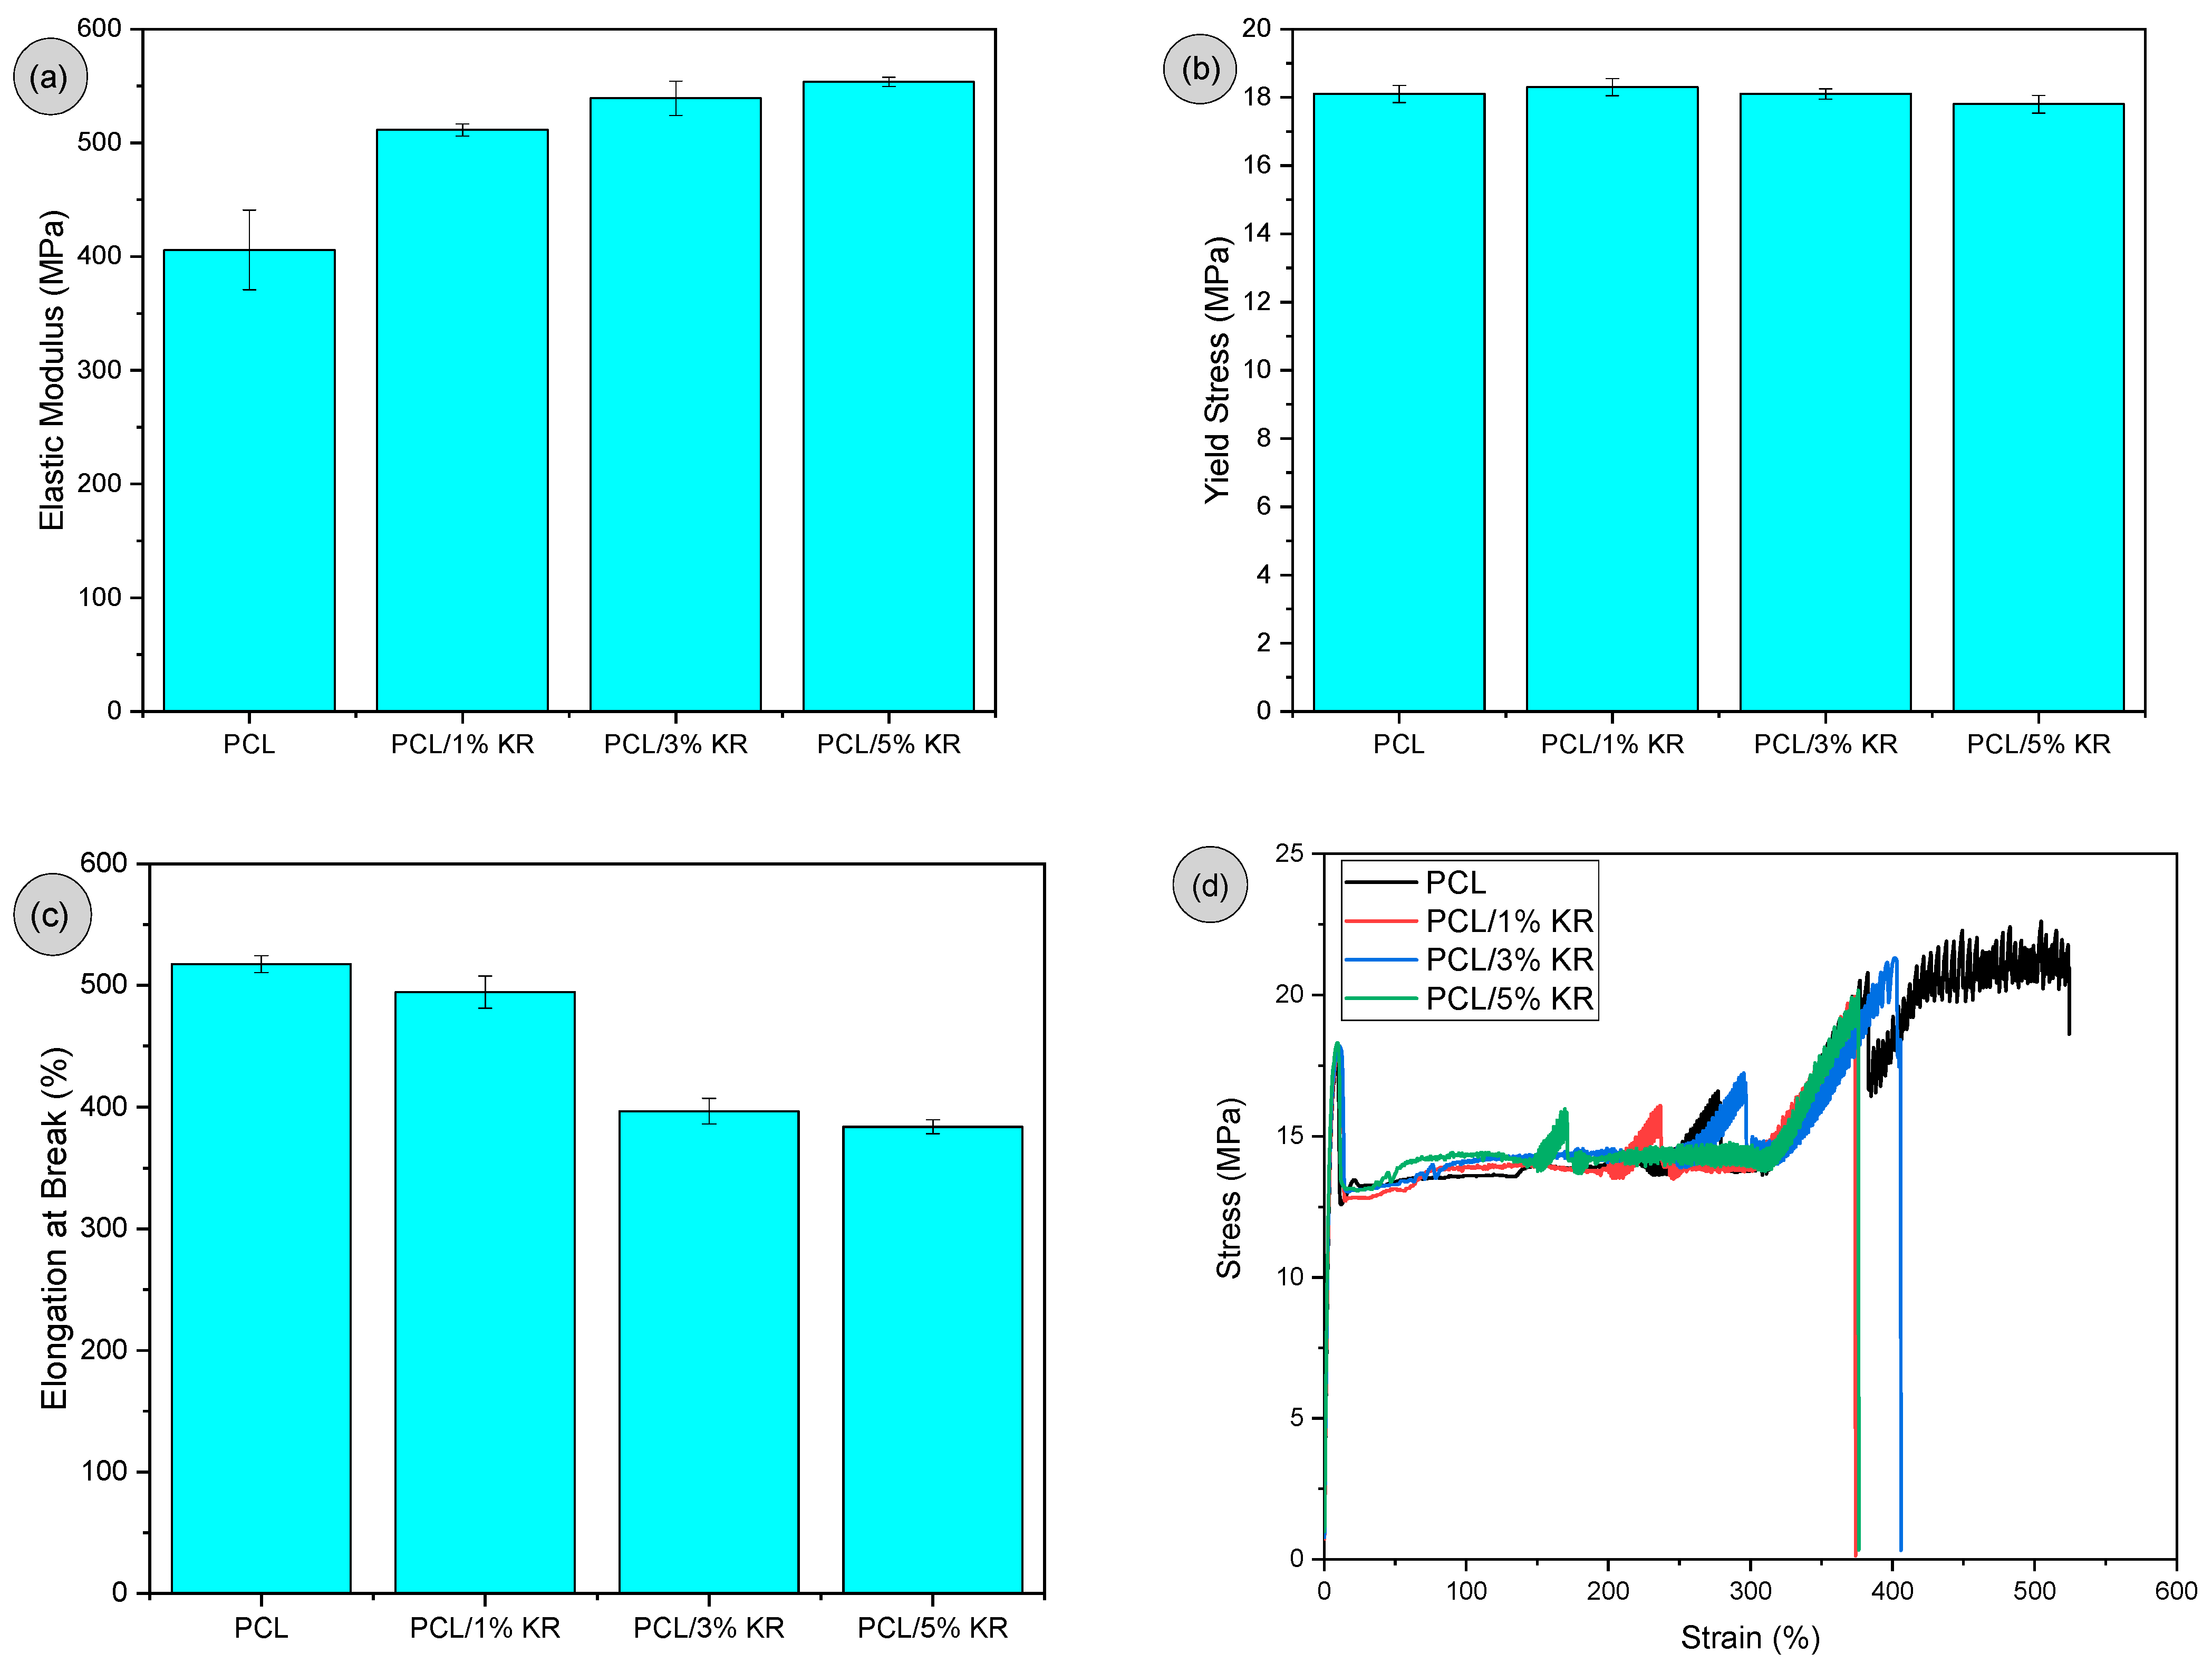
2.2. Tensile Properties
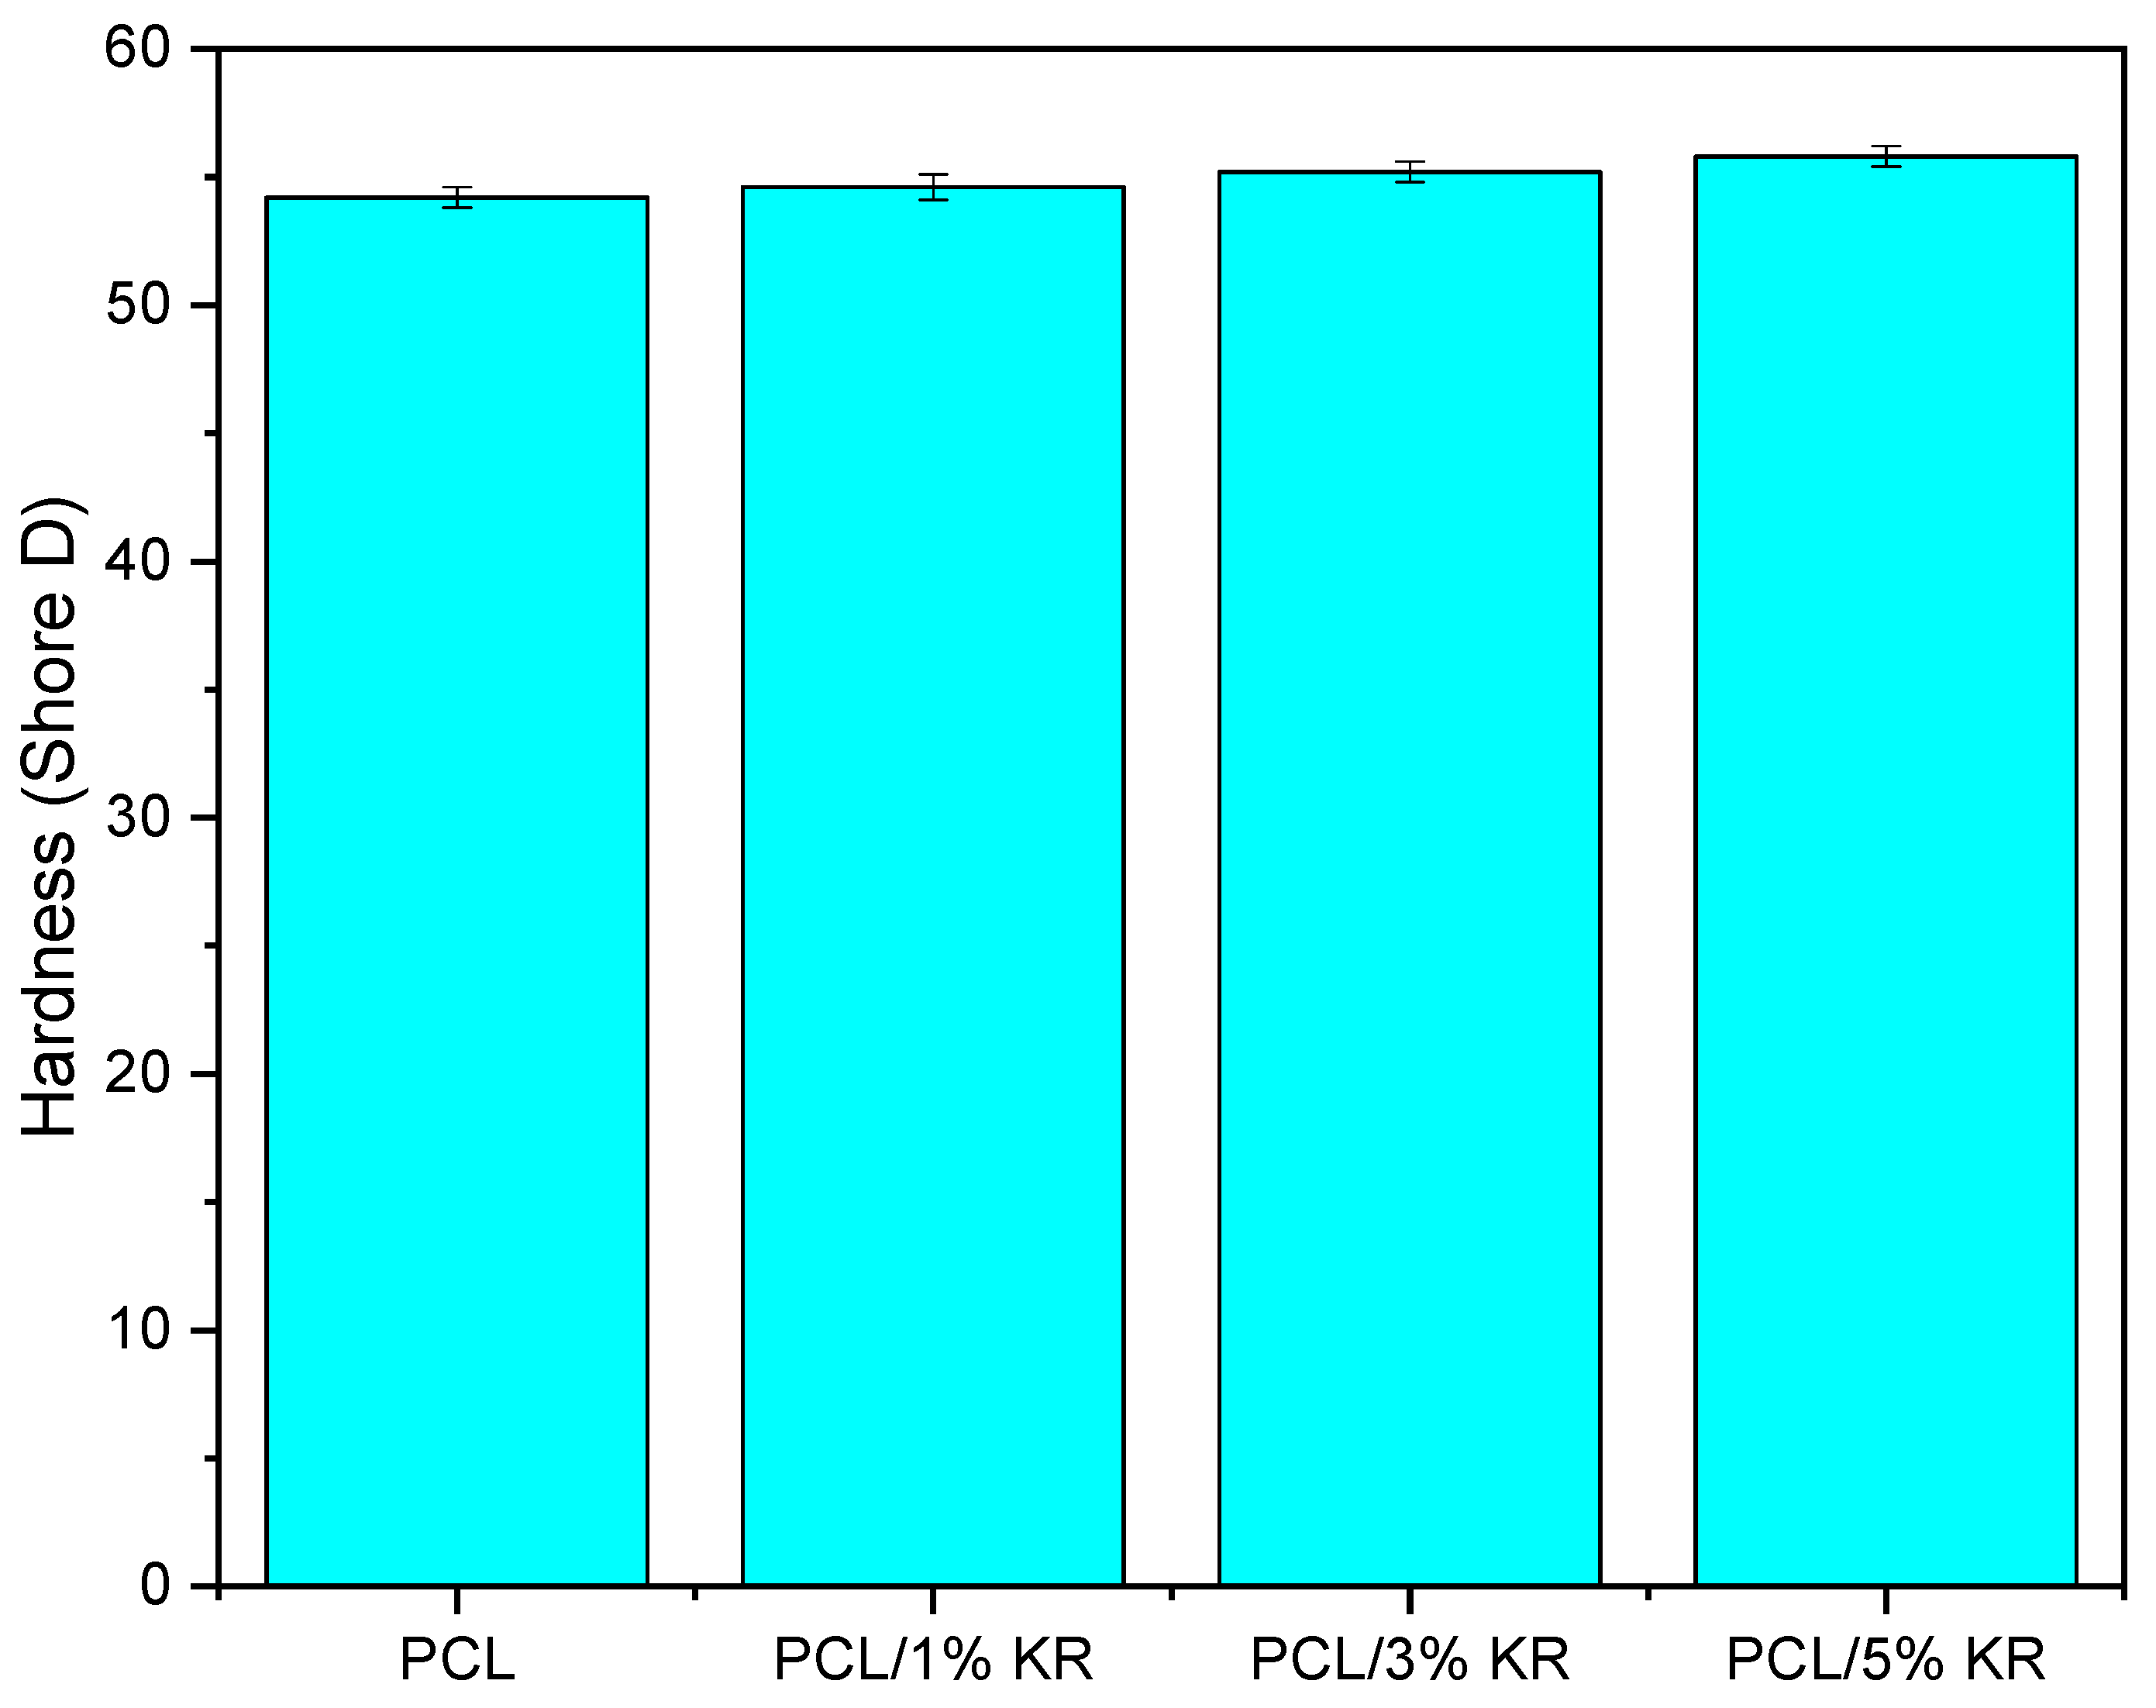
2.3. Shore D Hardness
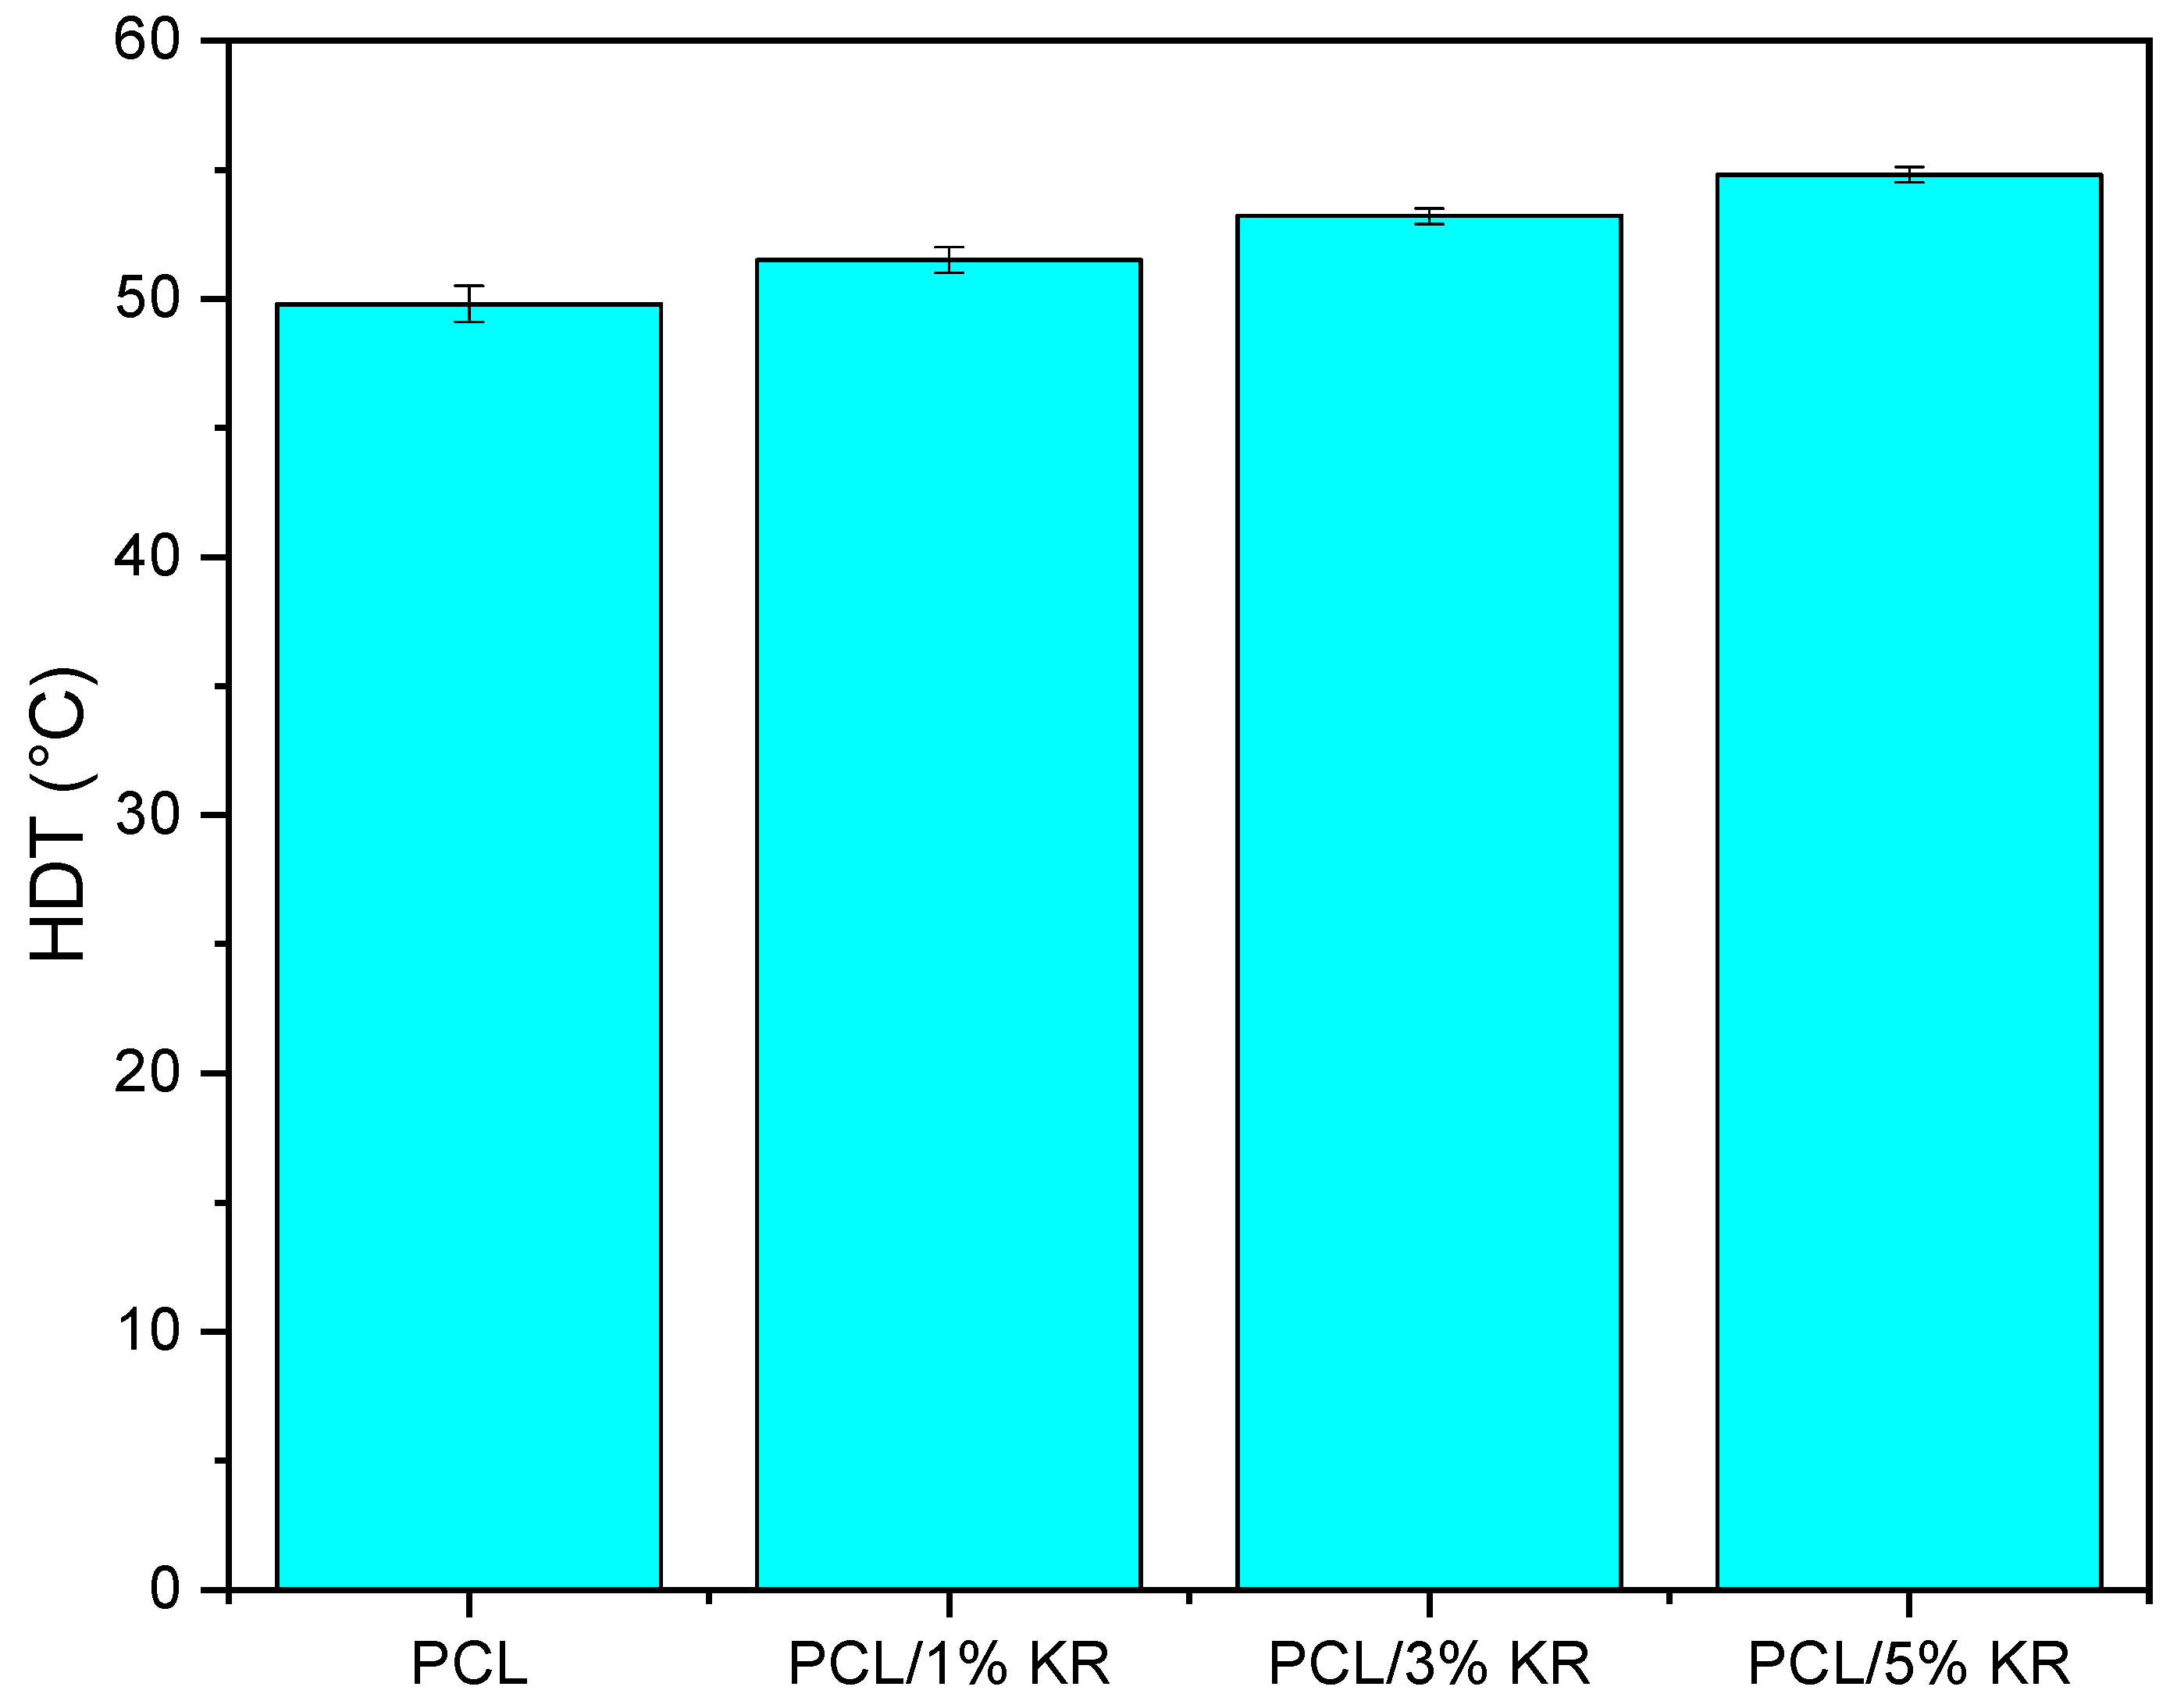
2.4. Heat Deflection Temperature (HDT)
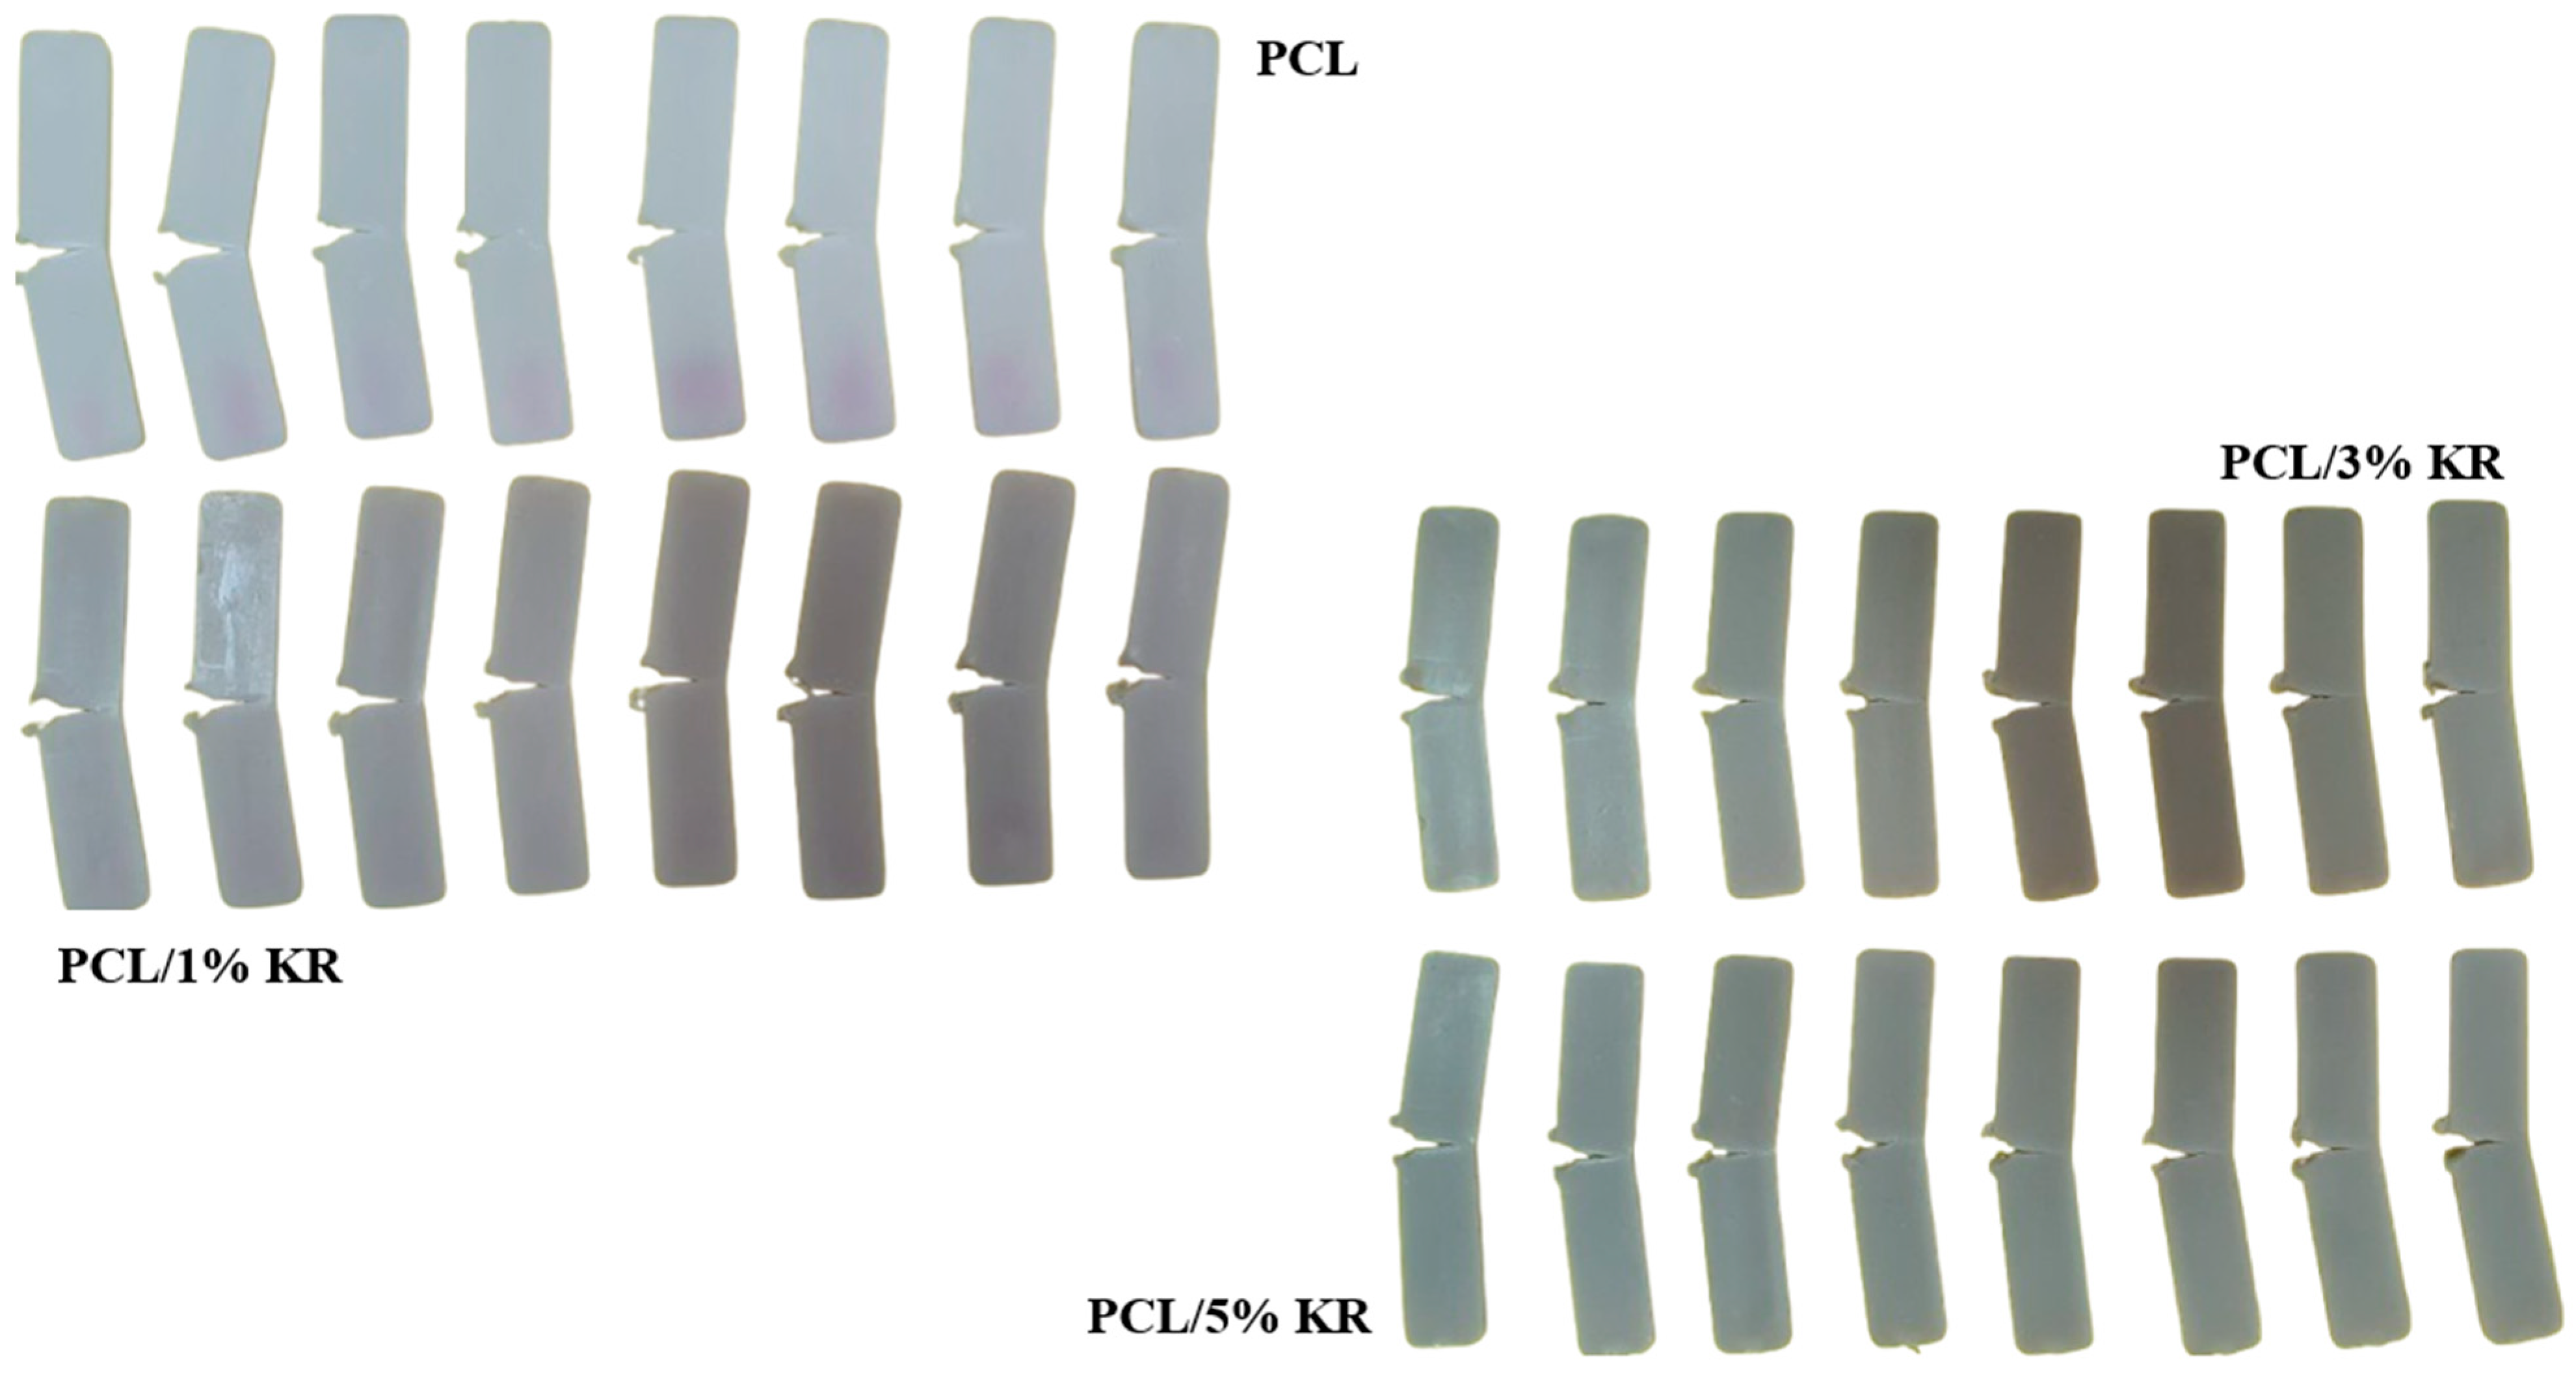
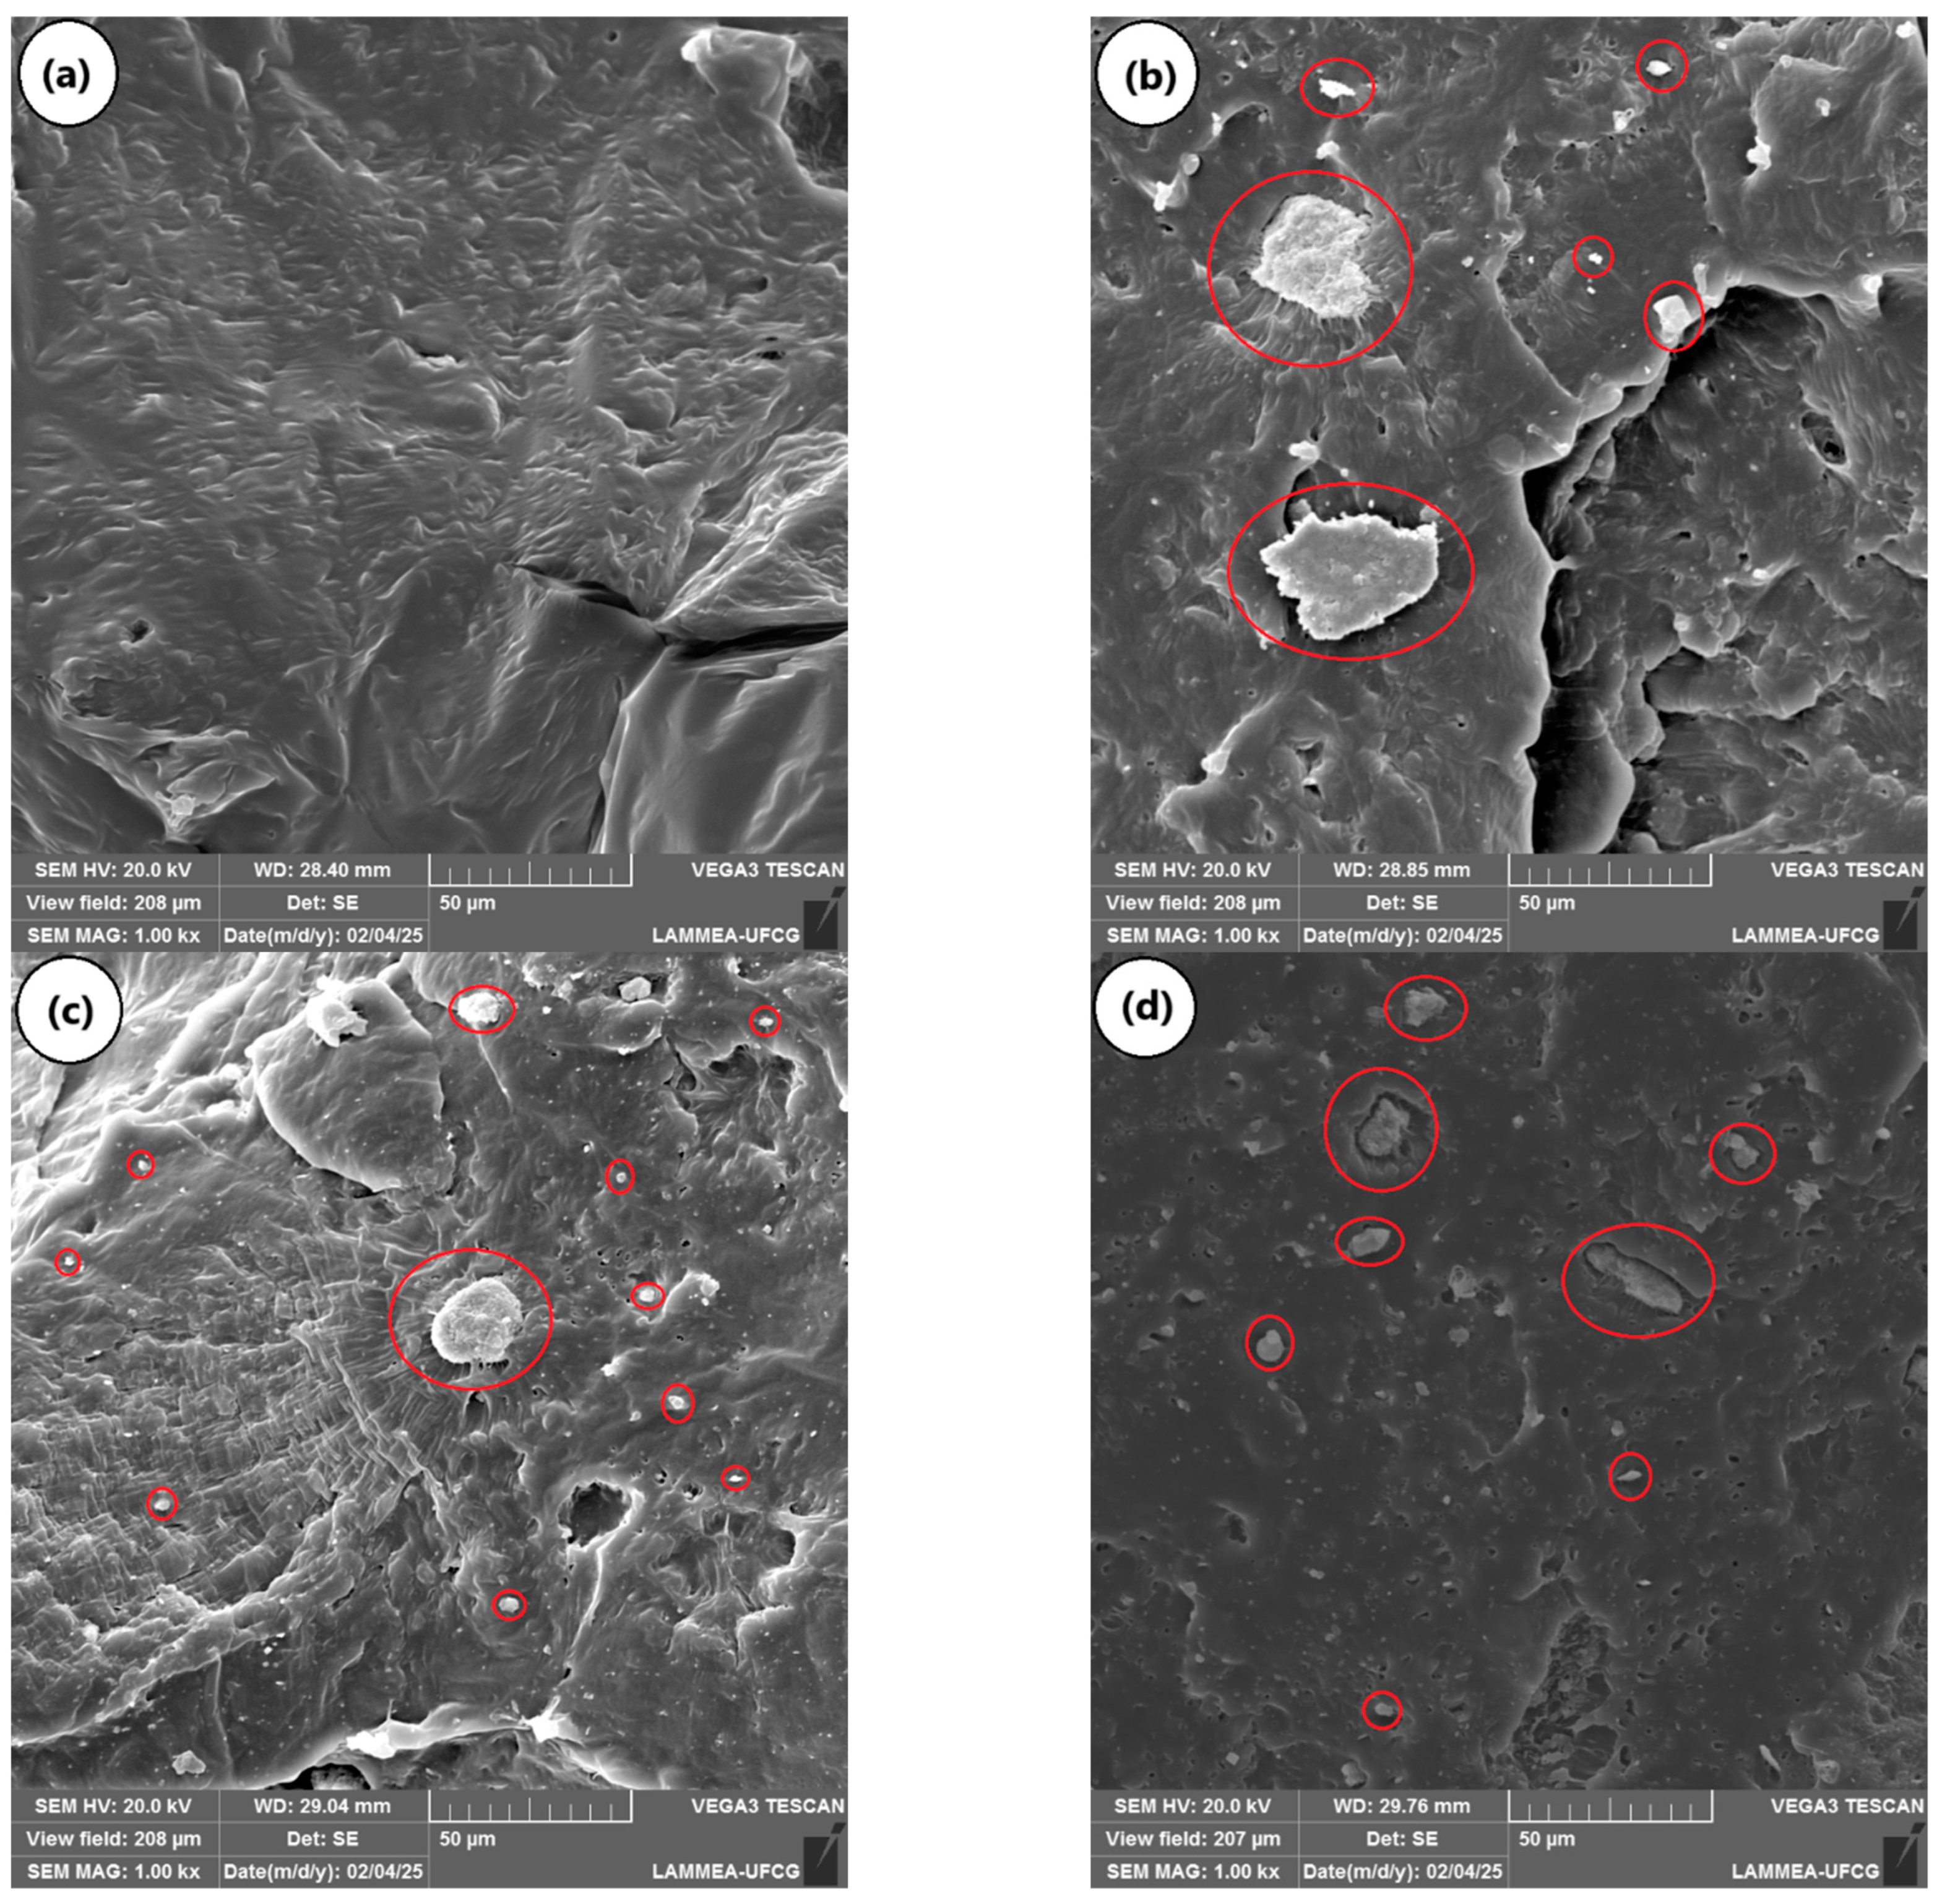
2.5. The Impact Fracture Surface of PCL and the PCL/KR Composites
2.6. DSC Measurements
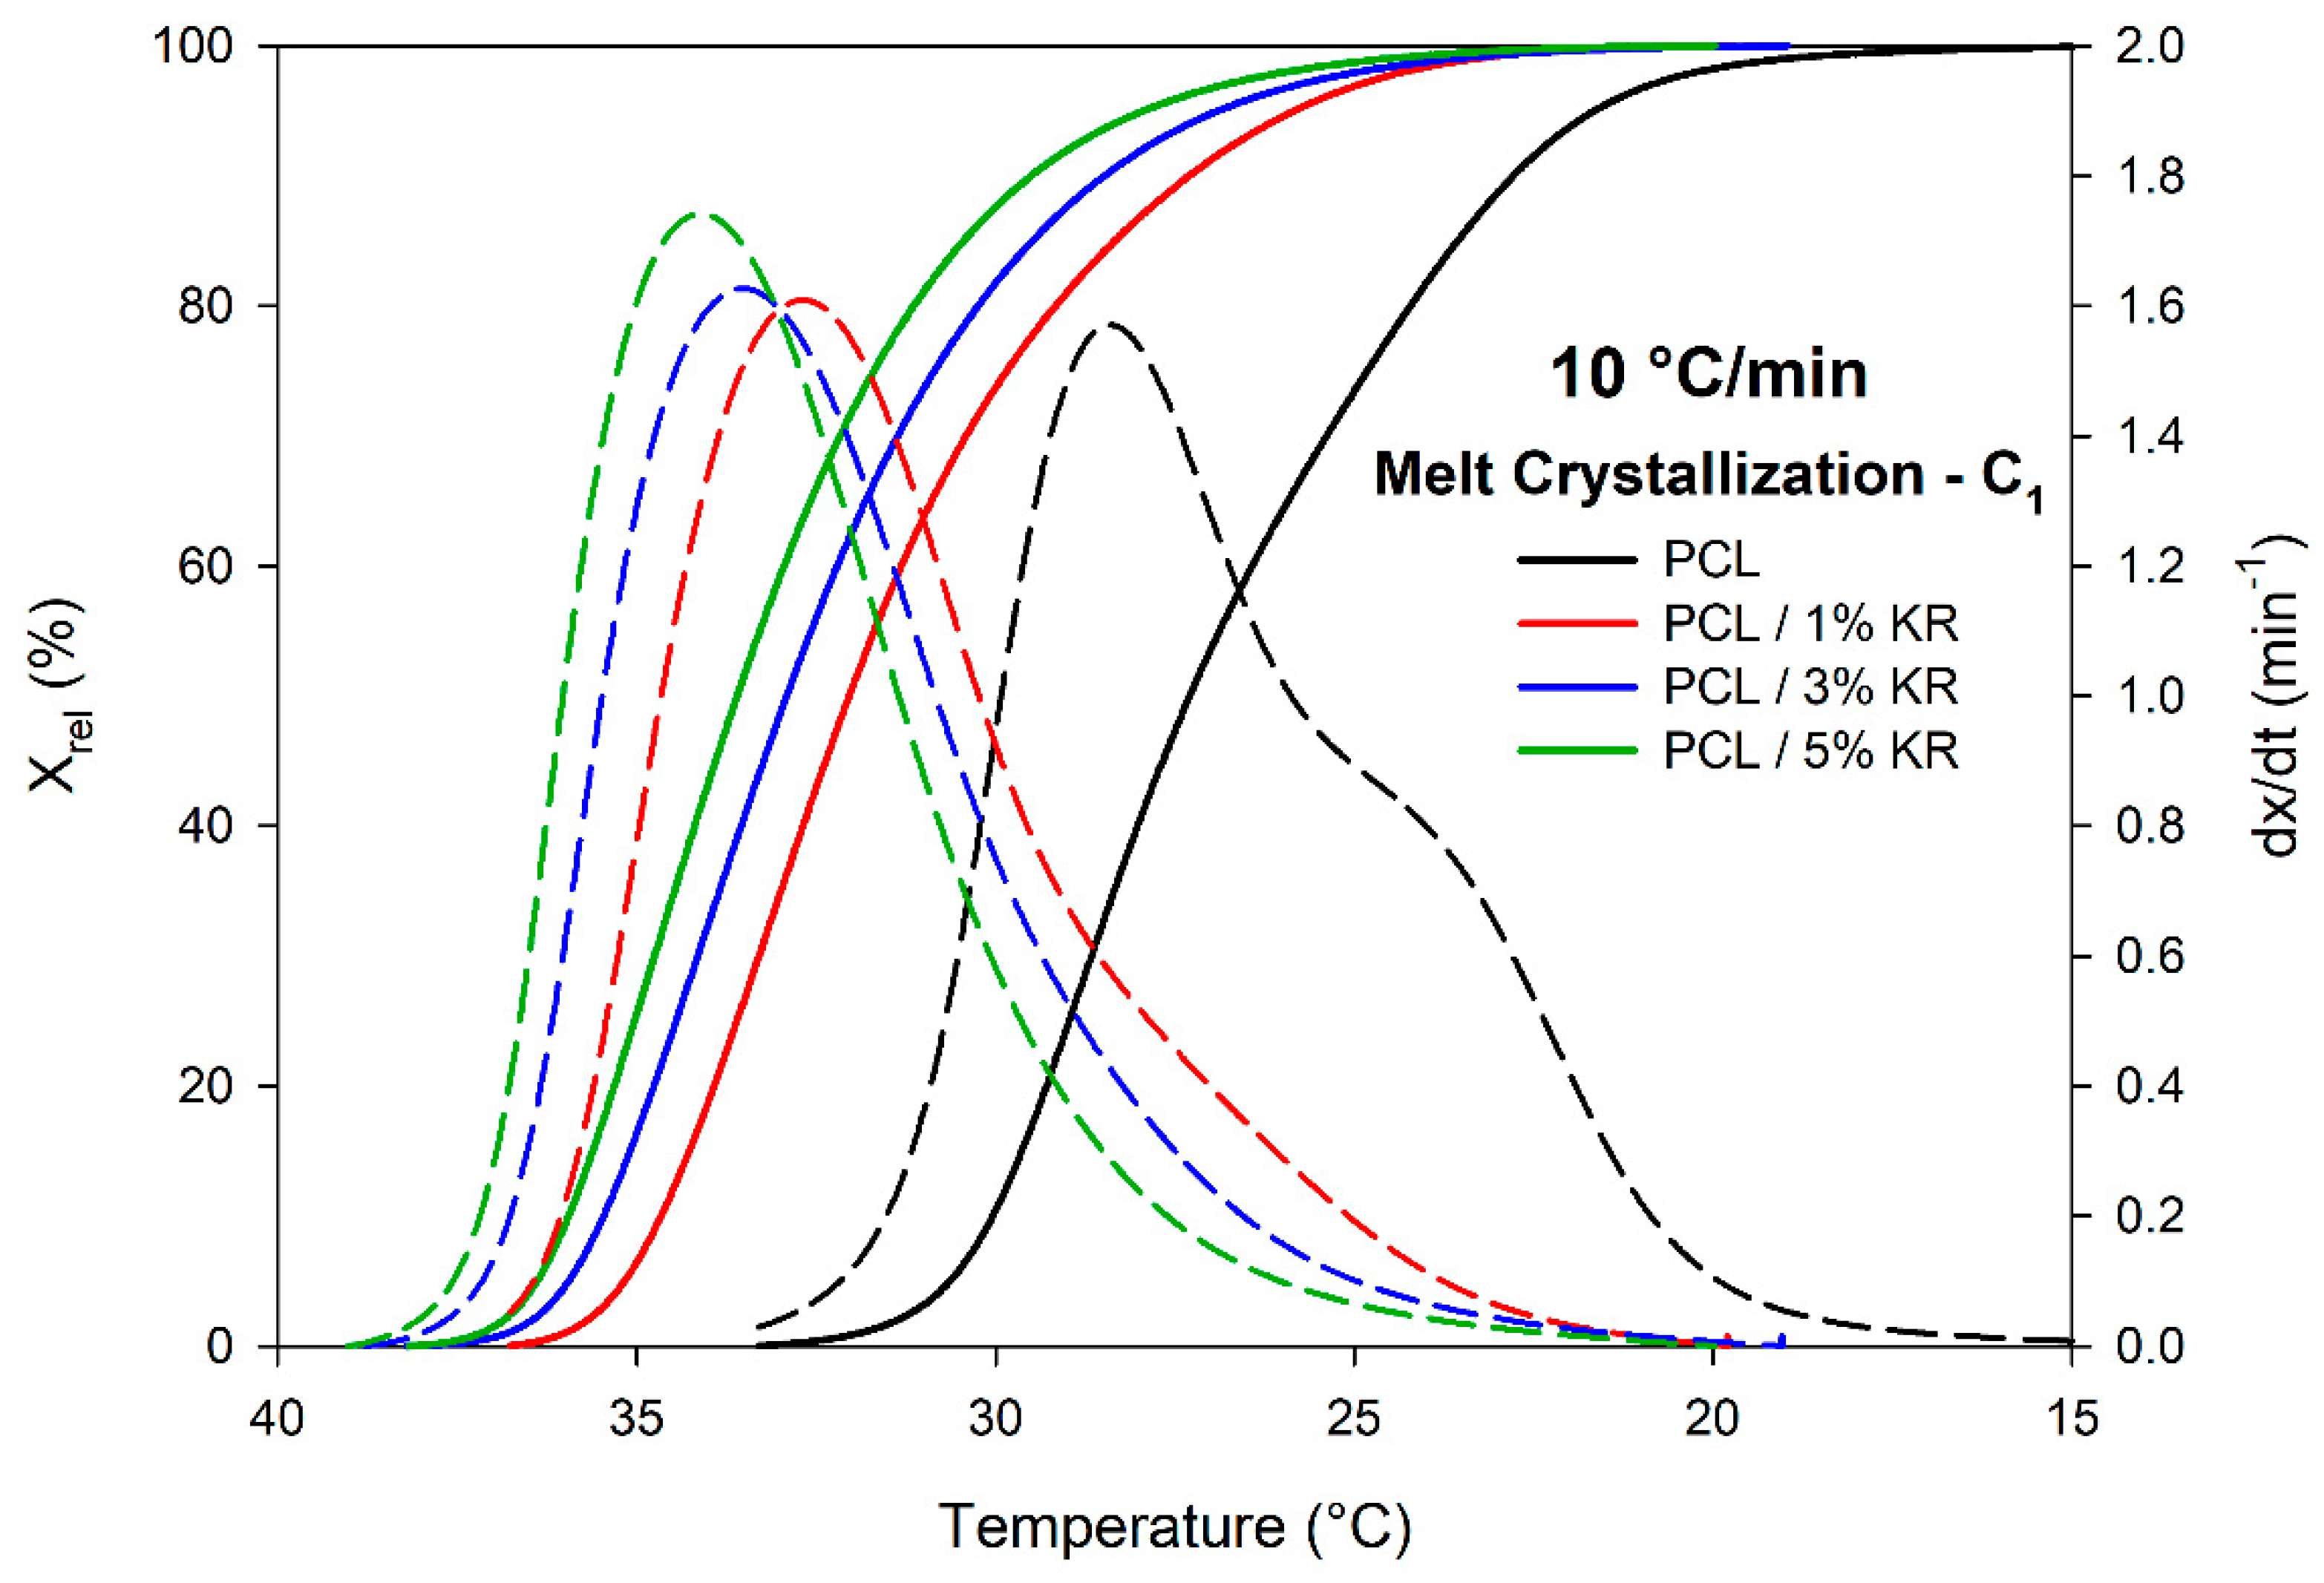
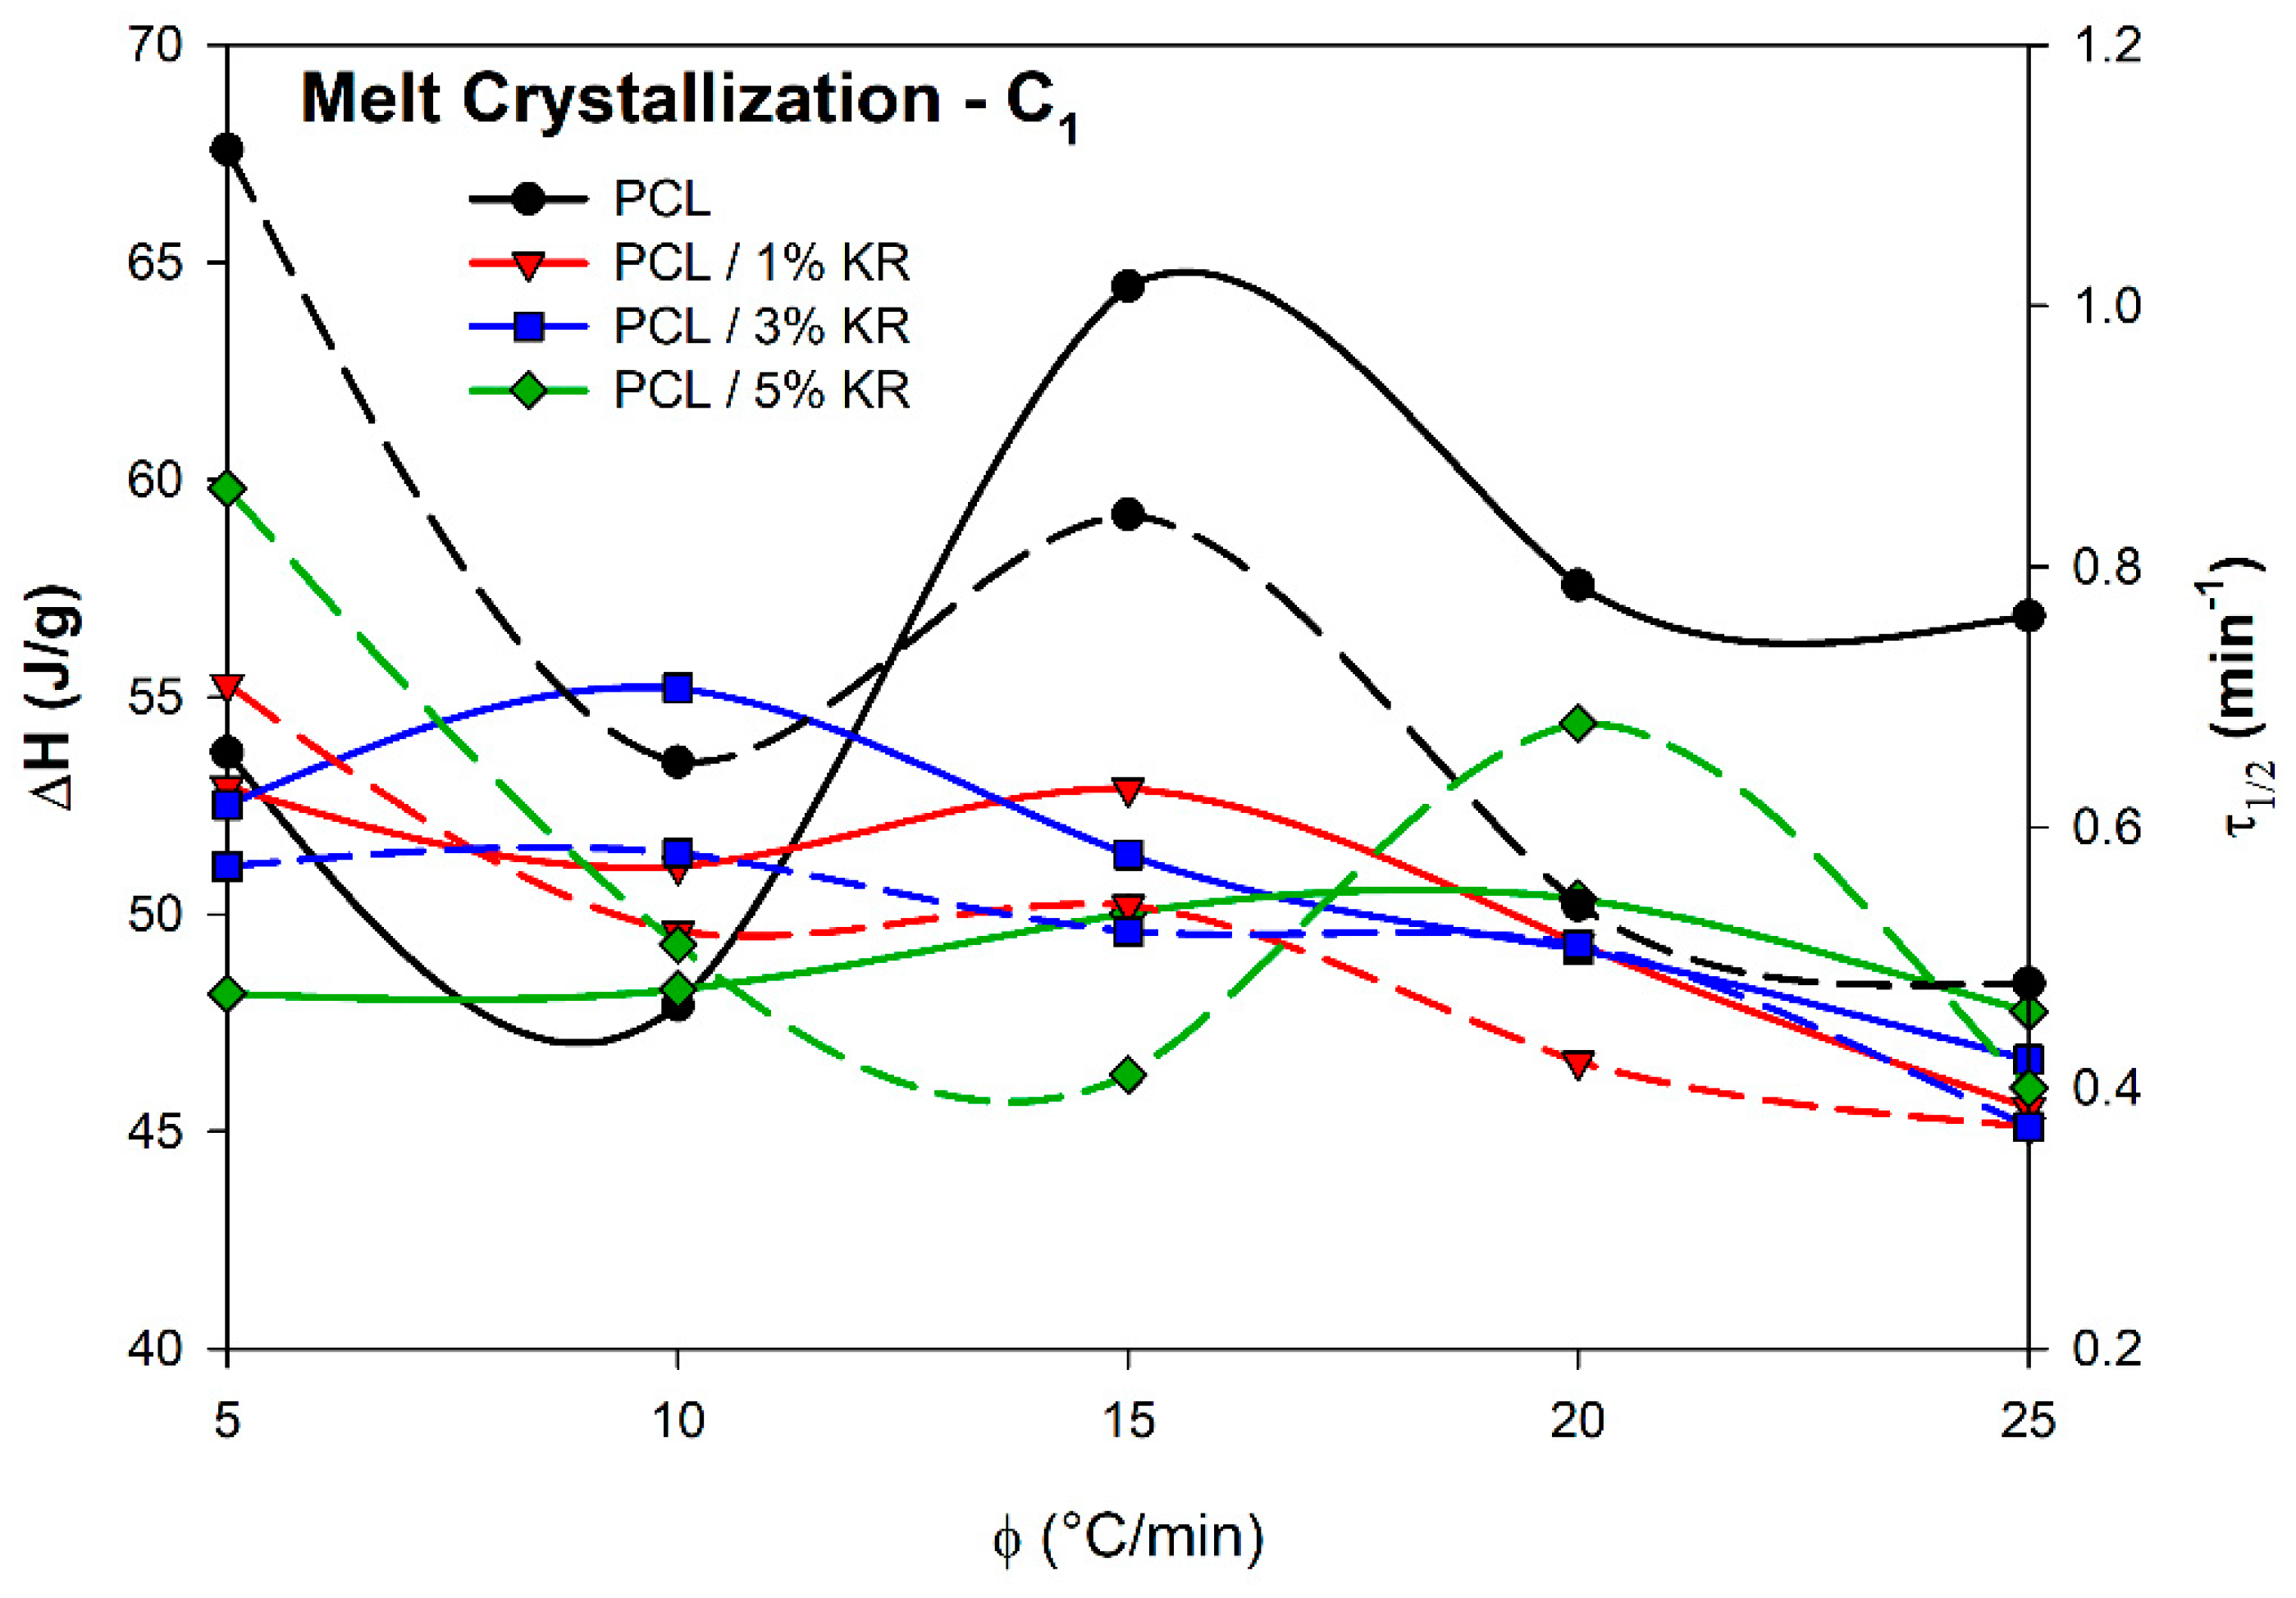
2.7. Melt Crystallization (C1) Measurements
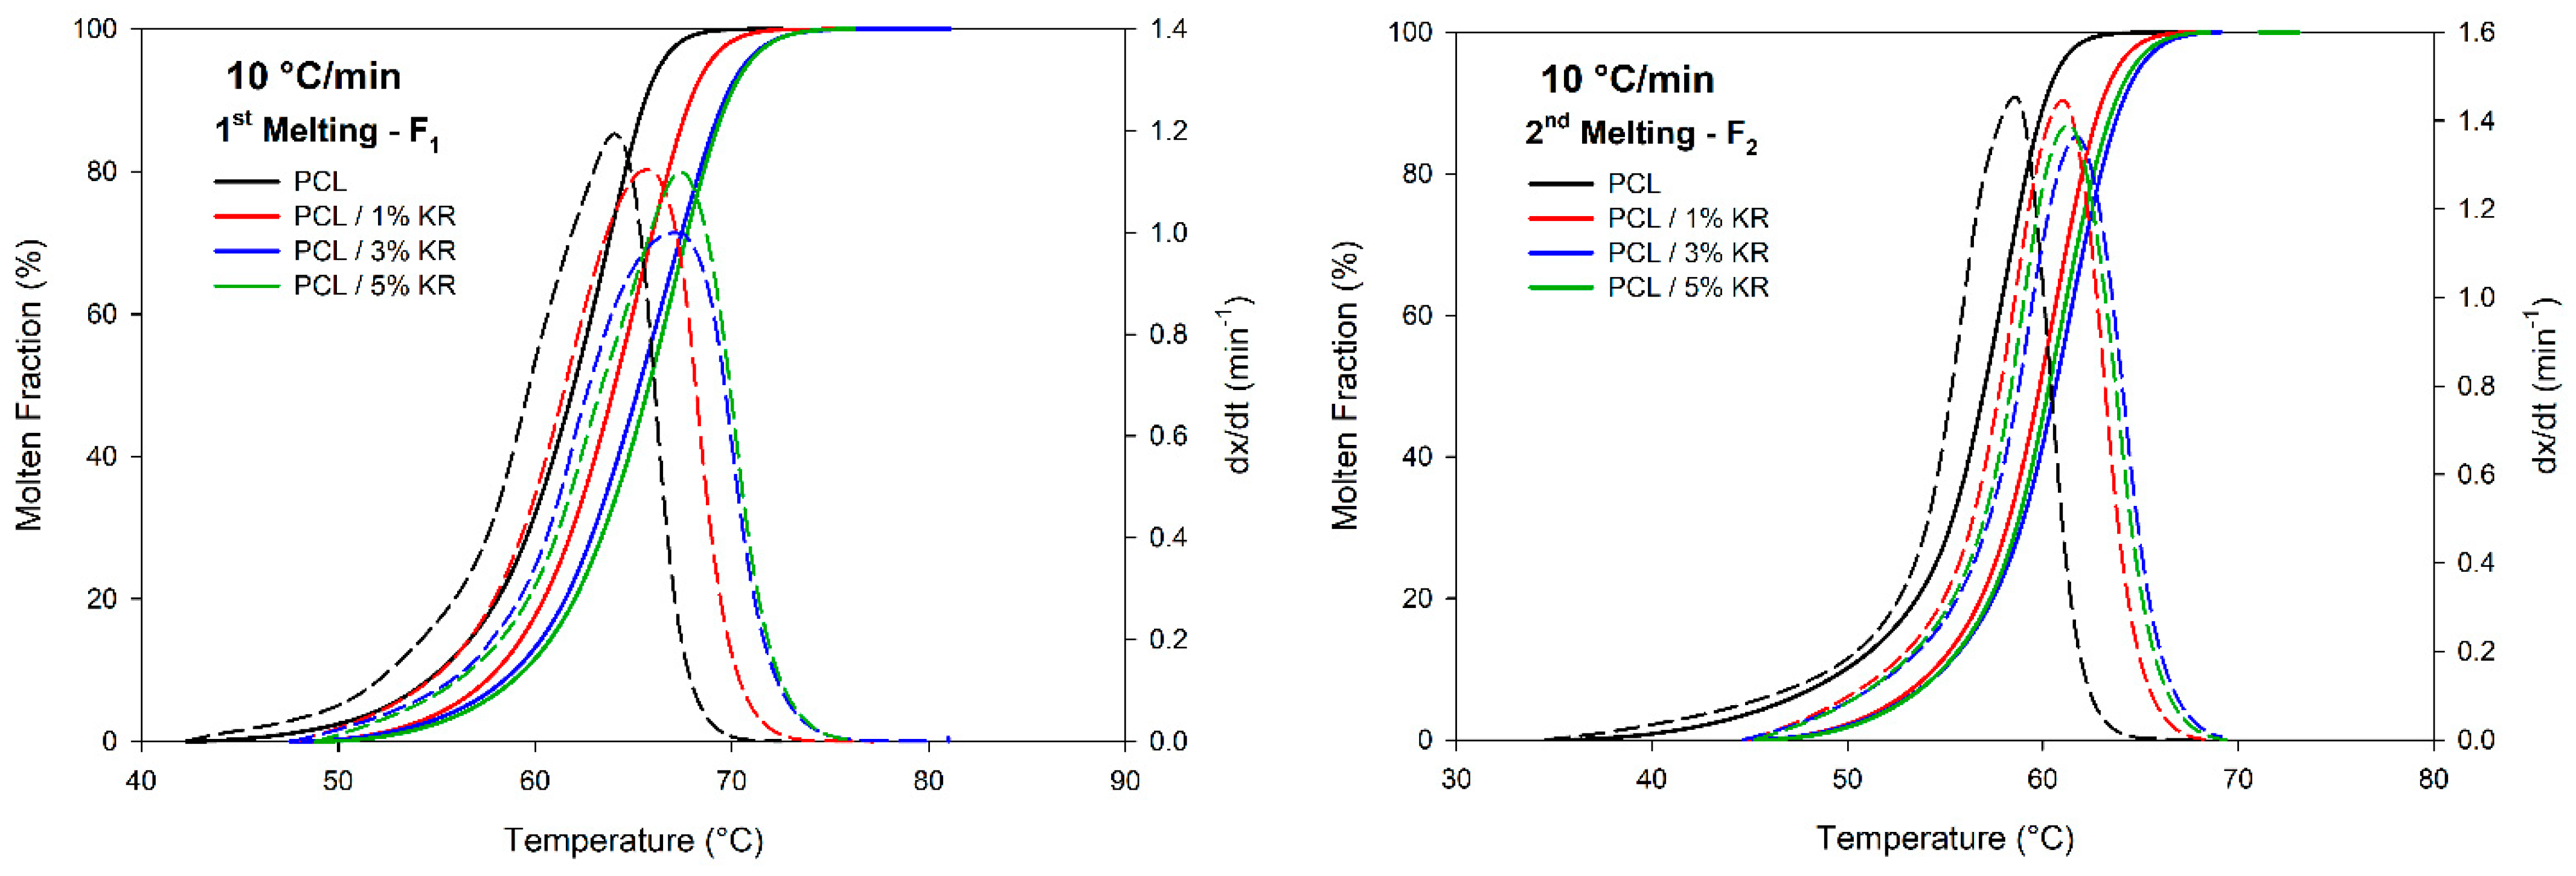
2.8. First (F1) and Second (F2) Fusion Measurements
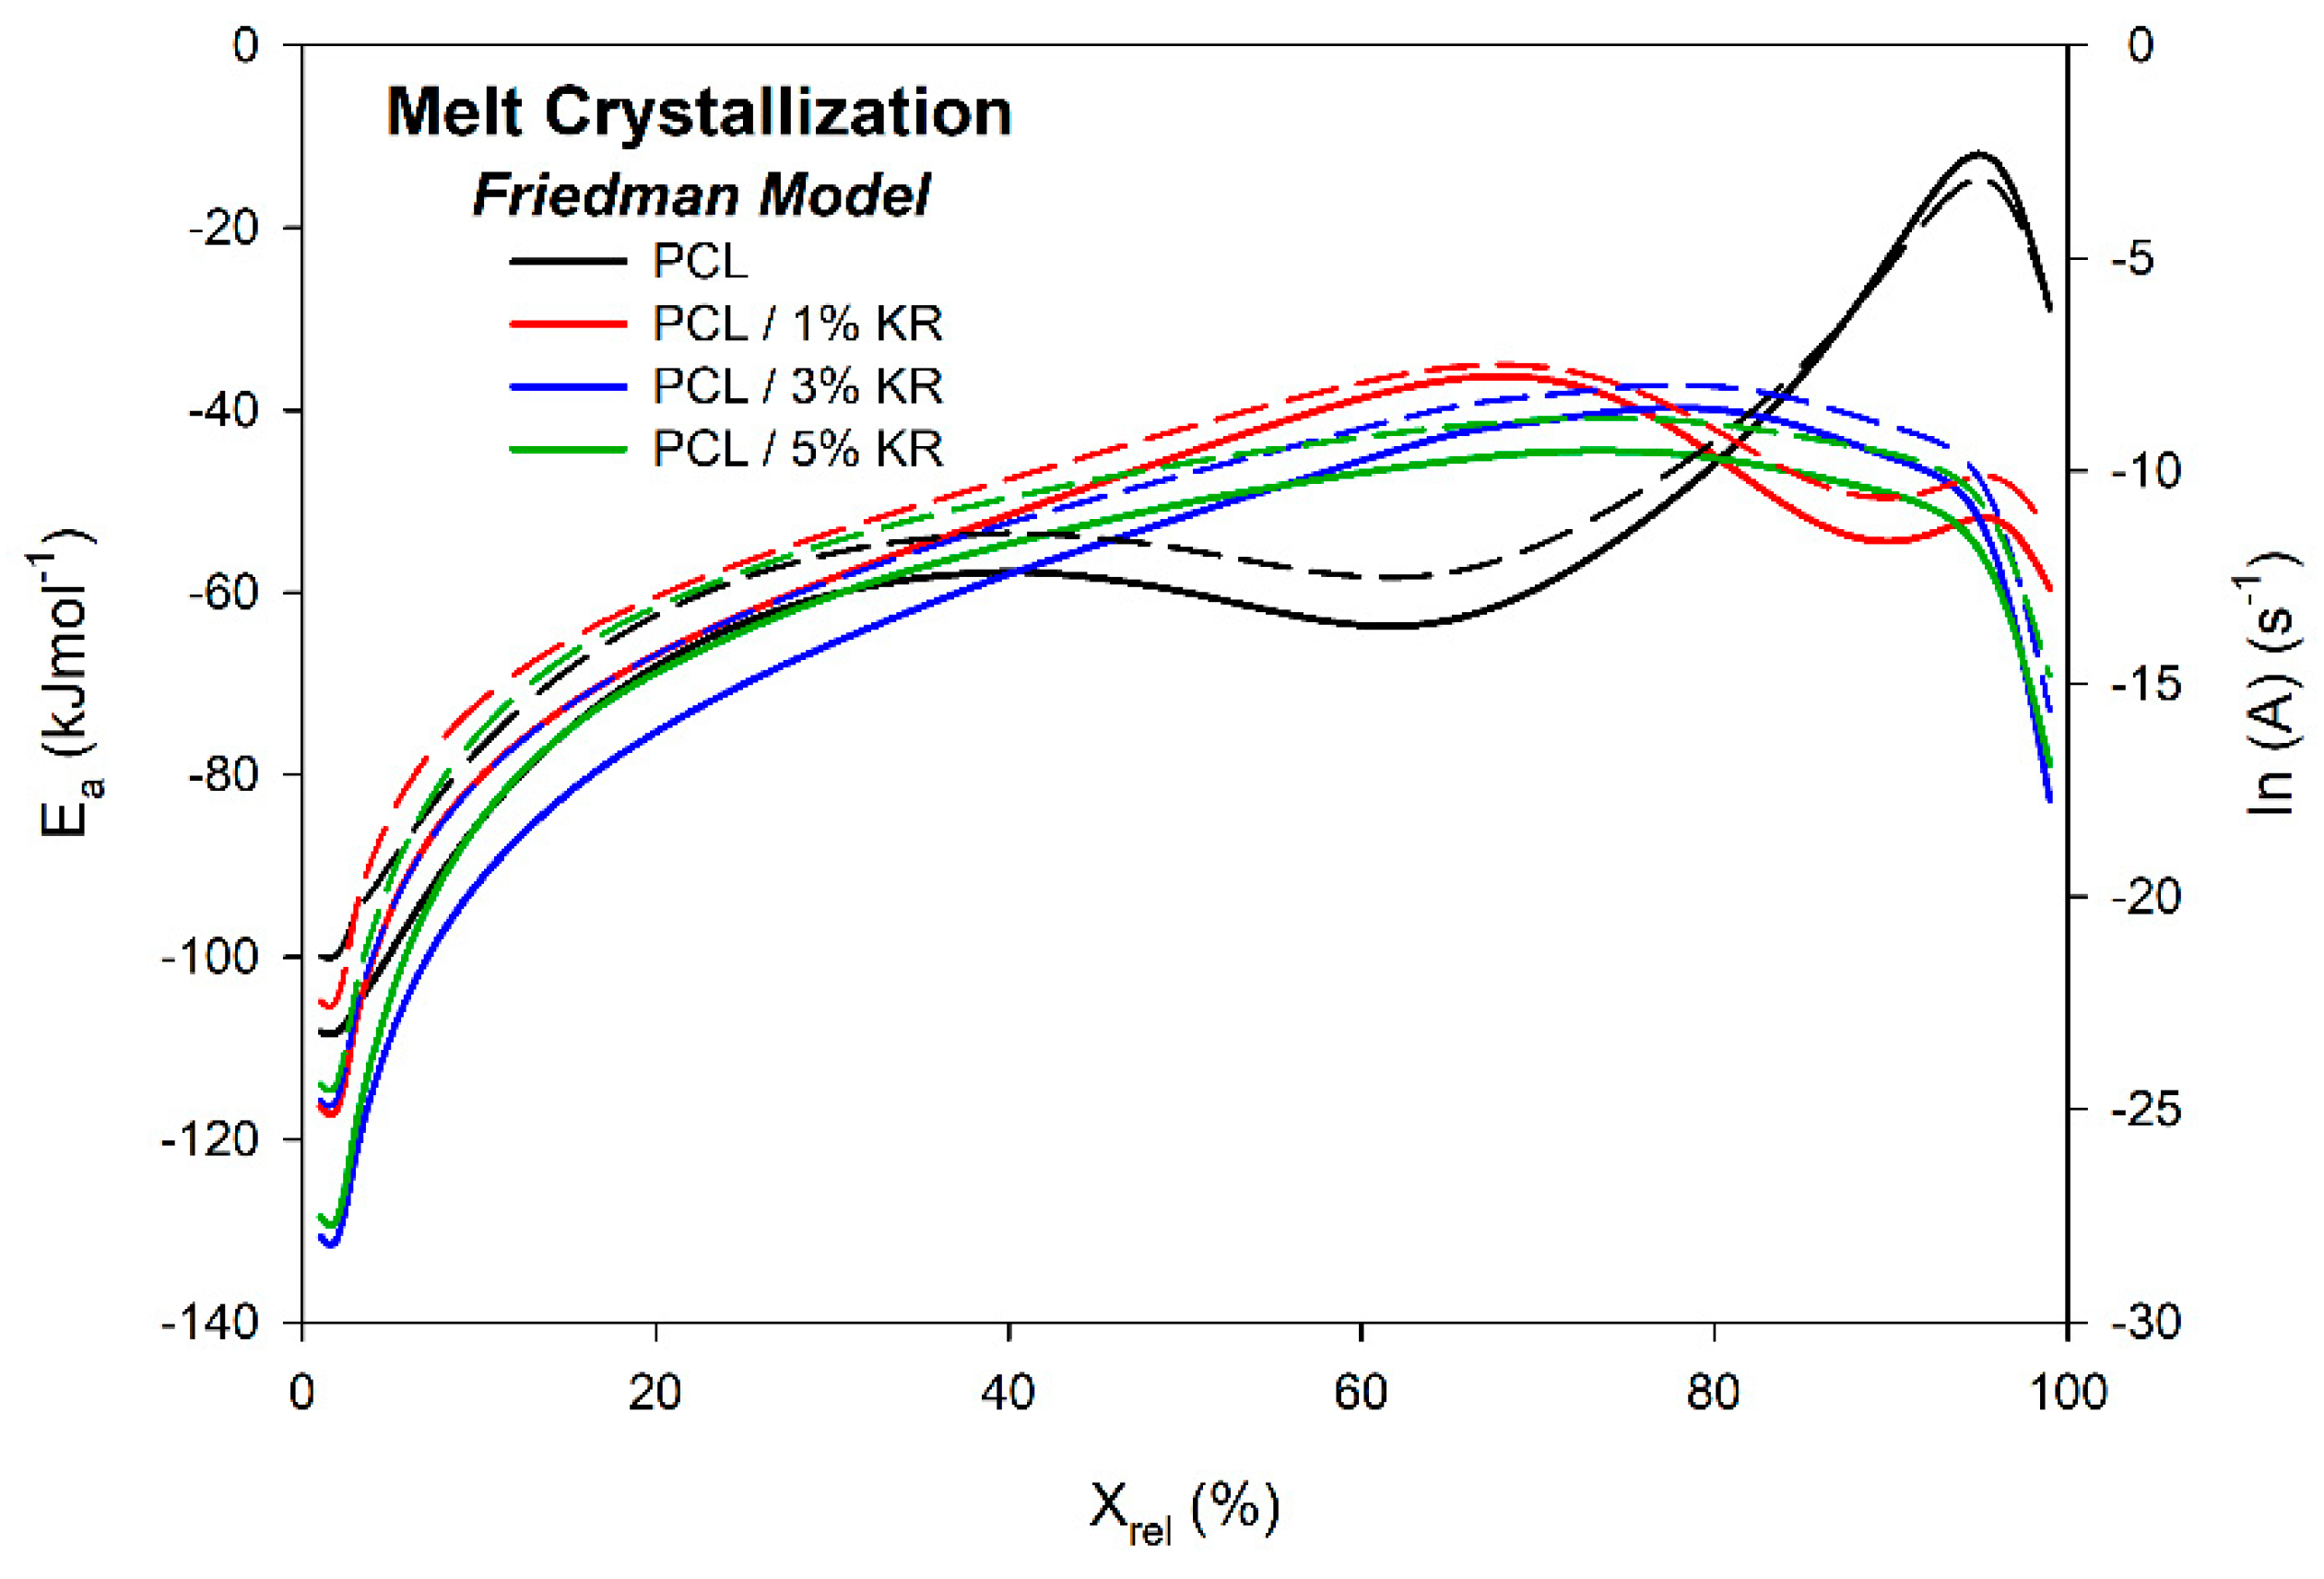
2.9. Activation Energy ()—Melt Crystallization
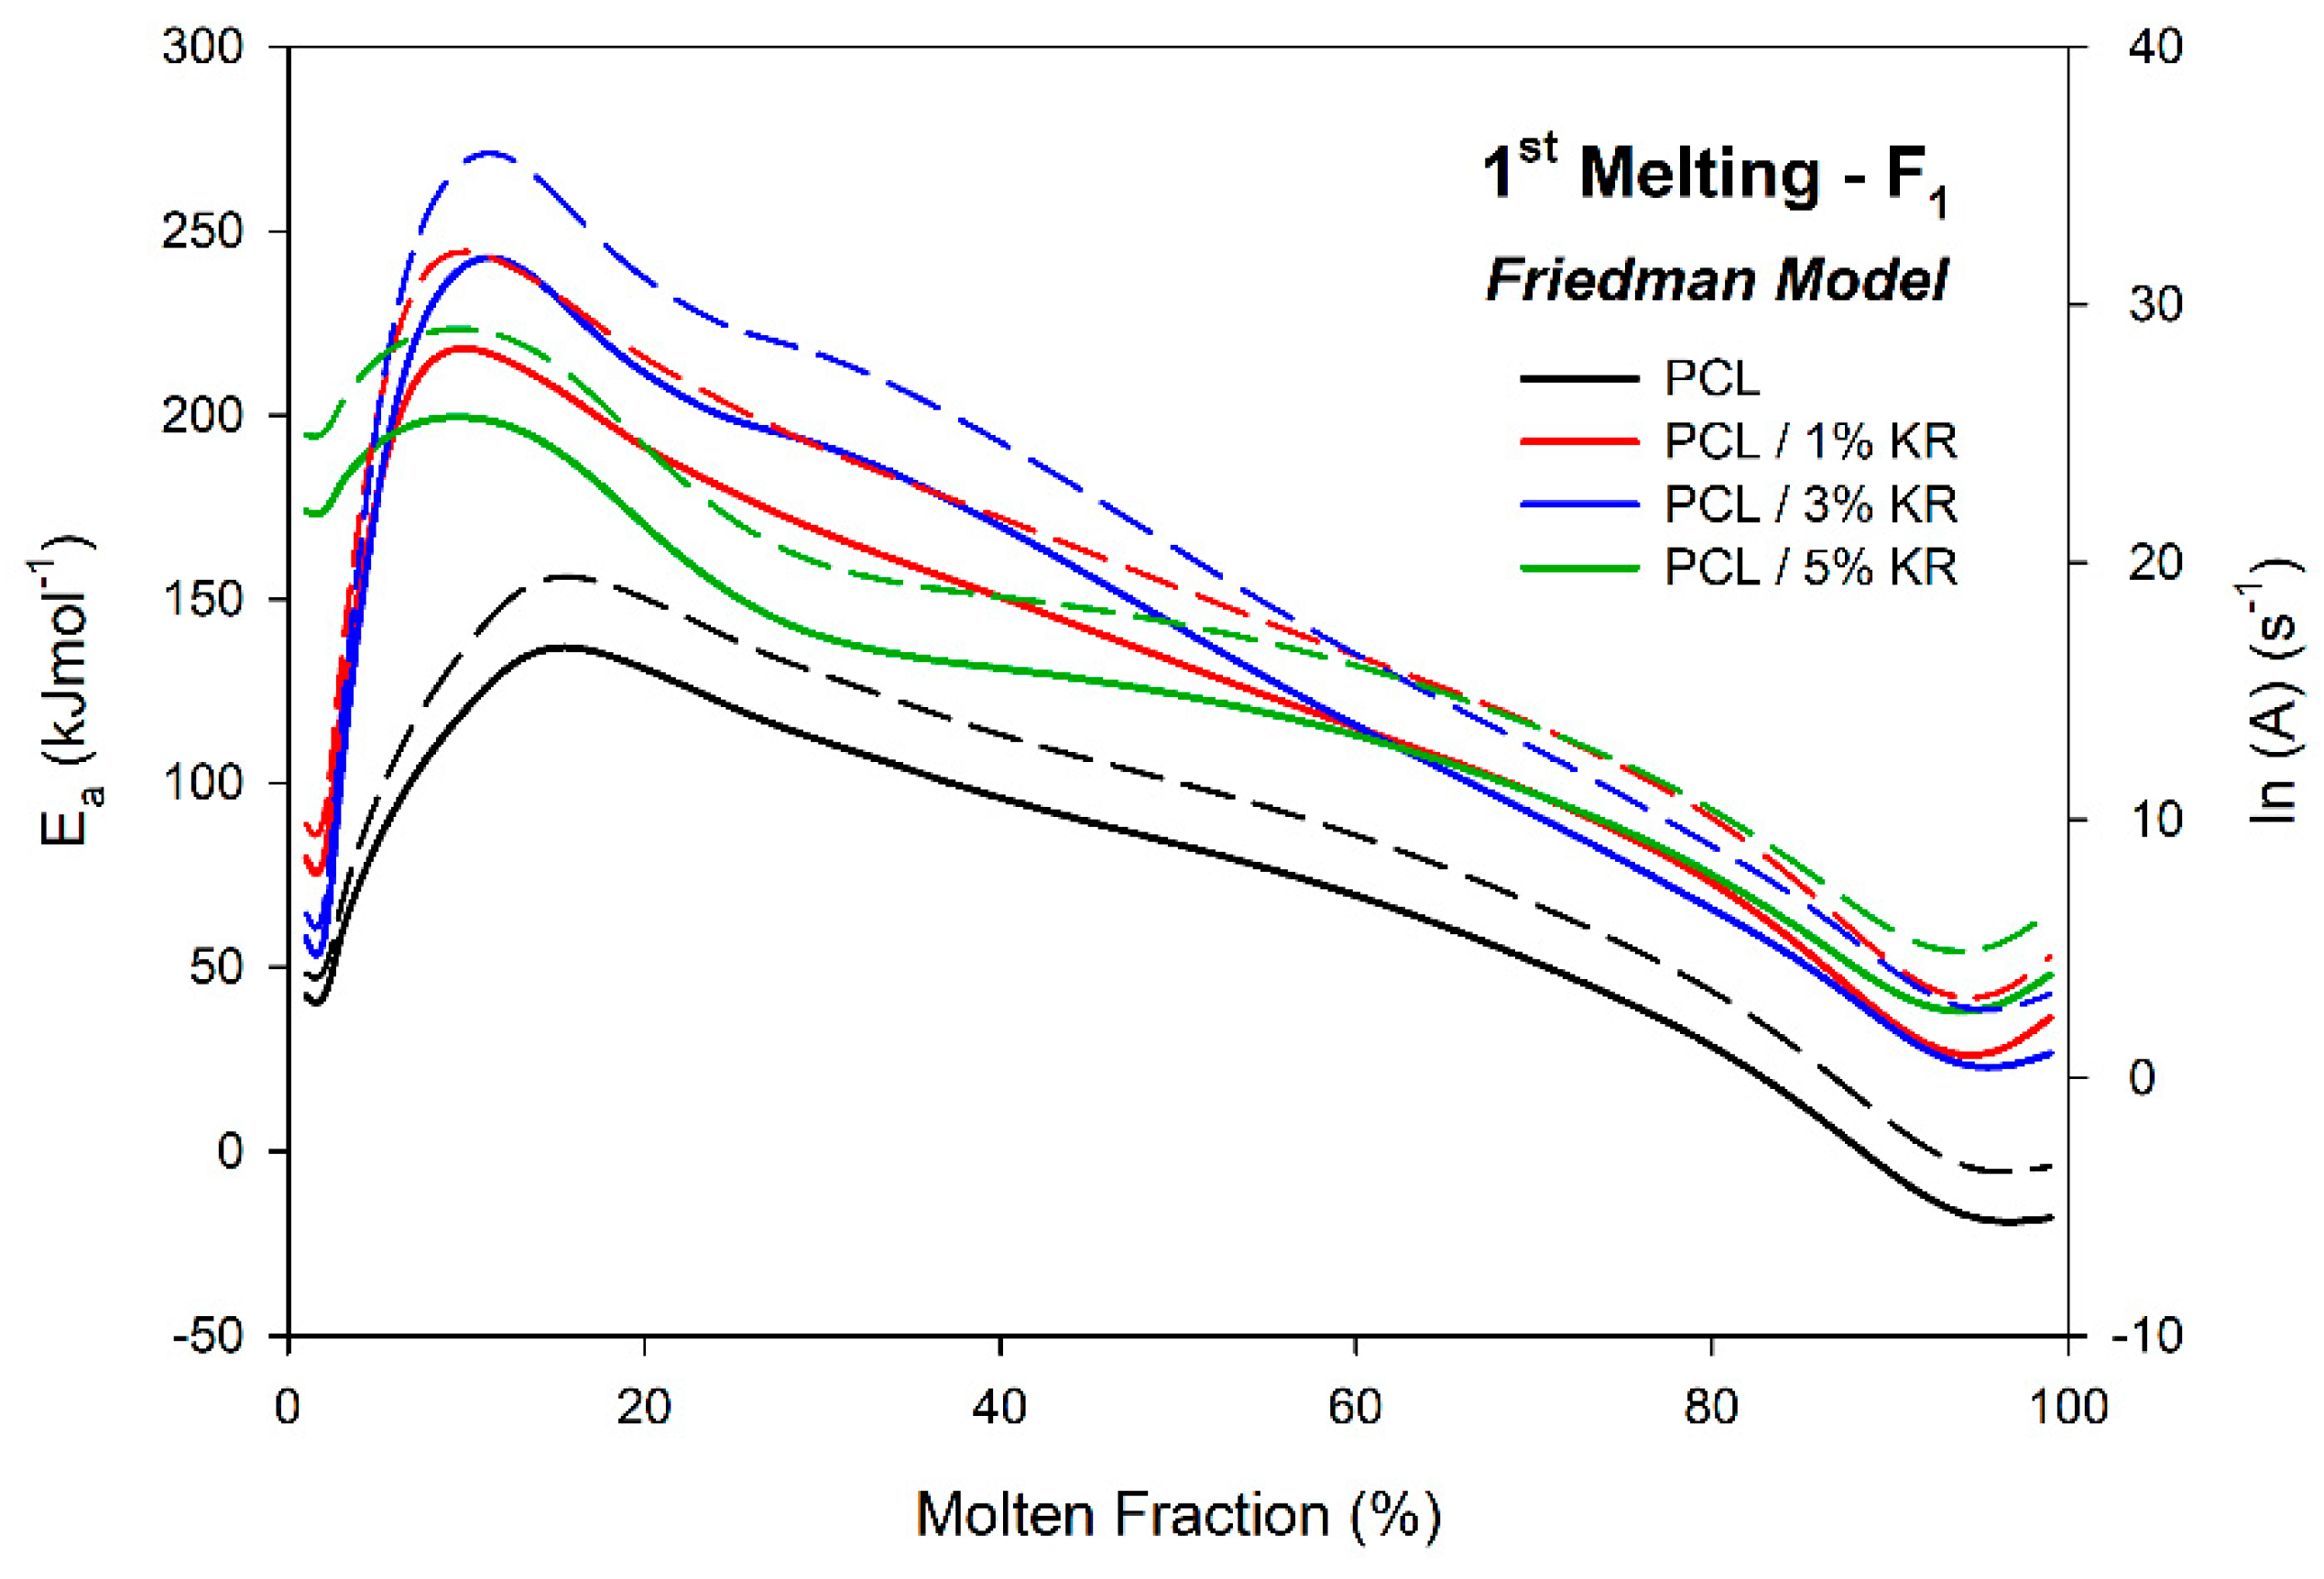
2.10. Activation Energy ()—First Fusion
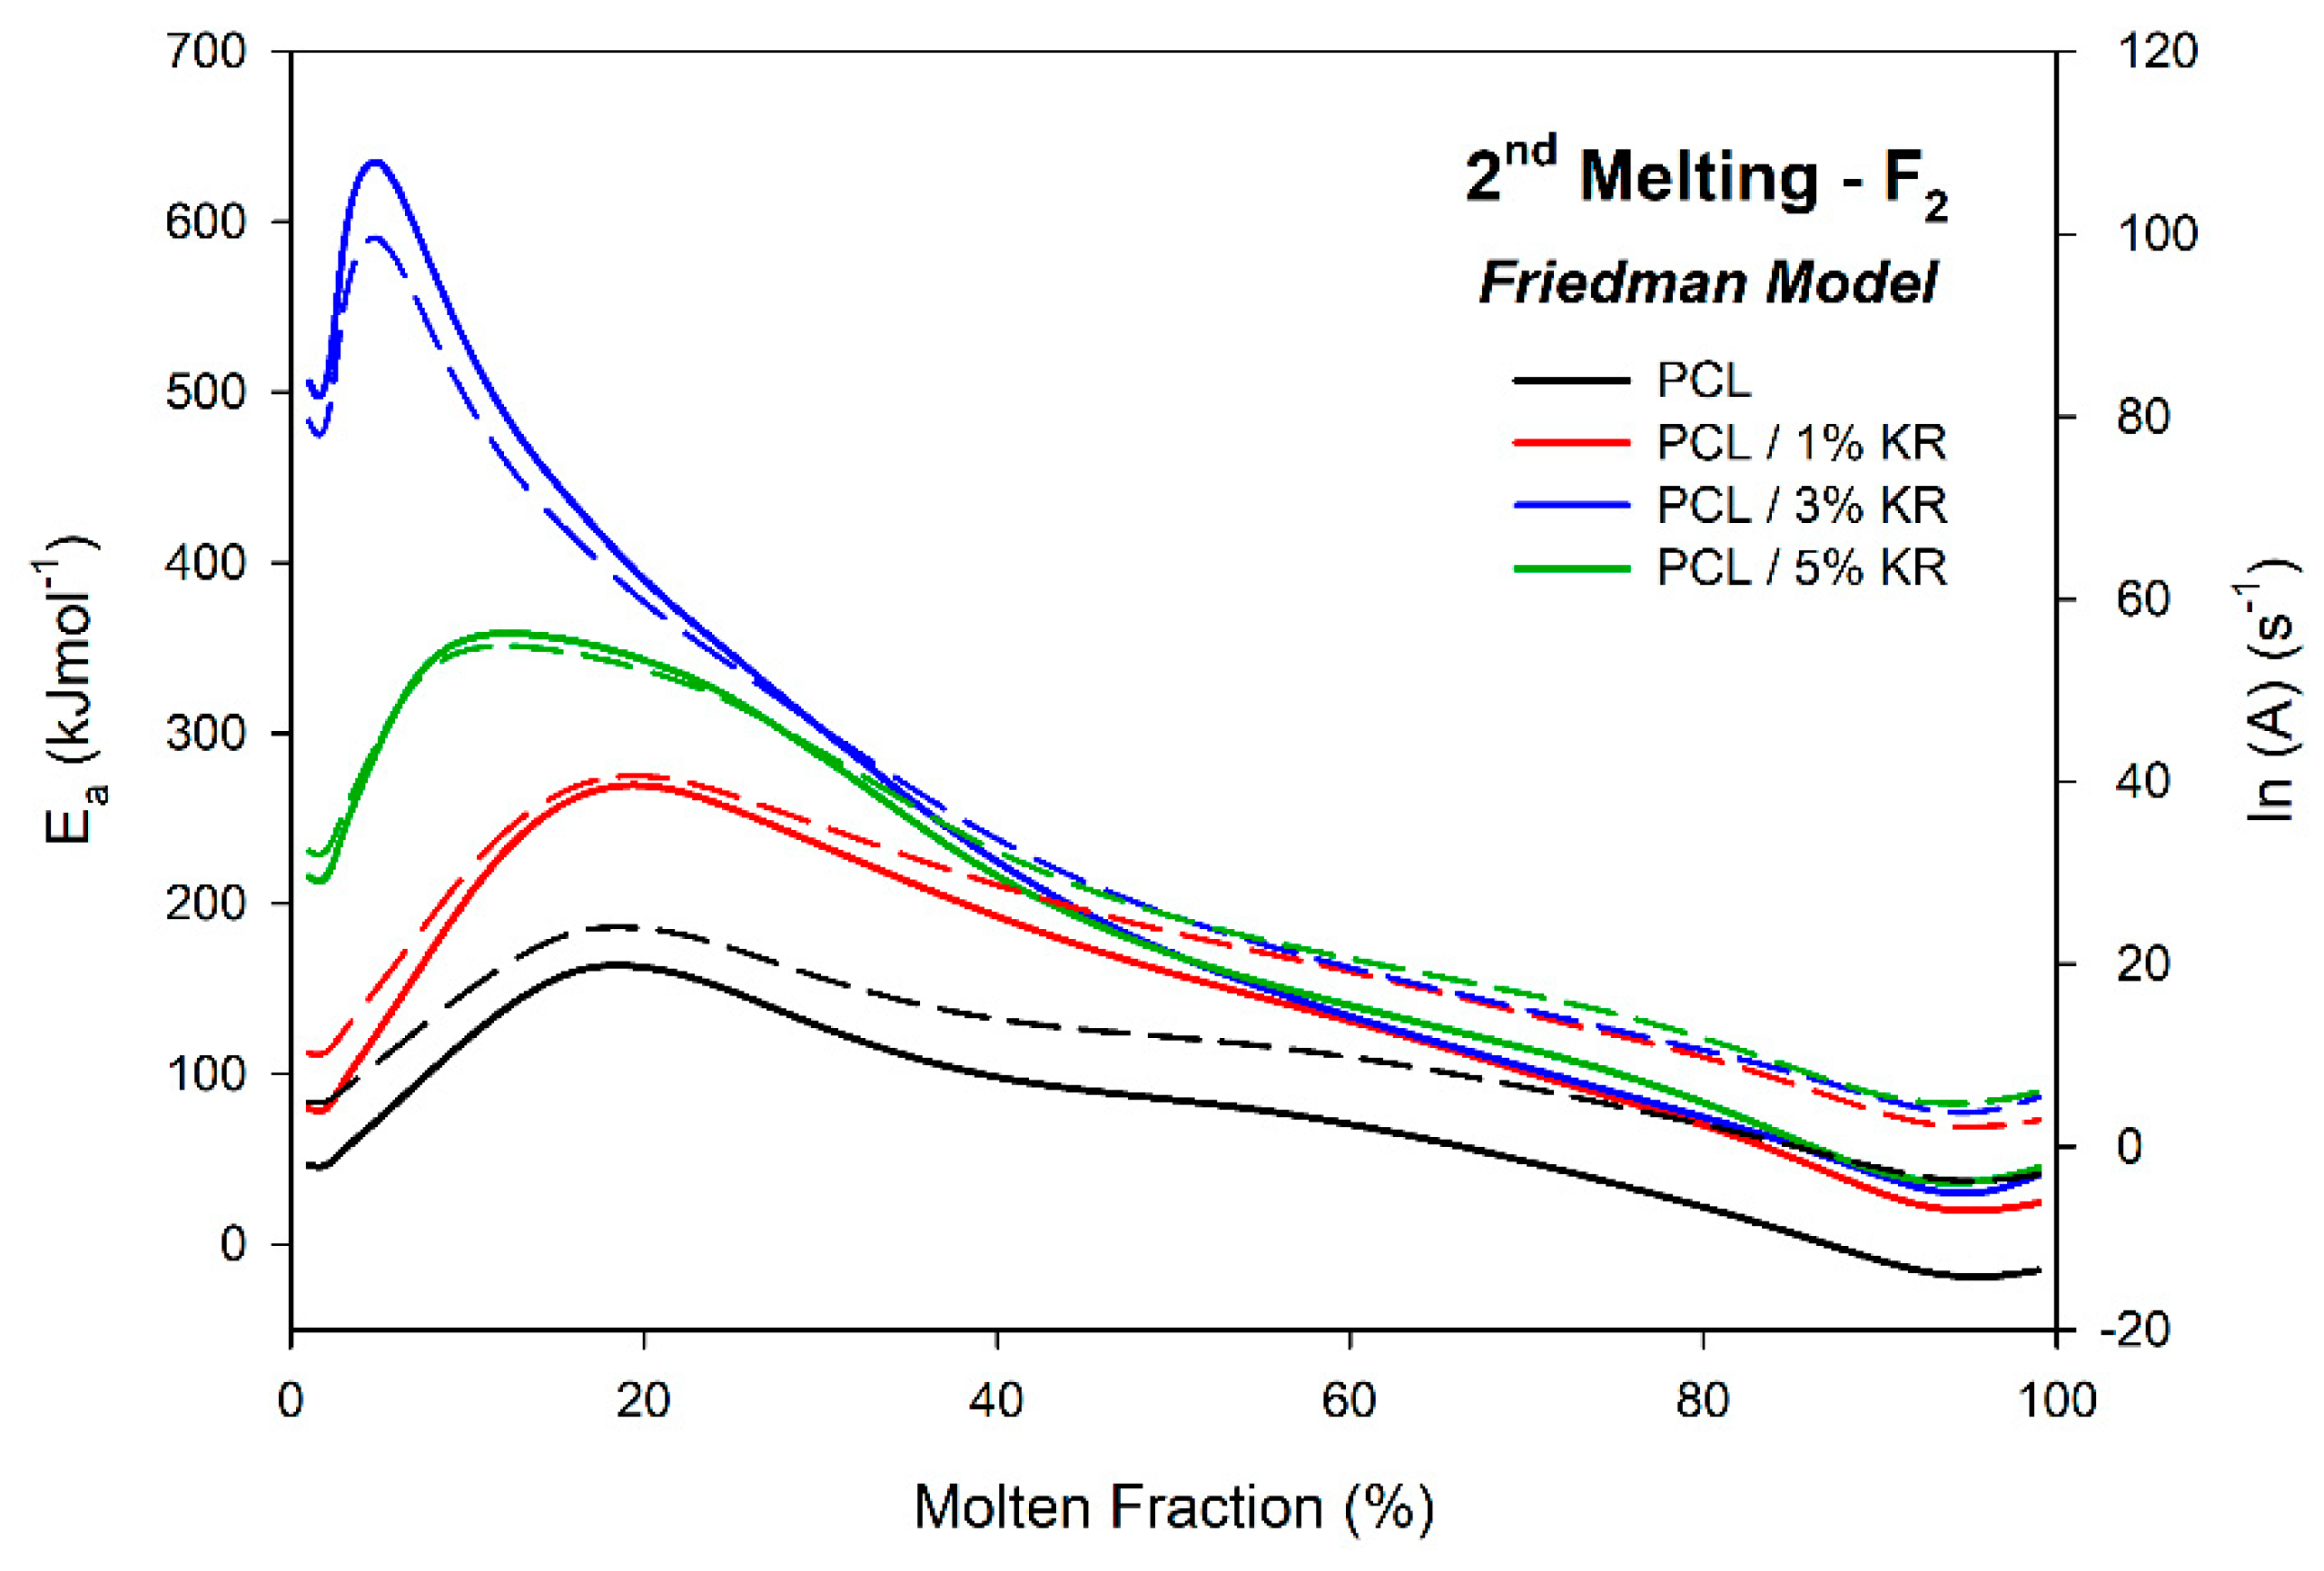
2.11. Activation Energy ()—Second Fusion
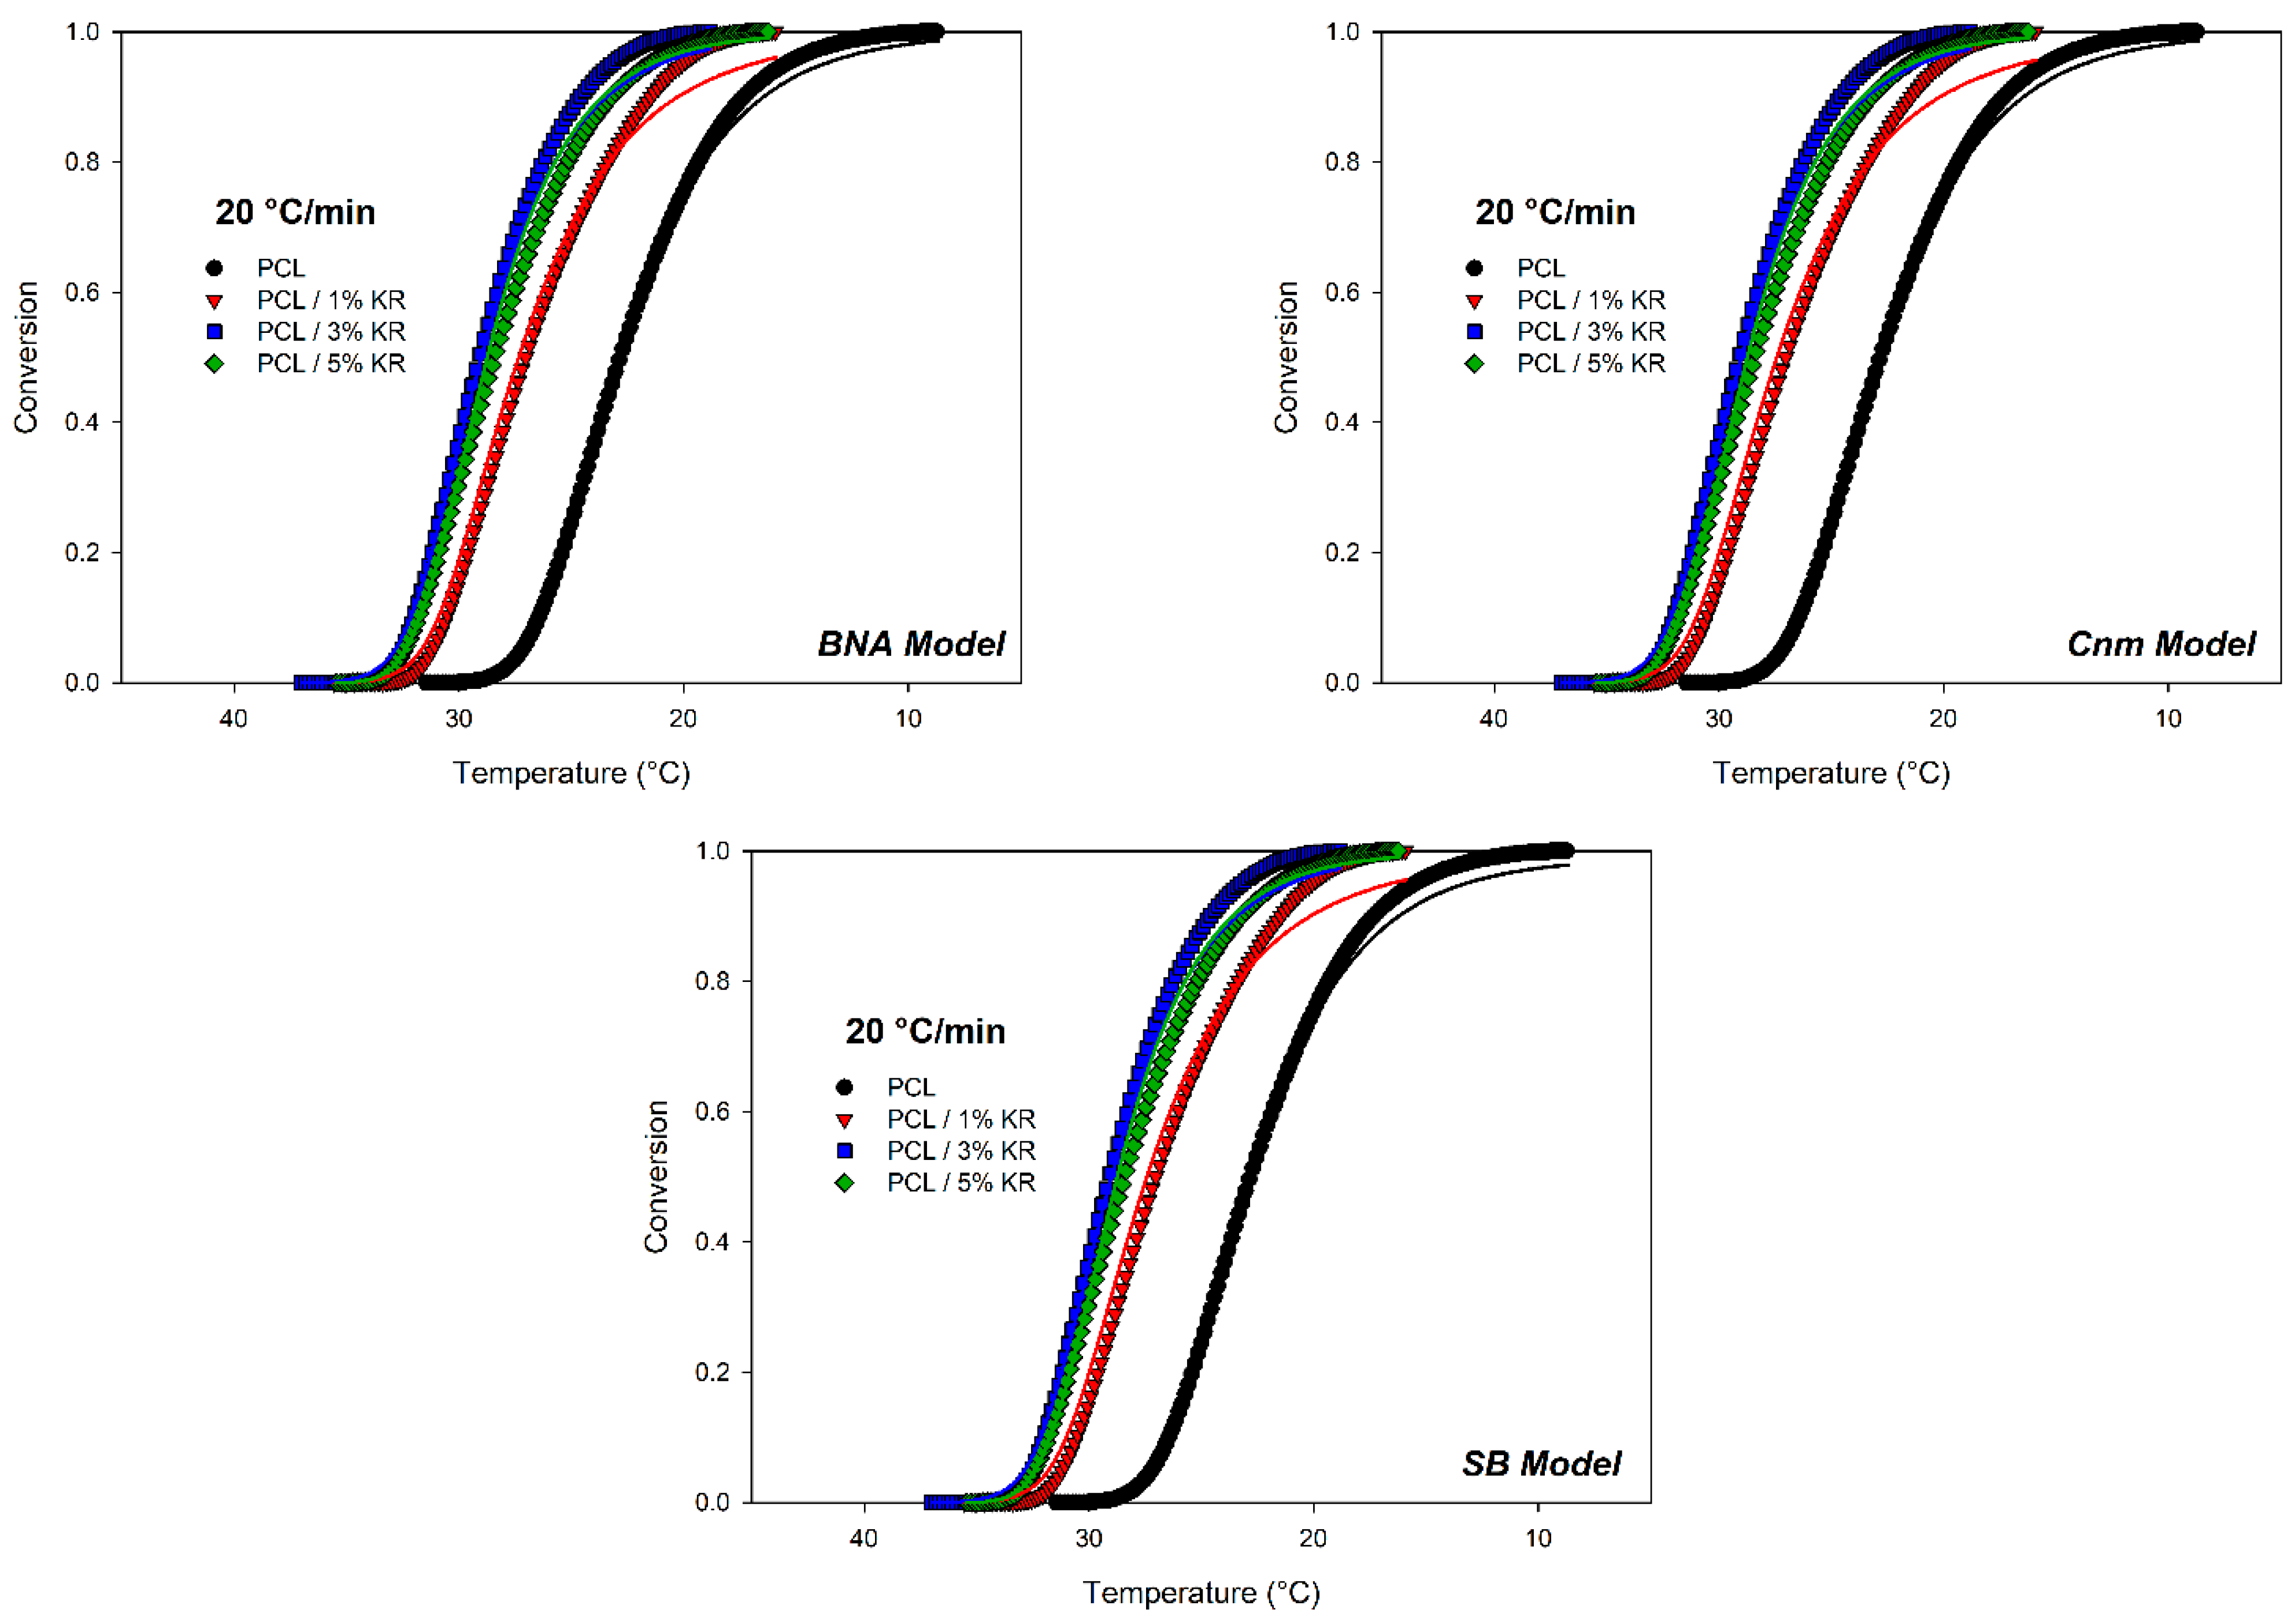
2.12. Model-Based Kinetics Analysis
3. Methodology
3.1. Materials
3.2. Production of PCL/KR Composites
3.3. Characterization of PCL and PCL/KR Composites
4. Conclusions
Supplementary Materials
Author Contributions
Funding
Institutional Review Board Statement
Informed Consent Statement
Data Availability Statement
Acknowledgments
Conflicts of Interest
References
- Daskalakis, E.; Hassan, M.H.; Omar, A.M.; Acar, A.A.; Fallah, A.; Cooper, G.; Weightman, A.; Blunn, G.; Koc, B.; Bartolo, P. Accelerated Degradation of Poly-ε-caprolactone Composite Scaffolds for Large Bone Defects. Polymers 2023, 15, 670. [Google Scholar] [CrossRef] [PubMed]
- Wu, C.S.; Shih, W.L.; Wang, S.S. 3D-printed filament composing duck bones, fish shells, and poly(ε-caprolactone) via a fused fabrication: Characterization, functionality, and application. Polym. Bull. 2024, 81, 5193–52142. [Google Scholar] [CrossRef]
- Nogueira, J.A.S.; Luna, C.B.B.; Silva, A.L.; Costa, A.C.F.M.; Melo, J.B.C.A.; Wellen, R.M.R.; Araújo, E.M. Turning residues of coconut flour in bioadditive: An alternative to accelerate PCL biodegradation. J. Polym. Res. 2023, 30, 334. [Google Scholar] [CrossRef]
- Togay, S.M.E.; Bulbul, Y.E.; Oymak, N.Ç.; Dilsiz, N. Development of poly(ε-caprolactone)-based composite packaging films incorporated nanofillers for enhanced strawberry quality. J. Appl. Polym. Sci. 2023, 140, e54611. [Google Scholar] [CrossRef]
- Bolourian, A.; Khasraghi, S.S.; Zarei, S.; Mahdavi, S.; Knonakdar, H.; Mousavi, S.R.; Khonakdar, H.A. Poly (ε-caprolactone)/polybutylene adipate terephthalate/hydroxyapatite blend bionanocomposites: Morphology–thermal degradation kinetics relationship. Polym. Bull. 2024, 81, 16757–16780. [Google Scholar] [CrossRef]
- Tomak, E.D.; Can, A.; Ermeydan, M.A. Biodegradability of Poly (ε-Caprolactone) Modified Wood by Decaying Fungi. J. Polym. Environ. 2023, 31, 4097–4111. [Google Scholar] [CrossRef]
- Yoshida, K.; Teramoto, S.; Gong, J.; Kobayashi, Y.; Ito, H. Enhanced Marine Biodegradation of Polycaprolactone through Incorporation of Mucus Bubble Powder from Violet Sea Snail as Protein Fillers. Polymers 2024, 16, 1830. [Google Scholar] [CrossRef]
- Archer, E.; Torretti, M.; Madbouly, S. Biodegradable polycaprolactone (PCL) based polymer and composites. Phys. Sci. Rev. 2023, 8, 4391–4414. [Google Scholar] [CrossRef]
- Emadi, H.; Karevan, M.; Rad, M.M.; Sadeghzade, S.; Pahlevanzadeh, F.; Khodaei, M.; Khayatzadeh, S.; Lotfian, S. Bioactive and Biodegradable Polycaprolactone-Based Nanocomposite for Bone Repair Applications. Polymers 2023, 15, 3617. [Google Scholar] [CrossRef]
- Uroro, E.O.; Bright, R.; Dabare, P.R.L.; Quek, J.Y.; Goswami, N.; Vasilev, K. Enzyme-responsive polycationic silver nanocluster-loaded PCL nanocomposites for antibacterial applications. Mater. Chem. 2023, 28, 101376. [Google Scholar] [CrossRef]
- Jeon, H.; Kim, M.S.; Park, S.B.; Kim, S.; Lee, M.; Park, S.A.; Hwang, S.Y.; Koo, J.M.; Oh, D.X.; Park, J. Improved mechanical properties of biodegradable polycaprolactone nanocomposites prepared using cellulose nanocrystals. Cellulose 2023, 30, 11561–11574. [Google Scholar] [CrossRef]
- Fenni, S.E.; Muller, A.J.; Cavallo, D. Understanding polymer nucleation by studying droplets crystallization in immiscible polymer blends. Polymer 2023, 264, 125514. [Google Scholar] [CrossRef]
- Murray, H.H. Chapter 5: Kaolin Applications. In Developments in Clay Science; Elsevier: Amsterdam, The Netherlands, 2006; Volume 2, pp. 85–109. [Google Scholar] [CrossRef]
- Detellier, C. Functional Kaolinite. Chem. Rec. 2018, 18, 868. [Google Scholar] [CrossRef]
- Murray, H.H.; Kogel, J.E. Engineered clay products for the paper industry. Appl. Clay Sci. 2005, 29, 199. [Google Scholar] [CrossRef]
- Xiao, Y.; Li, B.; Huang, Y.; Gong, Z.; Diao, P.; Wang, C.; Bian, H. High-value application of kaolin by wet mixing method in low heat generation and high wear-resistant natural rubber composites. Appl. Clay Sci. 2024, 261, 107574. [Google Scholar] [CrossRef]
- Pascual, S.; Cobos, G.; Seris, E.; González-Núñez, M. Effects of processed kaolin on pests and non-target arthropods in a Spanish olive grove. J. Pest Sci. 2010, 83, 121. [Google Scholar] [CrossRef]
- Ribeiro, F.R.; Egreja Filho, F.B.; Fabris, J.D.; Mussel Wda, N.; Novais, R.F. Potential use of a chemical leaching reject from a kaolin industry as agricultural fertilizer. Rev. Bras. De Ciênc. Do Solo 2007, 31, 939. [Google Scholar] [CrossRef]
- Malinowski, R.; Fiedurek, K.; Rytlewski, P.; Puszczykowska, N.; Kaczor, D.; Stasiek, A. The structure and selected properties of poly(ε-caprolactone)-based biodegradable composites with high calcium carbonate concentration. Sci. Total Environ. 2023, 867, 161528. [Google Scholar] [CrossRef]
- Holeová, S.; Barabaszová, K.C.; Hundaková, M.; Kratosová, G.; Kaloc, V.; Joszko, K.; Zroska, B.G. Comprehensive study of antimicrobial polycaprolactone/clay nanocomposite films: Preparation, characterization, properties and degradation in simulated body fluid. Polym. Compos. 2024, 45, 9280–9298. [Google Scholar] [CrossRef]
- Pires, L.S.O.; Fernandes, M.H.F.V.; Oliveira, J.M.M. Crystallization kinetics of PCL and PCL–glass composites for additive manufacturing. J. Therm. Anal. Calorim. 2018, 134, 2115–2125. [Google Scholar] [CrossRef]
- Mondal, K.; Bhagabati, P.; Goud, V.V.; Sakurai, S.; Katiyar, V. Utilization of microalgae residue and isolated cellulose nanocrystals: A study on crystallization kinetics of poly(ε-caprolactone) bio-composites. Int. J. Biol. Macromol. 2021, 191, 521–530. [Google Scholar] [CrossRef]
- Siqueira, D.D.; Luna, C.B.B.; Araújo, E.M.; Barros, A.B.; Wellen, R.M.R. Approaches on PCL/macaíba biocomposites—Mechanical, thermal, morphological properties and crystallization kinetics. Polym. Adv. Technol. 2021, 32, 3572–3587. [Google Scholar] [CrossRef]
- Gicheha, D.; Cisse, A.N.; Bhuiyan, A.; Shamin, N. Non-Isothermal Crystallization Kinetics of Poly (ε-Caprolactone) (PCL) and MgO Incorporated PCL Nanofibers. Polymers 2023, 15, 3013. [Google Scholar] [CrossRef] [PubMed]
- Paula, M.; Dionisio, R.; Vinhas, G.; Alves, S. Gamma irradiation effects on polycaprolactone/zinc oxide nanocomposite films. Polímeros 2019, 29, e2019014. [Google Scholar] [CrossRef]
- Lanfranconi, M.; Alvarez, V.A.; Luduenã, L.N. Isothermal crystallization of polycaprolactone/modified clay biodegradable nanocomposites. J. Therm. Anal. Calorim. 2016, 126, 1273–1280. [Google Scholar] [CrossRef]
- Siqueira, D.D.; Luna, C.B.B.; Araújo, E.M.; Filho, E.A.S.; Morais, D.D.S.; Wellen, R.M.R. Biodegradable Compounds of Poly (ε-Caprolactone)/Montmorillonite Clays. Mater. Res. 2019, 22, e20180813. [Google Scholar] [CrossRef]
- Siqueira, G.; Fraschini, C.; Bras, J.; Dufresne, A.; Prud Homme, R.; Laborie, M.P. Impact of the nature and shape of cellulosic nanoparticles on the isothermal crystallization kinetics of poly(ε-caprolactone). Eur. Polym. J. 2011, 47, 2216–2227. [Google Scholar] [CrossRef]
- Lv, Q.; Wu, D.; Qiu, Y.; Chen, J.; Yao, X.; Ding, K.; Wei, N. Crystallization of Poly(ϵ-caprolactone) composites with graphite nanoplatelets: Relations between nucleation and platelet thickness. Thermochim. Acta 2015, 612, 25–33. [Google Scholar] [CrossRef]
- Sousa, J.C.; Costa, A.R.M.; Lima, J.C.; Arruda, S.A.; Almeida, Y.M.B. Crystallization kinetics modeling, thermal properties and biodegradability of poly (ε-caprolactone)/niobium pentoxide and alumina compounds. Polym. Bull. 2021, 78, 7337–7353. [Google Scholar] [CrossRef]
- Eriksson, M.; Meuwissen, M.; Peijs, T.; Goossens, H. The Influence of Melt-Mixing Conditions and State of Dispersion on Crystallisation, Rheology and Mechanical Properties of PCL/Sepiolite Nanocomposites. Int. Polym. Process. 2020, 35, 302–313. [Google Scholar] [CrossRef]
- Qiao, X.; Li, W.; Sun, K.; Xu, S.; Chen, X. Isothermal crystallization kinetics of silk fibroin fiber-reinforced poly(ε-caprolactone) biocomposites. Polym. Int. 2009, 58, 530–537. [Google Scholar] [CrossRef]
- Peng, Y.; Musah, M.; Via, B.; Wang, X. Calcium Carbonate Particles Filled Homopolymer Polypropylene at Different Loading Levels: Mechanical Properties Characterization and Materials Failure Analysis. J. Compos. Sci. 2021, 5, 302. [Google Scholar] [CrossRef]
- Dweiri, R. Processing and Characterization of Surface Treated Chicken Eggshell and Calcium Carbonate Particles Filled High-Density Polyethylene Composites. Mater. Res. 2021, 24, e20210078. [Google Scholar] [CrossRef]
- Alshammari, B.A.; Alenad, A.M.; Mubaddel, F.A.A.; Alharbi, A.G.; Al-Shehri, A.S.; Albalwi, H.A.; Alsuabie, F.M.; Fouad, H.; Mourad, A.H.I. Impact of Hybrid Fillers on the Properties of High Density Polyethylene Based Composites. Polymers 2022, 14, 3427. [Google Scholar] [CrossRef] [PubMed]
- Golmakani, M.E.; Wiczenbach, T.; Malikan, M.; Aliakbari, R.; Eremeyev, V.A. Investigation of Wood Flour Size, Aspect Ratios, and Injection Molding Temperature on Mechanical Properties of Wood Flour/Polyethylene Composites. Materials 2021, 14, 3406. [Google Scholar] [CrossRef]
- Rana, A.K.; Mandal, A.; Bandyopadhyay, S. Short jute fiber reinforced polypropylene composites: Effect of compatibiliser, impact modifier and fiber loading. Compos. Sci. Technol. 2003, 63, 801–806. [Google Scholar] [CrossRef]
- Alves, A.M.; Cavalcanti, S.N.; Arimatéia, R.R.; Agrawal, P.; Freitas, N.L.; Mélo, T.J.A. Influência do Processamento e da Alumina Sintetizada em Laboratório nas Propriedades do Polipropileno. Rev. Eletrônica De Mater. E Process. 2016, 11, 155–163. [Google Scholar]
- Oliveira, A.D.; Castro, L.D.C.; Beatrice, C.A.G.; Lucas, A.A.; Pessan, L.A. Effect of Maleic Anhydride Content in Properties of PA6/AES Blends Compatibilized with MMA-MA. Mater. Res. 2017, 20, 1630–1637. [Google Scholar] [CrossRef]
- Castro, L.D.C.; Oliveira, A.D.; Kersch, M.; Altstadt, V.; Pessan, L.A. Effects of mixing protocol on morphology and properties of PA6/ABS blends compatibilized with MMA-MA. J. Appl. Polym. Sci. 2016, 133, 43612. [Google Scholar] [CrossRef]
- Perera, Y.S.; Naaib, M.; Arisyasinghe, N.; Abeykoon, C. Investigation of the effect of extrusion process parameters and filler loading on the performance of LDPE composites reinforced with eggshell poder. Compos. Part C Open Access 2025, 16, 100561. [Google Scholar] [CrossRef]
- Vieira, K.P.; Reichert, A.A.; Cholant, G.M.; Marin, D.; Beatrice, C.A.G.; Oliveira, A.D. Sustainable composites of eco-friendly polyethylene reinforced with eggshells and bio-calcium carbonate. Polímeros 2023, 33, e20230026. [Google Scholar] [CrossRef]
- Dhakal, H.; Bourmaud, A.; Berzin, F.; Almansour, F.; Zhang, Z.; Shah, D.U.; Beaugrand, J. Mechanical properties of leaf sheath date palm fibre waste biomass reinforced polycaprolactone (PCL) biocomposites. Ind. Crops Prod. 2018, 126, 394–402. [Google Scholar] [CrossRef]
- Kai, W.; Hirota, Y.; Hua, L.; Inoue, Y. Thermal and mechanical properties of a poly(ϵ-caprolactone)/graphite oxide composite. J. Appl. Polym. Sci. 2008, 107, 1395–1400. [Google Scholar] [CrossRef]
- Finkenstadt, V.L.; Mohamed, A.A.; Biresaw, G.; Willett, J.L. Mechanical properties of green composites with polycaprolactone and wheat gluten. J. Appl. Polym. Sci. 2008, 110, 2218–2226. [Google Scholar] [CrossRef]
- Garcia, D.G.; Ferri, J.M.; Boronat, T.; Martinez, J.L.; Balart, R. Processing and characterization of binary poly(hydroxybutyrate) (PHB) and poly(caprolactone) (PCL) blends with improved impact properties. Polym. Bull. 2016, 73, 3333–3350. [Google Scholar] [CrossRef]
- Barbosa, J.M.; Pacheco, C.V.; Szilágyi, G.; Oliveira, P.C.; Peres, R.M.; Ribeiro, H. Micro and nanoparticulate PP/CaCO3 composites mechanical, thermal and transport properties—DOE. Polímeros 2025, 35, e20250003. [Google Scholar] [CrossRef]
- Souza, P.S.; Sousa, A.M.F.; Silva, A.L.N. Effect of process parameters on the properties of LDPE/sepiolite composites. Polímeros 2024, 34, e20240015. [Google Scholar] [CrossRef]
- Carvalho, G.M.X.; Mansur, H.S.; Vasconcelos, W.L.; Oréfice, R.L. Composites Obtained by the Combination of Slate Powder and Polypropylene. Polímeros 2007, 17, 98–103. [Google Scholar] [CrossRef]
- McGenity, P.M.; Hooper, J.J.; Paynter, C.D.; Riley, A.M.; Nutbeem, C.; Elton, N.J.; Adams, J.M. Nucleation and crystallization of polypropylene by mineral fillers: Relationship to impact strength. Polymer 1992, 33, 5215–5224. [Google Scholar] [CrossRef]
- Barreto, J.; Soares, N.; Souza, M.; Dantas, L.; Silva, I.; Luna, C.; Araújo, E.; Wellen, R. Curing and degradation kinetics of crosslinked epoxidized soybean oil with isosorbide-based curing agent. J. Environ. Chem. Eng. 2024, 12, 112400. [Google Scholar] [CrossRef]
- Nurdina, A.K.; Mariatti, M.; Samayamutthirian, P. Effect of single-mineral filler and hybrid-mineral filler additives on the properties of polypropylene composites. J. Vinyl Addit. Technol. 2009, 15, 20–28. [Google Scholar] [CrossRef]
- Sanchez, M.S.; Mathot, V.B.F.; Poel, G.V.; Ribelles, J.L.G. Effect of the Cooling Rate on the Nucleation Kinetics of Poly(l-Lactic Acid) and Its Influence on Morphology. Macromolecules 2007, 40, 7989–7997. [Google Scholar] [CrossRef]
- Barreto, J.V.M.; Gomes, A.A.S.; Araújo, A.M.; Ries, A.; Barros, J.J.P.; Wellen, R.M.R. Crystallization and fusion kinetics of Poly(butylene terephthalate)/Titanium Dioxide. Polímeros 2023, 33, e20230006. [Google Scholar] [CrossRef]
- Barros, A.B.S.; Farias, R.F.; Siqueira, D.D.; Luna, C.B.B.; Araújo, E.M.; Rabello, M.S.; Wellen, R.M.R. The Effect of ZnO on the Failure of PET by Environmental Stress Cracking. Materials 2020, 13, 2844. [Google Scholar] [CrossRef]
- Luna, C.B.B.; Ferreira, E.S.B.; Siqueira, D.D.; Araújo, E.M.; Nascimento, E.P.; Medeiros, E.S.; Mélo, T.J.A. Electrical nanocomposites of PA6/ABS/ABS-MA reinforced with carbon nanotubes (MWCNTf) for antistatic packaging. Polym. Compos. 2022, 43, 3639–3658. [Google Scholar] [CrossRef]
- Coutinho, S.V.C.R.; Barros, A.B.S.; Barros, J.J.P.; Albuquerque, A.K.C.; Barreto, J.V.M.; Siqueira, D.D.; Ries, A.; Wellen, R.M.R. On the nonisothermal melt crystallization kinetics of industrial batch crosslinked polyethylene. J. Appl. Polym. Sci. 2021, 138, 50807. [Google Scholar] [CrossRef]
- Friedman, H.L. Kinetics of thermal degradation of char-forming plastics from thermogravimetry. Application to a phenolic plastic. J. Polym. Sci. Part C Polym. Symp. 1964, 6, 183–195. [Google Scholar] [CrossRef]
- Lippits, D.R.; Rastogi, S.; Höhne, G.W.H. Melting Kinetics in Polymers. Phys. Rev. Lett. 2006, 96, 218303. [Google Scholar] [CrossRef]
- Friedman, B.; O’Shaughessy, B. Scaling and Universality in Polymer Reaction Kinetics. Int. J. Mod. Phys. 1994, 8, 2555–2591. [Google Scholar] [CrossRef]
- Vyazovkin, S. Activation Energies and Temperature Dependencies of the Rates of Crystallization and Melting of Polymers. Polymers 2020, 12, 1070. [Google Scholar] [CrossRef]
- Sato, S.; Oka, K.; Murakami, A. Heat transfer behavior of melting polymers in laminar flow field. Polym. Eng. Sci. 2004, 44, 423. [Google Scholar] [CrossRef]
- Carley, J.F. Fundamentals of melt rheology, heat generation, and heat transfer as applied to polymer processing. Polym. Eng. Sci. 1966, 6, 158. [Google Scholar] [CrossRef]
- Griffin, O.M. Heat transfer to molten polymers. Polym. Eng. Sci. 1972, 12, 140. [Google Scholar] [CrossRef]
- Fakirov, S.; Fischer, E.W.; Hoffmann, R.; Schimidt, G.F. Structure and properties of poly(ethylene terephthalate) crystallized by annealing in the highly oriented state: 2. Melting behaviour and the mosaic block structure of the crystalline layers. Polymer 1977, 18, 1121–1129. [Google Scholar] [CrossRef]
- Brown, M.E.; Glass, B.D. Pharmaceutical applications of the Prout–Tompkins rate equation. Int. J. Pharm. 1999, 190, 129–137. [Google Scholar] [CrossRef]
- Criado, J.M.; Málek, J.; Gotor, F.J. The applicability of the Šesták-Berggren kinetic equation in constant rate thermal analysis (CRTA). Thermochim. Acta 1990, 158, 205. [Google Scholar] [CrossRef]
- Silva, A.L.; Chaves, A.C.; Neves, G.A.; Costa, A.C.F.; Brito, D.F. Obtaining mullite from kaolin waste through thermal treatment in conventional oven. Res. Soc. Dev. 2021, 10, e283101220653. [Google Scholar] [CrossRef]
- Gassner, F.; Owen, A.J. Physical properties of poly(β-hydroxybutyrate)-poly(ε-caprolactone) blends. Polymer 1994, 35, 2233–2236. [Google Scholar] [CrossRef]


| φ (°C/min) | Parameter | PCL | PCL/1% KR | PCL/3% KR | PCL/5% KR |
|---|---|---|---|---|---|
| 5 | cmax (min−1) T1C (°C) TPC (°C) T2C (°C) ΔH (J/g) | 0.825 35.5 32.8 25.5 53.72 | 1.093 38.3 36.2 29.0 52.93 | 1.302 39.2 37.3 30.6 52.51 | 1.199 39.6 37.2 30.3 48.17 |
| 10 | cmax (min−1) T1C (°C) TPC (°C) T2C (°C) ΔH (J/g) | 1.582 32.2 28.3 19.2 47.9 | 1.601 35.6 32.7 22.4 51.10 | 1.635 36.2 33.5 23.9 55.20 | 1.748 36.5 34.2 25.5 48.27 |
| 15 | cmax (min−1) T1C (°C) TPC (°C) T2C (°C) ΔH (J/g) | 1.689 30.6 24.6 13.3 64.45 | 1.691 33.2 29.4 17.4 52.89 | 1.891 34.2 30.8 19.3 51.37 | 2.1359 34.7 31.9 21.1 50.02 |
| 20 | cmax (min−1) T1C (°C) TPC (°C) T2C (°C) ΔH (J/g) | 1.902 27.9 23.9 13.5 57.57 | 1.946 32.0 28.2 16.8 49.32 | 2.394 33.2 29.3 20.7 49.19 | 2.027 33.2 29.9 18.9 50.35 |
| 25 | cmax (min−1) T1C (°C) TPC (°C) T2C (°C) ΔH (J/g) | 1.818 27.4 23.5 12.7 56.86 | 2.191 31.9 28.6 18.7 45.55 | 2.307 34.5 29.9 20.3 46.65 | 2.277 34.5 29.8 19.7 47.76 |
| φ (°C/min) | Parameter | PCL | PCL/1% KR | PCL/3% KR | PCL/5% KR |
|---|---|---|---|---|---|
| 5 | cmax (min−1) T1S (°C) TPS (°C) T2S (°C) ΔH (J/g) | 0.988 47.8 59.6 62.9 50.23 | 0.898 50.4 60.0 64.7 50.66 | 1.005 50.6 59.8 63.7 49.91 | 0.975 50.6 60.3 64.7 45.55 |
| 10 | cmax (min−1) T1S (°C) TPS (°C) T2S (°C) ΔH (J/g) | 1.456 47.7 58.5 64.2 64.87 | 1.448 50.5 61.0 67.3 47.73 | 1.359 50.5 61.8 68.4 51.29 | 1.384 50.5 61.1 67.7 44.39 |
| 15 | cmax (min−1) T1S (°C) TPS (°C) T2S (°C) ΔH (J/g) | 1.632 47.9 61.2 70.4 56.23 | 1.537 50.2 63.2 73.1 47.41 | 1.604 50.2 62.8 72.7 45.05 | 1.741 50.38 62.1 70.9 46.40 |
| 20 | cmax (min−1) T1S (°C) TPS (°C) T2S (°C) ΔH (J/g) | 1.988 51.0 62.7 74.9 49.57 | 1.915 51.0 63.5 74.3 46.40 | 1.963 51.0 63.1 74.9 46.96 | 1.803 51.0 64.7 76.6 45.11 |
| 25 | cmax (min−1) T1S (°C) TPS (°C) T2S (°C) ΔH (J/g) | 2.128 48.8 64.5 77.5 51.59 | 2.247 50.5 64.1 77.5 43.94 | 2.066 49.3 64.2 77.5 46.12 | 2.449 52.4 64.8 77.5 42.88 |
| Mechanism Function | Model Parameters | PCL -- | PCL 1% KR | PCL 3% KR | PCL 5% KR |
|---|---|---|---|---|---|
| Bna Mechanism | (kJmol−1) ln A (s−1) n AutoCatOrder R2 | −96.65 −17.908 1.712 0.640 0.97966 | −98.31 −17.846 1.886 0.674 0.97045 | −106.43 −19.107 1.703 0.711 0.98559 | −97.50 −17.610 1.560 0.678 0.98347 |
| Cnm Mechanism | (kJmol−1) ln A (s−1) n m R2 | −96.65 −27.901 1.712 0.640 0.97966 | −97.247 −27.654 1.876 0.674 0.97029 | −106.69 −29.150 1.705 0.711 0.98581 | −97.50 −27.602 1.560 0.678 0.98347 |
| SB Mechanism | (kJmol−1) ln A (s−1) n AutoCatOrder R2 | −96.25 −17.844 1.698 0.627 0.97957 | −96.37 −17.518 1.864 0.662 0.97010 | −106.36 −19.097 1.721 0.666 0.98540 | −97.52 −17.612 1.565 0.668 0.98346 |
Disclaimer/Publisher’s Note: The statements, opinions and data contained in all publications are solely those of the individual author(s) and contributor(s) and not of MDPI and/or the editor(s). MDPI and/or the editor(s) disclaim responsibility for any injury to people or property resulting from any ideas, methods, instructions or products referred to in the content. |
© 2025 by the authors. Licensee MDPI, Basel, Switzerland. This article is an open access article distributed under the terms and conditions of the Creative Commons Attribution (CC BY) license (https://creativecommons.org/licenses/by/4.0/).
Share and Cite
Luna, C.B.B.; Nogueira, J.A.d.S.; Barreto, J.V.M.; Bezerra, E.B.; da Silva, F.S.; Dantas, L.V.M.; Wellen, R.M.R.; Araújo, E.M. Reusing Kaolin Residue from the Mining Industry to Produce PCL-Based Composites: Accelerating the Crystallization Process and Improving Mechanical Properties. Int. J. Mol. Sci. 2025, 26, 4632. https://doi.org/10.3390/ijms26104632
Luna CBB, Nogueira JAdS, Barreto JVM, Bezerra EB, da Silva FS, Dantas LVM, Wellen RMR, Araújo EM. Reusing Kaolin Residue from the Mining Industry to Produce PCL-Based Composites: Accelerating the Crystallization Process and Improving Mechanical Properties. International Journal of Molecular Sciences. 2025; 26(10):4632. https://doi.org/10.3390/ijms26104632
Chicago/Turabian StyleLuna, Carlos Bruno Barreto, Jessika Andrade dos Santos Nogueira, José Vinícius Melo Barreto, Elieber Barros Bezerra, Fabiano Santana da Silva, Lorena Vanessa Medeiros Dantas, Renate Maria Ramos Wellen, and Edcleide Maria Araújo. 2025. "Reusing Kaolin Residue from the Mining Industry to Produce PCL-Based Composites: Accelerating the Crystallization Process and Improving Mechanical Properties" International Journal of Molecular Sciences 26, no. 10: 4632. https://doi.org/10.3390/ijms26104632
APA StyleLuna, C. B. B., Nogueira, J. A. d. S., Barreto, J. V. M., Bezerra, E. B., da Silva, F. S., Dantas, L. V. M., Wellen, R. M. R., & Araújo, E. M. (2025). Reusing Kaolin Residue from the Mining Industry to Produce PCL-Based Composites: Accelerating the Crystallization Process and Improving Mechanical Properties. International Journal of Molecular Sciences, 26(10), 4632. https://doi.org/10.3390/ijms26104632