Article

An Ionic Liquid-Assisted Mixed Micelle-Mediated Centrifuge-Less Cloud Point Extraction Spectrophotometric Method for the Determination of Molybdenum(VI)

1
Department of Chemical Sciences, Faculty of Pharmacy, Medical University of Plovdiv, 120 Buxton Bros Str., 4004 Plovdiv, Bulgaria
2
Department of Analytical Chemistry, Faculty of Science, Pavol Jozef Šafárik University in Košice, SK-04154 Košice, Slovakia
*
Author to whom correspondence should be addressed.
Int. J. Mol. Sci. 2025, 26(10), 4597; https://doi.org/10.3390/ijms26104597
Submission received: 14 April 2025 / Revised: 8 May 2025 / Accepted: 9 May 2025 / Published: 11 May 2025

Abstract

A novel method for the spectrophotometric determination of trace amounts of molybdenum has been developed. This method utilizes a centrifuge-less cloud point extraction (CL-CPE) in a mixed micellar (MM) system containing a nonionic surfactant (Triton X-114) and an ionic liquid (Aliquat® 336, A336). The chromophore chelating reagent employed was 4-nitrocatechol (4NC, H2L). This work marks its first application as a CPE reagent. Under the optimal conditions, Mo(VI) forms a yellow ternary complex with 4NC and A336, which can be represented by the formula (A336+)2[MoO2L2]. The method possesses the following characteristics: limit of detection (LOD) of 3.2 ng mL−1, linear range of 10.8–580 ng/mL, absorption maximum of 435 nm, molar absorptivity coefficient of 3.34 × 10⁵ L mol−1 cm−1, and Sandell’s sensitivity of 0.29 ng cm−2. The method has been successfully employed for the determination of molybdenum in reference standard steel samples, bottled mineral water, and a molybdenum-containing dietary supplement.

1. Introduction

Molybdenum is the sole element of the second transition series that is essential to life. It functions as a cofactor for a variety of enzymes, some of which are particularly important for humans [1]. The synthesis and action of these enzymes are contingent on dietary intake. Molybdenum is naturally present in various foodstuffs, including legumes (lentils, beans, peas), whole grains (oats, barley, wheat), nuts (almonds, peanuts), leafy vegetables, dairy products, and organ meats (liver, kidney) [2]. More than one-third of freshwater supplies contain molybdenum, and some estimates suggest that up to about 20% of the body’s molybdenum intake comes from drinking water [3]. The European Food Safety Authority (EFSA) has proposed an adequate intake (AI) of 65 μg day−1 for adults, including pregnant and breastfeeding women, and AIs ranging from 10 to 65 μg day−1 for infants, children, and teenagers [4]. The essentiality and toxicity of molybdenum have been addressed many times. Molybdenum is known to be toxic at high concentrations. There have been documented cases of acute poisoning resulting from the ingestion of molybdenum supplements or in the context of occupational activities [2,5]. However, it should be noted that there are dietary supplement manufacturers that offer products for long-term use with Mo(VI) concentrations that exceed the AIs by more than 500%.
Molybdenum-containing materials are of critical importance across a wide range of industries due to their remarkable properties, including high strength, corrosion resistance, and thermal stability. These materials find primary employment in the aerospace, defense, power generation, electronics, chemical, and metallurgical industries. Presently, the predominant application of molybdenum is in the manufacturing of steels and alloys [6]. Molybdenum enhances the hardness, strength, ductility, and resistance of these products, even at high temperatures [7,8].
A variety of techniques have been used to determine molybdenum, including inductively coupled plasma mass spectrometry (ICP-MS), inductively coupled plasma optical emission spectrometry (ICP-OES), graphite furnace atomic absorption spectrometry (GFAAS), X-ray fluorescence spectrometry (XRF), neutron activation analysis (NAA), and spectrophotometry (UV–Vis). Among these techniques, spectrophotometry stands out for its simplicity, cost-effectiveness, convenience, and well-established analytical capability. Its integration with extraction methodologies has been demonstrated to enhance analytical performance [9,10].
In recent years, a variety of color-forming reagents have been employed for the spectrophotometric determination of molybdenum. These reagents include pyrogallol red [11,12,13], bromopyrogallol red [14], 6,7-dihydroxy-2,4-diphenylbenzopyrylium salts [15,16], and 4-nitrocatechol [17,18,19]. The reagent 4-nitrocatechol (4NC, Figure 1) is a commercially available and inexpensive compound that has been listed by IUPAC as one of the most useful organic analytical reagents [20]. According to European Union Regulation (EC) No. 1272/2008 (CLP regulation), it is classified as a non-hazardous substance [21], meaning it is considered safe for both human health and the environment. However, its use has so far been limited only to applications in classical liquid–liquid extraction (LLE) [22,23,24,25] and electrochemistry [25,26]. The predominant LLE methods for the determination of Mo(VI) involve the use of cationic ion-association reagents of the spherical type (tetrazolium salts), as classified by Tôei [27]. A notable drawback of these methods is their dependence on toxic organic solvents (chloroform and dichloroethane), which are of considerable concern. Our attempts to eliminate these solvents by using cloud point extraction (CPE) as a green analytical technique [28,29,30,31,32,33,34] were unsuccessful, probably because the tetrazolium ion-associates are unstable in CPE processes [35]. However, our preliminary studies have shown that the substitution of tetrazolium salts by chain-type ion-association reagents (such as cetylpyridinium chloride and Aliquat 336) allows for the use of CPE, including its simplest variant, centrifuge-less CPE (CL-CPE).
The objective of the present study is to develop a spectrophotometric method for determining molybdenum in real samples in a mixed micellar (MM) CPE system containing 4NC and both the non-ionic surfactant Triton X-114 (TX-114) and the cationic surfactant Aliquat 336 (A336), which is also an ionic liquid (IL). The employment of MM-CPE systems is regarded as a novel and increasingly significant approach to enhancing the efficacy of CPE [33,34]. A parallel assertion can be made about the utilization of ILs [34].
A336 is a type of IL that contains a mixture of methyltrialkyl(C8,C10)ammonium chlorides [36]. In the fields of analytical chemistry and hydrometallurgy, it functions as an ion-pairing reagent, extractant, and extractor carrier [37,38,39]. Its application in CPE has been documented [40,41], and in a particular study, it was utilized in conjunction with TX-114 [41].
This study marks the inaugural application of 4NC as a CPE reagent. A key element of the study is the ability to directly compare CPE and LLE. Despite the popular belief that CPE is simply a green alternative to LLE that does not use toxic organic solvents, there is a lack of knowledge regarding the differences between the two techniques, particularly in scenarios involving the extraction of ion-association complexes [35].

2. Results and Discussion

2.1. CPE–Spectrophotometric Optimization

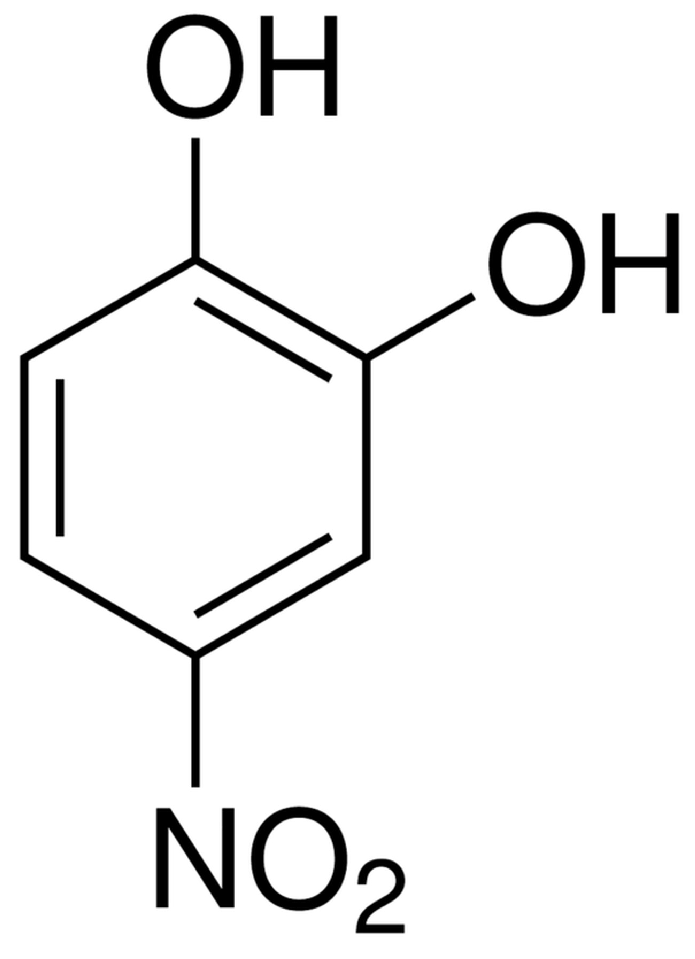
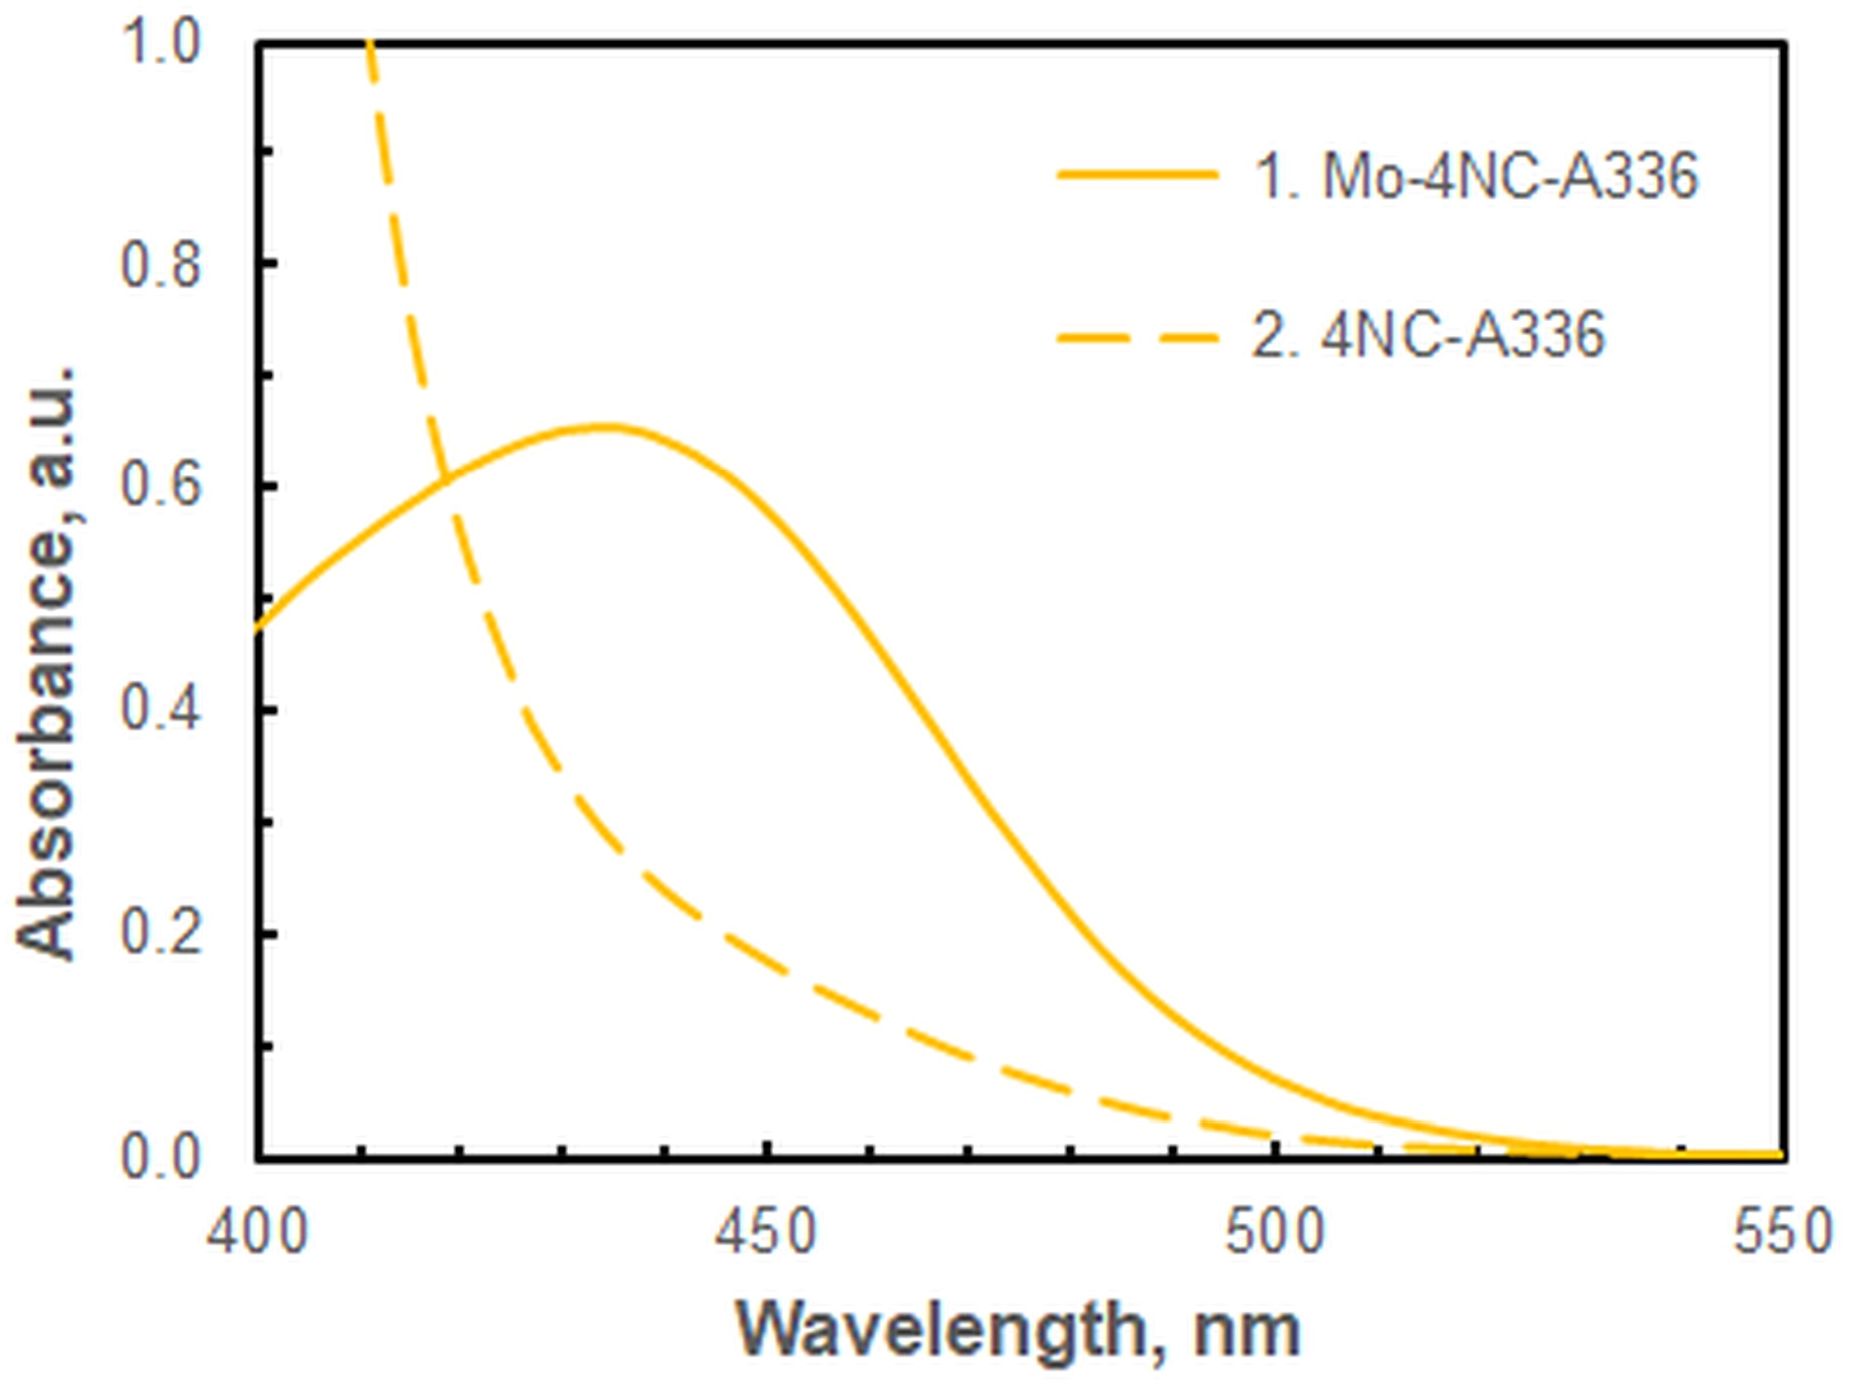
2.1.1. Absorption Spectrum

The absorption spectrum of the Mo-4NC-A336 complex exhibits a maximum at 435 nm (Figure 2). A slight hypsochromic shift is observed in comparison to the maxima of the chloroform-extracted ternary complexes of Mo(VI)–4NC with other cationic ion-association reagents (439–445 nm) [17,18,19]. The underlying causes of this shift may be attributable to solvent effects, the influence of the cationic constituent of the complex, and/or differing stoichiometry. The absorbance at λmax (435 nm) is stable over time. It does not change for at least 1–2 h. By this metric, the CPE system studied outperforms the LLE systems described in previous reports [17,18,19]. Although the absorbance of the blank at 435 nm is relatively high, it is not recommended to perform measurements at higher wavelengths. This would unduly reduce the sensitivity of the determination.

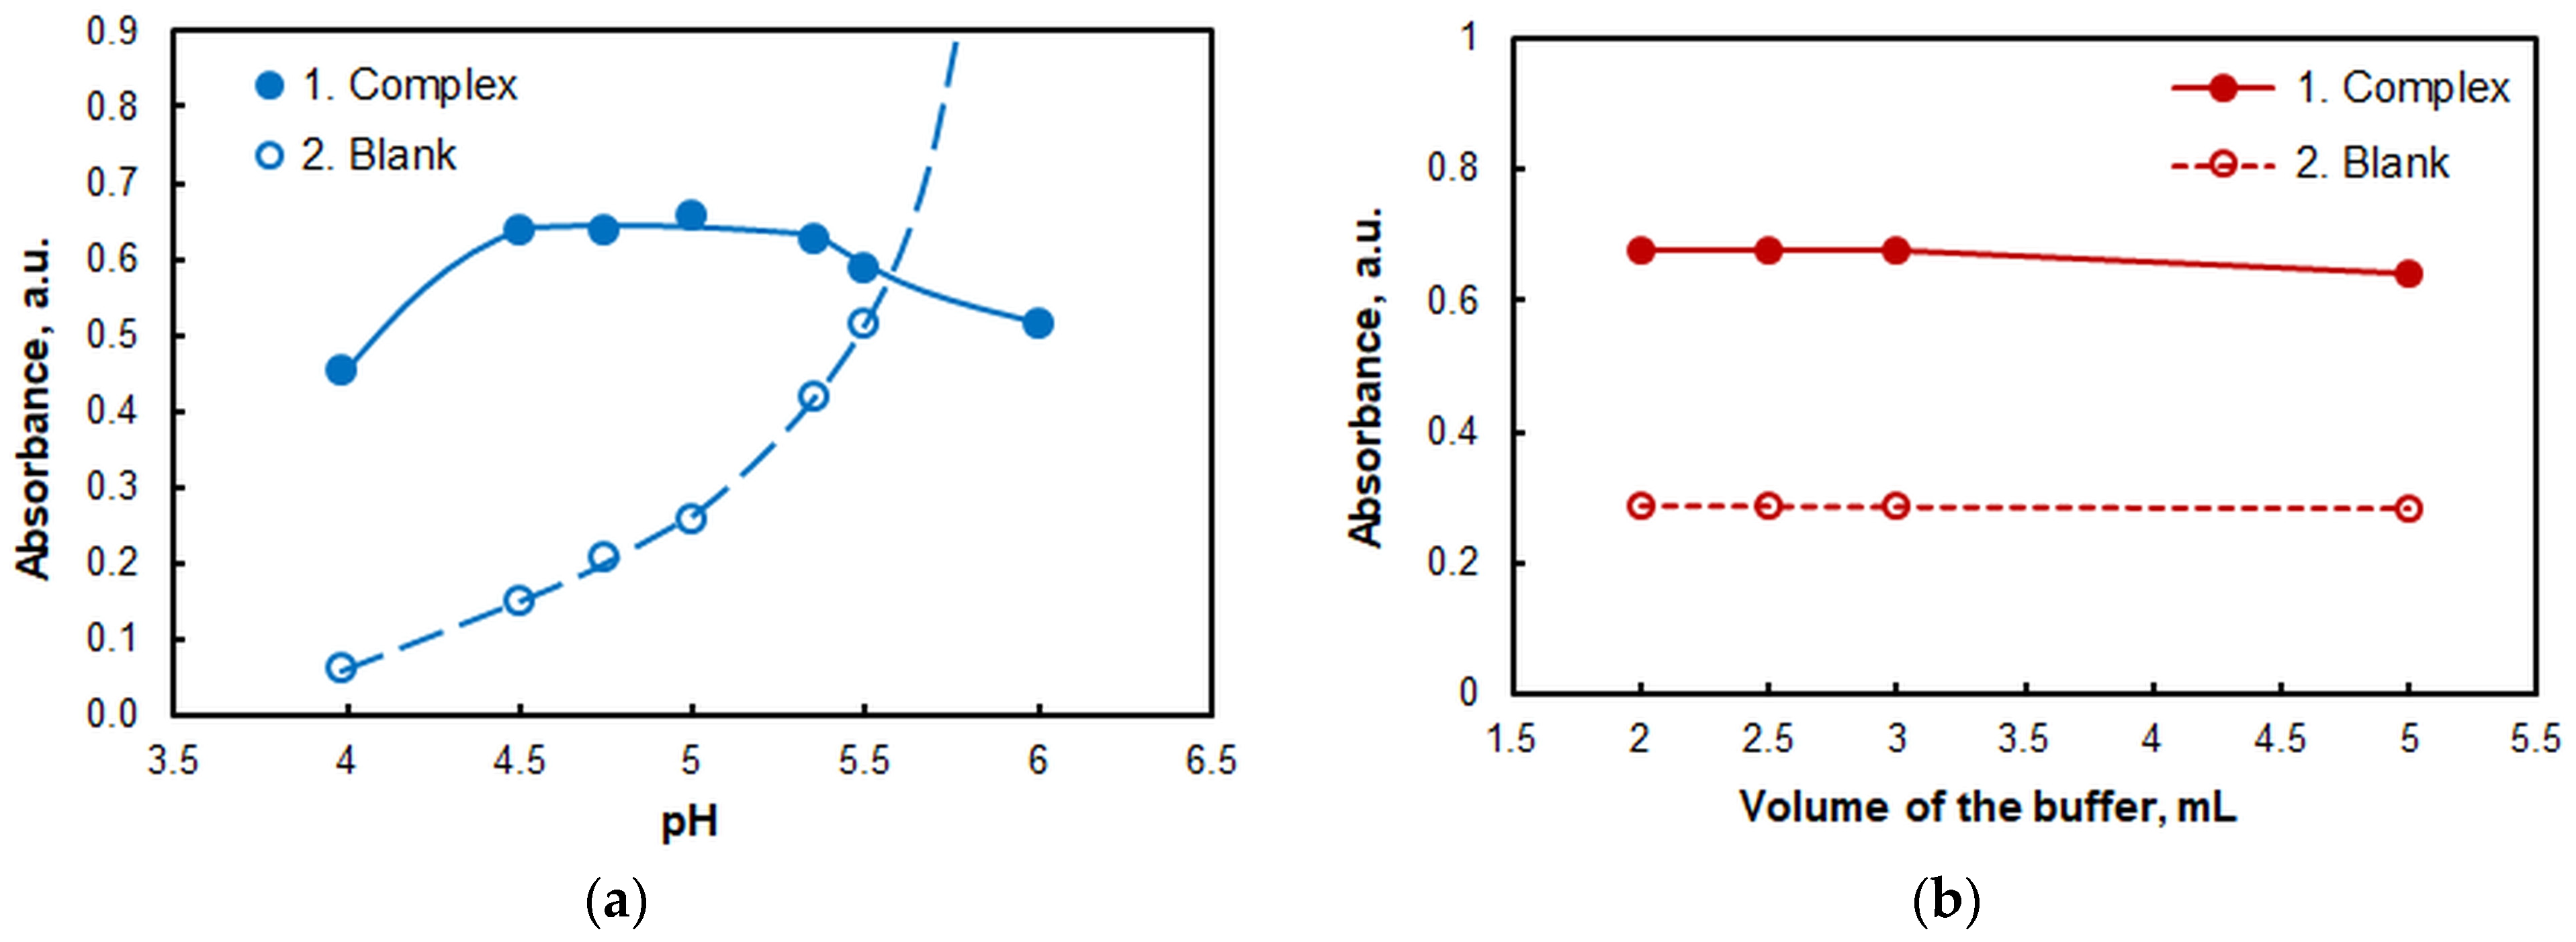
2.1.2. The Effect of pH and Volume of the Buffer

The effect of pH on the absorbance is displayed in Figure 3a. A series of buffer solutions, prepared from 2 mol L−1 CH3COOH and NH4OH, were used to adjust the pH. The analytical signal appears to be maximal over a relatively wide pH range (from 4.5 to 5.4). The buffer is adequate for this range since the pKa of acetic acid is 4.75. Therefore, it has a substantial buffering capacity, which effectively manages acidic solutions and thus facilitates sample preparation.
The effect of buffer volume was also investigated (Figure 3b). The absorbance was constant for volumes between 2 and 3 mL. A slight decrease in its value is observed at higher buffer volumes.

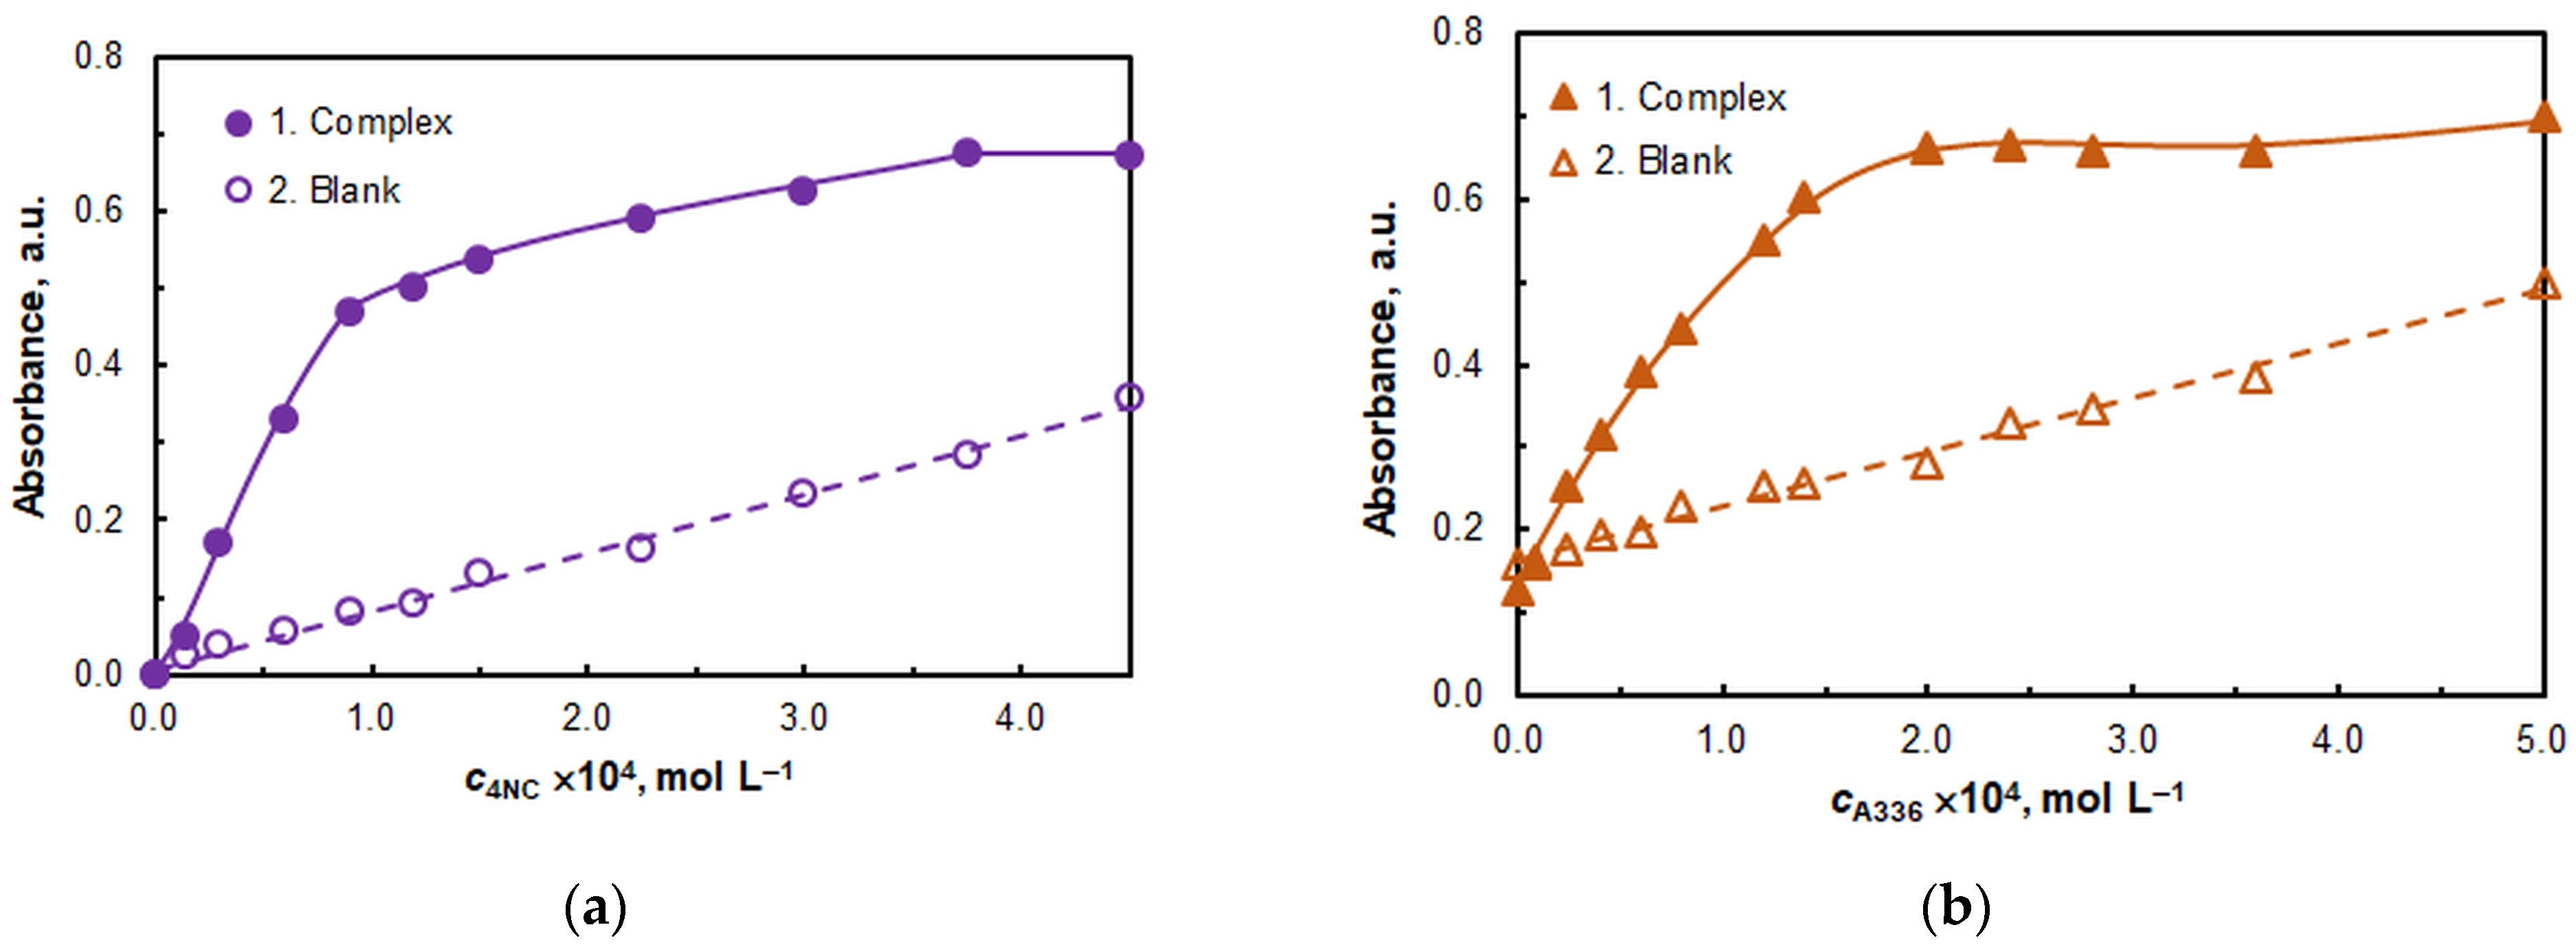
2.1.3. The Effect of Reagent Concentrations

The effect of reagents concentrations is demonstrated in Figure 4. Subsequent studies were conducted at cNC = 3.75 × 10⁻⁴ mol L−1 (see Figure 4a) and cA336 = 2 × 10⁻⁴ mol L−1 (see Figure 4b). It is noteworthy that at cA336 = 0, the absorbance is not zero. At the optimal A336 concentration (2 × 10⁻⁴ mol L−1), the increase in the measured signal is over 500% higher than in the absence of A336.

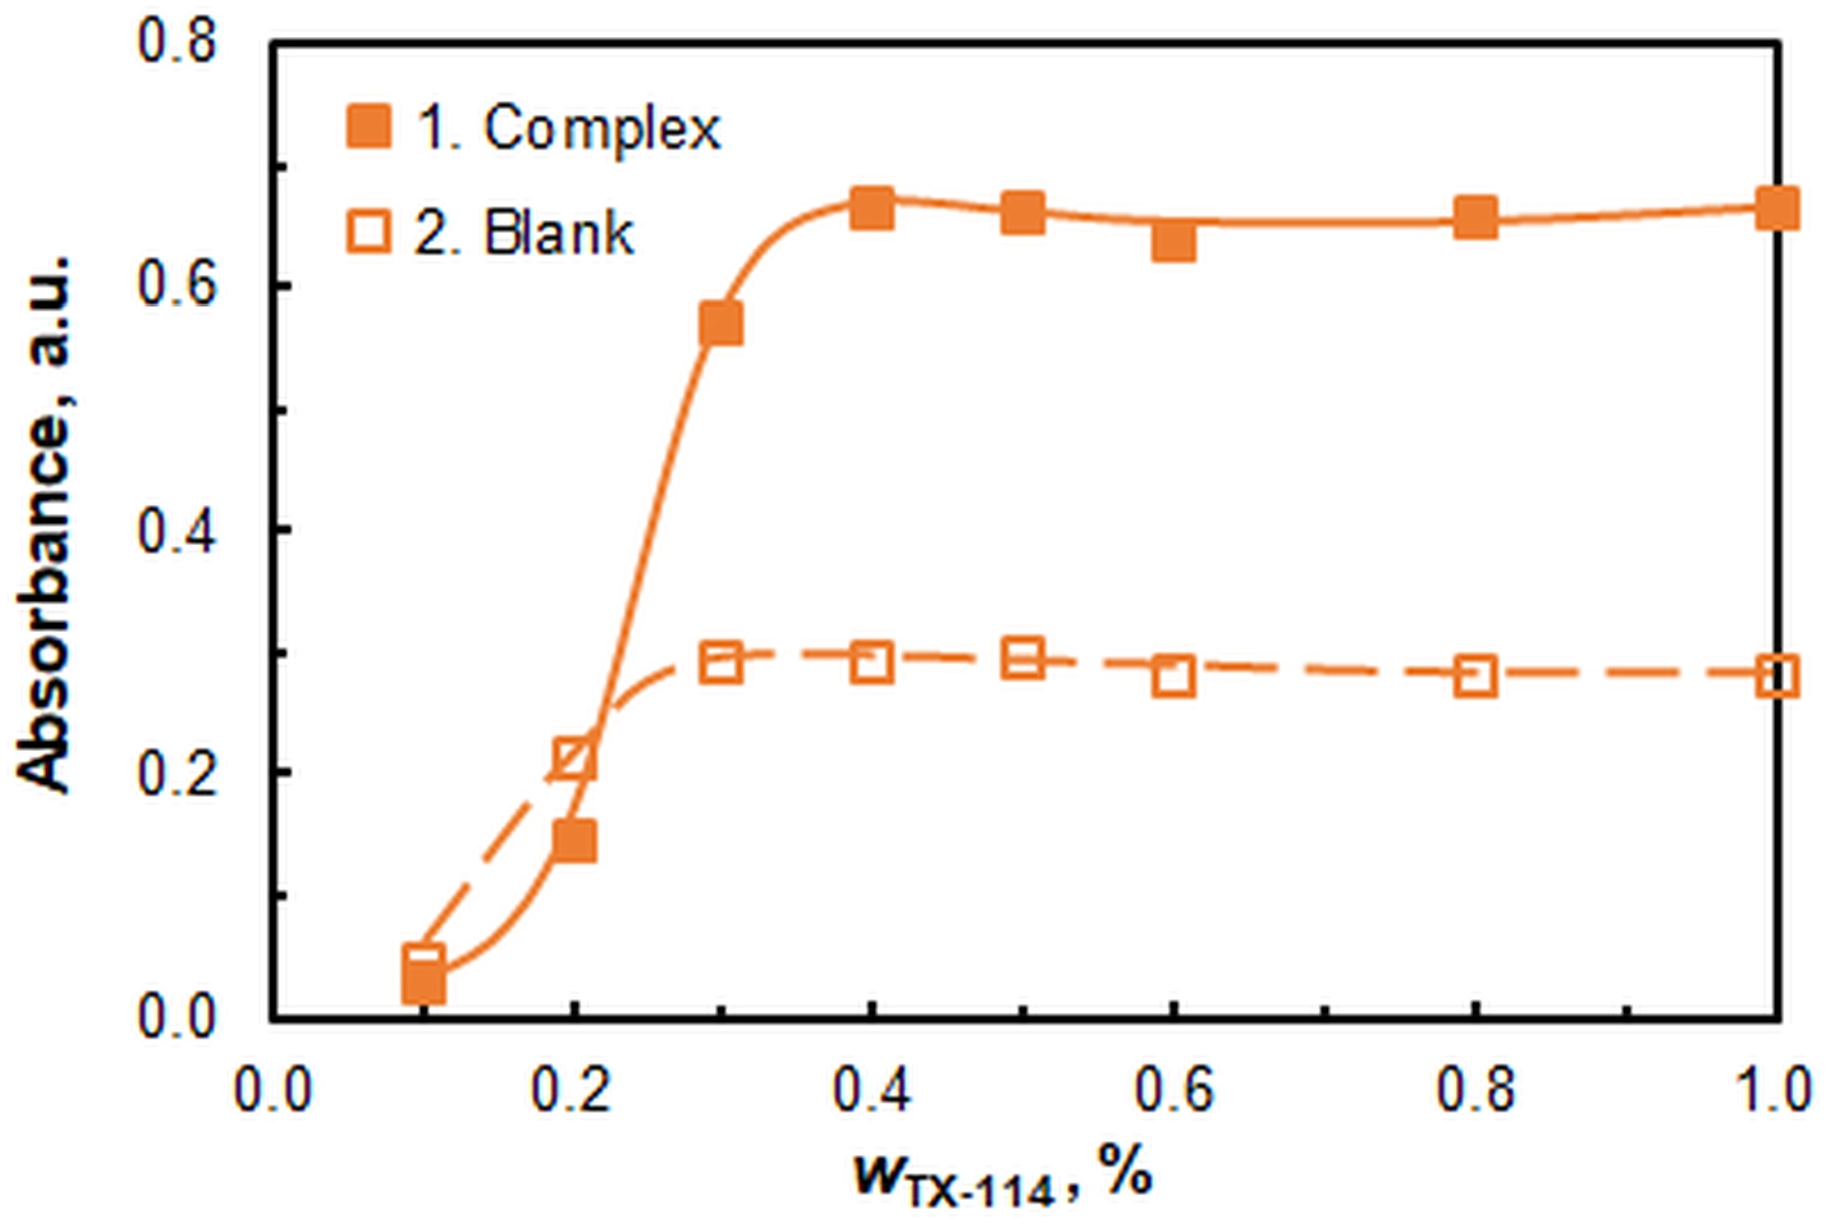
2.1.4. The Effect of TX-114 Mass Fraction

Figure 5 shows the effect of the mass fraction of the non-ionic surfactant on the absorbance. The curve is characterized by a steep left part and a well-defined plateau. It is evident that saturation is attained at a mass fraction of approximately 0.4%. No significant drop in the extraction efficiency is observed at higher wTX-114 values, as is the case with other MM-CPE systems [11,42,43,44]. Further studies were performed at a wTX-114 of 0.5%, which corresponds to a mass ratio of the two surfactants close to 1:58 (A336:TX-114). The low absorbance of the sample at wTX-114 below 0.3% can be explained by difficulties in the formation of the surfactant-rich phase (SRP) under the experimental CL-CPE conditions.

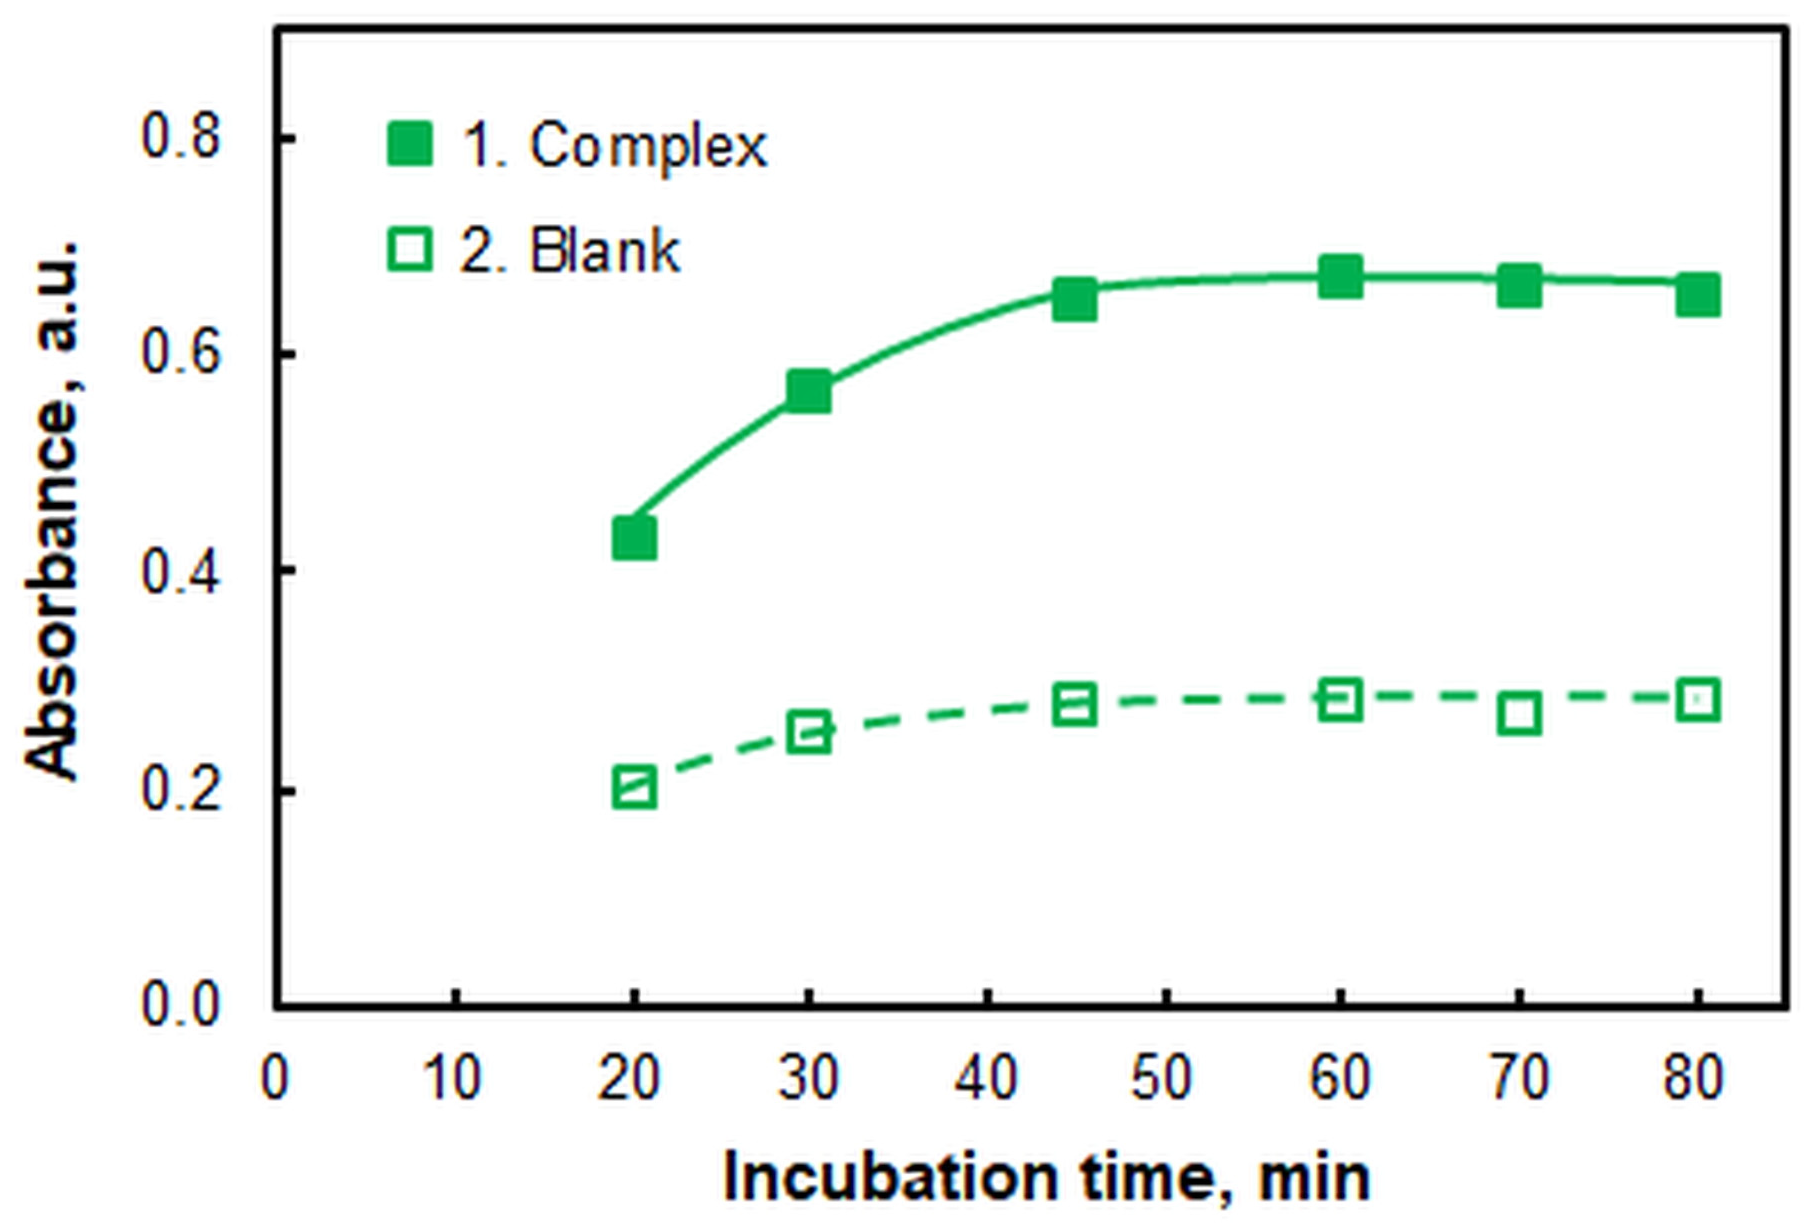
2.1.5. The Effect of Incubation Time

Figure 6 shows the effect of residence time at a water bath temperature (t) of 60 °C. The time was counted from the moment the samples were immersed in the heated water. The recommended incubation time deduced from Figure 6 is 55 min.

2.1.6. The Cooling Time Experiments

The cooling process that facilitates phase separation can be conducted in a refrigerator at a temperature of approximately −20 °C for a duration of 45–60 min [45,46]. A shorter cooling time may result in an insufficiently viscous surfactant reach phase (SRP), which can impede the efficacy of phase separation. Cooling for more than 1 h may cause freezing of the supernatant and further delay.

2.1.7. SRP Processing

The upper aqueous phase following the cooling process was separated by decantation. The viscosity of the resulting SRP was reduced by the addition of 0.5 mL of ethanol [45]. The final solution, which was subsequently analyzed, was obtained by carefully adding water to a final mass of 3.00 g. The mixture (SRP + ethanol + water) can be readily homogenized by shaking, a process that is less time- and effort-consuming than the ethanol-free procedures [46].
A summary of the optimized parameters is shown in Table 1.

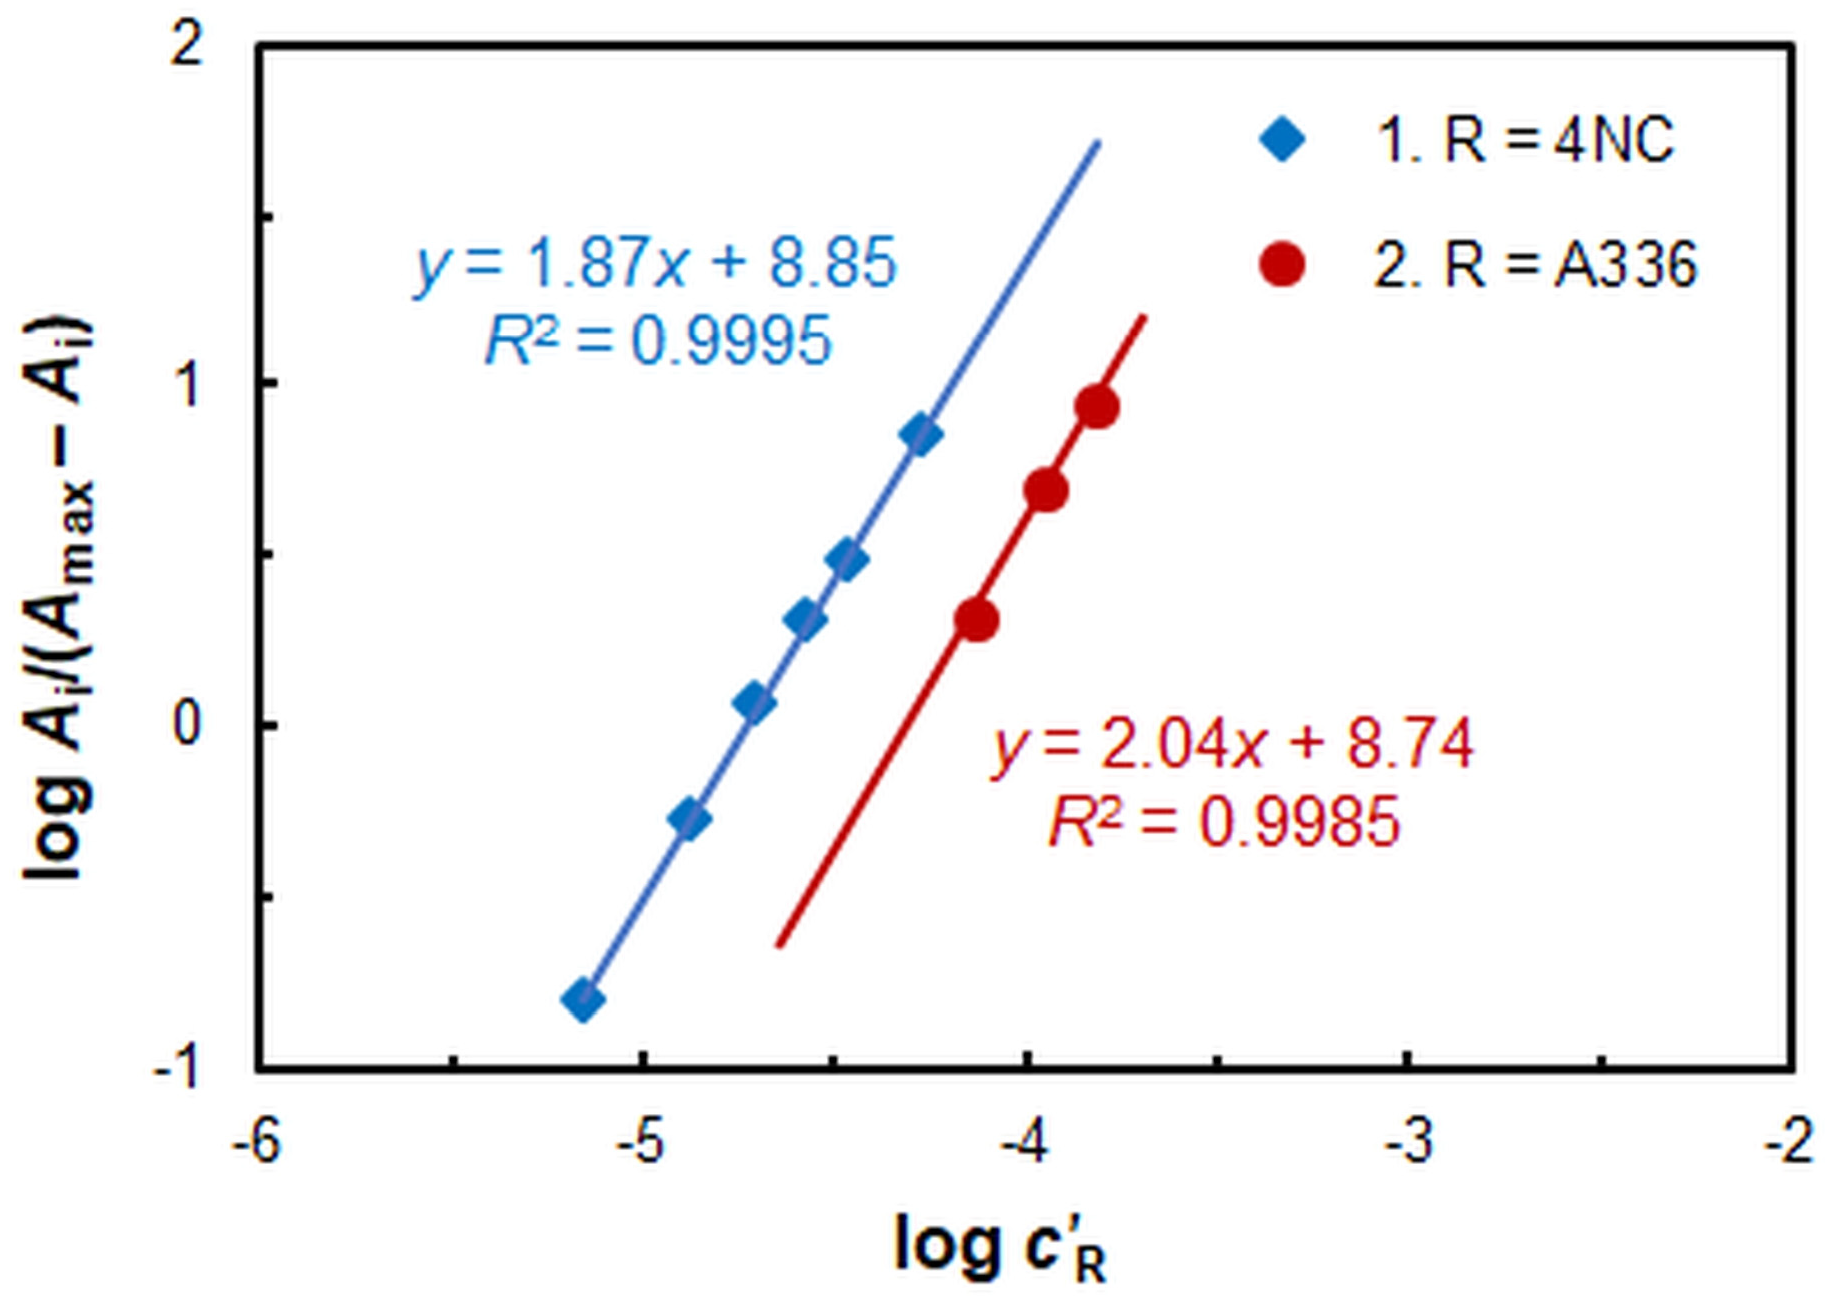
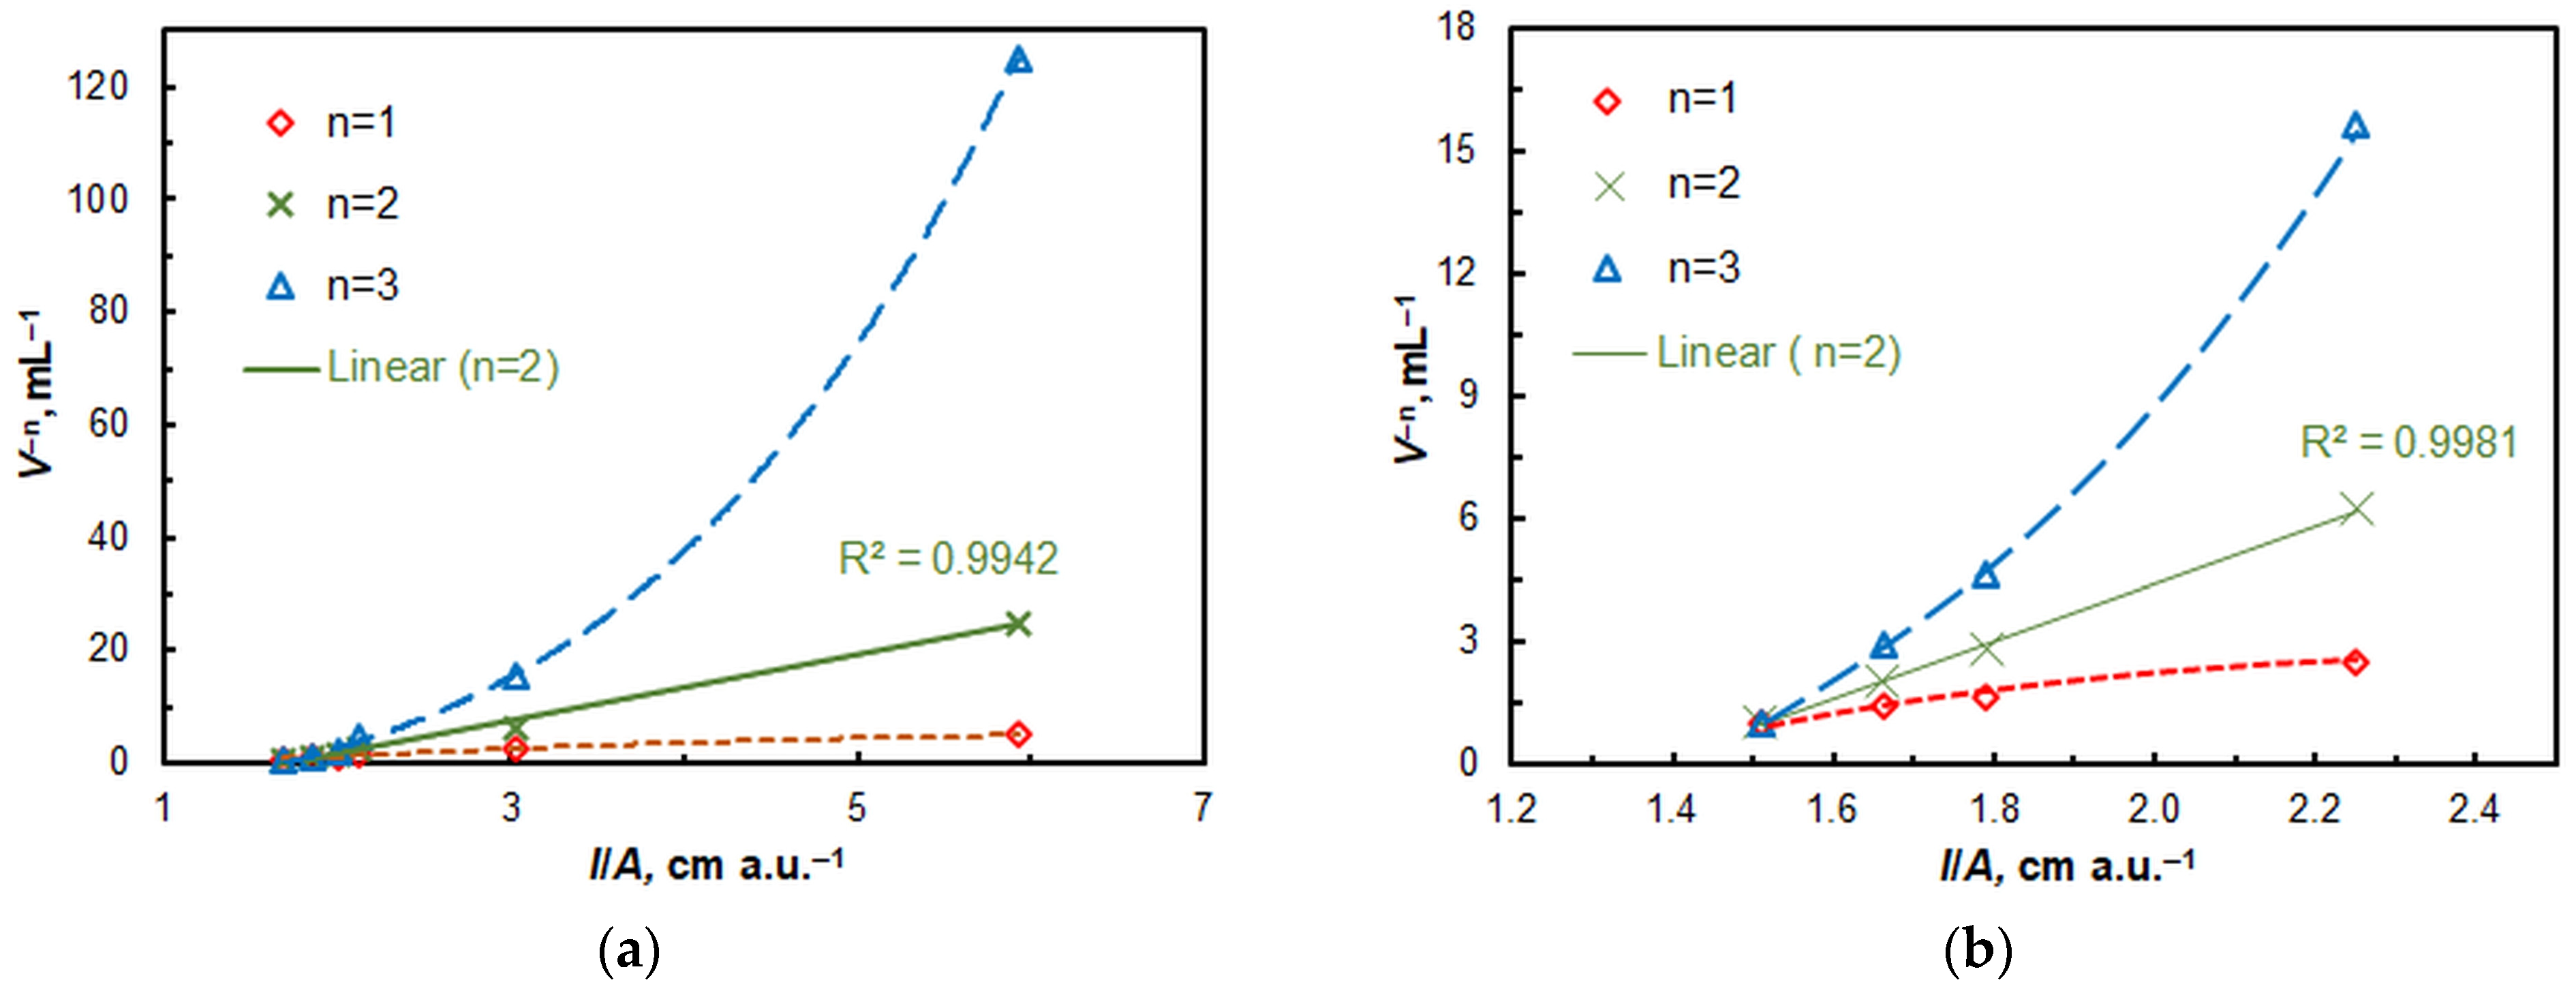
2.2. Stoichiometry, Formula of the Extracted Complex, and Equation of Complexation

In aqueous media, Mo(VI) forms anionic complexes with 4NC (H2L), which can be represented by the formulas [MoO2(OH)2L]2− and [MoO2L2]2− [47]. In the presence of cationic ion-association reagents and organic solvents, neutral ternary complexes of both types have been reported [17,18,19]. Which of the above anionic species is stabilized depends on the experimental conditions and the nature of the cationic reagent.
The molar 4NC:Mo and A336:Mo ratios in the CPE system were determined by the mobile equilibrium method [48] (Figure 7) and the straight-line method of Asmus [49] (Figure 8). The results obtained suggest that under optimal conditions, the complex composition is 1:2:2 (Mo:4NC:A336). Consequently, its formula is (A336+)2[MoO2L2]. The stabilization of this complex is favored by maintaining a relatively high pH (pHopt = 4.75) at which deprotonation of 4NC is facilitated. The equation of complex formation can be expressed as follows: 2 HL + MoO42− + 2 A336+ ≡ (A336)2[MoO2L2] + 2 OH.

2.3. The Constant of Extraction

The conditional extraction constant characterizing the CPE of the complex was calculated by two methods based on the A336 saturation profile curve (Figure 4b): the mobile equilibrium method [48] and the Holme–Langmyhr method [50]. The results can be found in Table 2.

2.4. Beer’s Law and Analytical Characteristics

The relationship between light absorption and Mo(VI) concentration was investigated under optimal conditions (see Table 1). The study revealed a satisfactory linearity up to 580 ng mL−1 Mo(VI) (R2 = 0.9991, n = 10). The linear regression equation was determined to be A = 3.48γ + 0.001, where γ denotes the mass concentration (μg mL−1). The standard deviations (SDs) of the slope and intercept were determined to be 0.04 and 0.01, respectively. The apparent molar absorption coefficient was found to be 3.34 × 10⁵ L mol−1 cm−1, and the Sandell sensitivity was 0.29 ng cm−2. The limit of detection (LOD) and quantitation (LOQ), calculated as 3 and 10 times the SD of the blank divided by the slope, were 3.2 ng mL−1 and 10.8 ng mL−1, respectively.
The preconcentration factor, calculated as the ratio of the volume of the sample (50 mL) to the volume of the final solution (3 g ≈ 3.05 mL), was 16.4. A similar value of 16.8 was determined by dividing the slope of the calibration line obtained after CPE by the slope obtained without CPE (i.e., without TX-114 and heating). The absence of a significant disparity between these values suggests that the complex formation process occurring in aqueous media remains unaltered during the CPE process.

2.5. The Effect of Foreign Ions

The effects of various foreign ions on the determination of Mo(VI) are demonstrated in Table 3. The presence of significant amounts of SO42−, NO3, Cl, Br, alkali ions, alkaline earth ions, Ni(II), and Zn(II) is tolerable. The most significant interfering factors are Al(III), Cr(III), Cu(II), Mn(II), V(V), and W(VI). Sodium fluoride appears to be an effective masking agent for Al(III). At the working conditions, Cr(III) forms an intensely colored complex with 4NC and A336 (λmax ≈ 475 nm). However, this complex is susceptible to disruption in the presence of Na2EDTA. The same is true for the complexes Cu(II) (λmax = 451 nm), Fe(III), V(V), and Mn(II). It is anticipated that the selectivity will be elevated in media with higher acidity. Therefore, the determination can be performed at a pH of 4.5, which is the lower limit of the pH interval in which the maximum absorption is observed (see Figure 3).

2.6. Analytical Application

The developed procedure was implemented for the analysis of two reference standard steel samples (Table 4). The relative standard deviations (RSDs) for these determinations were ≤3.3%.
Commercial mineral water from two Bulgarian brands (Gorna Banya and Devin) was also analyzed. The results are presented in Table 5.
The panel of analyses was expanded through the incorporation of a dietary supplement, Molybdenum Drops—Concentrate for Long-Term Use (Extract Pharma LTD, Sofia, Bulgaria) [51]. According to the manufacturer, each drop contains 50 μg Mo(VI). To verify this claim, two kinds of experiments were planned. They were designed to consider both the averaging of results from several drops and the analysis of a single drop.
Experiment 1: An aqueous solution containing seven drops of the pharmaceutical product (the daily dose recommended by the manufacturer for adults) was prepared. The analytical result obtained (n = 4; ±SD) was 362 ± 12. Consequently, the molybdenum content in one drop was approximately 51.7 μg.
Experiment 2: Three parallel solutions were prepared, with each solution containing a single drop of the preparation (the recommended daily dose for children aged 3 to 10 years). The mass of each drop was initially determined using a balance (m1 = 0.0554 g, m2 = 0.0658 g, and m3 = 0.0604 g). The analysis demonstrated that the Mo(VI) content of the three samples differed significantly (43.8 ± 2.2 μg, 59.8 ± 0.88 μg, and 51.0 ± 0.5 μg Mo) due to the variation in drop masses. However, the mean mass value of 51.6 μg Mo(VI) closely corresponds to the outcomes of Experiment 1.

2.7. Comparison with Other Extractive Methods

A comparative analysis of the present method’s characteristics with those of other extractive methods for molybdenum determination is provided in Table 6. The present spectrophotometric method is characterized by simplicity, cost-effectiveness, convenience, and ecological friendliness. The use of a centrifuge is not necessary because phase separation occurs spontaneously. The separation of the two phases is easy and convenient (by decantation) and does not require the use of a syringe or micropipette [52,53]. The addition of a salting-out agent, as is common in [11,12,14], is also not required. The reagents utilized are readily available in the commercial sector and do not necessitate synthesis, a notable advantage over the procedures [15,16]. Finally, the method is robust and reliable, as evidenced by the large optimal ranges of the parameters studied. In this respect, it successfully competes with many other methods [11,14,15,53].
In contrast to the LLE methods described in [17,18,19], the present method can be classified as environmentally friendly and safe for laboratory personnel. In addition, it is about 6 to 14 times more sensitive mainly due to the higher phase volume ratio (16.4 vs. 2 or 1). Since the complexation takes place in a less acidic environment (compared to the LLE methods mentioned above), some disadvantages can be noted: higher blank absorbance and higher RSD.
Figure 9 presents an evaluation of the proposed method by two recently developed green and analytical performance metric tools: the Blue Applicability Grade Index (BAGI) [54] and the Click Analytical Chemistry Index (CACI) [55]. The scores obtained from the two metrics (greater than 60 in the first case and greater than 50 in the second) characterize the novel approach as “practical”.
Table 6. Comparison with other extractive methods for molybdenum determination.
Reagent (s)ProcedureDetectionSurfactant (s)pHSampleLinear Range/
ng mL−1
LOD,
ng mL−1
λmax, nm10−4ε,
L mol−1 cm−1
Ref.
PRMM-CPEUV–VisTX-114 + CTAB4.6River water and coastal waters1.23–37.01.24608NR[11]
DHDPhB + NaSalRT-CPEUV–VisTX-1001.8Water and milk7.9–1602.3560NR[15]
DHMPhB +
NaSal
RT-CPEUV–VisTX-1002.0Water, rose hips, and pharmaceuticals160–180050530NR[16]
Nile blue A + OxalateUTA-CPEFAASPONPE 7.54.5Milk, vegetables, and foodstuffs3–3400.86[53]
VPB + KSCNMM-CPEFAASTX-114 + CPC2.0Beverages and foodstuffs7.5–18002.18543[44]
8-HQCPEFAASTX-1144.5Mineral waterNR40[52]
QACPEGFAASTX-1143.6Seawater and tap water0.03–0.60.007545[56]
BPR + KICPEUV–VisCTAB1Steel and water0.3–3200.1576NR[14]
4NC + BTCLLEUV–Vis1.8–4.0Steel and ferromolybdenum200–6700NR4452.38[18]
4NC + BZC LLEUV–Vis1.4Synthetic mixtures, steel, and water18.6–31005.64395.5[17]
4NCIL-MM-CL-CPEUV–VisTX-114 + A3364.5Mineral water, steel, and a food supplement 10.8–5803.243533.4This work
Abbreviations: 4NC, 4-nitocatechol; 8-HQ, 8-hydroxyquinoline; A336, Aliquat 336; BPR, bromopyrogallol red; BTC, Bluetetrazolium chloride; BZC, Benzalconium chloride; CPC, cetylpyridinium chloride; CPE, cloud point extraction; CTAB, cetyltrimethylammonium bromide; DHDPhB, 6,7-dihydroxy-2,4-diphenylbenzopyrylium salt; FAAS, flame atomic absorption spectrometry; GFAAS, graphite furnace atomic absorption spectroscopy; IL-MM-CL-CPE, ionic liquid-assisted mixed micelle-mediated centrifuge-less CPE; LLE, liquid–liquid extraction; MM-CPE, mixed micelle-mediated CPE; NaSal, sodium salicylate; NR, not reported; PONPE 7.5, polyethyleneglycolmono-p-nonyphenylether; PR, pyrogallol red; RT-CPE, room temperature CPE; TX-100, Triton X-100; TX-114, Triton X-114; QA, Quinalizarine; UTA-CPE, ultrasonic-thermostatic-assisted CPE; UV–Vis, spectrophotometry; VPB, Victoria pure blue BO.

3. Materials and Methods

3.1. Reagents and Chemicals

The Mo(VI) solution (2 × 10⁻⁴ mol L−1) was prepared by means of the dissolution of (NH4)6Mo7O24·4H2O (cryst. extra pure, Merck, Schnelldorf, Germany) in water. The 4NC was procured from Fluka AG (Buchs, Switzerland, >98%). The concentration of the prepared aqueous solution was 1.875 × 10⁻² mol L−1. The other chemicals utilized as aqueous solutions were Na2EDTA·2H2O (Fillab EOOD, Plovdiv, Bulgaria, >99.5%; c = 0.1 mol L−1) and TX-114 (laboratory grade, Merck, Schnelldorf, Germany; w = 10%). The ionic liquid A336 was procured from Merck (Schnelldorf, Germany) and dissolved in methanol (c = 1 × 10⁻² mol L−1). The calculations were performed using a molar mass of 432 g mol−1, which is consistent with the value reported in Ref. [36]. Buffer solutions were prepared by combining appropriate volumes of 2 mol L−1 aqueous solutions of ammonia and acetic acid. Deionized water (18.2 MΩ cm) or distilled water was utilized during the course of the experiments.

3.2. Instrumentation

A UV–Vis spectrophotometer (Ultrospec 3300 pro; Garforth, UK) equipped with 10-mm cuvettes was utilized to conduct spectrophotometric investigations. The pH was estimated using a WTW InoLab 7110 pH meter (Weilheim, Germany). The samples were subjected to heating in a GFL 1023 water bath (Berlin, Germany). An Ohaus Pioneer PA214C analytical balance (Parsippany, NJ, USA) was employed for mass quantification.

3.3. Samples and Sample Preparation

Bottled mineral water was procured from a local supermarket and analyzed the following day. For the analysis, 30 mL aliquots were utilized.
The food additive, Molybdenum Drops (Extract Pharma®, Sofia, Bulgaria), was supplied by an online pharmacy. According to the manufacturer, each drop of the preparation contains 50 μg Mo in the form of sodium molybdate. The formulation also comprises potassium sorbate and vegetable glycerin. The prepared aqueous solutions had volumes of 50 mL (7 drops) and 25 mL (1 drop).
The steels (approximately 0.5 g each) were prepared for analysis using a two-stage procedure that was a combination of methodologies described in the literature: stage 1 [17,57,58] and stage 2 [18]. The objective of the initial stage was the separation of tungsten(VI). In the subsequent stage, iron and other undesirable elements were precipitated. To mask residual amounts of these elements, Na2EDTA (0.1 mL of a 0.1 mol L−1 solution) was utilized.

3.4. Optimization Procedure

Solutions of TX-114, ammonium acetate buffer, Mo(VI), 4NC, and A336 were sequentially transferred to pre-weighed 50 mL conical centrifuge tubes. The mixtures were then diluted to 50 mL with water, shaken to ensure homogeneity, and heated in a water bath at 60 °C for a specified time. The tubes were then briefly cooled under running water and stored in a freezer set at −20 °C for approximately 45–60 min. This was done to complete the precipitation process and make the top layer easy to remove by decanting. Then, 0.5 mL of ethanol and drops of water were added to the viscous SRP to give a total mass of 3.00 g. Finally, the solutions were homogenized by shaking and transferred to cuvettes for measurement of light absorption.

3.5. Recommended Procedure for the Determination of Mo(VI)

Transfer an aliquot of the analyzed solution (10.8–580 ng mL−1 Mo) into a 50 mL conical centrifuge tube of known mass. If necessary (e.g., for steel analysis), add 0.1 mL Na2EDTA solution (0.1 mol L−1). Then add 2.5 mL of a 10% TX-114 solution, 2.5 mL of a buffer with pH 4.5, 1.0 mL of a 1.875 × 10⁻² mol L−1 solution of 4NC, and 1.0 mL of a 1.0 × 10⁻² mol L−1 solution of A336. Dilute the sample with water to the specified volume (50 mL) and heat in a 60 °C water bath for 55 min. After cooling in a freezer set at −20 °C for 55 ± 5 min, remove the top layer of the sample (the surfactant-poor phase) by decanting. Carefully add 0.5 mL ethanol and a few drops of water to the SRP to give a total mass of 3.00 g. Homogenize the mixture by gentle shaking and transfer it to the spectrophotometer cuvette. Measure the absorbance at 435 nm against a blank. Calculate the unknown molybdenum concentration from the calibration curve.

4. Conclusions

A novel method, designated as IL-MM-CL-CPE, has been developed for the spectrophotometric determination of Mo(VI). The efficacy of the method was demonstrated through analyses of real samples and the application of two green and analytical performance metric tools. The method has been shown to be simple, cost-effective, reliable, sensitive, feasible, and practically acceptable. Notably, the employment of 4NC in a CPE application represents a noteworthy advancement, as it is the first time this reagent has been utilized in this context. The findings of the conducted studies, particularly those addressing the impact of foreign ions, indicate that 4NC (an inexpensive and non-hazardous reagent according to the CPL regulation) has the potential to serve as a foundation for the development of a series of environmentally friendly CPE methods for the determination of other metal ions (e.g., Cr(III) and Cu(II)).

Author Contributions

Conceptualization, K.G.; methodology, K.G., V.D. and A.G.; validation, V.D., A.G. and P.R.; formal analysis, K.G., V.D., A.G. and P.R.; investigation, V.D., A.G. and P.R.; resources, K.G., V.D. and P.R.; data curation, K.G.; writing—original draft preparation, K.G.; writing—review and editing, K.G., V.D., A.G. and P.R.; visualization, V.D., A.G. and P.R.; supervision, K.G. All authors have read and agreed to the published version of the manuscript.

Funding

This research received no external funding.

Institutional Review Board Statement

Not applicable.

Informed Consent Statement

Not applicable.

Data Availability Statement

Data are contained within the article.

Acknowledgments

A.G. would like to express her gratitude to the Erasmus+ program for implementing PhD-student mobility for traineeships in a partner country.

Conflicts of Interest

The authors declare no conflicts of interest.

References

  1. Giovannuzzi, S. Chapter 10-Molybdenum enzymes. In Metalloenzymes; Supuran, C.T., Donald, W.A., Eds.; Academic Press: Amsterdam, Netherlands, 2024; pp. 557–580. [Google Scholar] [CrossRef]
  2. Novotny, J.A. Molybdenum Nutriture in Humans. J. Evid.-Based Integr. Med. 2011, 16, 164–168. [Google Scholar] [CrossRef]
  3. Albin, M.; Oskarsson, A. Chapter 23-Molybdenum. In Handbook on the Toxicology of Metals (Fifth Edition); Nordberg, G.F., Costa, M., Eds.; Academic Press: Amsterdam, Netherlands, 2022; Volume 2, pp. 601–614. [Google Scholar] [CrossRef]
  4. EFSA Proposes Adequate Intake Levels for Fluoride and Molybdenum. Available online: https://www.efsa.europa.eu/en/press/news/130808 (accessed on 11 April 2025).
  5. Novotny, J.A.; Peterson, C.A. Molybdenum. Adv. Nutr. 2018, 9, 272–273. [Google Scholar] [CrossRef]
  6. Outteridge, T.; Kinsman, N.; Ronchi, G.; Mohrbacher, H. Editorial: Industrial relevance of molybdenum in China. Adv. Manuf. 2020, 8, 35–39. [Google Scholar] [CrossRef]
  7. Chatterjee, K.K. Uses of Metals and Metallic Minerals; New Age International (P) Ltd.: New Delhi, India, 2007; pp. 205–209. [Google Scholar]
  8. Kuang, Z. Molybdenum and its alloys in advanced engine applications: From material selection to surface optimization. E3S Web Conf. 2024, 560, 02016. [Google Scholar] [CrossRef]
  9. Raynie, D.E. Modern extraction techniques. Anal. Chem. 2006, 78, 3997–4003. [Google Scholar] [CrossRef]
  10. Kolhe, P.; Bhat, G.P.; Gandhi, S. Green extraction and separation processes. In Advances in Separation Sciences: Sustainable Processes and Technologies; Ingole, P.G., Chaudhery, M.H., Eds.; Elsevier: Amsterdam, Netherlands, 2025; pp. 481–501. [Google Scholar] [CrossRef]
  11. Nagalakshmi, K.V.; Shyamala, P.; Khan, S.A.; Puranam, D.H. Cloud Point Extraction Method for Separation and Pre-concentration of Molybdenum and Zirconium Using Mixture of Surfactants from Natural Waters and their Determination by Spectrophotometry. Methods Objects Chem. Anal. 2024, 19, 160–166. [Google Scholar] [CrossRef]
  12. Gharehbaghi, M.; Shemirani, F. Ionic liquid-based dispersive liquid–liquid microextraction and enhanced spectrophotometric determination of molybdenum(VI) in water and plant leaves samples by FO-LADS. Food Chem. Toxicol. 2011, 49, 423–428. [Google Scholar] [CrossRef]
  13. Pelit, L.; Koçak, S.; Pelit, F.O.; Türkmen, H.; Ertaş, F.N. A spectrophotometric method for determination of molybdenum in water samples by using pyrogallol red and a water soluble ionic liquid. Anal. Methods 2013, 5, 5792–5798. [Google Scholar] [CrossRef]
  14. Madrakian, T.; Ghazizadeh, F. Cloud-point preconcentration and spectrophotometric determination of trace amounts of molybdenum(VI) in steels and water samples. J. Hazard. Mater. 2008, 153, 695–700. [Google Scholar] [CrossRef]
  15. Snigur, D.; Barbalat, D.; Chebotarev, A.; Synievyd, A.; Bevziuk, K. A rapid cloud point extraction of molybdenum(VI) with 6,7-dihydroxy-2,4-diphenylbenzopyrylium perchlorate prior to its spectrophotometric determination. Chem. Pap. 2021, 75, 1823–1830. [Google Scholar] [CrossRef]
  16. Snigur, D.; Chebotarev, A.; Dubovyiy, V.; Barbalat, D.; Bevziuk, K. Salicylic acid assisted cloud point extraction at room temperature: Application for preconcentration and spectrophotometric determination of molybdenum(VI). Microchem. J. 2018, 142, 273–278. [Google Scholar] [CrossRef]
  17. Divarova, V.V.; Saravanska, A.D.; Toncheva, G.K.; Milcheva, N.; Delchev, V.B.; Gavazov, K.B. Spectrophotometric determination of molybdenum(VI) as a ternary complex with 4-nitrocatechol and benzalkonium chloride. Molecules 2022, 27, 1217. [Google Scholar] [CrossRef] [PubMed]
  18. Dimitrov, A.; Lekova, V.; Gavazov, K.; Boyanov, B. Ternary complex of molybdenum(VI) with 4-nitrocatechol and tetrazolium blue chloride and its application to extraction-spectrophotometric analysis of ferrous metallurgy products. J. Anal. Chem. 2007, 62, 122–125. [Google Scholar] [CrossRef]
  19. Dimitrov, A.; Lekova, V.; Gavazov, K.; Boyanov, B. Investigation of the extraction equilibrium of ion-association complexes of molybdenum(VI) with some polyphenols and thiazolyl blue. Extraction-spectrophotometric determination of molybdenum. Cent. Eur. J. Chem. 2005, 3, 747–755. [Google Scholar] [CrossRef]
  20. Sommer, L.; Ackermann, G.; Burns, D.T.; Savvin, S.B. Present and future status of organic analytical reagents-Part I: General remarks. Pure Appl. Chem. 1990, 62, 2147–2166. [Google Scholar] [CrossRef]
  21. Sigma-Aldrich Safety Data Sheet: 4-Nitrocatechol. Available online: https://www.sigmaaldrich.com/BG/en/sds/aldrich/n15553?userType=anonymous (accessed on 11 April 2025).
  22. Divarova, V.V.; Stojnova, K.T.; Radkovska, I.D.; Saravanska, A.D.; Toncheva, G.K.; Delchev, V.B.; Gavazov, K.B. Extraction system for the spectrophotometric determination of tungsten(VI) with 4-nitrocatechol and benzalkonium chloride. Acta Chim. Slov. 2024, 71, 519–527. [Google Scholar] [CrossRef]
  23. Racheva, P.V.; Saravanska, A.D.; Toncheva, G.K.; Kiradzhiyska, D.D.; Milcheva, N.P.; Divarova, V.V.; Pencheva, I.P.; Stojnova, K.T.; Delchev, V.B.; Gavazov, K.B. A semi-micro extraction spectrophotometric determination of iron using 4-nitrocatechol and xylometazoline hydrochloride. Molecules 2025, 30, 899. [Google Scholar] [CrossRef]
  24. Stojnova, K.T.; Lekova, V.D. Study on the equilibria of chelate formation and the ion-association of anionic chelate of germanium(IV) with 4-nitrocatechol and 2-(4-iodophenyl)-3-(4-nitrophenyl)-5-phenyl-2H-tetrazolium cation. Russ. J. Inorg. Chem. 2019, 64, 1235–1241. [Google Scholar] [CrossRef]
  25. Gavazov, K.B. Nitroderivatives of catechol: From synthesis to application. Acta Chim. Slov. 2012, 59, 1–17. [Google Scholar]
  26. Alempijević, S.B.; Vidović, K.; Vukosav, P.; Frka, S.; Kroflič, A.; Mihaljević, I.; Grgić, I.; Strmečki, S. Integrating voltammetry in ecotoxicology: Cu(II)-nitrocatechol complexes formation as a driver of Cu(II) and nitrocatechol toxicity in aquatic systems. Electrochim. Acta 2025, 522, 145938. [Google Scholar] [CrossRef]
  27. Tôei, K. Ion-association reagents. A review. Anal. Sci. 1987, 3, 479–488. [Google Scholar] [CrossRef]
  28. Yamini, Y.; Ghambarian, M. 3.33-Environmental Applications of Cloud-Point Extraction. In Comprehensive Sampling and Sample Preparation; Pawliszyn, J., Ed.; Academic Press: Oxford, UK, 2012; pp. 657–680. [Google Scholar] [CrossRef]
  29. Pytlakowska, K.; Kozik, V.; Dabioch, M. Complex-forming organic ligands in cloud-point extraction of metal ions: A review. Talanta 2013, 110, 202–228. [Google Scholar] [CrossRef]
  30. Melnyk, A.; Namieśnik, J.; Wolska, L. Theory and recent applications of coacervate-based extraction techniques. Trac-Trends Anal. Chem. 2015, 71, 282–292. [Google Scholar] [CrossRef]
  31. Mortada, W.I. Recent developments and applications of cloud point extraction: A critical review. Microchem. J. 2020, 157, 105055. [Google Scholar] [CrossRef]
  32. Halko, R.; Hagarová, I.; Andruch, V. Innovative Approaches in Cloud-Point Extraction. J. Chromatogr. A 2023, 1701, 464053. [Google Scholar] [CrossRef]
  33. Snigur, D.; Azooz, E.A.; Zhukovetska, O.; Guzenko, O.; Mortada, W. Recent innovations in cloud point extraction towards a more efficient and environmentally friendly procedure. Trac-Trends Anal. Chem. 2023, 164, 117113. [Google Scholar] [CrossRef]
  34. Semysim, F.A.; Shabaa, G.J.; Azooz, E.A.; Snigur, D. Alternative green solvents in cloud point extraction methods: Recent developments, challenges, and greenness evaluation. Trends Environ. Anal. Chem. 2025, 45, e00250. [Google Scholar] [CrossRef]
  35. Stefanova, T.S.; Simitchiev, K.K.; Gavazov, K.B. Liquid–liquid extraction and cloud point extraction for spectrophotometric determination of vanadium using 4-(2-pyridylazo) resorcinol. Chem. Pap. 2015, 69, 495–503. [Google Scholar] [CrossRef]
  36. Mikkola, J.-P.; Virtanen, P.; Sjoholm, R. Aliquat 336—A versatile and affordable cation source for an entirely new family of hydrophobic ionic liquids. Green Chem. 2006, 8, 250–255. [Google Scholar] [CrossRef]
  37. Zari, N.; Hassan, J.; Tabar-Heydar, K.; Ahmadi, S.H. Ion-association dispersive liquid–liquid microextraction of trace amount of gold in water samples and ore using Aliquat 336 prior to inductivity coupled plasma atomic emission spectrometry determination. J. Ind. Eng. Chem. 2020, 86, 47–52. [Google Scholar] [CrossRef]
  38. Galhoum, A.A.; Mohamed, B.T.; Abdulmoteleb, S.S.; Mohamady, S.I.; Falila, N.I. Solvent extraction of titanium(IV) from orthophosphoric acid media using Aliquat-336/kerosene and stripping with nitric acid. Hydrometallurgy 2025, 231, 106403. [Google Scholar] [CrossRef]
  39. Hassan, A.M.E.; Amin, A.S.; El-Maghrabey, M.; El Hamd, M.A.; Mahdi, W.A.; Alshehri, S.; Batakoushy, H.A. Sustainable non-plasticized polymer inclusion membrane containing an immobilizing optode ligand for in situ ultra-sensitive colorimetric measurement and pre-concentration of beryllium ions in environmental and biological matrices. J. Photochem. Photobiol. A-Chem. 2024, 452, 115624. [Google Scholar] [CrossRef]
  40. Oukebdane, K.; Semmoud, R.; Didi, M.A. Cloud point extraction of Telon Orange anionic azo-dye from aqueous sulphate solutions using Aliquat 336 ionic liquid/Tween 40 as extracting system: Factorial design optimization methodology. Desalin. Water Treat. 2022, 247, 272–280. [Google Scholar] [CrossRef]
  41. Sai Krishna, D.; Noorbasha, N.M.; Jai Kumar, S. A new sequential and simultaneous speciation analysis of thallium in coal effluents by graphite furnace atomic absorption spectrometry after a novel ligandless mixed micelle cloud point extraction. Int. J. Environ. Anal. Chem. 2020, 100, 1079–1093. [Google Scholar] [CrossRef]
  42. Elnagar, M.M.; Hashem, M.A.; Hassanien, M.M.; Ismail, M.A. pH-controlled mixed micelle cloud point extraction for selective removal of trace levels of iron from titanium concentrates. Sep. Purif. Technol. 2021, 265, 118534. [Google Scholar] [CrossRef]
  43. Blanchet-Chouinard, G.; Larivière, D. Determination of Pb in environmental samples after cloud point extraction using crown ether. Talanta 2018, 179, 300–306. [Google Scholar] [CrossRef]
  44. Gürkan, R.; Aksoy, T.; Ulusoy, H.T.; Akçay, M. Determination of low levels of molybdenum (VI) in food samples and beverages by cloud point extraction coupled with flame atomic absorption spectrometry. J. Food Compos. Anal. 2013, 32, 74–82. [Google Scholar] [CrossRef]
  45. Gavazov, K.B.; Racheva, P.V.; Saravanska, A.D.; Genc, F.; Delchev, V.B. Mono- and binuclear complexes in a centrifuge-less cloud-point extraction system for the spectrophotometric determination of zinc(II). Molecules 2024, 29, 4511. [Google Scholar] [CrossRef]
  46. Gavazov, K.B.; Racheva, P.V.; Milcheva, N.P.; Divarova, V.V.; Kiradzhiyska, D.D.; Genç, F.; Saravanska, A.D. Use of a hydrophobic azo dye for the centrifuge-less cloud point extraction–spectrophotometric determination of cobalt. Molecules 2022, 27, 4725. [Google Scholar] [CrossRef]
  47. Natansohn, S.; Krugler, J.I.; Lester, J.E.; Chagnon, M.S.; Finocchiaro, R.S. Stability constants of complexes of molybdate and tungstate ions with o-hydroxy aromatic ligands. J. Phys. Chem. 1980, 84, 2972–2980. [Google Scholar] [CrossRef]
  48. Zhiming, Z.; Dongsten, M.; Cunxiao, Y. Mobile equilibrium method for determining composition and stability constant of coordination compounds of the form MmRn. J. Rare Earths 1997, 15, 216–219. [Google Scholar]
  49. Asmus, E. Eine neue Methode zur Ermittlung der Zusammensetzung schwacher Komplexe (A new method for the determination of composition of weak complexes). Fresenius’ J. Anal. Chem. 1960, 178, 104–116. [Google Scholar] [CrossRef]
  50. Holme, A.; Langmyhr, F.J. A modified and a new straight-line method for determining the composition of weak complexes of the form AmBn. Anal. Chim. Acta 1966, 36, 383–391. [Google Scholar] [CrossRef]
  51. Molybdenum Drops, Extract Pharma LTD. Available online: https://epharm.bg/molibden-koncentrat-extract-pharma.html (accessed on 11 April 2025).
  52. de Jesus, A.M.; Oliveira, L.F.; Canevari, N.T.; Pereira-Filho, E.R. Sequential preconcentration using cloud point extraction: Determination of vanadium and molybdenum in water and pharmaceutical samples using flame atomic absorption spectrometry. Braz. J. Anal. Chem. 2013, 10, 476–480. [Google Scholar]
  53. Gürkan, R.; Korkmaz, S.; Altunay, N. Preconcentration and determination of vanadium and molybdenum in milk, vegetables and foodstuffs by ultrasonic-thermostatic-assisted cloud point extraction coupled to flame atomic absorption spectrometry. Talanta 2016, 155, 38–46. [Google Scholar] [CrossRef]
  54. Manousi, N.; Wojnowski, W.; Płotka-Wasylka, J.; Samanidou, V. Blue applicability grade index (BAGI) and software: A new tool for the evaluation of method practicality. Green Chem. 2023, 25, 7598–7604. [Google Scholar] [CrossRef]
  55. Mansour, F.R.; Bedair, A.; Locatelli, M. Click Analytical Chemistry Index as a novel concept and framework, supported with open source software to assess analytical methods. Adv. Sample Prep. 2025, 14, 100164. [Google Scholar] [CrossRef]
  56. Filik, H.; Çengel, T.; Apak, R. Selective cloud point extraction and graphite furnace atomic absorption spectrometric determination of molybdenum (VI) ion in seawater samples. J. Hazard. Mater. 2009, 169, 766–771. [Google Scholar] [CrossRef]
  57. Anjaneyulu, Y.; Reddy, M.P.; Kumar, P.V.S.; Kavipurapu, C.; Rao, B. Selective and sensitive extraction spectrophotometric method for the determination of vanadium (V) as a mixed ligand complex with N-phenyl benzohydroxamic acid and 4-(2-pyridylazo)resorcinol in non-aqueous media. Microchim. Acta 1990, 100, 87–94. [Google Scholar] [CrossRef]
  58. Yerramilli, A.; Kavipurapu, C.S.; Manda, R.R.; Pillutla, C.M. Extractive spectrophotometric method for the determination of vanadium(V) in steels and titanium base alloy. Anal. Chem. 1986, 58, 1451–1453. [Google Scholar] [CrossRef]
Figure 1. Structure of 4-nitrocatechol (1,2-dihydroxy-4-nitrobenzene, 4NC).
Ijms 26 04597 g001
Figure 2. Spectra of the ternary complex against blank (1) and the corresponding blank against water (2): cMo = 2 × 10⁻⁶ mol dm−3, c4NC = 3.75 × 10⁻⁴ mol dm−3, cA336 = 2 × 10⁻⁴ mol dm−3, pH = 5, Vbuffer = 2.0 mL, wTX-114 = 0.5%, t = 55 min at 60 °C, mSRP = 3 g.
Ijms 26 04597 g002
Figure 3. (a) Effect of pH: cMo(VI) = 2.0 × 10⁻⁶, c4NC = 3.75 × 10⁻⁴ mol L−1, cA336 = 2 × 10⁻⁴ mol L−1, wTX-114 = 0.5%, Vbuffer = 2.0 mL, t = 55 min at 60 °C, mSRP = 3 g, λ = 435 nm. (b) Effect of buffer volume: pH = 5, cMo(VI) = 2.0 × 10⁻⁶, c4NC = 3.75 × 10⁻⁴ mol L−1, cA336 = 2 × 10⁻⁴ mol L−1, wTX-114 = 0.5%, t = 55 min at 60 °C, mSRP = 3 g, λ = 435 nm.
Ijms 26 04597 g003
Figure 4. (a) Effect of 4NC concentration. cMo(VI) = 2.0 × 10⁻⁶, pH = 5, cA336 = 2 × 10⁻⁴ mol L−1, wTX-114 = 0.5%, Vbuffer = 2.0 mL, t = 55 min at 60 °C, mSRP = 3 g, λ = 435 nm. (b) Effect of A336 concentration: cMo(VI) = 2.0 × 10⁻⁶, pH = 5, c4NC = 3.75 × 10⁻⁴ mol L−1, wTX-114 = 0.5%, t = 55 min at 60 °C, mSRP = 3 g, λ = 435 nm.
Ijms 26 04597 g004
Figure 5. Effect of TX-114 mass fraction. cMo(VI) = 2.0 × 10⁻⁶, pH = 5, c4NC = 3.75 × 10⁻⁴ mol L−1, cA336 = 2 × 10⁻⁴ mol L−1, Vbuffer = 2.0 mL, t = 55 min at 60 °C, mSRP = 3 g, λ = 435 nm.
Ijms 26 04597 g005
Figure 6. Effect of incubation time at 60 °C. cMo(VI) = 2.0 × 10⁻⁶, pH = 5, c4NC = 3.75 × 10⁻⁴ mol L−1, cA336 = 2 × 10⁻⁴ mol L−1, wTX-114 = 0.5%, Vbuffer = 2.0 mL, mSRP = 3 g, λ = 435 nm.
Ijms 26 04597 g006
Figure 7. Application of the mobile equilibrium method for the determination of the 4NC-to-Mo (1) and A336-to-Mo (2) molar ratios.
Ijms 26 04597 g007
Figure 8. Application of the straight-line method of Asmus for the determination of the 4NC-to-Mo (a) and A336-to-Mo (b) molar ratios.
Ijms 26 04597 g008
Figure 9. Application of the Blue Applicability Grade Index (BAGI) (a) and the Click Analytical Chemistry Index (CACI) (b) to evaluate the proposed procedure.
Ijms 26 04597 g009
Table 1. Optimal CPE–spectrophotometric conditions.
ParameterOptimal Value/RangeFigure
Wavelength, nm435Figure 2
pH4.5–5.0Figure 3a
Volume of the buffer, mL2–3Figure 3b
Concentration of 4NC, mol L−13.75 × 10⁻⁴Figure 4a
Concentration of A336, mol L−12.0 × 10⁻⁴Figure 4b
Mass fraction of TX-1140.4–0.5Figure 5
Incubation time at 60 °C, min55Figure 6
Refrigeration time at −20 °C, min55
Test tube capacity, mL50
Mass * of the final solution, g3
* In the presence of 0.5 mL ethanol.
Table 2. The logarithmic value of the conditional extraction constant.
MethodLog Kex *
Holme–Langmyhr method8.8 ± 0.4
Mobile equilibrium method8.6 ± 0.3
* ± Standard deviation (SD).
Table 3. Determination of Mo(VI) (7.7 μg) in the presence of foreign ions.
IonSalt FormulaIon:Mo(VI) Mass RatioMo(VI) Found, μgR, %
Al(III)Al2(SO4)3·18H2O1 a
100 b
7.7
7.9
100
102
Ba(II)BaCl210007.395.6
BrNaBr2000 c7.8101
Ca(II)Ca(NO3)27507.7100
Cd(II)CdCl21007.496.2
ClNaCl2000 c7.395.2
Cr(III)Cr2(SO4)32 a8.0104
Cr(VI)K2CrO427.9103
Co(II)CoSO4·7H2O107.699.4
Cu(II)Cu(SO4)2·5H2O5 a7.698.6
EDTA2−Na2EDTA·2H2O500
1000
7.4
6.8
96.2
88.0
FNaF200
500
7.9
8.1
102
105
Fe(III)Fe2(SO4)35 a7.597.9
HPO42−Na2HPO4·12H2O1007.9103
Li+Li2SO4·H2O10008.2107
Mg(II)MgSO4·7H2O2500 c7.9103
Mn(II)MnSO4·H2O5 a7.395.6
Ni(II)NiSO4·7H2O1000 c7.8102
NO3NaNO32000 c7.799.4
Pb(II)Pb(NO3)210 c7.9103
Re(VII)NH4ReO41008.2106
SO42−MgSO4·7H2O10,000 b7.9103
V(V)NH4VO32 a8.0104
W(VI)Na2WO4·2H2O18.5111
Zn(II)ZnSO4·7H2O1000 c7.9102
a In the presence of Na2EDTA·2H2O (3.8 mg). b In the presence of F (3.8 mg). c Higher mass ratios were not studied.
Table 4. Determination of Mo in referent standard steel samples (n = 4).
#Certified Mo Content, %Other Ingredients, %Mo Found,* %R, %
10.9617.7 (W), 4.71 (Co), 4.21 (Cr), 1.58 (V), 0.35 (Mn), 0.18 (Si), 0.081(C), and the balance Fe0.964 ± 0.032100.4
20.9711.7 (W), 4.09 (Cr), 0.35 (Mn), 0.12 (Ni), 0.10 (Cu), 0.083 (C), 0.22 (Si), and the balance Fe0.960 ± 0.04099.0
* ±SD.
Table 5. Determination of Mo(VI) in unspiked and spiked samples of bottled mineral water (n = 3).
Bottled WaterMo(VI) Concentration, ng mL−1RSD, %R, %
AddedFound c
Gorna Banya a016.7 ± 1.59.0
19.235.8 ± 2.77.799.6
38.457.4 ± 4.17.2106
57.674.1 ± 9.212.499.7
76.892.4 ± 5.66.098.7
Devin b021.8 ± 1.88.9
19.240.0 ± 3.28.194.6
38.462.4 ± 2.23.6106
57.681.7 ± 1.01.2104
76.896.0 ± 0.80.896.7
a Mineral water from borehole #4 (Gorna Banya) and Domus Ravine spring. b Mineral water from boreholes #5 and #3, Devin field. c ±SD.
Disclaimer/Publisher’s Note: The statements, opinions and data contained in all publications are solely those of the individual author(s) and contributor(s) and not of MDPI and/or the editor(s). MDPI and/or the editor(s) disclaim responsibility for any injury to people or property resulting from any ideas, methods, instructions or products referred to in the content.

