Abstract
Regulatory T lymphocytes play a critical role in immune regulation and are involved in the aberrant cell elimination by facilitating tumor necrosis factor connection to the TNFR2 receptor, encoded by the TNFRSF1B polymorphic gene. We aimed to examine the effects of single nucleotide variants TNFRSF1B c.587T>G, c.*188A>G, c.*215C>T, and c.*922C>T on the clinicopathological characteristics and survival of cutaneous melanoma (CM) patients. Patients were genotyped using RT-PCR. TNFRSF1B levels were measured using qPCR. Luciferase reporter assay evaluated the interaction of miR-96 and miR-1271 with the 3′-UTR of TNFRSF1B. The c.587TT genotype was more common in patients younger than 54 years old than in older patients. Patients with c.*922CT or TT, c.587TG or GG + c.*922CT or TT genotypes, as well as those with the haplotype TATT, presented a higher risk of tumor progression and death due to the disease effects. Individuals with the c.*922TT genotype had a higher TNFRSF1B expression than those with the CC genotype. miR-1271 had less efficient binding with the 3′-UTR of the T allele when compared with the C allele of the SNV c.*922C>T. Our findings, for the first time, demonstrate that TNFRSF1B c.587T>G and c.*922C>T variants can serve as independent prognostic factors in CM patients.
1. Introduction
Cutaneous melanoma (CM) is a low-incidence tumor worldwide, but with variable lethal potential; patients with superficial skin lesions are generally cured of the disease, but those with metastatic lesions usually present short survival [1].
There are several significant risk factors considered in the development and progression of cutaneous melanoma (CM). Consequently, this disease is complex and multifactorial [2]. Environmental factors, such as skin exposure to ultraviolet (UV) radiation from sunlight and other sources [3], and genetic factors, including inherited mutations in cyclin-dependent kinase inhibitor 2A (CDKN2A), cyclin-dependent kinase 4 (CDK4), xeroderma pigmentosum (XP), and melanocortin 1 receptor (MC1R) [2,4], are frequently identified as factors related to CM. Moreover, CM is one of the most immunogenic types of solid tumors, eliciting an active antitumor response [5]. Thus, both acquired [6] and inherited [7] failures to recognize and combat abnormal melanocytes by the immune system may predispose individuals to the tumor or contribute to tumor progression. Different cells of the immune system are required for the destruction of abnormal cells [6,8,9], and lymphocytes are recognized as the primary cells in antitumor immunity [8,9]. Lymphocytes include NK cells (responsible for the destruction of abnormal cells and regulation of immune responses), B lymphocytes (engaged in antibody production and release), CD4 T lymphocytes (involved in the regulation of immune responses), and CD8 T lymphocytes (responsible for the direct destruction of abnormal cells). The latter two types of cells are also identified as regulatory T lymphocytes (Tregs) for immune response regulation and effector T lymphocytes (Teffs) [3,8,9].
Tregs play crucial roles in promoting immune tolerance, tumor development, and progression. These cells inhibit the activation and differentiation of CD4+ helper T cells and CD8+ cytotoxic T cells [10], block costimulatory signals from CD80 and CD86, regulate interleukin-2 (IL-2), secrete inhibitory cytokines, and kill Teffs [11,12]. In addition, Tregs modulate the destruction of abnormal cells by binding the tumor necrosis factor (TNF) to tumor necrosis factor receptor 2 (TNFR2) on their surfaces [11,13]. TNFR2 expression is upregulated in activated Tregs, and the binding of TNF to TNFR2 increases the proliferation, survival, and suppressive function of Tregs [14,15]. In B16F10 metastatic melanoma mice, TNF, through its binding to TNFR2, induced Treg proliferation, resulting in the escape of tumor cells from immune surveillance. Treg-cell depletion reduced the number of metastases in TNFR2-deficient animals [16]. Notably, basal levels of TNFR2 altered relapse-free survival in CM patients [17], and antibodies targeting TNFR2 on Tregs are seen as promising agents to promote immune-mediated control of tumors [18,19,20,21,22].
TNFR2 is encoded by the polymorphic gene TNFRSF1B [23]. Therefore, the ability to destroy abnormal cells varies among individuals, and can lead to distinct clinicopathological aspects and outcomes in CM patients.
The TNFRSF1B c.587T>G (rs1061622) single nucleotide variant (SNV) results in the replacement of thymine (T) by guanine (G) in the amino acid coding region, leading to the change in methionine by arginine at position 196 of the protein chain [24]. This variation does not appear to alter the TNF binding kinetics of TNFR2, but affects TNF-induced apoptosis in adenocarcinoma cervical cancer cells (HeLa cells) through impaired NF-kB signaling and target gene expression [25]. An exchange of adenine (A) by guanine (G) is determined by TNFRSF1B c.*188A>G (rs1061624) SNV [26], while TNFRSF1B c.*215C>T (rs3397) [26] and TNFRSF1B c.*922C>T (rs1061628) [27] SNVs result in the substitution of cytosine (C) by thymine (G). The roles of these SNVs in the encoded proteins remain unclear, but the last three mentioned SNVs, located in the 3′-untranslated region (3′-UTR) of the TNFRSF1B, can alter microRNA (miR) binding, influencing gene expression and CM progression [28]. The roles of these TNFRSF1B SNVs in the outcomes of patients with lung cancer [29], non-Hodgkin lymphoma [30], and esophageal carcinoma [31] remain controversial, and their impacts on the outcomes of patients with CM are unknown.
MiRs are small non-coding RNA molecules that predominantly bind to the 3′-UTR of messenger RNA (mRNA) of target genes, resulting in mRNA silencing or degradation and the inhibition of protein production [32,33]. Several miRs, such as miR-16, miR-204, miR-210, miR-221, and miR-222, play important roles in CM development and progression [34]. Additionally, miR-146a, miR-155, miR-125b, miR-100, let-7e, miR-125a, miR-146b, and miR-99b are associated with immune response modulation and therapy resistance in CM [35]. The TNFRSF1B is a target for miR binding; in silico analysis predicts direct targeting by miR-19a, miR-103a, miR-130a, and miR-17 in gastric cancer and lymphoma [36,37]. Furthermore, miR-148a binding at the TNFRSF1B modulated colitis-associated tumorigenesis in mice [38]. Understanding the functional role of different miRs in CM, identifying their direct targets, and elucidating their regulatory mechanisms are crucial, as abnormalities in the activity of these miRs contribute to tumor development and progression [39,40]. In the present study, we analyzed, for the first time, the associations of TNFRSF1B c.587T>G, c.*188A>G, c.*215C>T, and c.*922C>T SNVs with clinicopathological aspects and prognoses in CM patients. Additionally, we conducted functional studies to understand their biological consequences and associations.
2. Results
2.1. Study Population
Clinicopathological aspects of patients are presented in Table 1. The patients’ median age was 54 years old. Most patients were white-skinned, had more than 20 nevi, and their skin had been sun-exposed during their lifetime. Most melanomas were at stages I or II, had superficial spreading, had ≤1 or 2 mm of Breslow thickness, and were of Clark levels III or IV.

Table 1.
Distribution of 433 cutaneous melanoma patients stratified by clinicopathological characteristics.
2.2. TNFRSF1B c.587T>G SNV at Age of Diagnosis
Patient samples were in the HWE at the loci of SNVs of the TNFRSF1B gene (c.587T>G: χ2 = 0.25, p = 0.61; c.*188A>G: χ2 = 1.07, p = 0.30; c.*215C>T: χ2 = 0.84, p = 0.35; c.*922C>T: χ2 = 1.86, p = 0.17). TGTC, TACC, and TATT haplotypes of the mentioned SNVs were considered for the study.
The frequencies of TNFRSF1B c.587T>G, c.*188A>G, c.*215C>T, and c.*922C>T genotypes in patients stratified by clinical aspects are presented in Table 2. The c.587TT genotype was more common in patients aged ≤54 years than in older patients (69.5 versus 57.0%, p = 0.007). Combined genotypes and haplotypes of the SNVs did not alter the clinical aspects of the patients.
Table 2.
Frequencies of genotypes of the TNFRSF1B single nucleotide variants in 433 cutaneous melanoma patients stratified by clinical aspects.
No associations of c.587T>G, c.*188A>G, c.*215C>T, and c.*922C>T genotypes (Supplementary Table S1), combined genotypes, and haplotypes with pathological aspects of tumors were found in the study.
2.3. TNFRSF1B c.587T>G and c.*922C>T SNVs in Survival of Patients with CM
Clinical data from nine patients seen at the University of Campinas were inconsistent and they were excluded from the survival analysis. One hundred sixty-nine patients from the Pio XII Foundation were not included in the analysis of survival due to difficulties in updating the data imposed by the COVID-19 pandemic. Five-year (60 months) progression-free survival (PFS) and melanoma-specific survival (MSS) rates for patients with CM were 74.1% and 84.8%, respectively.
At 60 months of follow up, PFS was lower in males (69.8 versus 78.4%, p = 0.03), patients with tumors at clinical stages III or IV (33.0 versus 82.7%, p < 0.0001), non-superficial spreading (59.6 versus 88.9%, p < 0.0001), T3 or T4 Breslow thickness values (49.6 versus 92.4%, p < 0.0001), and at Clark levels III to V (66.0 versus 93.4%, p < 0.0001) (Kaplan–Meier estimates). In Cox’s univariate analysis, males, patients with tumors at clinical stages III or IV, non-superficial spreading, T3 or T4 Breslow thickness values, and Clark levels III to V had more chances of presenting a progression of disease than others. Only a tendency for lower PFS was seen in patients with the TATT haplotype of TNFRSF1B SNVs. In Cox’s multivariate analysis, patients with tumors at stages III or IV, non-superficial spreading, T3 or T4 Breslow thickness values, c.*922CT or TT genotypes, c.587TG or GG + c.*922CT or TT genotypes, and TATT haplotypes of TNFRSF1B c.587T>G, c.*188A>G, c.*215C>T, and c.*922C>T SNVs had more chances of presenting disease progression than others (Table 3, Figure 1).
Table 3.
Significant clinicopathological aspects, genotypes, and haplotypes of the TNFRSF1B single nucleotide variants in survival of 255 cutaneous melanoma patients.
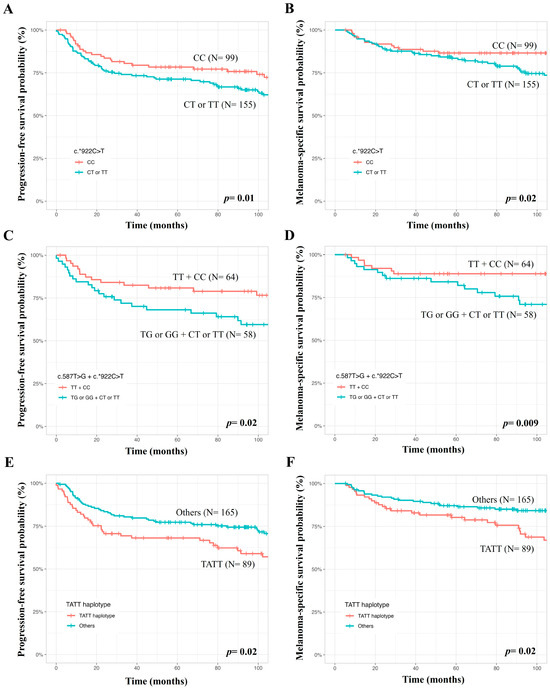
Figure 1.
Analysis of genetic variants in the TNFRSF1B gene in survival of patients with cutaneous melanomas, where lower progression-free survival and melanoma-specific survival were seen in patients with the TNFRSF1B c.*922CT or TT genotypes (A,B), the TNFRSF1B c.587TG or GG + c.*922CT or TT genotypes (C,D), and TATT haplotype (E,F) compared to patients with the remaining genotypes and haplotypes.
At 60 months of follow up, MSS was lower in patients aged >54 years (79.2 versus 90.3%, p = 0.007), males (77.4 versus 92.1%, p = 0.0003), patients with tumors at clinical stages III or IV (46.8 versus 92.0%, p < 0.0001), non-superficial spreading (73.5 versus 95.9%, p < 0.0001), T3 or T4 Breslow thickness values (68.9 versus 96.6%, p < 0.0001), and Clark levels III to V (78.8 versus 98.6%, p < 0.0001) (Kaplan–Meier estimates). In Cox’s univariate analysis, patients aged>54 years, males, patients with tumors at stages III or IV, non-superficial spreading, T3 or T4 Breslow thickness values, Clark levels III to V, and TATT haplotypes of TNFRSF1B c.587T>G, c.*188A>G, c.*215C>T, and c.*922C>T SNVs had more chances of evolving to death due to CM effects. In Cox’s multivariate analysis, patients aged>54 years, with tumors at clinical stages III or IV, non-superficial spreading, c.*922CT or TT genotypes, c.587TG or GG + c.*922CT or TT genotypes, and TATT haplotypes of TNFRSF1B SNVs had more chances of evolving to death due to CM (Table 3, Figure 1).
The remaining single/combined genotypes and haplotypes of the analyzed SNVs did not affect patients’ survival (Supplementary Table S2).
2.4. TNFRSF1B c.*922C>T SNV in Gene Expression
Similar TNFRSF1B expressions were seen in individuals with different genotypes and alleles of c.587T>G SNV.
Individuals with the TT genotype of TNFRSF1B c.*922C>T presented a higher gene expression than those with the CC genotype (2.57 arbitrary units (AUs) ± 0.96 standard deviation (SD) versus 1.96 AUs ± 1.26 SD; p = 0.02) or CT (2.57 AUs ± 0.96 SD versus 1.94 AUs ± 1.21 SD; p = 0.008) genotypes. No difference in gene expression was observed in individuals with CC and CT genotypes (p>0.05). Gene expression was also higher in individuals with T alleles when compared to individuals with C alleles (2.28 AUs ± 1.11 SD versus 1.95 AUs ± 1.22 SD; p = 0.04) (Figure 2).
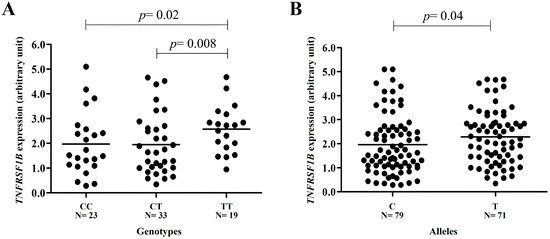
Figure 2.
TNFRSF1B gene expression in peripheral blood leukocyte samples from individuals stratified by SNV c.*922C>T variant genotypes. The expression is higher in (A) individuals with the TT genotype when compared to individuals with CC (2.57 arbitrary units (AUs) ± 0.96 standard deviation (SD) versus 1.96 AUs ± 1.26 SD; p = 0.02) or CT (2.57 AUs ± 0.96 SD versus 1.94 AUs ± 1.21 SD; p = 0.008) genotypes and (B) in carriers of the variant T allele when compared to those with the ancestral C allele (2.28 AUs ± 1.11 SD versus 1.95 AUs ± 1.22 SD; p = 0.04). No difference in gene expression was observed in individuals with CC and CT genotypes (p > 0.05) (t test).
2.5. TNFRSF1B c.*922C>T SNV with miR-1271 in Luciferase Transcription
The relative luciferase activity did not show significant differences in SK-MEL-28 and A-375 cells co-transfected with the plasmid pMIR c.*922C and the inhibitory sequence of miR-96 when compared to the group containing the same plasmid co-transfected with the mimic sequence of miR-96 (SK-MEL-28: 100.0 versus 70.0%, p = 0.23; A-375: 100.0 versus 79.0%, p = 0.05). No differences were observed between the groups containing the plasmid pMIR_c.*922C co-transfected with the mimic sequence of miR-96 when compared to the group of pMIR_c.*922T plasmid co-transfected with the mimic sequence of miR-96 (SK-MEL-28: 70.0 versus 81.0%, p = 0.49; A-375: 79.0 versus 78.0%, p = 0.25) (Supplementary Figure S1).
SK-MEL-28 and A-375 cells co-transfected with pMIR_c.*922C and miR-1271 inhibitor featured an increase in luciferase activity when compared with those co-transfected with pMIR_c.*922C and miR-1271 mimics (SK-MEL-28: 100.0 versus 71.0%; p = 0.04; A-375: 100.0 versus 54.0%; p = 0.01). SK-MEL-28 and A-375 cells co-transfected with pMIR_c.*922C and miR-1271 mimic sequences featured lower luciferase activity when compared with those co-transfected with pMIR c.*922T and miR-1271 mimic sequences (SK-MEL-28: 71.0 versus 107.0%, p = 0.02; A-375: 54.0 versus 72.0%, p = 0.01) (Figure 3).
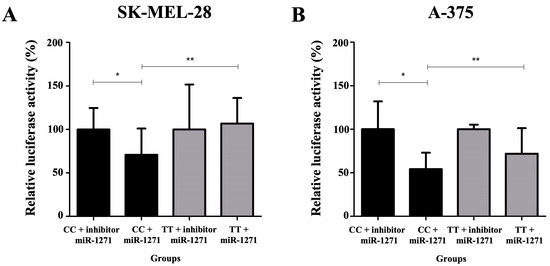
Figure 3.
Quantification of relative luciferase activity in groups: pMIR c.*922C (CC genotype) co-transfected with microRNA inhibitor (miR)-1271 (considered 100% luciferase enzyme activity); pMIR c.*922C co-transfected with the mimic sequence of miR-1271; pMIR c.*922T (TT genotype) co-transfected with the inhibitor of miR-1271; and pMIR c.*922T co-transfected with the mimic sequence of miR-1271 in melanoma cell lines SK-MEL-28 (A) and A-375 (B). (*) The relative luciferase activity was higher when comparing the group containing the plasmid with the CC genotype co-transfected with the inhibitory sequence of miR-1271 and the group containing the same plasmid co-transfected with the mimic sequence of miR-1271 (SK-MEL-28: 100.0 versus 71.0%; p = 0.04; A-375: 100.0 versus 54.0%; p = 0.01). (**) The relative luciferase activity was lower when comparing the group containing the plasmid with the CC genotype co-transfected with the mimic sequence of miR-1271 and the group containing the plasmid TT co-transfected with the mimic sequence of miR-1271 (SK-MEL-28: 71.0 versus 107.0%, p = 0.02; A-375: 54.0 versus 72.0%, p = 0.01) (t test).
3. Discussion
In the current study, the roles of TNFRSF1B c.587T>G, c.*188A>G, c.*215C>T, and c.*922C>T SNVs in the clinicopathological aspects and survival of CM patients and expression of the TNFRSF1B gene were investigated. In addition, c.*922C>T SNV was analyzed by the luciferase reporter gene assay with the purpose of evaluating its interaction with miRs in disease.
It was initially observed that the clinical aspects of our patients and pathological aspects of the tumor were like those seen in patients analyzed in other parts of Brazil [41,42,43,44] and of the world [45,46,47,48,49]. Therefore, the sample enrolled in the current study was representative of CM, and consequently, it could be used for the assessment of factors associated with the clinicopathological aspects of CM and prognosis of patients with CM.
Secondly, it was found that the TT genotype of TNFRSF1B c.587T>G SNV was more common in younger patients (patients aged ≤54 years compared to older patients), a common aspect of tumors with unequivocal genetic components, such as those of hereditary syndromes [50,51] and familial tumors [52,53], which are, respectively, determined by high and low penetrance mutations.
To the best of our knowledge, there are no previous studies focusing on the role of TNFRSF1B c.587T>G SNV in the clinicopathological aspects of cancer patients, and therefore, it was not possible to compare our data with others in the literature. Similar TNFRSF1B expression was seen in the peripheral blood samples of individuals with different genotypes and alleles of c.587T>G SNV enrolled in the current study. Nevertheless, the observation of an excess of the TNFRSF1B c.587 TT genotype in patients aged ≤ 54 years was not exactly a surprise, since the SNPs3D algorithm predicted a possible alteration in TNFR2 stability by the SNV. It was previously described that Tregs inhibit Teffs, and Tregs in normal tissue can be predisposed to tumor occurrence, and, in the tumor microenvironment, can induce tumor progression and spread [11]. TNF was produced by 83% of primary melanomas and 57% of metastatic melanomas [54]. In addition, TNF, through its binding to TNFR2, induced Tregs proliferation in B16F10 mice with metastatic melanomas, resulting in the escape of tumor cells from immune surveillance, and Treg cell depletion in TNFR2-deficient animals reduced the number of metastases of CM [9]. With these findings and descriptions, we hypothesized that the c.587TT genotype of TNFRSF1B SNV could guarantee the stability of TNFR2, favoring TNF binding, and inducing Treg proliferation and Teffs inhibition in the skin, favoring the shorter survival of abnormal melanocytes.
Third, shorter PFS and MSS were observed in patients with c.*922CT or TT genotypes, c.587TG or GG + c.*922CT or TT combined genotypes, and TATT haplotypes of TNFRSF1B c.587T>G, c.*188A>G, c.*215C>T, and c.*922C>T SNVs. In the Cox multivariate analysis, patients with the respective genotypes and haplotypes presented 2.00, 2.48, and 1.75 more chances of presenting a progression of disease than others, and 2.09, 3.68, and 1.98 more chances of evolving to death due to CM, respectively. To our knowledge, there are no previous studies focusing on the association of TNFRSF1B c.*922C>T SNV with outcomes of cancer patients. The TNFRSF1B c.587GG genotype was associated with a better OS of patients with lung cancer [29]. The TNFRSF1B c.587T>G genotype did not alter the responses to 5-fluorouracil and cisplatin and survival of patients with esophageal carcinomas [31], but its role in the CM outcome is still unknown. Thus, our data indicate that the c.*922C>T and c.587GG SNVs can alter the survival of CM patients. Other immune-related variants enrolled in the regulation of T-lymphocyte activity, the PD1.1 and PD1.5 SNVs of the PDCD1 gene, also altered the recurrence-free survival of CM and provided support to the findings of the current study [7].
The association of TNFRSF1B c.*922CT or TT genotypes with shorter PFS and MSS was expected in patients in the current study. In fact, a high TNFRSF1B expression was found in individuals with the TT genotype of the c.*922C>T SNV, which could have resulted from the less efficient binding of miR-1271 with the TNFRSF1B 3′-UTR region encoded by the T allele than by the C allele of c.*922C>T SNV. This finding may have guaranteed the presence of TNFR2 in Tregs of a tumor microenvironment. Furthermore, the binding of TNF to TNFR2 may have induced Tregs proliferation, Teffs inhibition, and the survival of abnormal melanocytes, resulting in the progression of CM. High basal levels of TNFR2 were previously associated with lower relapse-free survival in CM patients [17], and miR-1271 was previously associated with the inhibition of cell growth in lung cancer through mTor suppression [55], colorectal cancer by downregulating methaderin/Wnt signaling [56], and prostate cancer by the inhibition of the MAPK pathway [57]. However, the association of TNFRSF1B expression/TNFR2 levels, miRNA-1271, and TNFRSF1B c.*922C>T SNV with melanoma cell proliferation should be investigated by additional functional studies.
The role of c.587TG or GG genotypes of TNFRSF1B c.587T>G SNV in association with c.587TG or GG + c.*922CT or TT genotypes with shorter PFS and MSS is not easily explained. Similar TNFRSF1B expression was observed in individuals with TNFRSF1B c.587TT and GG genotypes in the current study. Till et al. (2005) [25] showed that the G allele determined a significantly lower capability to induce TNFR2-mediated NF-kB activation, and the pretriggering of TNFR2 with a receptor-specific mutein led to an enhancement of the TNFR1-induced apoptosis of transformed Hela cells carrying the GG genotype. However, it has recently been reported that TNFR2 is expressed by at least 25 types of tumors, including CM [58]. In colorectal cancer tissue, the expression of TNFR2 was correlated with Ki-67 expression [59] and a resistance to adriamycin in breast cancer [60], but the functional consequences of TNFR2 expression and of TNFRSF1B c.587T>G SNV on CM cells remain to be elucidated. The high expression of TNFR2 by tumor tissues has been viewed with enthusiasm because it is a premise to explore the possibility of tumor treatment with TNFR2-targeting agents [59]. Nevertheless, single c.587T>G SNV did not alter patients’ survival and did not increase the risk for disease relapse, disease progression, or death when associated with c.*922C>T SNV, and therefore, it is possible that the association of the combined genotype with the poor prognosis of CM patients is attributable only to the effect of c.*922C>T SNV.
We are aware that the results of the association of genotypes with the clinicopathological aspects and survival of CM patients have been obtained from a relatively small number of patients; TNFRSF1B c.587T>G genotypes were analyzed only in patients aged ≤54 years or >54 years; TNFRSF1B expression was measured only in the peripheral blood samples of individuals with distinct genotypes of c.587T>G and c.*922C>T SNVs; and the relation of genotypes of TNFRSF1B SNVs with TNFR2 quantity and quality in Tregs and CM cells, as well as their mechanisms of actions in CM, needs to be investigated further.
Thus, the results obtained in the current study should be validated in further larger studies and complemented by mouse models of CM and functional studies. We also believe that a future study of patients with CM with different genotypes of the TNFRSF1B gene treated with target therapy (BRAF and MEK inhibitors) and immunotherapy (anti-PD1/PDL1 and anti-CTLA4) should be conducted to verify whether the new agents can overturn the unfavorable prognosis of the identified genotypes.
4. Materials and Methods
4.1. Study Population
A total of 433 patients with CM were evaluated, with 264 patients diagnosed and treated at the Clinical Oncology Service of the General Hospital of the University of Campinas and 169 patients at the Cancer Hospital of Barretos of the Pio XII Foundation, during the period from November 2018 to July 2000. Patients with the amelonocytic or acral subtype were excluded from the study due to their distinct histological, phenotypic, genetic, and biological aspects when compared to other types of CM. The study received approval from the research ethics committees of the University of Campinas (process number 3.498.678) and the Pio XII Foundation (process number 3.646.661), and all procedures were conducted in accordance with the Helsinki Declaration.
4.2. Clinical Aspects, Tumor Aspects, and Treatment
Clinical characteristics of patients with CM were obtained through specific questionnaires. Skin color and the number of nevi were classified according to the International Agency for Research on Cancer (IARC) protocol [61], and skin phototype was identified using previously defined criteria [62]. Regarding sun exposure, patients were stratified as sun-exposed when exposed to more than two hours of sunlight per day for over ten years and non-sun-exposed when exposed to fewer hours and/or a shorter time interval in years [63]. Patients who reported pain and erythema, with or without blister formations, for more than 24 h in at least one event in their lifetime were classified as having experienced sunburn [64].
Tumor characteristics were obtained from the medical records of patients with CM. Tumors were classified based on previously defined criteria for location [65]. The diagnosis of CM was established through an anatomopathological examination using conventional criteria, with the histological type, Breslow index, and Clark level derived from the patient’s anatomopathological examination report. Tumor stage was determined following the criteria of the American Joint Committee on Cancer [66].
Patients were treated based on the protocol of the institutions [67]. In summary, patients initially underwent a local excision of the tumor as a diagnostic procedure, with a subsequent margin expansion when necessary. Sentinel lymph node evaluations were performed on patients with tumors having a Breslow index of more than 1 mm, and a lymphadenectomy was performed on those with a histological tumor infiltration or clinically positive lymph nodes. Patients with a single metastasis or operable recurrence underwent a surgical removal of the tumor, while those with multiple metastases and inoperable recurrences received chemotherapy with dacarbazine. Patients with unresectable brain and bone metastases underwent palliative treatment with radiotherapy. Patient treatment and follow-up data were obtained from the medical records.
4.3. Selection of SNVs and Associated miRNAs
A search in the database of the National Center for Biotechnology Information (www.ncbi.nlm.nih.gov/projects/SNP), accessed on 8 May 2021, was conducted, resulting in the identification of 38 SNVs in the TNFRSF1B gene for the present study. Subsequently, 9 SNVs previously associated with cancer were selected (Supplementary Table S3), and six SNVs with sample sizes compatible with the number of samples available at our laboratory (N = 550) remained in the study. One SNV located in the amino acid coding region (c.587T>G, rs1061622) and three SNVs in the 3′-UTR region (c.*188A>G, rs1061624; c.*215C>T, rs3397; and c.*922C>T, rs1061628) of the TNFRSF1B were chosen for the study (N = 4) due to potential structural alterations in the receptor and possible changes in miRNA binding sites, influencing gene expression, respectively. Frequencies of selected SNV genotypes, both isolated and in combination, were analyzed in patients and controls, as well as in patients stratified by clinicopathological features. The steps of SNV selection are illustrated in Supplementary Figure S2.
For the TNFRSF1B c.587T>G (rs1061622) SNV, in silico tests using PolyPhen-2 [68], SIFT, and SNPs3D [69] computer programs were conducted to verify a possible structural change in the TNFR2 receptor. It was observed that the prediction of a structural alteration in the receptor was called “benign” or “tolerated” by the PolyPhen-2 and SIFT algorithms. However, the stability of TNFR2 could be altered by the variant SNV allele, according to the analysis of SNPs3D (support vector machine profile −0.35). A score less than 0 meant the SNV could be predicted as deleterious [70].
Considering TNFRSF1B c.*188G>A, c.*215T>C, and c.*922C>T SNVs, in silico analyses using the SNPinfo [71], MicroSNiPer [72], and MirSNPscore [73] computer programs were performed to predict and select miRs associated with the possible change in the binding site on the 3′-UTR of the gene determined by SNVs. It was observed that c*188A>G SNV could change the binding site of eight miRs, c.*215T>C of 12 miRNAs, and c.*922C>T of 14 miRNAs (Supplementary Table S4). For further analysis, miRs associated with carcinogenesis processes and with a higher binding efficiency to the 3′-UTR regions of TNFRSF1B (seed-match sites: 8mer, 7mer-m8, 7mer-A1, 6mer, or 6mer offset) were selected [74] (Supplementary Table S4).
Three out of eight miRs associated with SNV c.*188A>G were related to tumor development and progression, but only miR-639 showed a higher binding efficiency (7mer-m8 binding), and it was seen as a potential candidate for functional analysis. Seven out of 12 miRNAs associated with c.*215C>T SNV were described in tumors, and miR-329-3p (7mer-m8 binding) and miR-362-3p (7mer-m8 binding) were considered the most interesting candidates for the study. Nine out of 14 miRs associated with c.*922C>T SNV were described in tumors; miR-96 (6mer binding) and miR-1271 (6mer binding) showed a higher association with tumors, and that was why they were selected as candidates for functional assays (Supplementary Figure S3).
4.4. Complementary Functional Study of Modified SK-MEL-28 and A-375 Cell Lines
SK-MEL-28 and A-375 melanoma cell lines, obtained from the Rio de Janeiro cell bank (Rio de Janeiro, Brazil) with Short Tandem Repeat (STR) analysis, were selected for the study. These cells (both BRAF mutated) were chosen due to their well-known molecular characterization, ease of cultivation, and genetic transformation. TNFRSF1B c.*922C>T was considered the SNV of greatest interest in the study due to its association with patients’ survival. To obtain melanoma cells with the same characteristics and genetic profiles, but expressing the ancestral or variant genotypes of c.*922C>T SNV for functional studies, a genetic transformation was performed. Modified SK-MEL-28 and A-375 cells with c.*922CC or TT genotypes were used in luciferase assay.
SK-MEL-28 and A-375 cells were cultured in Dulbecco’s Modified Eagle’s Medium (DMEM) (Gibco, Waltham, MA, USA) with 10% fetal bovine serum (FBS) and 1% penicillin–streptomycin (100 U/mL) (Gibco, Waltham, MA, USA), and were stored in a humidified atmosphere with 5% CO2 at 37 °C.
4.5. Determination of SNV Genotypes
Genotyping was performed in DNA extracted from peripheral blood leukocytes of the patients and controls. Genotypes of each SNV were obtained by real-time polymerase chain reaction (RT-PCR), using TaqMan® SNP Genotyping Assay (Applied Biosystems®, Waltham, MA, USA; TNFRSF1B c.587T>G, C_8861232_20; TNFRSF1B c.*188A>G, C_8861229_10; TNFRSF1B c.*215C>T, C_8861228_20; TNFRSF1B c.*922C>T, C_3143033_10), following the manufacturer’s instructions. Positive and negative controls were used in all reactions. As previously reported [75], 15% of the samples (randomly chosen) were genotyped again in an independent experiment to guarantee the genotyping quality, and a 100% concordance rate was obtained.
4.6. TNFRSF1B Expression by Quantitative PCR (qPCR)
TNFRSF1B c.587T>G and c.*922C>T SNVs were selected for gene expression analyses due to their associations with patients’ clinicopathological aspects and survival. Total RNA was obtained from peripheral blood samples of 75 individuals with TT (N = 52), TG (N = 22), and GG (N = 1) genotypes of TNFRSF1B c.587T>G SNV, and from 75 individuals with CC (N = 23), TC (N = 33), and TT (N = 19) genotypes of c.*922C>T SNV. Subsequently, cDNA was synthesized using Superscript III RT reagents (Invitrogen, Waltham, MA, USA).
Gene expression was determined by qPCR using the SYBR Green PCR Master Mix reagent (Invitrogen, Waltham, MA, USA) and specific primers for the TNFRSF1B gene (forward: 5′-GG- TCATGAGTCCTTCCACGATAC-3′, and reverse: 5′-GTGTGTTGGGATCGTGTGGA-3′). The experiment was carried out with samples in triplicate and with a negative control. Gene expression was normalized considering the expression of the actin beta gene (forward: 5′-AAGAGATGGCCACGGCTGCT-3′, and reverse 5′-TCGCTCCAACCGACTGCTGT-3′) and calculated by applying the arithmetic formula 2−ΔΔCT [76]. The values of gene expression were presented in AUs.
4.7. Plasmid Construction
As c.*922C>T was considered for functional studies, miR-96 and miR-1271 were selected for further analysis using luciferase assays.
Firstly, the 3′-UTR of the c.*922C (ancestral allele) and c.*922T (variant allele) mRNA (507 bps) of individuals with known genotypes (c.*922CC and c.*922TT, respectively) were amplified by PCR. Specific reagents and primers with restriction sites for SacI and MluI enzymes were used: forward primer: 5′-GAGCTCGCACCTATAGTCC-CAG-3′ (SacI enzyme restriction site is underlined) and reverse: 5′-ACGCGTGA-GGTAGGAG-TAGAGAG-3′ (MluI enzyme restriction site is underlined). The chosen restriction sites allowed the correct insertion of fragments to the pMIR-REPORT miRNA Expression Reporter Vector (Ambion, Waltham, MA, USA) using standard protocols. After the procedures, the plasmids pMIR_c.*922C and pMIR_c.*922T were obtained.
4.8. Dual-Luciferase Reporter Assay
SK-MEL-28 and A-375 cells were transiently transfected with plasmids pMIR_c.*922C (ancestral allele), pMIR_c.*922T (variant allele), Renilla Luciferase Control Reporter (pRL) (Promega, Madison, WI, USA) (normalizing control), and synthetic sequences of miR-96 and miR-1271 mimics, and inhibitor mimics (Ambion, Waltham, MA, USA), using Lipofectamine 3000 (Invitrogen, Waltham, MA, USA), according to the manufacturer’s instructions. Cells were harvested 48 h after transfection and the luciferase activity was measured by the Dual-Luciferase Reporter Assay System kit (Promega, Madison, WI, USA), according to the manufacturer’s instructions. Luciferase activity was normalized to the pRL vector activity. The tests were performed in triplicate and as three independent experiments.
4.9. Statistical Analysis
The Hardy–Weinberg equilibrium (HWE) was calculated using the chi-square test (χ2), where it was possible to verify whether there was a preferential distribution of any of the genotypes in the patient group. Haploview 4.2 software (www.broad.mit.edu/mpg/haploview), accessed on 17 March 2022, was used to select markers included in the haplotype analysis. Differences between groups of patients were analyzed using Fisher’s or chi-square tests. Differences in gene expression were analyzed by the t test. Furthermore, to adjust the values related to multiple comparisons of SNVs (clinical and biological aspects of the tumor), the Bonferroni method was used.
PFS was calculated from the date of surgery until the date of first recurrence, progression of disease, death from any cause, or last follow up. MSS was calculated from the date of diagnosis until the date of death from the effects of the disease or last follow up. PFS and MSS times were calculated using Kaplan–Meier probabilities, and differences between curves were assessed by the log-rank test. The prognostic impacts of clinicopathological aspects, genotypes, and haplotypes of SNVs were evaluated by the Cox univariate regression test, and subsequently, all variables with p < 0.20 were included in the Cox multivariate analysis. Survival analysis was performed in August 2023.
Significant results were considered when values of p were ≤0.05. All analyses were performed using the SPSS 21.0 statistical program.
5. Conclusions
In summary, the data presented here for the first time show that TNFRSF1B c.587T>G and c.*922C>T SNV can impact the clinicopathological features of CM and can act as independent prognostic factors in CM patients, and can be used in the future to select CM patients homogeneously treated for differentiated approaches.
Supplementary Materials
The following supporting information can be downloaded at: https://www.mdpi.com/article/10.3390/ijms25052868/s1. References [77,78,79,80,81,82,83,84,85,86,87,88,89,90,91,92,93,94,95,96,97,98,99,100,101,102,103,104,105,106,107,108,109,110,111,112,113,114,115,116,117,118,119,120,121,122,123,124,125,126,127,128,129,130,131,132,133,134,135,136,137] are cited in the Supplementary Materials.
Author Contributions
C.S.P.L., study concepts; B.F.C. and C.S.P.L., study design and manuscript editing; B.F.C., G.V.B.G., J.C., G.J.L. and C.S.P.L., data analysis, interpretation, and manuscript preparation; B.F.C., J.C. and G.J.L., statistical analysis; B.F.C., G.V.B.G., J.C., L.T.M., G.M.G., V.d.L.V., S.V.S., G.J.L. and C.S.P.L., data acquisition and quality control of data and algorithms. All authors have read and agreed to the published version of the manuscript.
Funding
This study was funded by the São Paulo Research Foundation (FAPESP) (grant nº 2019/09168-8) and Coordination for the Improvement of Higher Education Personnel (CAPES) (grant nº 88887.337514/2019-00).
Institutional Review Board Statement
The study was conducted according to the Declaration of Helsinki and approved by the Ethics Committee of the University of Campinas (process number 3.498.678) and the Pio XII Foundation (process number 3.646.661).
Informed Consent Statement
Informed consent was obtained from all the patients or their legal guardians.
Data Availability Statement
The data that support the findings of this study are available from the corresponding author upon reasonable request.
Conflicts of Interest
The authors declare no conflicts of interest.
References
- Globocan Cancer Incidence and Mortality Worldwide Fast Stats; IARC Press: Lyon, France, 2020; Available online: http://gco.iarc.fr/ (accessed on 10 April 2021).
- Conforti, C.; Zalaudek, I. Epidemiology and risk factors of melanoma: A review. Dermatol. Pract. Concept. 2021, 11 (Suppl. 1), e2021161S. [Google Scholar] [CrossRef]
- Leonardi, G.C.; Candido, S.; Falzone, L.; Spandidos, D.A.; Libra, M. Cutaneous melanoma and the immunotherapy revolution (review). Int. J. Oncol. 2020, 57, 609–618. [Google Scholar] [CrossRef]
- Carron, J.; Torricelli, C.; Silva, J.K.; Coser, L.O.; Lima, C.S.P.; Lourenço, G.J. Intronic variants of MITF (rs7623610) and CREB1 (rs10932201) genes may enhance splicing efficiency in human melanoma cell line. Mutat. Res. 2021, 823, 111763. [Google Scholar] [CrossRef]
- Jacobs, J.F.; Nierkens, S.; Figdor, C.G.; de Vries, I.J.; Adema, G.J. Regulatory T cells in melanoma: The final hurdle towards effective immunotherapy? Lancet Oncol. 2012, 13, e32–e42. [Google Scholar] [CrossRef]
- Tucci, M.; Passarelli, A.; Mannavola, F.; Felici, C.; Stucci, L.S.; Cives, M.; Silvestris, F. Immune system evasion as hallmark of melanoma progression: The role of dendritic cells. Front. Oncol. 2019, 9, 1148. [Google Scholar] [CrossRef]
- Gomez, G.V.B.; Rinck-Junior, J.A.; Oliveira, C.; Silva, D.H.L.; Mamoni, R.; Lourenço, G.J.; Moraes, A.M.; Lima, C.S.P. Genetic polymorphisms on PDCD1 gene, regulator of T lymphocyte activity, in cutaneous melanoma risk and prognosis. Pigment Cell Melanoma Res. 2018, 31, 308–317. [Google Scholar] [CrossRef]
- Mukherji, B. Immunology of melanoma. Clin. Dermatol. 2013, 31, 156–165. [Google Scholar] [CrossRef]
- Ansell, S.M.; Vonderheide, R.H. Cellular composition of the tumor microenvironment. In American Society of Clinical Oncology Educational Book; Annual Meeting; American Society of Clinical Oncology: Alexandria, VA, USA, 2013. [Google Scholar] [CrossRef]
- Li, C.; Jiang, P.; Wei, S.; Xu, X.; Wang, J. Regulatory T cells in tumor microenvironment: New mechanisms, potential therapeutic strategies, and future prospects. Mol. Cancer 2020, 19, 116. [Google Scholar] [CrossRef]
- Balkwill, F. Tumour necrosis factor and cancer. Nat. Rev. Cancer. 2009, 9, 361–371. [Google Scholar] [CrossRef]
- Ohue, Y.; Nishikawa, H. Regulatory T (Treg) cells in cancer: Can Treg cells be a new therapeutic target? Cancer Sci. 2019, 110, 2080–2089. [Google Scholar] [CrossRef]
- Chen, X.; Oppennheim, J.J. The phenotypic and functional consequences of tumour necrosis factor receptor type 2 expression on CD4(+) FoxP3(+) regulatory T cells. Immunology 2011, 133, 426–433. [Google Scholar] [CrossRef]
- Fischer, F.; Kontermann, R.E.; Maier, O. Targeting sTNF/TNFR1 signaling as a new therapeutic strategy. Antibodies 2015, 4, 48–70. [Google Scholar] [CrossRef]
- Salomon, B.L.; Leclerc, M.; Tosello, J.; Ronin, E.; Piaggio, E.; Cohen, J.L. Tumor Necrosis Factor α and Regulatory T Cells in Oncoimmunology. Front. Immunol. 2018, 9, 444. [Google Scholar] [CrossRef]
- Chopra, M.; Riedel, S.S.; Biehl, M.; Krieger, S.; Von Krosigk, V.; Bäuerlein, C.A.; Brede, C.; Jordan Garrote, A.L.; Kraus, S.; Schäfer, V.; et al. Tumor necrosis factor receptor 2-dependent homeostasis of regulatory T cells as a player in TNF-induced experimental metastasis. Carcinogenesis 2013, 34, 1296–1303. [Google Scholar] [CrossRef] [PubMed]
- Tarhini, A.A.; Lin, Y.; Yeku, O.; La Framboise, W.A.; Ashraf, M.; Sander, C.; Lee, S.; Kirkwood, J.M. A four-marker signature of TNF-RII, TGF-α, TIMP-1 and CRP is prognostic of worse survival in high-risk surgically resected melanoma. J. Transl. Med. 2014, 12, 19. [Google Scholar] [CrossRef]
- Williams, G.S.; Mistry, B.; Guillard, S.; Ulrichsen, J.C.; Sandercock, A.M.; Wang, J.; González-Muñoz, A.; Parmentier, J.; Black, C.; Soden, J.; et al. Phenotypic screening reveals TNFR2 as a promising target for cancer immunotherapy. Oncotarget 2016, 7, 68278–68291. [Google Scholar] [CrossRef] [PubMed]
- Chen, X.; Oppenheim, J.J. Targeting TNFR2, an immune checkpoint stimulator and oncoprotein, is a promising treatment for cancer. Sci. Signal. 2017, 10, eaal2328. [Google Scholar] [CrossRef] [PubMed]
- Vanamee, E.S.; Faustman, D.L. TNFR2: A novel target for cancer immunotherapy. Trends Mol. Med. 2017, 23, 1037–1046. [Google Scholar] [CrossRef] [PubMed]
- Shaikh, F.; He, J.; Bhadra, P.; Chen, X.; Siu, S.W.I. TNF Receptor Type II as an emerging drug target for the treatment of cancer, autoimmune diseases, and graft-versus-host disease: Current perspectives and in silico search for small molecule binders. Front. Immunol. 2018, 9, 1382. [Google Scholar] [CrossRef] [PubMed]
- Zou, H.; Li, R.; Hu, H.; Hu, Y.; Chen, X. Modulation of regulatory T cell activity by TNF receptor type II-Targeting pharmacological agents. Front. Immunol. 2018, 9, 59. [Google Scholar] [CrossRef] [PubMed]
- Kaufman, B.A.; White, P.S.; Steinbrueck, T.; Donis-Keller, H.; Brodeur, G.M. Linkage mapping of the tumor necrosis factor receptor 2 (TNFR2) gene to 1p36.2 using the single-strand conformation polymorphism technique. Hum. Genet. 1994, 94, 418–422. [Google Scholar] [CrossRef]
- Pantelidis, P.; Lympany, P.A.; Foley, P.J.; Fanning, G.C.; Welsh, K.I.; Du Bois, R.M. Polymorphic analysis of the high-affinity tumor necrosis factor receptor 2. Tissue Antigens 1999, 54, 585–591. [Google Scholar] [CrossRef]
- Till, A.; Rosenstiel, P.; Krippner-Heidenreich, A.; Mascheretti-Croucher, S.; Croucher, P.J.; Schäfer, H.; Scheurich, P.; Seegert, D.; Schreiber, S. The Met-196→Arg variation of human tumor necrosis factor receptor 2 (TNFR2) affects TNF-alpha-induced apoptosis by impaired NF-kappaB signaling and target gene expression. J. Biol. Chem. 2005, 280, 5994–6004. [Google Scholar] [CrossRef] [PubMed]
- Peral, B.; Millán, J.L.S.; Castello, R.; Moghetti, P.; Escobar-Morreale, H.F. Comment: The methionine 196 arginine polymorphism in exon 6 of the TNF receptor 2 gene (TNFRSF1B) is associated with the polycystic ovary syndrome and hyperandrogenism. J. Clin. Endocrinol. Metab. 2002, 87, 3977–3983. [Google Scholar] [CrossRef]
- Ryckman, K.K.; Williams, S.M.; Krohn, M.A.; Simhan, H.N. Interaction between interleukin-1 receptor 2 and Toll-like receptor 4, and cervical cytokines. J. Reprod. Immunol. 2011, 90, 220–226. [Google Scholar] [CrossRef]
- Bonazzi, V.F.; Stark, M.S.; Hayward, N.K. MicroRNA regulation of melanoma progression. Melanoma Res. 2012, 22, 101–113. [Google Scholar] [CrossRef]
- Guan, X.; Liao, Z.; Ma, H.; Qian, J.; Liu, Z.; Yuan, X.; Gomez, D.; Komaki, R.; Wang, L.E.; Wei, Q. TNFRSF1B +676 T>G polymorphism predicts survival of non-small cell lung cancer patients treated with chemoradiotherapy. BMC Cancer 2011, 11, 447. [Google Scholar] [CrossRef]
- Nielsen, K.R.; Steffensen, R.; Bendtsen, M.D.; Rodrigo-Domingo, M.; Baech, J.; Haunstrup, T.M.; Bergkvist, K.S.; Schmitz, A.; Boedker, J.S.; Johansen, P.; et al. Inherited inflammatory response genes are associated with B-cell non-Hodgkin’s lymphoma risk and survival. PLoS ONE 2015, 10, e0139329. [Google Scholar] [CrossRef] [PubMed]
- Kuwahara, A.; Yamamori, M.; Fujita, M.; Okuno, T.; Tamura, T.; Kadoyama, K.; Okamura, N.; Nakamura, T.; Sakaeda, T. TNFRSF1B A1466G genotype is predictive of clinical efficacy after treatment with a definitive 5-fluorouracil/cisplatin-based chemoradiotherapy in Japanese patients with esophageal squamous cell carcinoma. J. Exp. Clin. Cancer Res. 2010, 29, 100. [Google Scholar] [CrossRef] [PubMed]
- Bartel, D.P. MicroRNAs: Genomics, biogenesis, mechanism, and function. Cell 2004, 116, 281–297. [Google Scholar] [CrossRef]
- Xuan, Y.; Yang, H.; Zhao, L.; Lau, W.B.; Lau, B.; Ren, N.; Hu, Y.; Yi, T.; Zhao, X.; Zhou, S.; et al. MicroRNAs in colorectal cancer: Small molecules with big functions. Cancer Lett. 2015, 360, 89–105. [Google Scholar] [CrossRef]
- Ghafouri-Fard, S.; Gholipour, M.; Taheri, M. MicroRNA Signature in Melanoma: Biomarkers and Therapeutic Targets. Front. Oncol. 2021, 11, 608987. [Google Scholar] [CrossRef]
- Marzagalli, M.; Ebelt, N.D.; Manuel, E.R. Unraveling the crosstalk between melanoma and immune cells in the tumor microenvironment. Semin. Cancer Biol. 2019, 59, 236–250. [Google Scholar] [CrossRef]
- Rossi, A.F.T.; Contiero, J.C.; Manoel-Caetano, F.D.S.; Severino, F.E.; Silva, A.E. Up-regulation of tumor necrosis factor-α pathway survival genes and of the receptor TNFR2 in gastric cancer. World J. Gastrointest. Oncol. 2019, 11, 281–294. [Google Scholar] [CrossRef]
- Wang, L.L.; Dong, J.J.; An, B.Z.; Liang, J.; Cai, K.R.; Jin, Z.S.; Jin, H.S.; Hu, J.P. Has-miR-17 increases the malignancy of gastric lymphoma by HSP60/TNFR2 pathway. J. Biol. Regul. Homeost. 2020, 34, 1317–1324. [Google Scholar] [CrossRef]
- Zhu, Y.; Gu, L.; Li, Y.; Lin, X.; Shen, H.; Cui, K.; Chen, L.; Zhou, F.; Zhao, Q.; Zhang, J.; et al. miR-148a inhibits colitis and colitis-associated tumorigenesis in mice. Cell Death Differ. 2017, 24, 2199–2209. [Google Scholar] [CrossRef]
- Mueller, D.W.; Bosserhoff, A.K. Role of miRNAs in the progression of malignant melanoma. Br. J. Cancer 2009, 101, 551–556. [Google Scholar] [CrossRef][Green Version]
- Mueller, D.W.; Bosserhoff, A.K. The evolving concept of ‘melano-miRs’-microRNAs in melanomagenesis. Pigment Cell Melanoma Res. 2010, 23, 620–626. [Google Scholar] [CrossRef] [PubMed]
- Moreno, M.; Schmitt, R.L.; Lang, M.G.; Gheno, V. Epidemiological profile of patients with cutaneous melanoma in a region of southern Brazil. J. Skin Cancer. 2012, 2012, 917346. [Google Scholar] [CrossRef] [PubMed]
- Vazquez, V.L.; Silva, T.B.; Vieira, M.A.; Oliveira, A.T.; Lisboa, M.V.; Andrade, D.A.P.; Fregnani, J.T.G.; Carneseca, E.C. Melanoma characteristics in Brazil: Demographics, treatment, and survival analysis. BMC Res. Notes 2015, 16, 8–14. [Google Scholar] [CrossRef] [PubMed]
- Melo, A.C.; Wainstein, A.J.A.; Buzaid, A.C.; Thuler, L.C.S. Melanoma signature in Brazil: Epidemiology, incidence, mortality, and trend lessons from a continental mixed population country in the past 15 years. Melanoma Res. 2018, 28, 629–636. [Google Scholar] [CrossRef]
- Costa, L.M.M.; Crovador, C.S.; Carvalho, C.E.B.; Vazquez, V.L. Characteristics of Brazilian melanomas: Real world results before and after the introduction of new therapies. BMC Res. Notes 2019, 12, 296. [Google Scholar] [CrossRef]
- Nagore, E.; Hueso, L.; Botella-Estrada, R.; Alfaro-Rubio, A.; Serna, I.; Guallar, J.; Gonzáles, I.; Ribes, I.; Guillen, C. Smoking, sun exposure, number of nevi and previous neoplasias are risk factors for melanoma in older patients (60 years and over). J. Eur. Acad. Dermatol. Venereol. 2010, 24, 50–57. [Google Scholar] [CrossRef]
- Gupta, A.K.; Bharadwaj, M.; Mehrotra, R. Skin cancer concerns in people of color: Risk factors and prevention. Asian Pac. J. Cancer Prev. 2016, 17, 5257–5264. [Google Scholar] [CrossRef] [PubMed]
- Ghiasvand, R.; Robsahm, T.E.; Green, A.C.; Rueegg, C.S.; Weiderpass, E.; Lund, E.; Veierod, M.B. Association of phenotypic characteristics and UV radiation exposure with risk of melanoma on different body sites. JAMA Dermatol. 2019, 155, 39–49. [Google Scholar] [CrossRef] [PubMed]
- Carr, S.; Smith, C.; Wernberg, J. Epidemiology and risk factors of melanoma. Surg. Clin. N. Am. 2020, 1, 12. [Google Scholar] [CrossRef] [PubMed]
- Bolick, N.L.; Geller, A.C. Epidemiology of melanoma. Hematol. Oncol. Clin. N. Am. 2021, 35, 57–72. [Google Scholar] [CrossRef]
- Viana, D.V.; Góes, J.R.N.; Coy, C.S.R.; Ayrizono, M.L.S.; Lima, C.S.P.; Lopes-Cendes, I. Family history of cancer in Brazil: Is it being used? Fam. Cancer 2008, 7, 229–232. [Google Scholar] [CrossRef]
- Toussi, A.; Mans, N.; Welborn, J.; Kiuru, M. Germline mutations predisposing to melanoma. J. Cutan. Pathol. 2020, 47, 606–616. [Google Scholar] [CrossRef]
- Guimarães, J.L.; Ayrizono, M.L.; Coy, C.S.; Lima, C.S. Gene polymorphisms involved in folate and methionine metabolism and increased risk of sporadic colorectal adenocarcinoma. Tumour Biol. 2011, 32, 853–861. [Google Scholar] [CrossRef]
- Costa, E.F.D.; Lopes-Aguiar, L.; Nogueira, G.S.; Lima, T.R.P.; Rinck-Junior, J.A.; Lourenço, G.J.; Lima, C.S.P. CASP9 c.-1339A>G and CASP3 c.-1191A>G polymorphisms alter susceptibility and clinical aspects of head and neck squamous cell carcinoma. Head Neck 2019, 41, 2665–2670. [Google Scholar] [CrossRef] [PubMed]
- Elias, E.G.; Hasskamp, J.H.; Sharma, B.K. Cytokines and growth factors expressed by human cutaneous melanoma. Cancers 2010, 2, 794–808. [Google Scholar] [CrossRef] [PubMed]
- Zhou, Z.; Niu, X.; Li, C.; Sheng, S.; Lu, S. Inhibition of the growth of non-small cell lung cancer by miRNA-1271. Am. J. Transl. Res. 2015, 7, 1917–1924. [Google Scholar]
- Sun, X.; Zhai, H.; Chen, X.; Kong, R.; Zhang, X. MicroRNA-1271 suppresses the proliferation and invasion of colorectal cancer cells by regulating metadherin/Wnt signaling. J. Biochem. Mol. Toxicol. 2018, 32, e22028. [Google Scholar] [CrossRef] [PubMed]
- Wang, M.; Gao, W.; Lu, D.; Teng, L. MiR-1271 inhibits cell growth in prostate cancer by targeting ERG. Pathol. Oncol. Res. 2018, 24, 385–391. [Google Scholar] [CrossRef]
- Yang, Y.; Islam, M.S.; Hu, Y.; Chen, X. TNFR2: Role in Cancer Immunology and Immunotherapy. Immunotargets Ther. 2021, 10, 103–122. [Google Scholar] [CrossRef]
- Zhao, T.; Li, H.; Liu, Z. Tumor necrosis factor receptor 2 promotes growth of colorectal cancer via the PI3K/AKT signaling pathway. Oncol. Lett. 2017, 13, 342–346. [Google Scholar] [CrossRef]
- Yang, F.; Zhao, N.; Wu, N. TNFR2 promotes adriamycin resistance in breast cancer cells by repairing DNA damage. Mol. Med. Rep. 2017, 16, 2962–2968. [Google Scholar] [CrossRef][Green Version]
- English, D.R.; MacLennan, R.; Rivers, J.; Kelly, J.; Armstrong, B.K. Epidemiological Studies of Melanocytic Naevi: Protocol for Identifying and Recording Naevi; IARC Internal Report no 90/002; International Agency for Research on Cancer: Lyon, France, 1990. [Google Scholar]
- Fitzpatrick, T.B. The validity and practicality of sun-reactive skin types I through VI. Arch. Dermatol. 1988, 124, 869–871. [Google Scholar] [CrossRef]
- Rigel, D.S.; Friedman, R.J.; Levenstein, M.J.; Greenwald, D.I. Relationship of fluorescent lights to malignant melanoma: Another view. J. Dermatol. Surg. Oncol. 1983, 9, 836–938. [Google Scholar] [CrossRef]
- Fortes, C.; Mastroeni, S.; Boffetta, P.; Innocenzi, L.; Antonelli, G.; Giovinazzo, R.; Anzidei, P.; Melchi, F.; D’Atri, S.; Pasquini, P.; et al. Polymorphisms of GSTM1 and GSTT1, sun exposure and the risk of melanoma: A case-control study. Acta Derm. Venereol. 2011, 91, 284–289. [Google Scholar] [CrossRef]
- Stierner, U.; Augustsson, A.; Rosdahl, I.; Suurküla, M. Regional distribution of common and dysplastic naevi in relation to melanoma site and sun exposure. A case-control study. Melanoma Res. 1992, 1, 367–375. [Google Scholar] [CrossRef] [PubMed]
- American Joint Committee on Cancer (AJCC). AJCC Cancer Stating Manual, 7th ed.; Springer: New York, NY, USA, 2010. [Google Scholar]
- Lourenço, G.J.; Oliveira, C.; Carvalho, B.S.; Torricelli, C.; Silva, J.K.; Gomez, G.V.B.; Rinck-Junior, J.A.; Oliveira, W.L.; Vazquez, V.L.; Serrano, S.V.; et al. Inherited variations in human pigmentation-related genes modulate cutaneous melanoma risk and clinicopathological features in Brazilian population. Sci. Rep. 2020, 10, 12129. [Google Scholar] [CrossRef] [PubMed]
- Adzhubei, A.I.; Schmidt, S.; Peshkin, L.; Ramensky, V.E.; Gerasimova, A.; Bork, P.; Kondrashov, A.S.; Sunyaev, S.R. A method and server for predicting damaging missense mutations. Nat. Methods 2010, 7, 248–249. [Google Scholar] [CrossRef] [PubMed]
- Kumar, P.; Henikoff, S.; Pauline, C.N.G. Predicting the effects of coding non-synonymous variants on protein function using the SIFT algorithm. Nat. Protoc. 2009, 4, 1073–1081. [Google Scholar] [CrossRef] [PubMed]
- Yue, P.; Melamud, E.; Moult, J. SNPs3D: Candidate gene and SNP selection for association studies. BMC Bioinform. 2006, 7, 166. [Google Scholar] [CrossRef] [PubMed]
- Xu, Z.; Taylor, J.A. SNPinfo: Integrating GWAS and candidate gene information into functional SNP selection for genetic association studies. Nucleic Acids Res. 2009, 37, W600–W605. [Google Scholar] [CrossRef] [PubMed]
- Barenboim, M.; Zoltick, B.J.; Guo, Y.; Weinberger, D.R. MicroSNiPer: A web tool for prediction of SNP effects on putative microRNA targets. Hum. Mutat. 2010, 31, 1223–1232. [Google Scholar] [CrossRef] [PubMed]
- Thomas, L.F.; Saito, T.; Sætrom, P. Inferring causative variants in microRNA target sites. Nucleic Acids Res. 2011, 39, e109. [Google Scholar] [CrossRef]
- Bartel, D.P. MicroRNAs: Target recognition and regulatory functions. Cell 2009, 136, 215–233. [Google Scholar] [CrossRef]
- Bladbjerg, E.M.; Gram, J.; Jespersen, J.; De Maat, M.P. Internal quality control of PCR-based genotyping methods: Practical experiences. Vascul. Pharmacol. 2002, 39, 127–129. [Google Scholar] [CrossRef]
- Livak, K.J.; Schmittgen, T.D. Analysis of relative gene expression data using real-time quantitative PCR and the 2(-Delta Delta C(T)) Method. Methods 2001, 25, 402–408. [Google Scholar] [CrossRef]
- Sennikov, S.V.; Vasilyev, F.F.; Lopatnikova, J.A.; Shkaruba, N.S.; Silkov, A.N. Polymorphisms in the tumor necrosis factor receptor genes affect the expression levels of membrane-bound type I and type II receptors. Mediators Inflamm. 2014, 745909. [Google Scholar] [CrossRef]
- Dong, W.; Jia, S.; Ye, X.; Ni, J. Association analysis of TNFRSF1B polymorphism with susceptibility for migraine in the Chinese Han population. J. Clin. Neurosci. 2012, 19, 750–752. [Google Scholar] [CrossRef]
- Potter, C.; Gibbons, L.J.; Bowes, J.D.; Cordell, H.J.; Hyrich, K.; Isaacs, J.D.; Morgan, A.W.; Wilson, A.G.; Barton, A. Polymorphisms spanning the TNFR2 and TACE genes do not contribute towards variable anti-TNF treatment response. Pharmacogenet. Genom. 2010, 20, 338–341. [Google Scholar] [CrossRef]
- Tabassum, R.; Chavali, S.; Mahajan, A.; Ghosh, A.; Madhu, S.V.; Tandon, N.; Bharadwaj, D. Association analysis of TNFRSF1B polymorphisms with type 2 diabetes and its related traits in North India. Genome Med. 2008, 2, 93–100. [Google Scholar] [CrossRef] [PubMed]
- Mokrousov, I.; Wu, X.R.; Vyazovaya, A.; Feng, W.X.; Sun, L.; Xiao, J.; Miao, Q.; Jiao, W.W.; Shen, A. Polymorphism of 3′UTR region of TNFR2 coding gene and its role in clinical tuberculosis in Han Chinese pediatric population. Infect. Genet. Evol. 2011, 11, 1312–1318. [Google Scholar] [CrossRef] [PubMed]
- Welsh, M.M.; Karagas, M.R.; Kuriger, J.K.; Houseman, A.; Spencer, S.K.; Perry, A.E.; Nelson, H.H. Genetic determinants of UV-susceptibility in non-melanoma skin cancer. PLoS ONE 2011, 6, e20019. [Google Scholar] [CrossRef] [PubMed]
- Criado, L.; Flórez, O.; Martín, J.; González, C.I. Genetic polymorphisms in TNFA/TNFR2 genes and Chagas disease in a Colombian endemic population. Cytokine 2012, 7, 398–401. [Google Scholar] [CrossRef] [PubMed]
- Heemann, C.; Kreuz, M.; Stoller, I.; Schoof, N.; Bonin, F.V.; Ziepert, M.; Löffler, M.; Jung, W.; Pfreundschuh, M.; Trümper, L.; et al. Circulating levels of TNF receptor II are prognostic for patients with peripheral T-cell non-Hodgkin lymphoma. Clin. Cancer Res. 2012, 18, 3637–3647. [Google Scholar] [CrossRef] [PubMed]
- McTiernan, C.F.; Ramani, R.; Burkhead, B.; McNamara, D. The methionine 196 arginine polymorphism of the TNF receptor 2 gene (TNFRSF1B) is not associated with worse outcomes in heart failure. Cytokine 2012, 60, 838–842. [Google Scholar] [CrossRef]
- Reyes-Gibby, C.C.; Swartz, M.D.; Yu, X.; Wu, X.; Yennurajalingam, S.; Anderson, K.O.; Spitz, M.R.; Shete, S. Symptom clusters of pain, depressed mood, and fatigue in lung cancer: Assessing the role of cytokine genes. Support Care Cancer 2013, 21, 3117–3125. [Google Scholar] [CrossRef]
- Said, L.; Faleh, R.; Smida, S.; Laajili, H.; Sakouhi, M.; Jrad, B.B.H. Maternal tumor necrosis factor receptor 2 gene variants associated with pre-eclampsia in Tunisian women. J. Obstet. Gynaecol. 2013, 39, 1301–1307. [Google Scholar] [CrossRef]
- Medrano, L.M.; Taxonera, C.; Márquez, A.; Acosta, M.B.; Gómez-García, M.; González-Artacho, C.; Pérez-Calle, J.L.; Bermejo, F.; Lopez-Sanromán, A.; Arranz, M.D.M.; et al. Role of TNFRSF1B polymorphisms in the response of Crohn’s disease patients to infliximab. Hum. Immunol. 2014, 75, 71–75. [Google Scholar] [CrossRef]
- Song, G.G.; Bae, S.C.; Lee, Y.H. Associations between functional TNFR2 196 M/R polymorphisms and susceptibility to rheumatoid arthritis: A meta-analysis. Rheumatol. Int. 2014, 34, 1529–1537. [Google Scholar] [CrossRef]
- Inoue, N.; Watanabe, M.; Ishido, N.; Kodu, A.; Maruoka, H.; Katsumata, Y.; Hidaka, Y.; Iwatani, Y. Involvement of genes encoding apoptosis regulatory factors (FAS, FASL, TRAIL, BCL2, TNFR1 and TNFR2) in the pathogenesis of autoimmune thyroid diseases. Hum. Immunol. 2016, 77, 944–951. [Google Scholar] [CrossRef]
- Singhal, P.; Sharma, U.; Hussain, S.; Nag, A.; Bharadwaj, M. Identification of genetic variants in TNF receptor 2 which are associated with the development of cervical carcinoma. Biomarkers 2016, 21, 665–672. [Google Scholar] [CrossRef] [PubMed]
- Ma, L.; Chen, S.; Mao, X.; Lu, Y.; Zhang, X.; Lao, X.; Qin, X.; Li, S. The association between TNFR gene polymorphisms and the risk of hepatitis B virus-related liver diseases in Chinese population. Sci. Rep. 2018, 8, 9240. [Google Scholar] [CrossRef] [PubMed]
- Suchanek-Raif, R.; Raif, P.; Kowalczyk, M.; Paul-Samojedny, M.; Kucia, K.; Merk, W.; Kowalski, J. Polymorphic variants of TNFR2 gene in schizophrenia and its interaction with -308G/A TNF-α Gene polymorphism. Mediat. Inflamm. 2018, 8741249. [Google Scholar] [CrossRef] [PubMed]
- Tabassum, R.; Mahajan, A.; Chauhan, G.; Dwivedi, O.P.; Dubey, H.; Sharma, V.; Kundu, B.; Ghosh, S.; Tandon, N.; Bharadwaj, D. No association of TNFRSF1B variants with type 2 diabetes in Indians of Indo-European origin. BMC Med. Genet. 2011, 12, 110. [Google Scholar] [CrossRef] [PubMed]
- Cohen-Woods, S.; Fisher, H.L.; Ahmetspahic, D.; Douroudis, K.; Stacey, D.; Hosang, G.M.; Korszun, A.; Owen, M.; Craddock, N.; Arolt, V.; et al. Interaction between childhood maltreatment on immunogenetic risk in depression: Discovery and replication in clinical case-control samples. Brain Behav. Immun. 2018, 67, 203–210. [Google Scholar] [CrossRef]
- Steenholdt, C.; Enevold, C.; Ainsworth, M.A.; Brynskov, J.; Thomsen, O.O.; Bendtzen, K. Genetic polymorphisms of tumour necrosis factor receptor superfamily 1b and fas ligand are associated with clinical efficacy and/or acute severe infusion reactions to infliximab in Crohn’s disease. Aliment Pharmacol. Ther. 2012, 36, 650–659. [Google Scholar] [CrossRef]
- Huang, Q.Y.; Li, G.H.Y.; Kung, A.W.C. Multiple osteoporosis susceptibility genes on chromosome 1p36 in Chinese. Bone 2009, 44, 984–988. [Google Scholar] [CrossRef] [PubMed]
- Zhao, L.J.; Xiong, D.H.; Pan, F.; Liu, X.G.; Recker, R.R.; Deng, H.W. Polymorphisms of the tumor necrosis factor-alpha receptor 2 gene are associated with obesity phenotypes among 405 Caucasian nuclear families. Hum. Genet. 2008, 124, 171–177. [Google Scholar] [CrossRef]
- Mullin, B.H.; Prince, R.L.; Dick, I.M.; Islam, F.M.A.; Hart, D.J.; Spector, T.D.; Devine, A.; Dudbridge, F.; Wilson, S.G. Bone structural effects of variation in the TNFRSF1B gene encoding the tumor necrosis factor receptor 2. Osteoporos. Int. 2008, 19, 961–968. [Google Scholar] [CrossRef]
- Möller, M.; Flachsbart, F.; Till, A.; Thye, T.; Horstmann, R.D.; Meyer, C.G.; Osei, I.; Helden, P.D.V.; Hoal, E.G.; Schreiber, S.; et al. A functional haplotype in the 3′untranslated region of TNFRSF1B is associated with tuberculosis in two African populations. Am. J. Respir. Crit. Care Med. 2010, 181, 388–393. [Google Scholar] [CrossRef]
- Yu, Y.; Zheng, S.; Zhang, S.; Jin, W.; Liu, H.; Jin, M.; Chen, Z.; Ding, Z.; Wang, L.; Chen, K. Polymorphisms of inflammation-related genes and colorectal cancer risk: A population-based case-control study in China. Int. J. Immunogenet. 2014, 41, 289–297. [Google Scholar] [CrossRef]
- Jones, N.M.; Holzman, C.; Tian, T.; Witkin, S.S.; Genc, M.; Friderici, K.; Fisher, R.; Sezen, D.; Babula, O.; Jernigan, K.A.; et al. Innate immune system gene polymorphisms in maternal and child genotype and risk of preterm delivery. J. Matern.-Fetal Neonatal Med. 2012, 25, 240–247. [Google Scholar] [CrossRef][Green Version]
- Stachura, A.; Brym, P.; Bojarojć-Nosowicz, B.; Kaczmarczyk, E. Polymorphism and expression of the tumor necrosis factor receptor II gene in cows infected with the bovine leukemia virus. Pol. J. Vet. Sci. 2016, 19, 125–131. [Google Scholar] [CrossRef]
- Stachura, A.; Kaczmarczyk, E.; Bojarojć-Nosowicz, B. Sequence analysis of the regulatory region of the TNF-RII gene in Polish Holstein-Friesian cows. Genet. Mol. Res. 2013, 12, 1028–1034. [Google Scholar] [CrossRef]
- Shi, J.; Chen, P.; Sun, J.; Song, Y.; Ma, B.; Gao, P.; Chen, X.; Wang, Z. MicroRNA-1258: An invasion and metastasis regulator that targets heparanase in gastric cancer. Oncol. Lett. 2017, 13, 3739–3745. [Google Scholar] [CrossRef][Green Version]
- Tsai, T.F.; Lin, J.F.; Chou, K.Y.; Lin, Y.C.; Chen, H.E.; Hwang, T.I. miR-99a-5p acts as tumor suppressor via targeting to mTOR and enhances RAD001-induced apoptosis in human urinary bladder urothelial carcinoma cells. Onco Targets Ther. 2018, 11, 239–252. [Google Scholar] [CrossRef]
- Qin, X.; Yu, S.; Zhou, L.; Shi, M.; Hu, Y.; Xu, X.; Shen, B.; Liu, S.; Yan, D.; Feng, J. Cisplatin-resistant lung cancer cell-derived exosomes increase cisplatin resistance of recipient cells in exosomal miR-100-5p-dependent manner. Int. J. Nanomed. 2017, 12, 3721–3733. [Google Scholar] [CrossRef]
- Lei, S.T.; Shen, F.; Chen, J.W.; Feng, J.H.; Cai, W.S.; Shen, L.; Hu, Z.W.; Xu, B. MiR-639 promoted cell proliferation and cell cycle in human thyroid cancer by suppressing CDKN1A expression. Biomed. Pharmacother. 2016, 84, 1834–1840. [Google Scholar] [CrossRef]
- Li, L.; Qiu, X.G.; Lv, P.W.; Wang, F. miR-639 promotes the proliferation and invasion of breast cancer cell in vitro. Cancer Cell Int. 2014, 14, 39. [Google Scholar] [CrossRef]
- Wu, Q.; Liu, H.O.; Liu, Y.D.; Liu, W.S.; Pan, D.; Zhang, W.J.; Yang, L.; Fu, Q.; Xu, J.J.; Gu, J.X. Decreased expression of hepatocyte nuclear factor 4α (Hnf4α)/microRNA-122 (miR-122) axis in hepatitis B virus-associated hepatocellular carcinoma enhances potential oncogenic GALNT10 protein activity. J. Biol. Chem. 2015, 290, 1170–1185. [Google Scholar] [CrossRef]
- Chang, Y.H.; Yin, F.; Fan, G.F.; Zhao, M. Down-regulation of miR-329-3p is associated with worse prognosis in patients with cervical cancer. Eur. Rev. Med. Pharmacol. Sci. 2017, 21, 4045–4049. [Google Scholar] [PubMed]
- Shen, H.; Li, W.; Tian, Y.; Xu, P.; Wang, H.; Zhang, J.; Li, Y. Upregulation of miR-362-3p modulates proliferation and anchorage-independent growth by directly targeting Tob2 in hepatocellular carcinoma. J. Cell. Biochem. 2015, 116, 1563–1573. [Google Scholar] [CrossRef] [PubMed]
- Ge, J.; Zhu, J.; Xia, B.; Cao, H.; Peng, Y.; Li, X.; Yu, T.; Chu, G.; Yang, G.; Shi, X. miR-423-5p inhibits myoblast proliferation and differentiation by targeting Sufu. J. Cell Biochem. 2018, 119, 7610–7620. [Google Scholar] [CrossRef] [PubMed]
- Tang, X.; Zeng, X.; Huang, Y.; Chen, S.; Lin, F.; Yang, G.; Yang, N. miR-423-5p serves as a diagnostic indicator and inhibits the proliferation and invasion of ovarian cancer. Exp. Ther. Med. 2018, 15, 4723–4730. [Google Scholar] [CrossRef]
- Wang, X.; Peng, L.; Gong, X.; Zhang, X.; Sun, R.; Du, J. miR-423-5p inhibits osteosarcoma proliferation and invasion through directly targeting STMN1. Cell. Physiol. Biochem. 2018, 50, 2249–2259. [Google Scholar] [CrossRef] [PubMed]
- Bayraktar, R.; Pichler, M.; Kanlikilicer, P.; Ivan, C.; Bayraktar, E.; Kahraman, N.; Aslan, B.; Oguztuzun, S.; Ulasli, M.; Arslan, A.; et al. MicroRNA 603 acts as a tumor suppressor and inhibits triple-negative breast cancer tumorigenesis by targeting elongation factor 2 kinase. Oncotarget 2017, 8, 11641–11658. [Google Scholar] [CrossRef] [PubMed]
- Guo, M.; Zhang, X.; Wang, G.; Sun, J.; Jiang, Z.; Khadarian, K.; Yu, S.; Zhao, Y.; Xie, C.; Zhang, K.; et al. miR-603 promotes glioma cell growth via Wnt/β-catenin pathway by inhibiting WIF1 and CTNNBIP1. Cancer Lett. 2015, 360, 76–86. [Google Scholar] [CrossRef] [PubMed]
- Lin, L.; Liu, D.; Liang, H.; Xue, L.; Su, C.; Liu, M. MiR-1228 promotes breast cancer cell growth and metastasis through targeting SCAI protein. Int. J. Clin. Exp. Pathol. 2015, 8, 6646–6655. [Google Scholar] [PubMed]
- Wang, Y.; Yao, X.; Li, S.N.; Suo, A.L.; Tian, T.; Ruan, Z.P.; Guo, H.; Yao, Y. Detection of prostate cancer related copy number variations with SNP genotyping array. Eur. Rev. Med. Pharmacol. Sci. 2013, 17, 2916–2922. [Google Scholar] [PubMed]
- Yan, Z.; Wang, J.; Wang, C.; Jiao, Y.; Qi, W.; Che, S. miR-96/HBP1/Wnt/β-catenin regulatory circuitry promotes glioma growth. FEBS Lett. 2014, 588, 3038–3046. [Google Scholar] [CrossRef] [PubMed]
- Leung, W.K.; He, M.; Chan, A.W.; Law, P.T.; Wong, N. Wnt/β-Catenin activates MiR-183/96/182 expression in hepatocellular carcinoma that promotes cell invasion. Cancer Lett. 2015, 362, 97–105. [Google Scholar] [CrossRef]
- Xu, L.; Zhong, J.; Guo, B.; Zhu, Q.; Liang, H.; Wen, N.; Yun, W.; Zhang, L. miR-96 promotes the growth of prostate carcinoma cells by suppressing MTSS1. Tumor Biol. 2016, 37, 12023–12032. [Google Scholar] [CrossRef]
- Guo, Y.; Liu, H.; Zhang, H.; Shang, C.; Song, Y. miR-96 regulates FOXO1-mediated cell apoptosis in bladder cancer. Oncol. Lett. 2012, 4, 561–565. [Google Scholar] [CrossRef]
- Xia, H.; Chen, S.; Chen, K.; Huang, H.; Ma, H. MiR-96 promotes proliferation and chemo- or radioresistance by down-regulating RECK in esophageal cancer. Biomed. Pharmacother. 2014, 68, 951–958. [Google Scholar] [CrossRef]
- Huang, Y.X.; Nie, X.G.; Li, G.D.; Fan, D.S.; Song, L.L.; Zhang, X.L. Downregulation of microRNA-182 inhibits cell viability, invasion and angiogenesis in retinoblastoma through inhibition of the PI3K/AKT pathway and CADM2 upregulation. Int. J. Oncol. 2018, 3, 2615–2626. [Google Scholar] [CrossRef] [PubMed]
- Chen, G.; Yu, L.; Dong, H.; Liu, Z.; Sun, Y. MiR-182 enhances radioresistance in non-small cell lung cancer cells by regulating FOXO3. Clin. Exp. Pharmacol. Physiol. 2018, 46, 137–143. [Google Scholar] [CrossRef] [PubMed]
- Xie, J.; Tan, Z.H.; Tang, X.; Mo, M.S.; Liu, Y.P.; Gan, R.L.; Li, Y.; Zhang, L.; Li, G.Q. MiR-374b-5p suppresses RECK expression and promotes gastric cancer cell invasion and metastasis. World J. Gastroenterol. 2016, 20, 17439–17447. [Google Scholar] [CrossRef] [PubMed]
- Qu, R.; Hao, S.; Jin, X.; Shi, G.; Yu, Q.; Tong, X.; Guo, D. MicroRNA-374b reduces the proliferation and invasion of colon cancer cells by regulation of LRH-1/Wnt signaling. Gene 2018, 642, 354–361. [Google Scholar] [CrossRef]
- Ho, J.Y.; Hsu, R.J.; Liu, J.M.; Chen, S.C.; Liao, G.S.; Gao, H.W.; Yu, C.P. MicroRNA-382-5p aggravates breast cancer progression by regulating the RERG/Ras/ERK signaling axis. Oncotarget 2017, 8, 22443–22459. [Google Scholar] [CrossRef] [PubMed]
- Xu, X.; Cai, N.; Zhi, T.; Bao, Z.; Wang, D.; Liu, Y.; Jiang, K.; Fan, L.; Ji, J.; Liu, N. MicroRNA-1179 inhibits glioblastoma cell proliferation and cell cycle progression via directly targeting E2F transcription factor 5. Am. J. Cancer Res. 2017, 7, 1680–1692. [Google Scholar]
- Song, L.; Dai, Z.; Zhang, S.; Zhang, H.; Liu, C.; Ma, X.; Liu, D.; Zan, Y.; Yin, X. MicroRNA-1179 suppresses cell growth and invasion by targeting sperm-associated antigen 5-mediated Akt signaling in human non-small cell lung cancer. Biochem. Biophys. Res. Commun. 2018, 504, 164–170. [Google Scholar] [CrossRef]
- Liu, W.; Wan, X.; Mu, Z.; Li, F.; Wang, L.; Zhao, J.; Huang, X. MiR-1256 suppresses proliferation and migration of non-small cell lung cancer via regulating TCTN1. Oncol. Lett. 2018, 16, 1708–1714. [Google Scholar] [CrossRef]
- Hu, M.; Wang, M.; Lu, H.; Wang, X.; Fang, X.; Wang, J.; Ma, C.; Chen, X.; Xia, H. Loss of miR-1258 contributes to carcinogenesis and progression of liver cancer through targeting CDC28 protein kinase regulatory subunit 1B. Oncotarget 2016, 7, 43419–43431. [Google Scholar] [CrossRef]
- Braga, E.A.; Loginov, V.I.; Burdennyi, A.M.; Filippova, E.A.; Pronina, I.V.; Kurevlev, S.V.; Kazubskaya, T.P.; Kushlinskii, D.N.; Utkin, D.O.; Ermilova, V.D.; et al. Five hypermethylated microRNA genes as potential markers of ovarian cancer. Bull. Exp. Biol. Med. 2018, 164, 351–355. [Google Scholar] [CrossRef]
- Jiang, W.; Wei, K.; Pan, C.; Li, H.; Cao, J.; Han, X.; Tang, Y.; Zhu, S.; Yuan, W.; He, Y.; et al. MicroRNA-1258 suppresses tumour progression via GRB2/Ras/Erk pathway in non-small-cell lung cancer. Cell Prolif. 2018, 51, e12502. [Google Scholar] [CrossRef] [PubMed]
- Liu, H.; Wang, H.; Liu, X.; Yu, T. miR-1271 inhibits migration, invasion and epithelial-mesenchymal transition by targeting ZEB1 and TWIST1 in pancreatic cancer cells. Biochem. Biophys. Res. Commun. 2016, 472, 346–352. [Google Scholar] [CrossRef] [PubMed]
- He, Z.J.; Li, W.; Chen, H.; Wen, J.; Gao, Y.F.; Liu, Y.J. miR-1306-3p targets FBXL5 to promote metastasis of hepatocellular carcinoma through suppressing snail degradation. Biochem. Biophys. Res. Commun. 2018, 504, 820–826. [Google Scholar] [CrossRef] [PubMed]
Disclaimer/Publisher’s Note: The statements, opinions and data contained in all publications are solely those of the individual author(s) and contributor(s) and not of MDPI and/or the editor(s). MDPI and/or the editor(s) disclaim responsibility for any injury to people or property resulting from any ideas, methods, instructions or products referred to in the content. |
© 2024 by the authors. Licensee MDPI, Basel, Switzerland. This article is an open access article distributed under the terms and conditions of the Creative Commons Attribution (CC BY) license (https://creativecommons.org/licenses/by/4.0/).