

Role of PKN1 in Retinal Cell Type Formation
 and
and
Abstract
1. Introduction
2. Results
2.1. Pkn1−/− Retinae Show Elevated NeuroD2 Levels
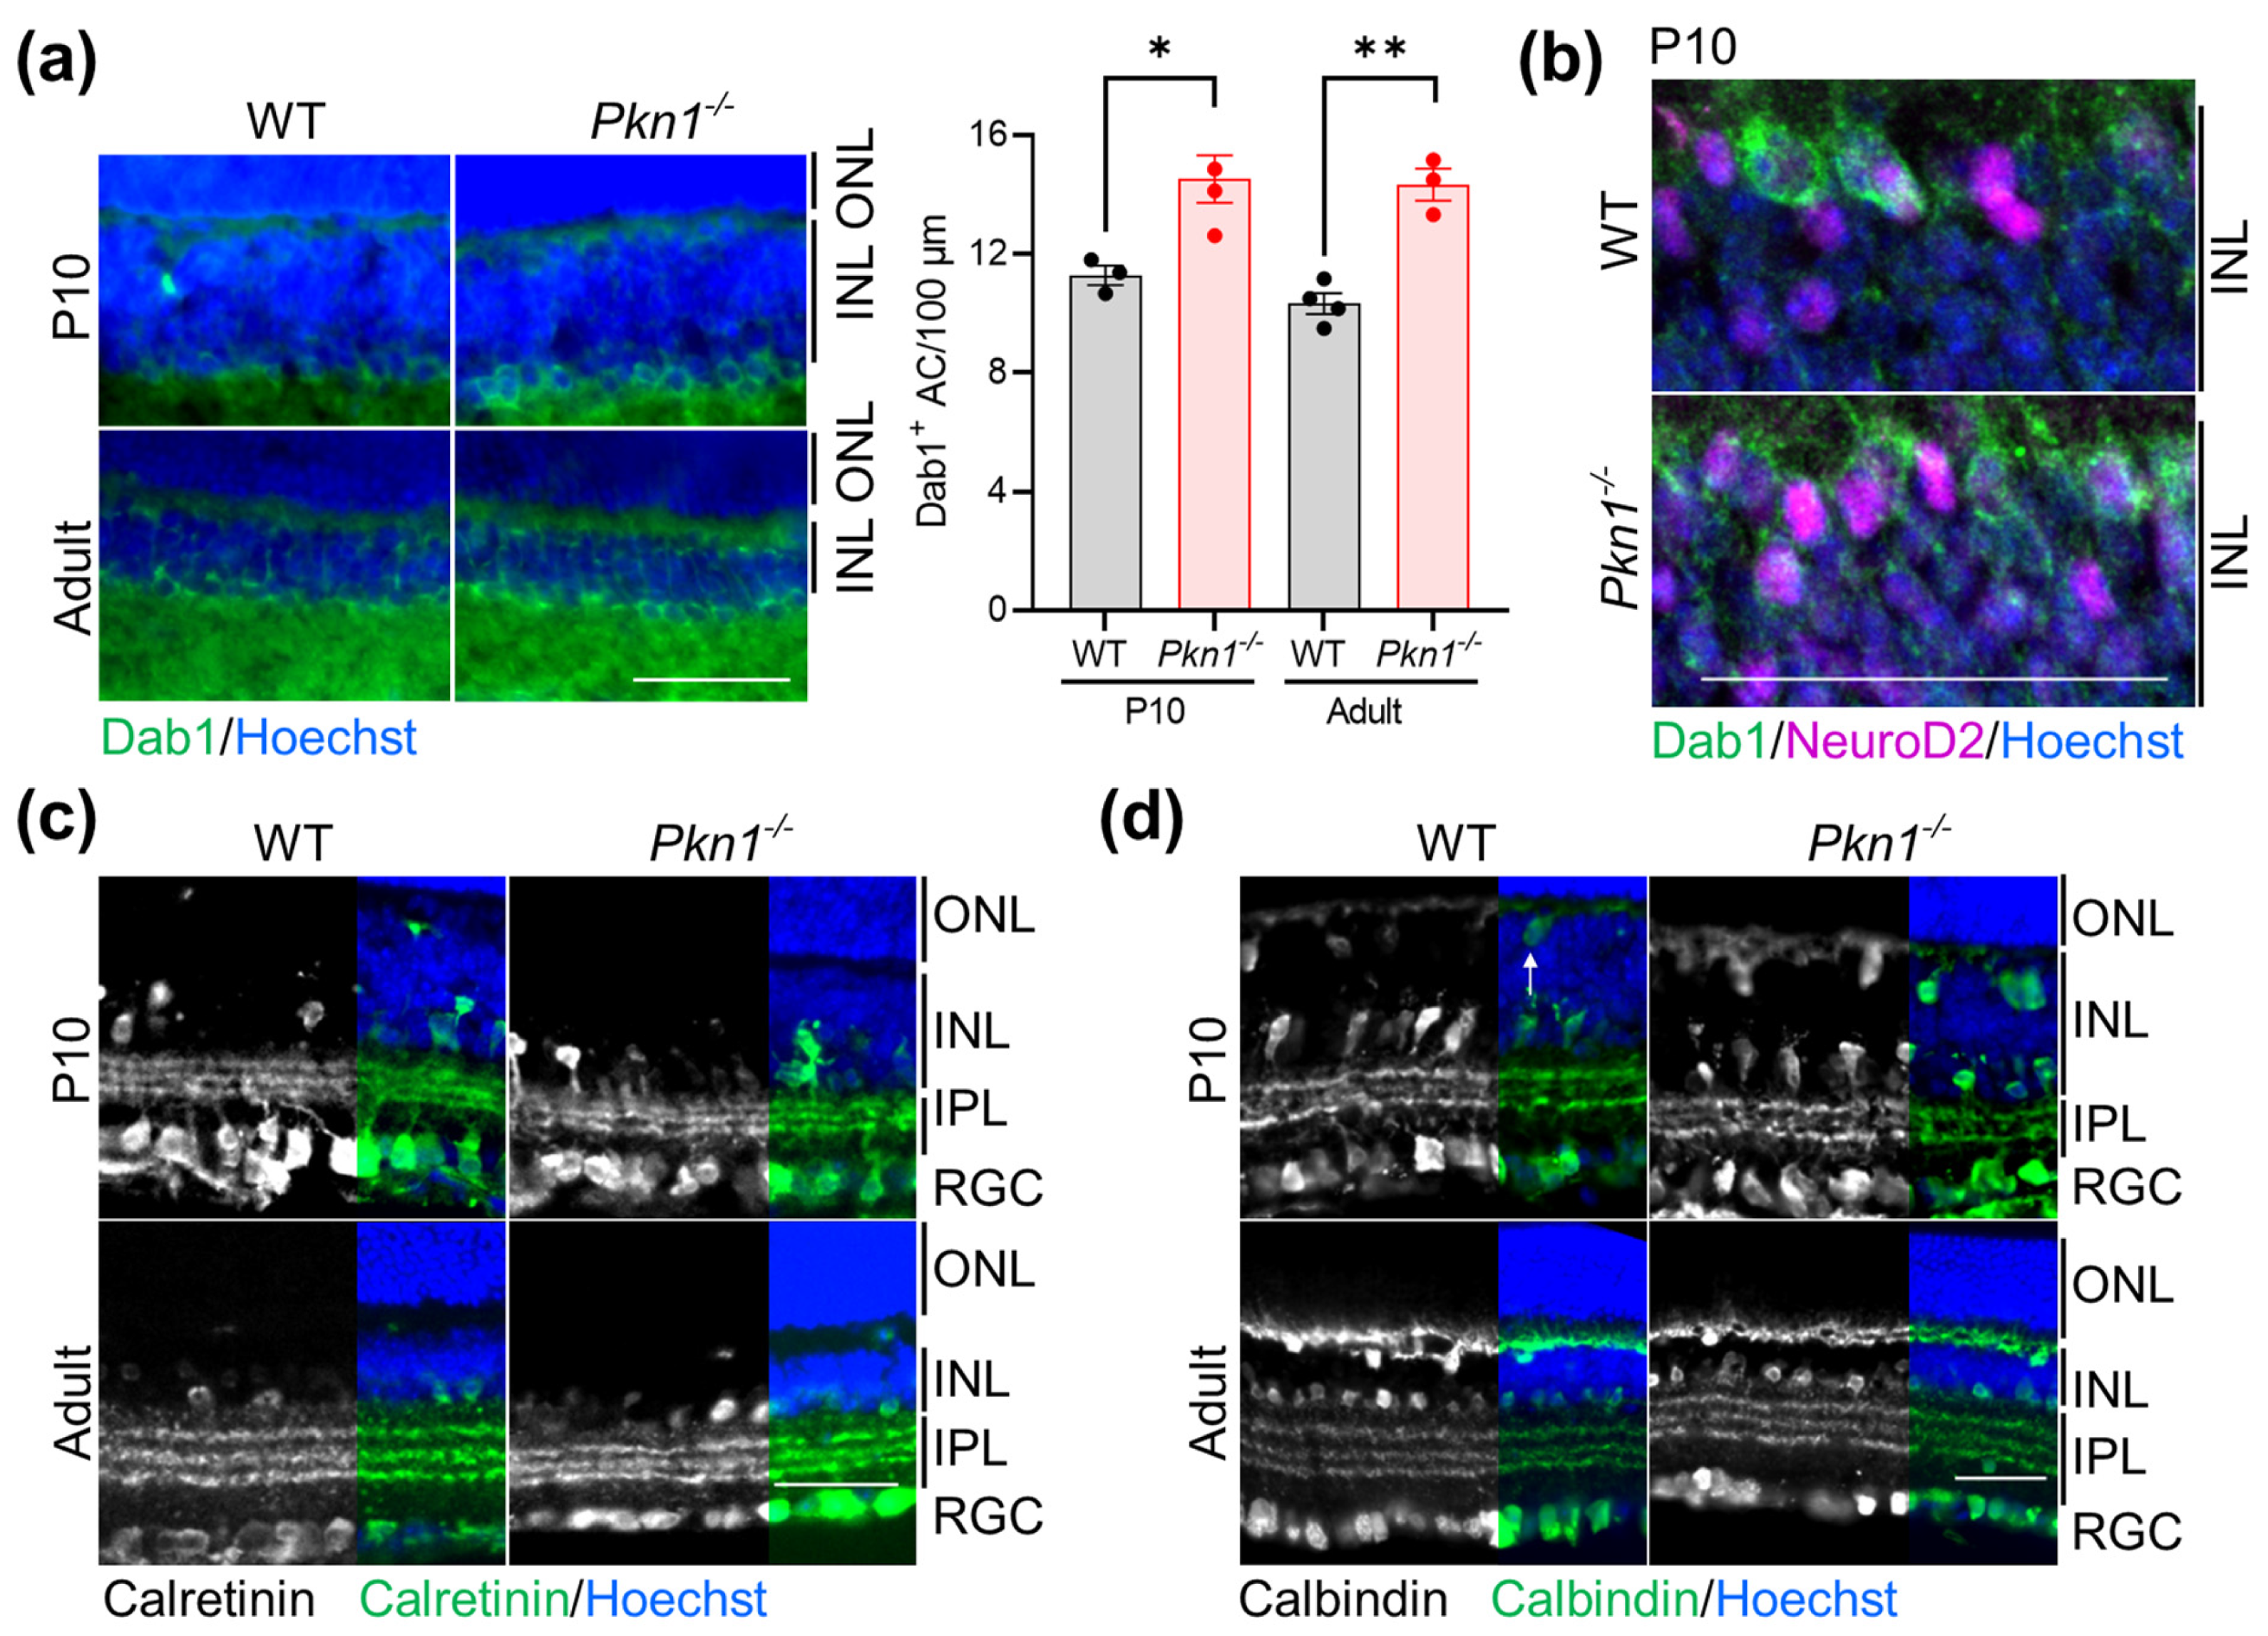
2.2. The Effect of Pkn1 Knockout on Cells in the Inner Nuclear Layer
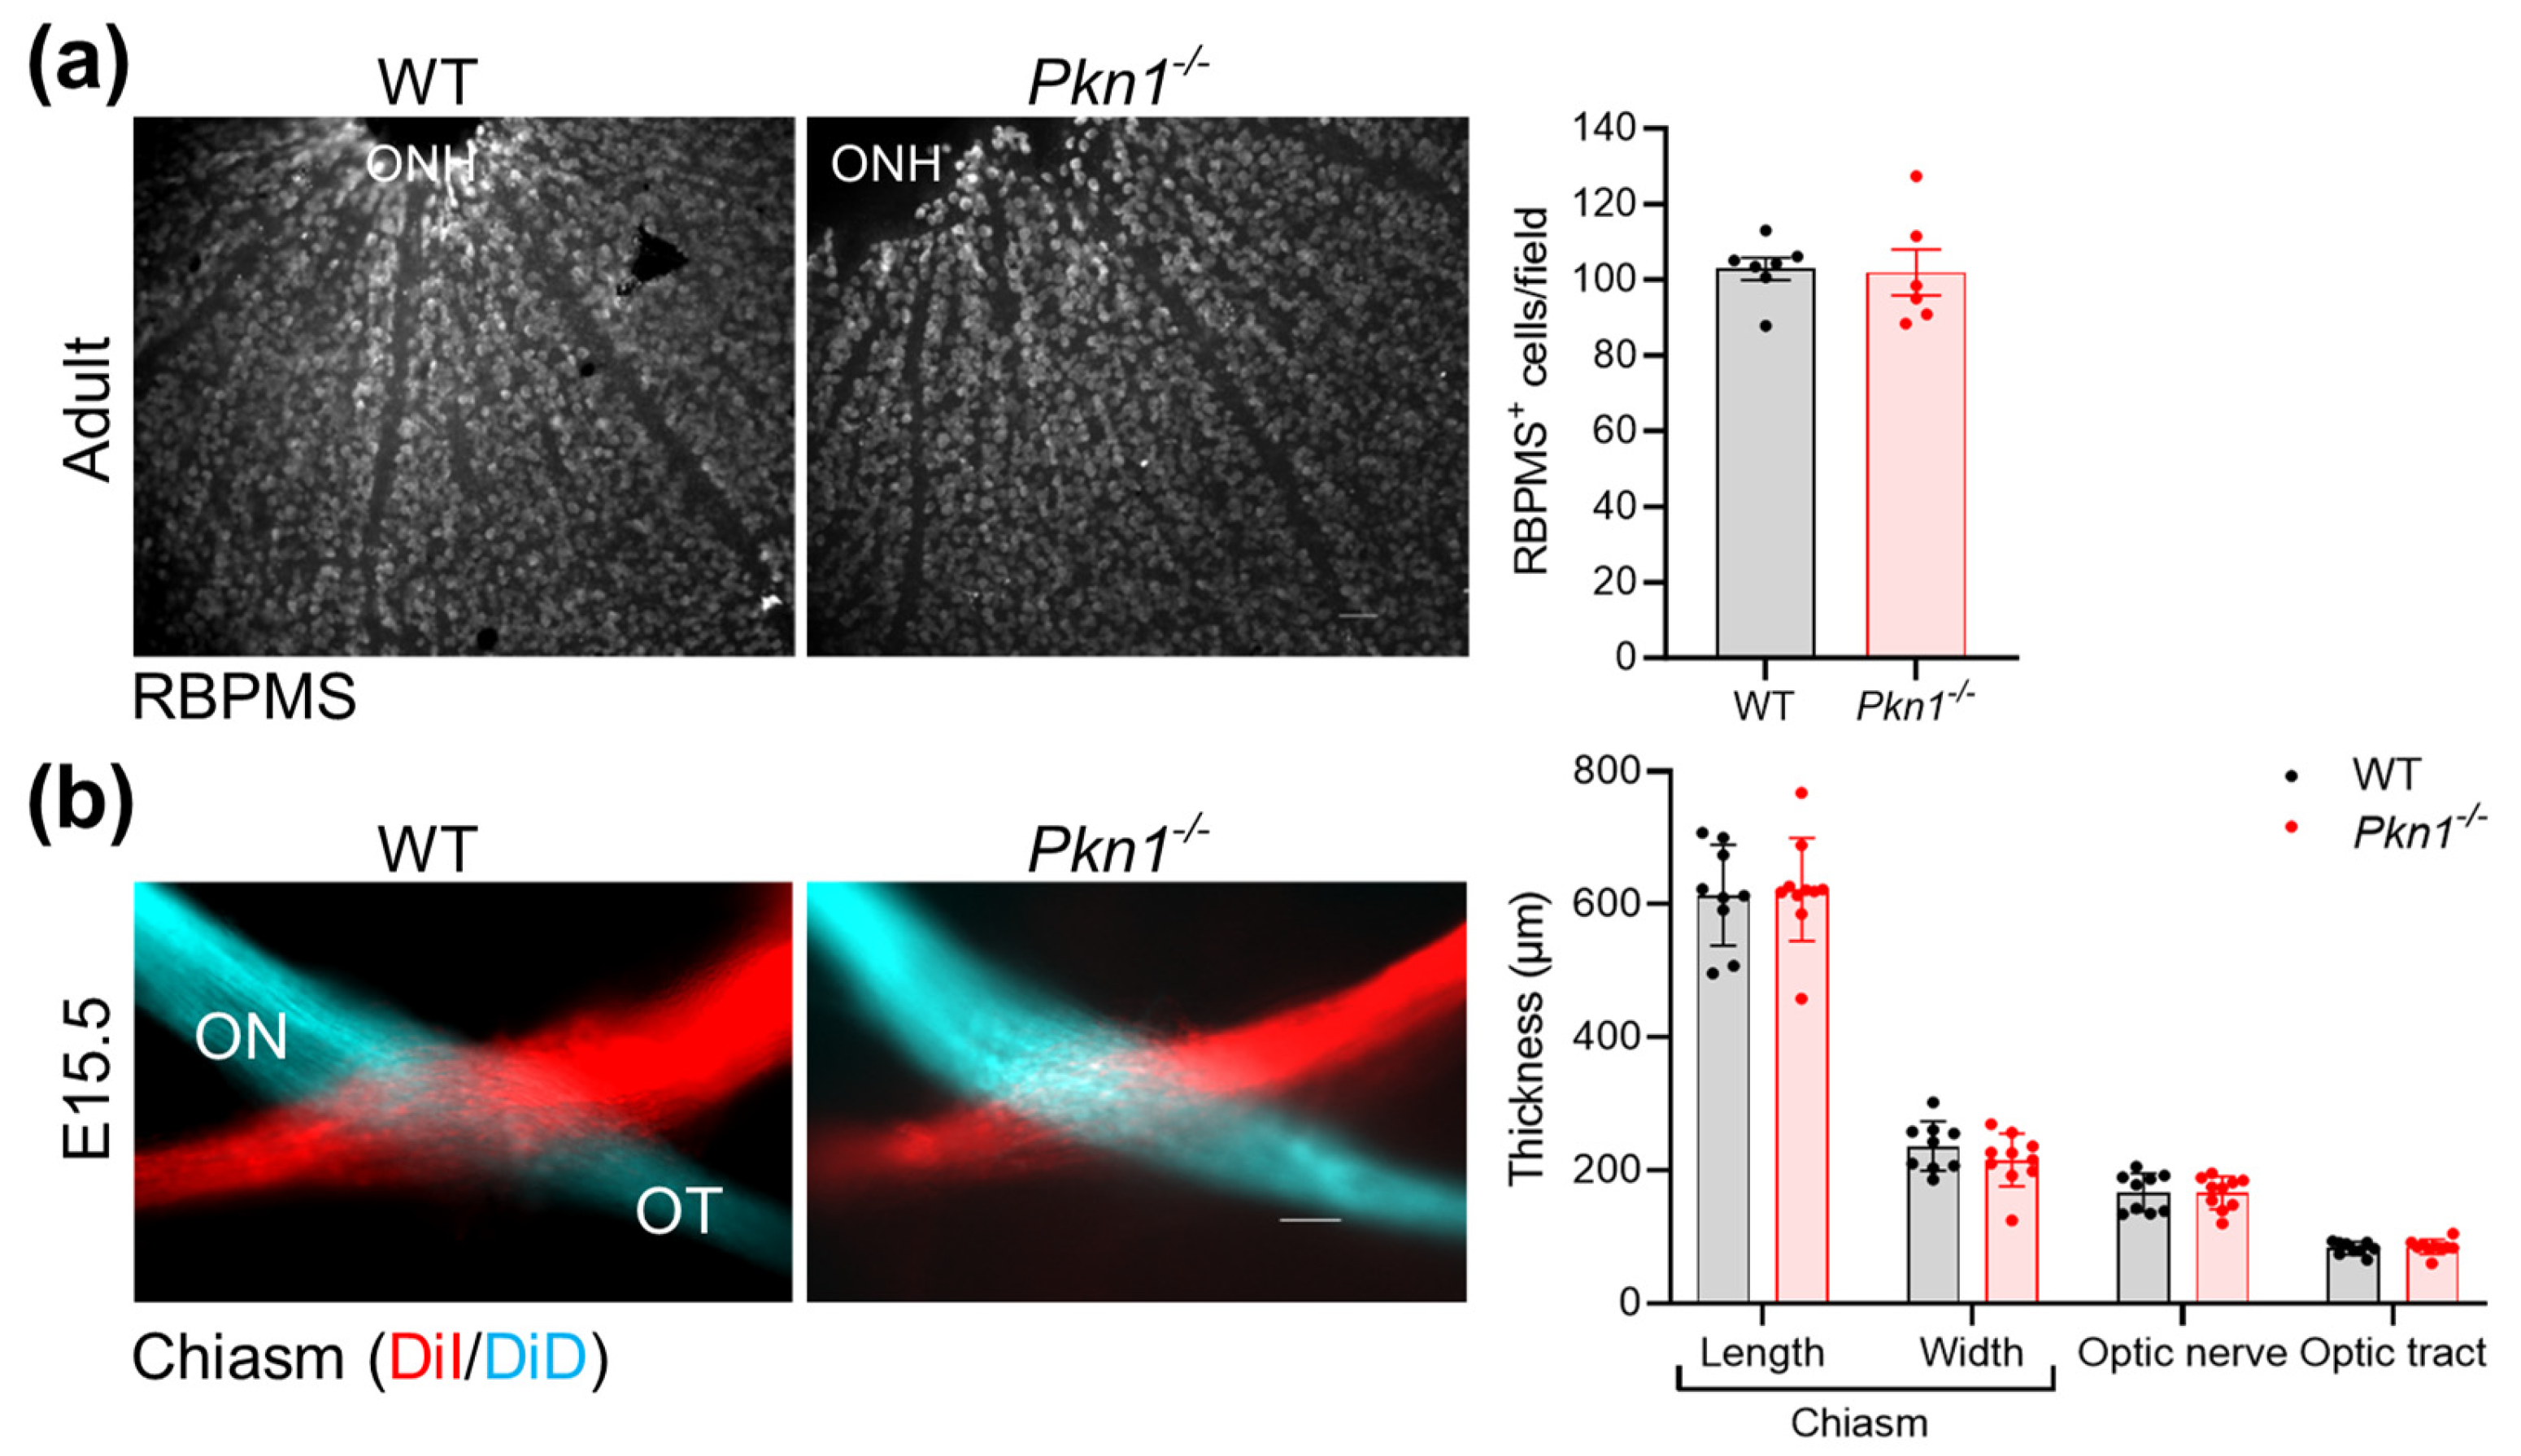
2.3. Effect of Pkn1 Knockout on RGC and Chiasm Formation

| Marker | Layer | WT Mean ± S.E.M., (n) | Pkn1−/− Mean ± S.E.M., (n) | p-Value |
|---|---|---|---|---|
| P10 | ||||
| Calretinin+ cells/300 µm | RGC | 14.4 ± 1.7 (4) | 17.3 ± 1.3 (7) | >0.05 |
| Calbindin+ cells/300 µm | RGC | 23.1 ± 1.2 (3) | 23.9 ± 0.9 (5) | >0.05 |
| Adult | ||||
| Calretinin+ cells/300 µm | RGC | 16.9 ± 0.9 (3) | 19.9 ± 1.4 (3) | >0.05 |
| NeuN+ cells/100 µm | RGC | 17.4 ± 0.7 (3) | 17.9 ± 1.7 (3) | >0.05 |
| SMI-31+ cells/300 µm | RGC | 33.5 ± 1.9 (6) | 29.4 ± 2.0 (5) | >0.05 |
| Calbindin+ cells/100 µm | RGC | 6.4 ± 0.5 (5) | 5.9 ± 0.7 (4) | >0.05 |
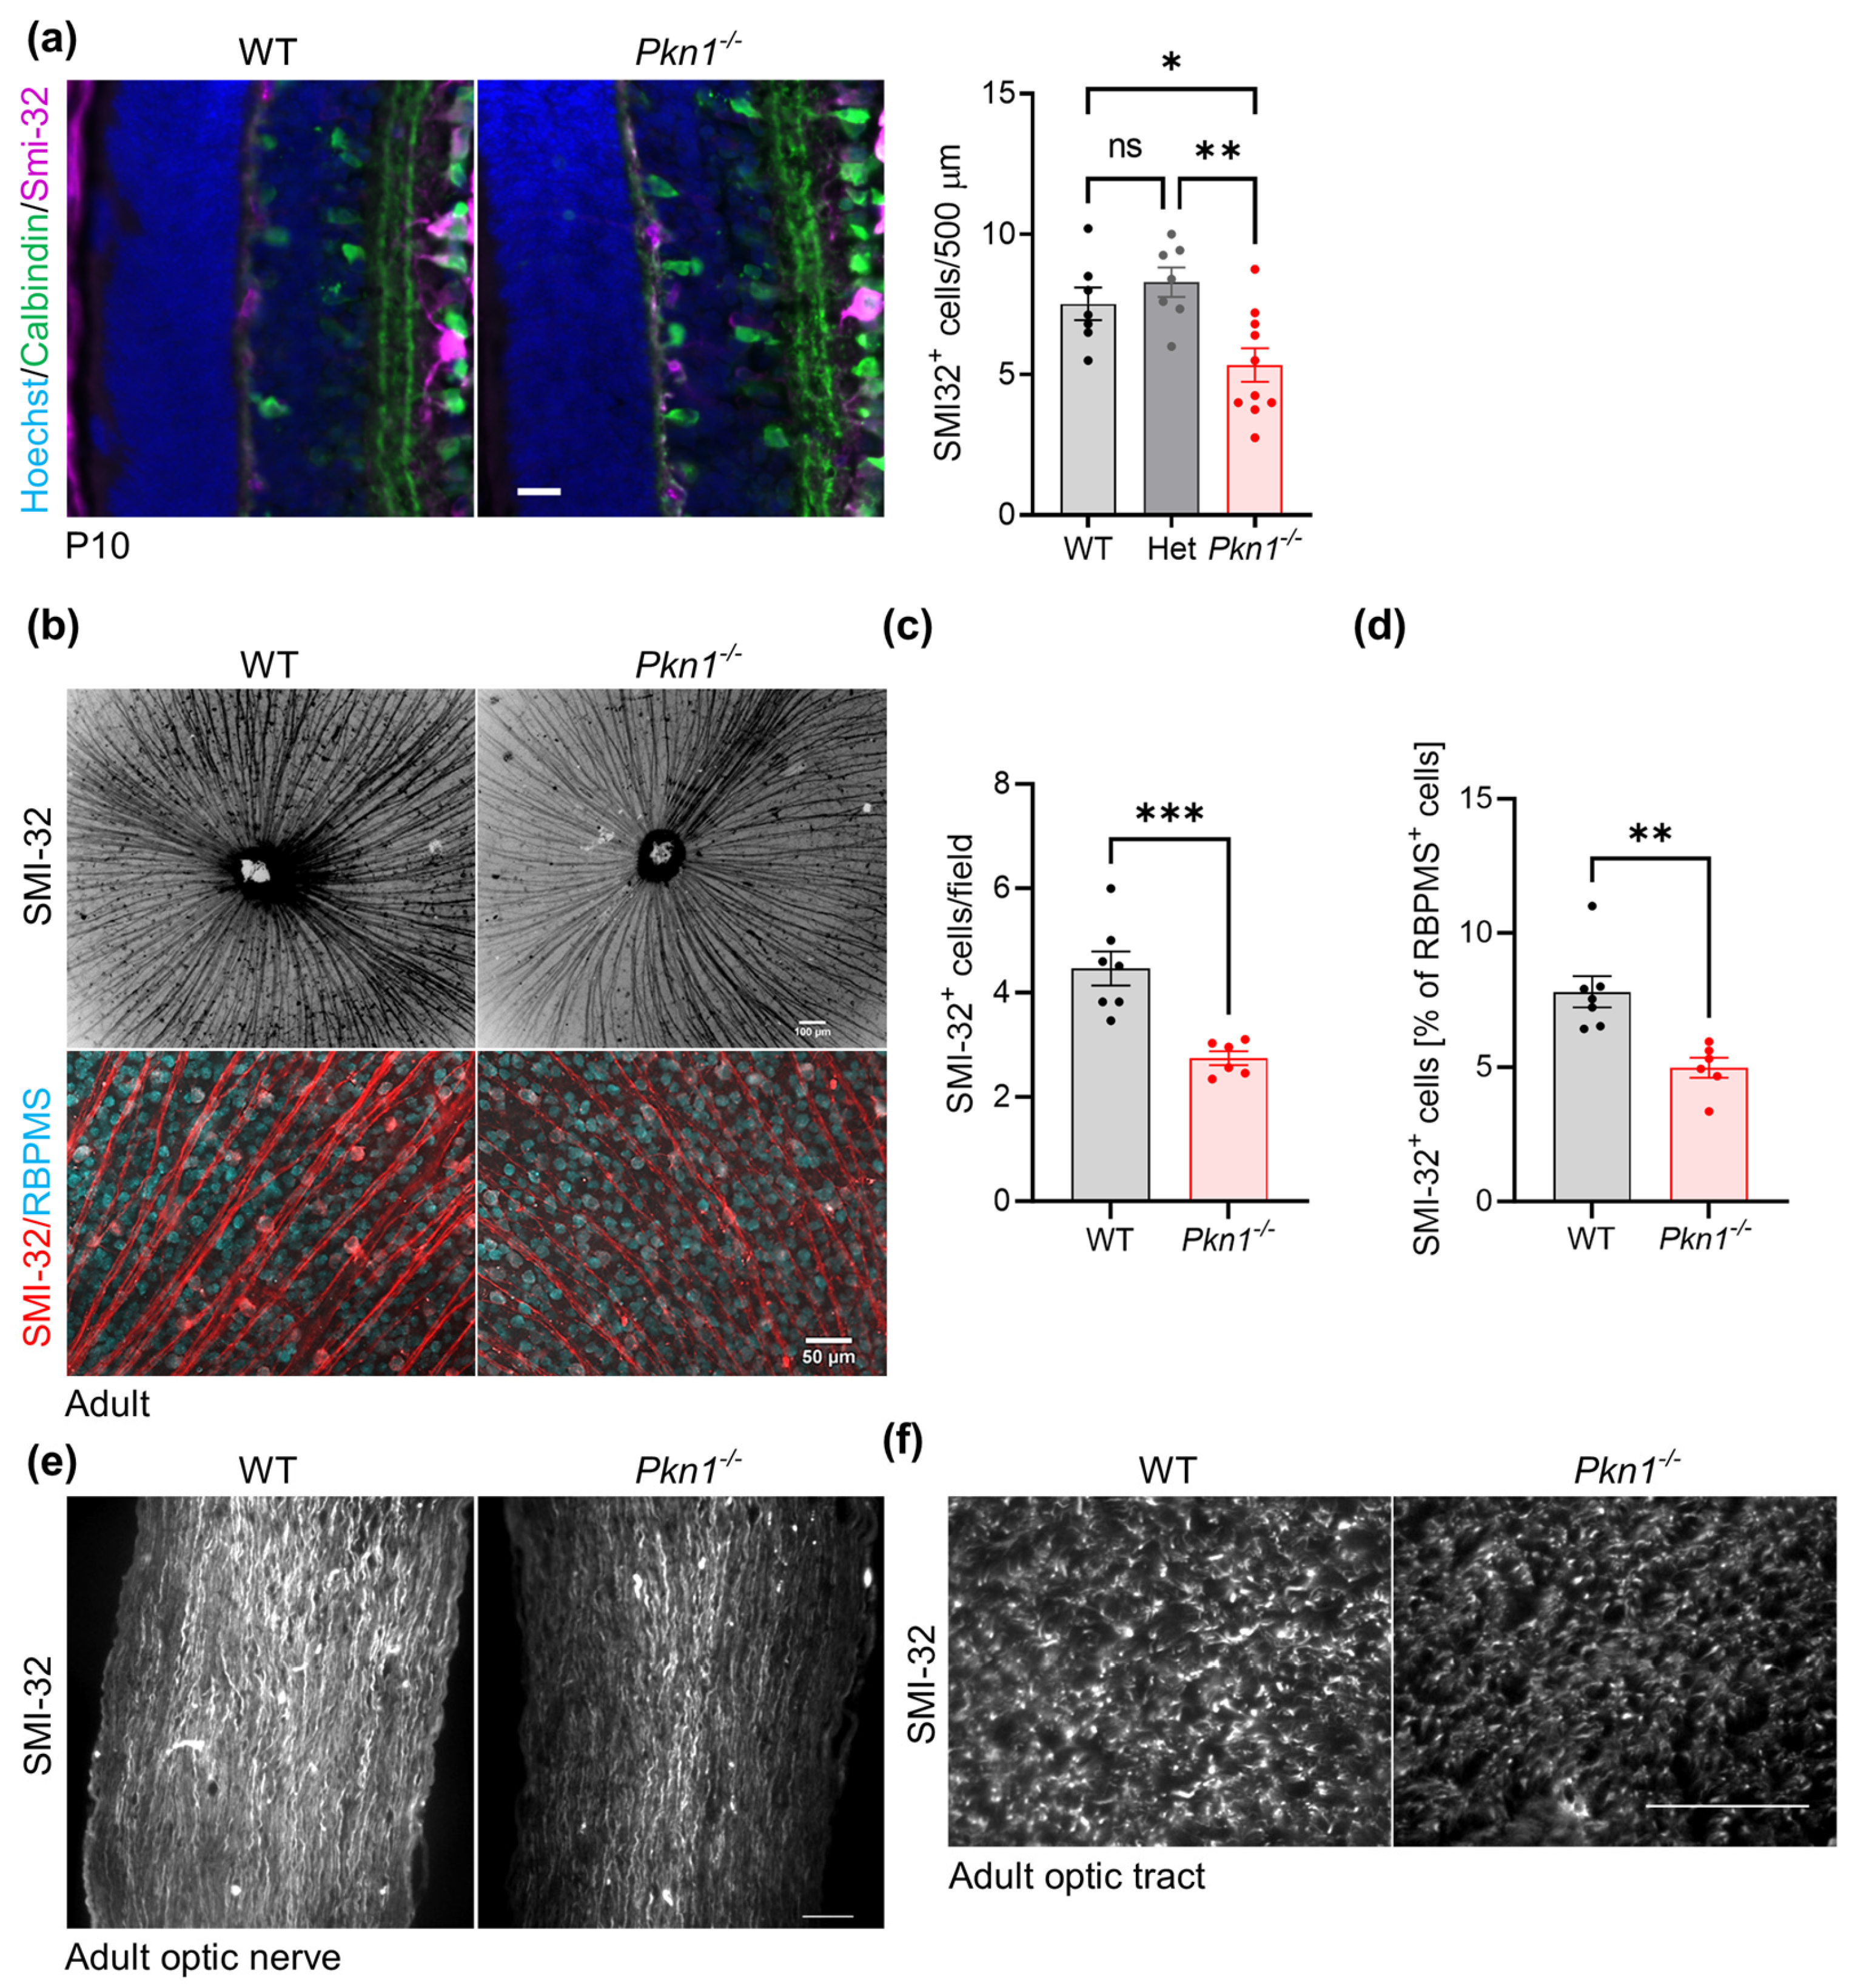
| SMI-32+ cells/100 µm | RGC | 4.5 ± 0.6 (4) | 2.1 ± 0.5 (4) | <0.05 (*) |
2.4. Effect of Pkn1 Knockout on α-RGC
3. Discussion
4. Materials and Methods
4.1. Animals
4.2. Retinal Flat Mount Staining and Analysis
4.3. Cryosectioning
4.4. Immunofluorescence Staining of Cryosections
4.5. Isolation and Paraffin Sectioning of Optic Nerve
4.6. Western Blotting
4.7. In Situ RNA Hybridization
4.8. DiI/DiD Tracing
4.9. Statistical Analysis
Supplementary Materials
Author Contributions
Funding
Institutional Review Board Statement
Data Availability Statement
Acknowledgments
Conflicts of Interest
References
- Reese, B.E. Development of the retina and optic pathway. Vision. Res. 2011, 51, 613–632. [Google Scholar] [CrossRef] [PubMed]
- Peng, Y.-R. Cell-type specification in the retina: Recent discoveries from transcriptomic approaches. Curr. Opin. Neurobiol. 2023, 81, 102752. [Google Scholar] [CrossRef]
- Yan, W.; Laboulaye, M.A.; Tran, N.M.; Whitney, I.E.; Benhar, I.; Sanes, J.R. Mouse Retinal Cell Atlas: Molecular Identification of over Sixty Amacrine Cell Types. J. Neurosci. 2020, 40, 5177–5195. [Google Scholar] [CrossRef] [PubMed]
- Laboissonniere, L.A.; Goetz, J.J.; Martin, G.M.; Bi, R.; Lund, T.J.S.; Ellson, L.; Lynch, M.R.; Mooney, B.; Wickham, H.; Liu, P.; et al. Molecular signatures of retinal ganglion cells revealed through single cell profiling. Sci. Rep. 2019, 9, 15778. [Google Scholar] [CrossRef] [PubMed]
- Goetz, J.; Jessen, Z.F.; Jacobi, A.; Mani, A.; Cooler, S.; Greer, D.; Kadri, S.; Segal, J.; Shekhar, K.; Sanes, J.R.; et al. Unified classification of mouse retinal ganglion cells using function, morphology, and gene expression. Cell Rep. 2022, 40, 111040. [Google Scholar] [CrossRef]
- Zur Nedden, S.; Eith, R.; Schwarzer, C.; Zanetti, L.; Seitter, H.; Fresser, F.; Koschak, A.; Cameron, A.J.M.; Parker, P.J.; Baier, G.; et al. Protein kinase N1 critically regulates cerebellar development and long-term function. J. Clin. Investig. 2018, 128, 2076–2088. [Google Scholar] [CrossRef] [PubMed]
- Safari, M.S.; Obexer, D.; Baier-Bitterlich, G.; Zur Nedden, S. PKN1 Is a Novel Regulator of Hippocampal GluA1 Levels. Front. Synaptic Neurosci. 2021, 13, 640495. [Google Scholar] [CrossRef] [PubMed]
- Cherry, T.J.; Wang, S.; Bormuth, I.; Schwab, M.; Olson, J.; Cepko, C.L. NeuroD Factors Regulate Cell Fate and Neurite Stratification in the Developing Retina. J. Neurosci. 2011, 31, 7365–7379. [Google Scholar] [CrossRef]
- Xu, D.; Zhong, L.-T.; Cheng, H.-Y.; Wang, Z.-Q.; Chen, X.-M.; Feng, A.-Y.; Chen, W.-Y.; Chen, G.; Xu, Y. Overexpressing NeuroD1 reprograms Müller cells into various types of retinal neurons. Neural Regen. Res. 2023, 18, 1124–1131. [Google Scholar] [PubMed]
- Kay, J.N.; Voinescu, P.E.; Chu, M.W.; Sanes, J.R. Neurod6 expression defines new retinal amacrine cell subtypes and regulates their fate. Nat. Neurosci. 2011, 14, 965–972. [Google Scholar] [CrossRef] [PubMed]
- Rheaume, B.A.; Jereen, A.; Bolisetty, M.; Sajid, M.S.; Yang, Y.; Renna, K.; Sun, L.; Robson, P.; Trakhtenberg, E.F. Single cell transcriptome profiling of retinal ganglion cells identifies cellular subtypes. Nat. Commun. 2018, 9, 2759. [Google Scholar] [CrossRef] [PubMed]
- Bayam, E.; Sahin, G.S.; Guzelsoy, G.; Guner, G.; Kabakcioglu, A.; Ince-Dunn, G. Genome-wide target analysis of NEUROD2 provides new insights into regulation of cortical projection neuron migration and differentiation. BMC Genom. 2015, 16, 681. [Google Scholar] [CrossRef] [PubMed]
- Erskine, L.; Herrera, E. Connecting the retina to the brain. ASN Neuro 2014, 6, 1759091414562107. [Google Scholar] [CrossRef]
- Sumioka, K.; Shirai, Y.; Sakai, N.; Hashimoto, T.; Tanaka, C.; Yamamoto, M.; Takahashi, M.; Ono, Y.; Saito, N. Induction of a 55-kDa PKN cleavage product by ischemia/reperfusion model in the rat retina. Investig. Ophthalmol. Vis. Sci. 2000, 41, 29–35. [Google Scholar]
- Young, R.W. Cell differentiation in the retina of the mouse. Anat. Rec. 1985, 212, 199–205. [Google Scholar] [CrossRef] [PubMed]
- Lin, Y.S.; Kuo, K.T.; Chen, S.K.; Huang, H.S. RBFOX3/NeuN is dispensable for visual function. PLoS ONE 2018, 13, e0192355. [Google Scholar] [CrossRef] [PubMed]
- Krieger, B.; Qiao, M.; Rousso, D.L.; Sanes, J.R.; Meister, M. Four alpha ganglion cell types in mouse retina: Function, structure, and molecular signatures. PLoS ONE 2017, 12, e0180091. [Google Scholar] [CrossRef] [PubMed]
- Gallego-Ortega, A.; Norte-Muñoz, M.; Di Pierdomenico, J.; Avilés-Trigueros, M.; de la Villa, P.; Valiente-Soriano, F.J.; Vidal-Sanz, M. Alpha retinal ganglion cells in pigmented mice retina: Number and distribution. Front. Neuroanat. 2022, 16, 1054849. [Google Scholar] [CrossRef] [PubMed]
- Duan, X.; Qiao, M.; Bei, F.; Kim, I.J.; He, Z.; Sanes, J.R. Subtype-specific regeneration of retinal ganglion cells following axotomy: Effects of osteopontin and mTOR signaling. Neuron 2015, 85, 1244–1256. [Google Scholar] [CrossRef]
- Norsworthy, M.W.; Bei, F.; Kawaguchi, R.; Wang, Q.; Tran, N.M.; Li, Y.; Brommer, B.; Zhang, Y.; Wang, C.; Sanes, J.R.; et al. Sox11 Expression Promotes Regeneration of Some Retinal Ganglion Cell Types but Kills Others. Neuron 2017, 94, 1112–1120.e1114. [Google Scholar] [CrossRef]
- Jiang, Y.; Ding, Q.; Xie, X.; Libby, R.T.; Lefebvre, V.; Gan, L. Transcription Factors SOX4 and SOX11 Function Redundantly to Regulate the Development of Mouse Retinal Ganglion Cells*. J. Biol. Chem. 2013, 288, 18429–18438. [Google Scholar] [CrossRef]
- Chang, K.-C.; Bian, M.; Xia, X.; Madaan, A.; Sun, C.; Wang, Q.; Li, L.; Nahmou, M.; Noro, T.; Yokota, S.; et al. Posttranslational Modification of Sox11 Regulates RGC Survival and Axon Regeneration. eNeuro 2021, 8, ENEURO.0358-0320.2020. [Google Scholar] [CrossRef]
- Zur Nedden, S.; Safari, M.S.; Fresser, F.; Faserl, K.; Lindner, H.; Sarg, B.; Baier, G.; Baier-Bitterlich, G. PKN1 Exerts Neurodegenerative Effects in an In Vitro Model of Cerebellar Hypoxic-Ischemic Encephalopathy via Inhibition of AKT/GSK3β Signaling. Biomolecules 2023, 13, 1599. [Google Scholar] [CrossRef]
- Yasui, T.; Sakakibara-Yada, K.; Nishimura, T.; Morita, K.; Tada, S.; Mosialos, G.; Kieff, E.; Kikutani, H. Protein kinase N1, a cell inhibitor of Akt kinase, has a central role in quality control of germinal center formation. Proc. Natl. Acad. Sci. USA 2012, 109, 21022–21027. [Google Scholar] [CrossRef]
- Ravanpay, A.C.; Hansen, S.J.; Olson, J.M. Transcriptional inhibition of REST by NeuroD2 during neuronal differentiation. Mol. Cell. Neurosci. 2010, 44, 178–189. [Google Scholar] [CrossRef] [PubMed]
- Quetier, I.; Marshall, J.J.; Spencer-Dene, B.; Lachmann, S.; Casamassima, A.; Franco, C.; Escuin, S.; Worrall, J.T.; Baskaran, P.; Rajeeve, V.; et al. Knockout of the PKN Family of Rho Effector Kinases Reveals a Non-redundant Role for PKN2 in Developmental Mesoderm Expansion. Cell Rep. 2016, 14, 440–448. [Google Scholar] [CrossRef] [PubMed]
- Mattapallil, M.J.; Wawrousek, E.F.; Chan, C.-C.; Zhao, H.; Roychoudhury, J.; Ferguson, T.A.; Caspi, R.R. The Rd8 Mutation of the Crb1 Gene Is Present in Vendor Lines of C57BL/6N Mice and Embryonic Stem Cells, and Confounds Ocular Induced Mutant Phenotypes. Investig. Ophthalmol. Vis. Sci. 2012, 53, 2921–2927. [Google Scholar] [CrossRef]
- Moore, B.A.; Roux, M.J.; Sebbag, L.; Cooper, A.; Edwards, S.G.; Leonard, B.C.; Imai, D.M.; Griffey, S.; Bower, L.; Clary, D.; et al. A Population Study of Common Ocular Abnormalities in C57BL/6N rd8 Mice. Investig. Ophthalmol. Vis. Sci. 2018, 59, 2252–2261. [Google Scholar] [CrossRef] [PubMed]
- Mehalow, A.K.; Kameya, S.; Smith, R.S.; Hawes, N.L.; Denegre, J.M.; Young, J.A.; Bechtold, L.; Haider, N.B.; Tepass, U.; Heckenlively, J.R.; et al. CRB1 is essential for external limiting membrane integrity and photoreceptor morphogenesis in the mammalian retina. Hum. Mol. Genet. 2003, 12, 2179–2189. [Google Scholar] [CrossRef] [PubMed]

| Marker | Layer | WT Mean ± S.E.M., (n) | Pkn1−/− Mean ± S.E.M., (n) | p-Value |
|---|---|---|---|---|
| P10 | ||||
| Dab1+ cells/100 µm | Lower INL | 11.3 ± 0.3 (3) | 14.5 ± 0.8 (4) | <0.05 (*) |
| Calbindin+ cells/300 µm | HC | 7.1 ± 1.0 (3) | 7.9 ± 0.3 (5) | >0.05 |
| Chx-10 | BP | 25 ± 1.4 (3) | 28 ± 2.1 (3) | >0.05 |
| Adult | ||||
| Dab1+ cells/100 µm | Lower INL | 10.3 ± 0.3 (4) | 14.3 ± 0.5 (3) | <0.01 (**) |
| Calbindin+ cells/300 µm | HC | 5.5 ± 0.6 (5) | 4.3 ± 0.5 (4) | >0.05 |
| Chx10 | BP | 19.1 ± 3.2 (2) | 14.4 ± 1.8 (2) | >0.05 |
| NeuN+/100 µm | Lower INL | 21.5 ± 4.9 (3) | 18.9 ± 1.4 (3) | >0.05 |
| NeuN+/100 µm | HC | 2.8 ± 0.4 (3) | 2.9 ± 0.8 (3) | >0.05 |
| Antibody (Clone) | Company (Catalogue Number) | Application | Dilution |
|---|---|---|---|
| Calbindin (D1l4Q) | Abcam (ab11426) (Cambridge, UK) | IF | 1:1000 |
| Calretinin | Synaptic Systems (21411) (Göttingen, Germany) | IF | 1:200 |
| Chx10 | Santa Cruz (sc-374151) (Santa Cruz, CA, USA) | IF | 1:100 |
| Dab1 | Merck Millipore (AB5840-I) (Burlington, MA, USA) | IF | 1:250 |
| GAPDH (D16H11) | Cell Signaling (5174) (Danvers, MA, USA) | W-Blot | 1:1000 |
| NeuroD2 (G-10) | Santa Cruz (sc-365896) (Santa Cruz, CA, USA) | W-Blot | 1:100 |
| IF | 1:50 | ||
| NeuN (D4G40) | Cell Signaling (24307) (Danvers, MA, USA) | IF | 1:50–1:200 |
| PKN1 | BD Transduction Laboratories (610687) (Franklin Lakes, NJ, USA) | W-Blot | 1:1000 |
| RBPMS | Phosphosolutions (1832-RBPMS) (Denver, CO, USA) | IF | 1:500 |
| SMI-31 | BioLegend (801601) (San Diego, CA, USA) | IF | 1:1000 |
| SMI-32 | BioLegend (801701) (San Diego, CA, USA) | IF | 1:1000 |
| Vimentin (EPR3776) | Abcam (ab92547) (Cambridge, UK) | IF | 1:250 |
| Secondary antibodies | |||
| goat-α-mouse IgG | Invitrogen (A11070) (Waltham, MA, USA) | IF | 1:500 |
| goat-α-rabbit IgG | Invitrogen (A21425) (Waltham, MA, USA) | IF | 1:500 |
Disclaimer/Publisher’s Note: The statements, opinions and data contained in all publications are solely those of the individual author(s) and contributor(s) and not of MDPI and/or the editor(s). MDPI and/or the editor(s) disclaim responsibility for any injury to people or property resulting from any ideas, methods, instructions or products referred to in the content. |
© 2024 by the authors. Licensee MDPI, Basel, Switzerland. This article is an open access article distributed under the terms and conditions of the Creative Commons Attribution (CC BY) license (https://creativecommons.org/licenses/by/4.0/).
Share and Cite
Brunner, M.; Lang, L.; Künkel, L.; Weber, D.; Safari, M.S.; Baier-Bitterlich, G.; Zur Nedden, S. Role of PKN1 in Retinal Cell Type Formation. Int. J. Mol. Sci. 2024, 25, 2848. https://doi.org/10.3390/ijms25052848
Brunner M, Lang L, Künkel L, Weber D, Safari MS, Baier-Bitterlich G, Zur Nedden S. Role of PKN1 in Retinal Cell Type Formation. International Journal of Molecular Sciences. 2024; 25(5):2848. https://doi.org/10.3390/ijms25052848
Chicago/Turabian StyleBrunner, Magdalena, Luisa Lang, Louisa Künkel, Dido Weber, Motahareh Solina Safari, Gabriele Baier-Bitterlich, and Stephanie Zur Nedden. 2024. "Role of PKN1 in Retinal Cell Type Formation" International Journal of Molecular Sciences 25, no. 5: 2848. https://doi.org/10.3390/ijms25052848
APA StyleBrunner, M., Lang, L., Künkel, L., Weber, D., Safari, M. S., Baier-Bitterlich, G., & Zur Nedden, S. (2024). Role of PKN1 in Retinal Cell Type Formation. International Journal of Molecular Sciences, 25(5), 2848. https://doi.org/10.3390/ijms25052848