
The Relevance of Reperfusion Stroke Therapy for miR-9-3p and miR-9-5p Expression in Acute Stroke—A Preliminary Study

 , , , and
Abstract
1. Introduction
2. Results
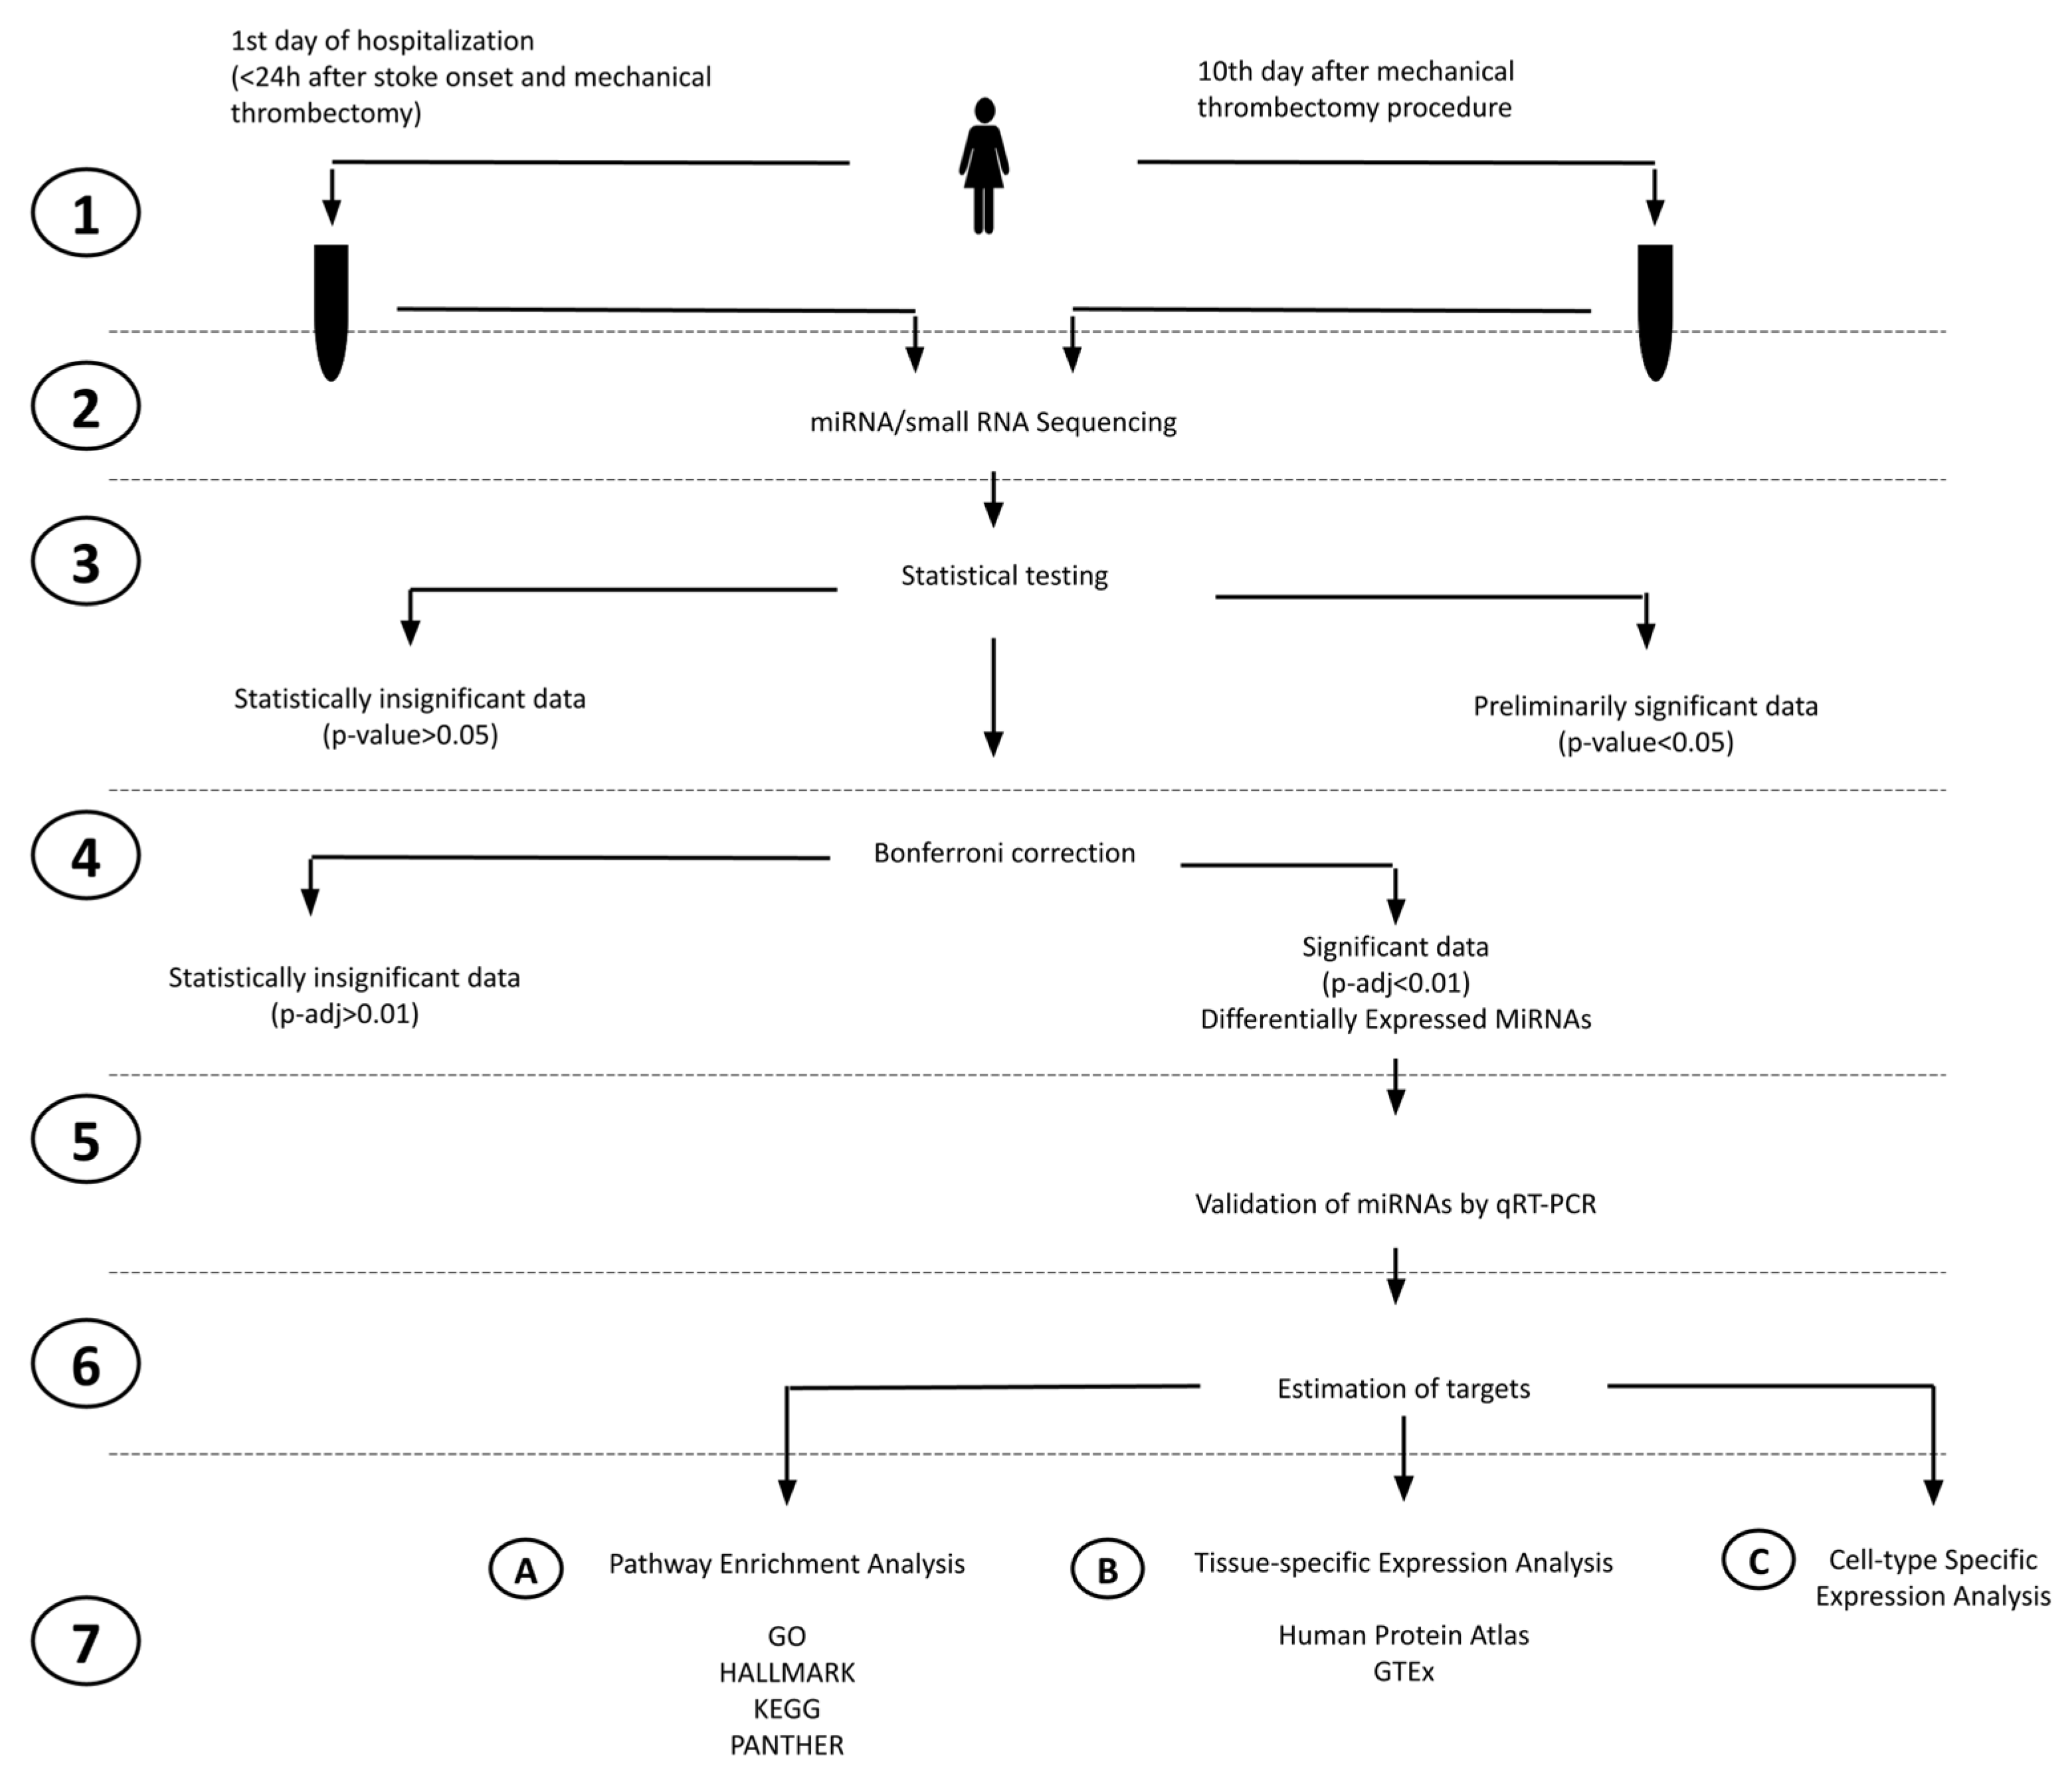
2.1. Study Design
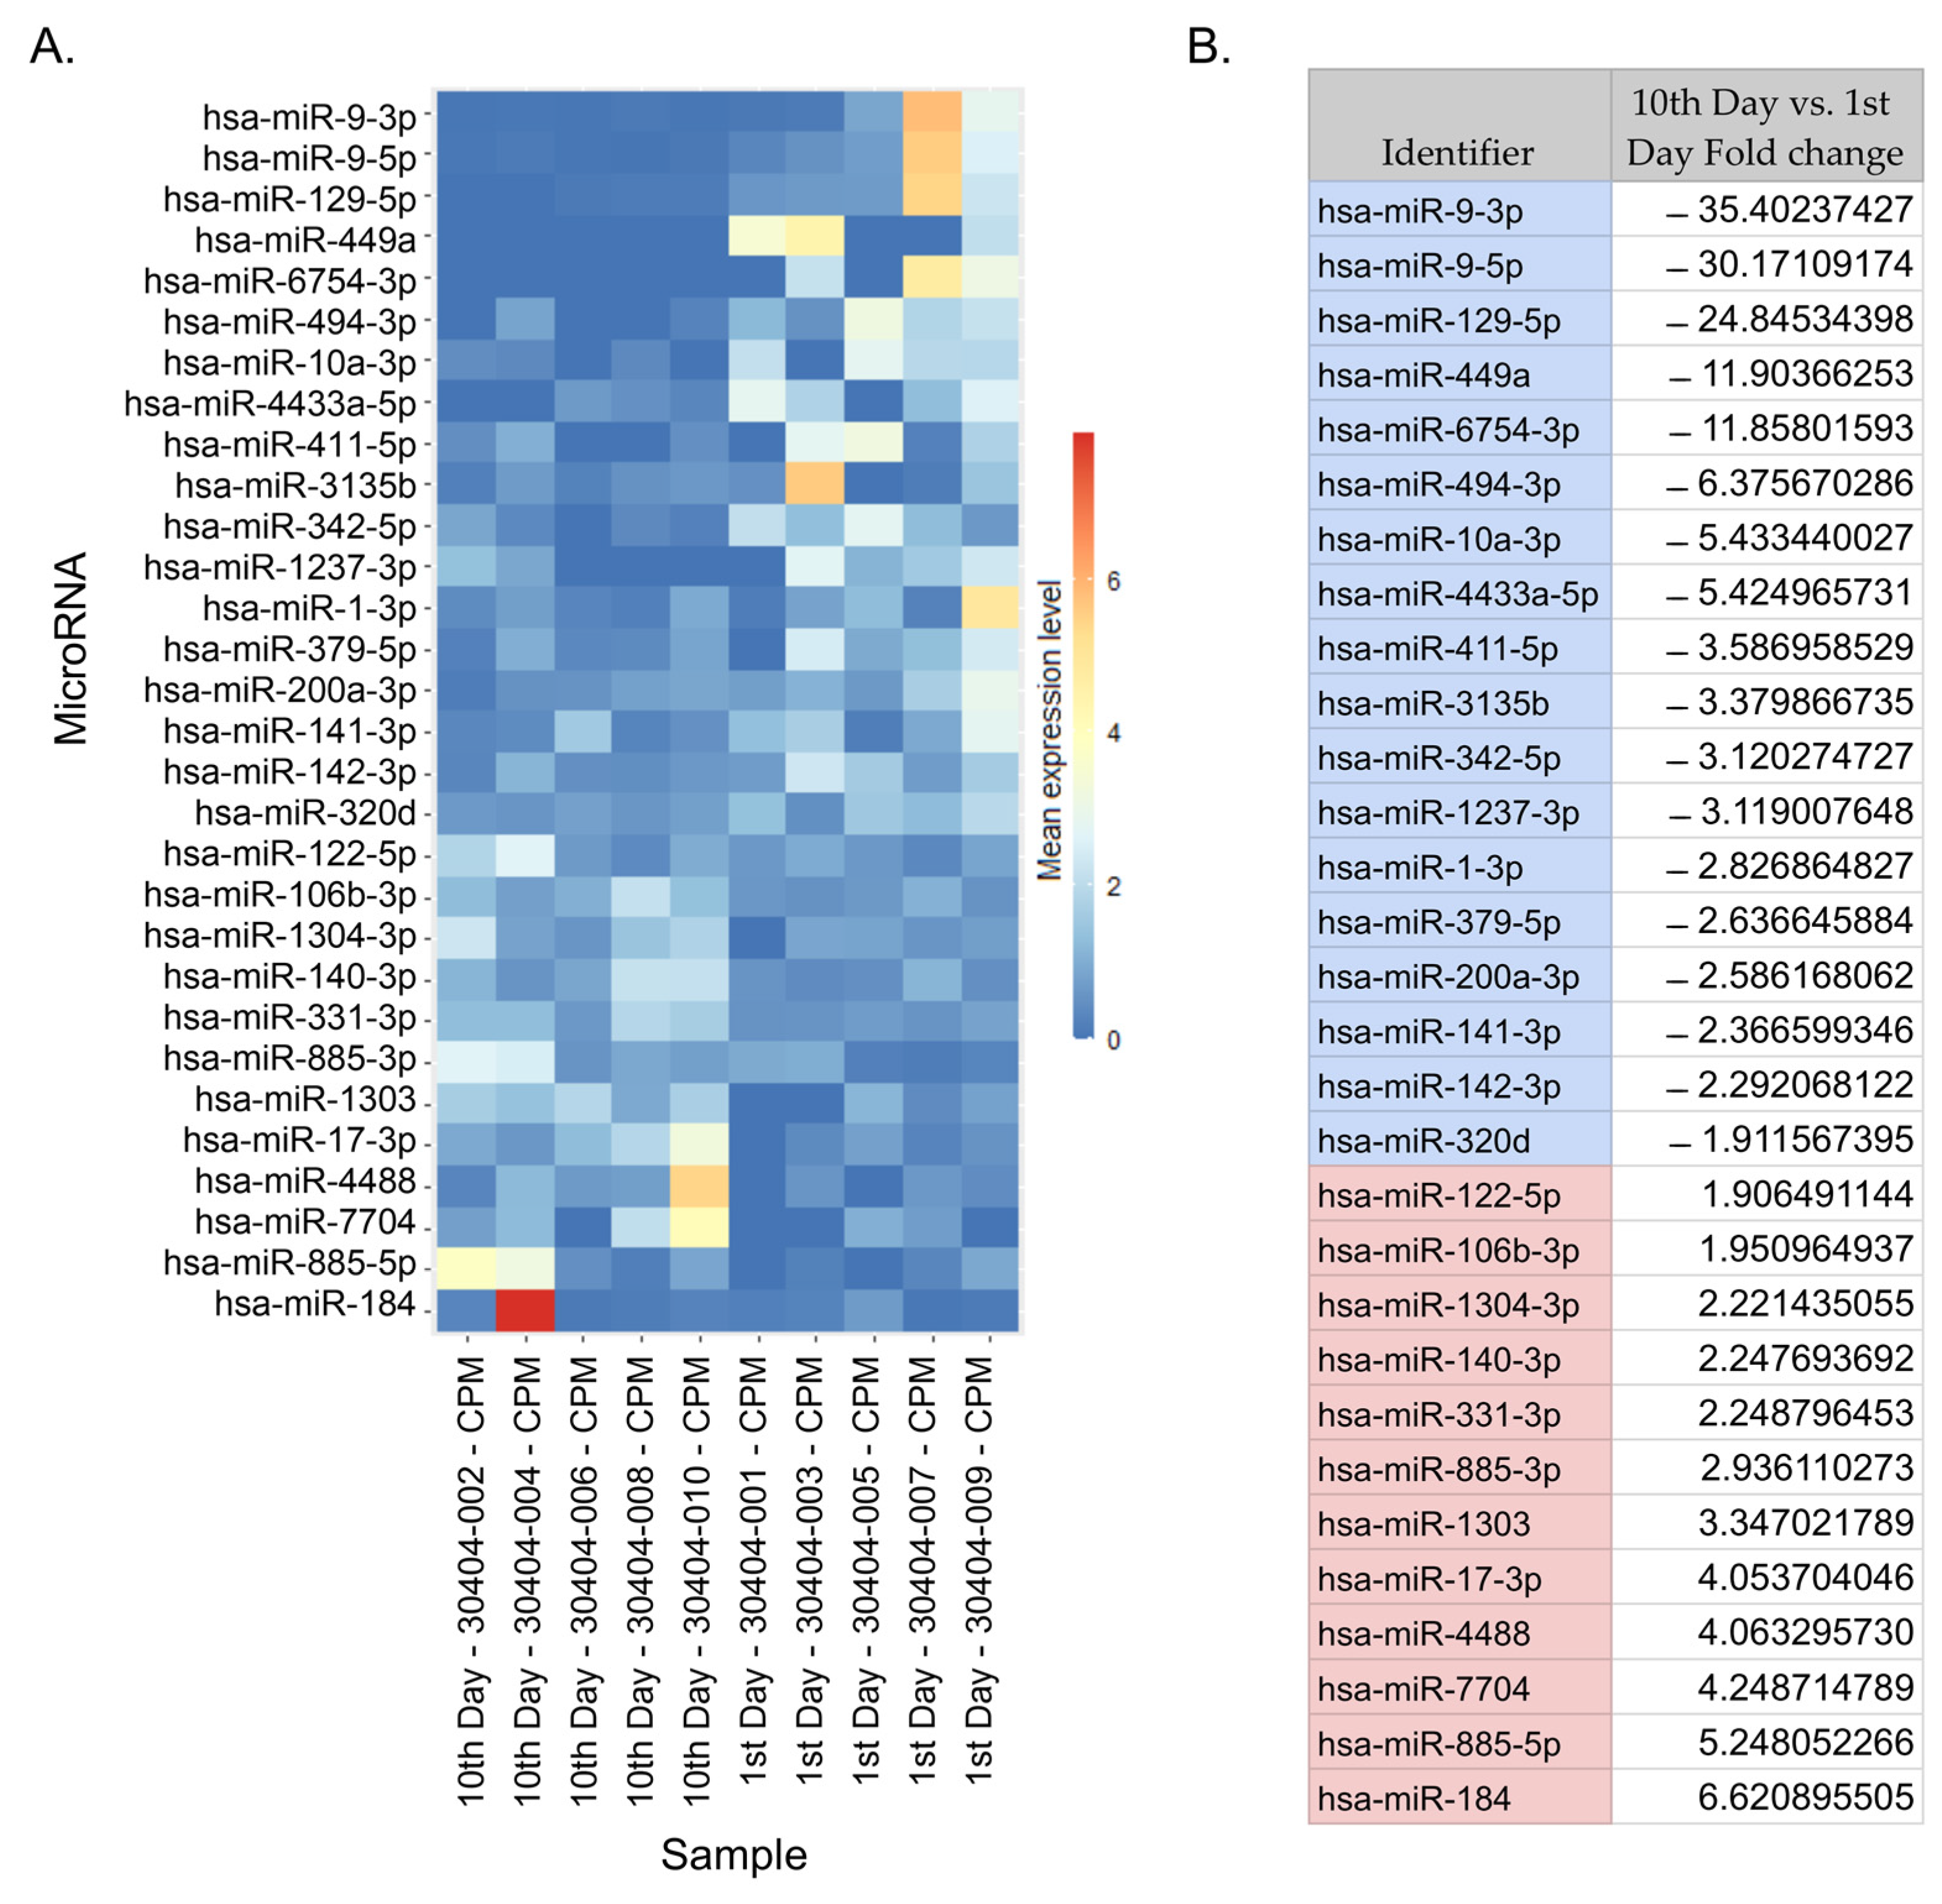
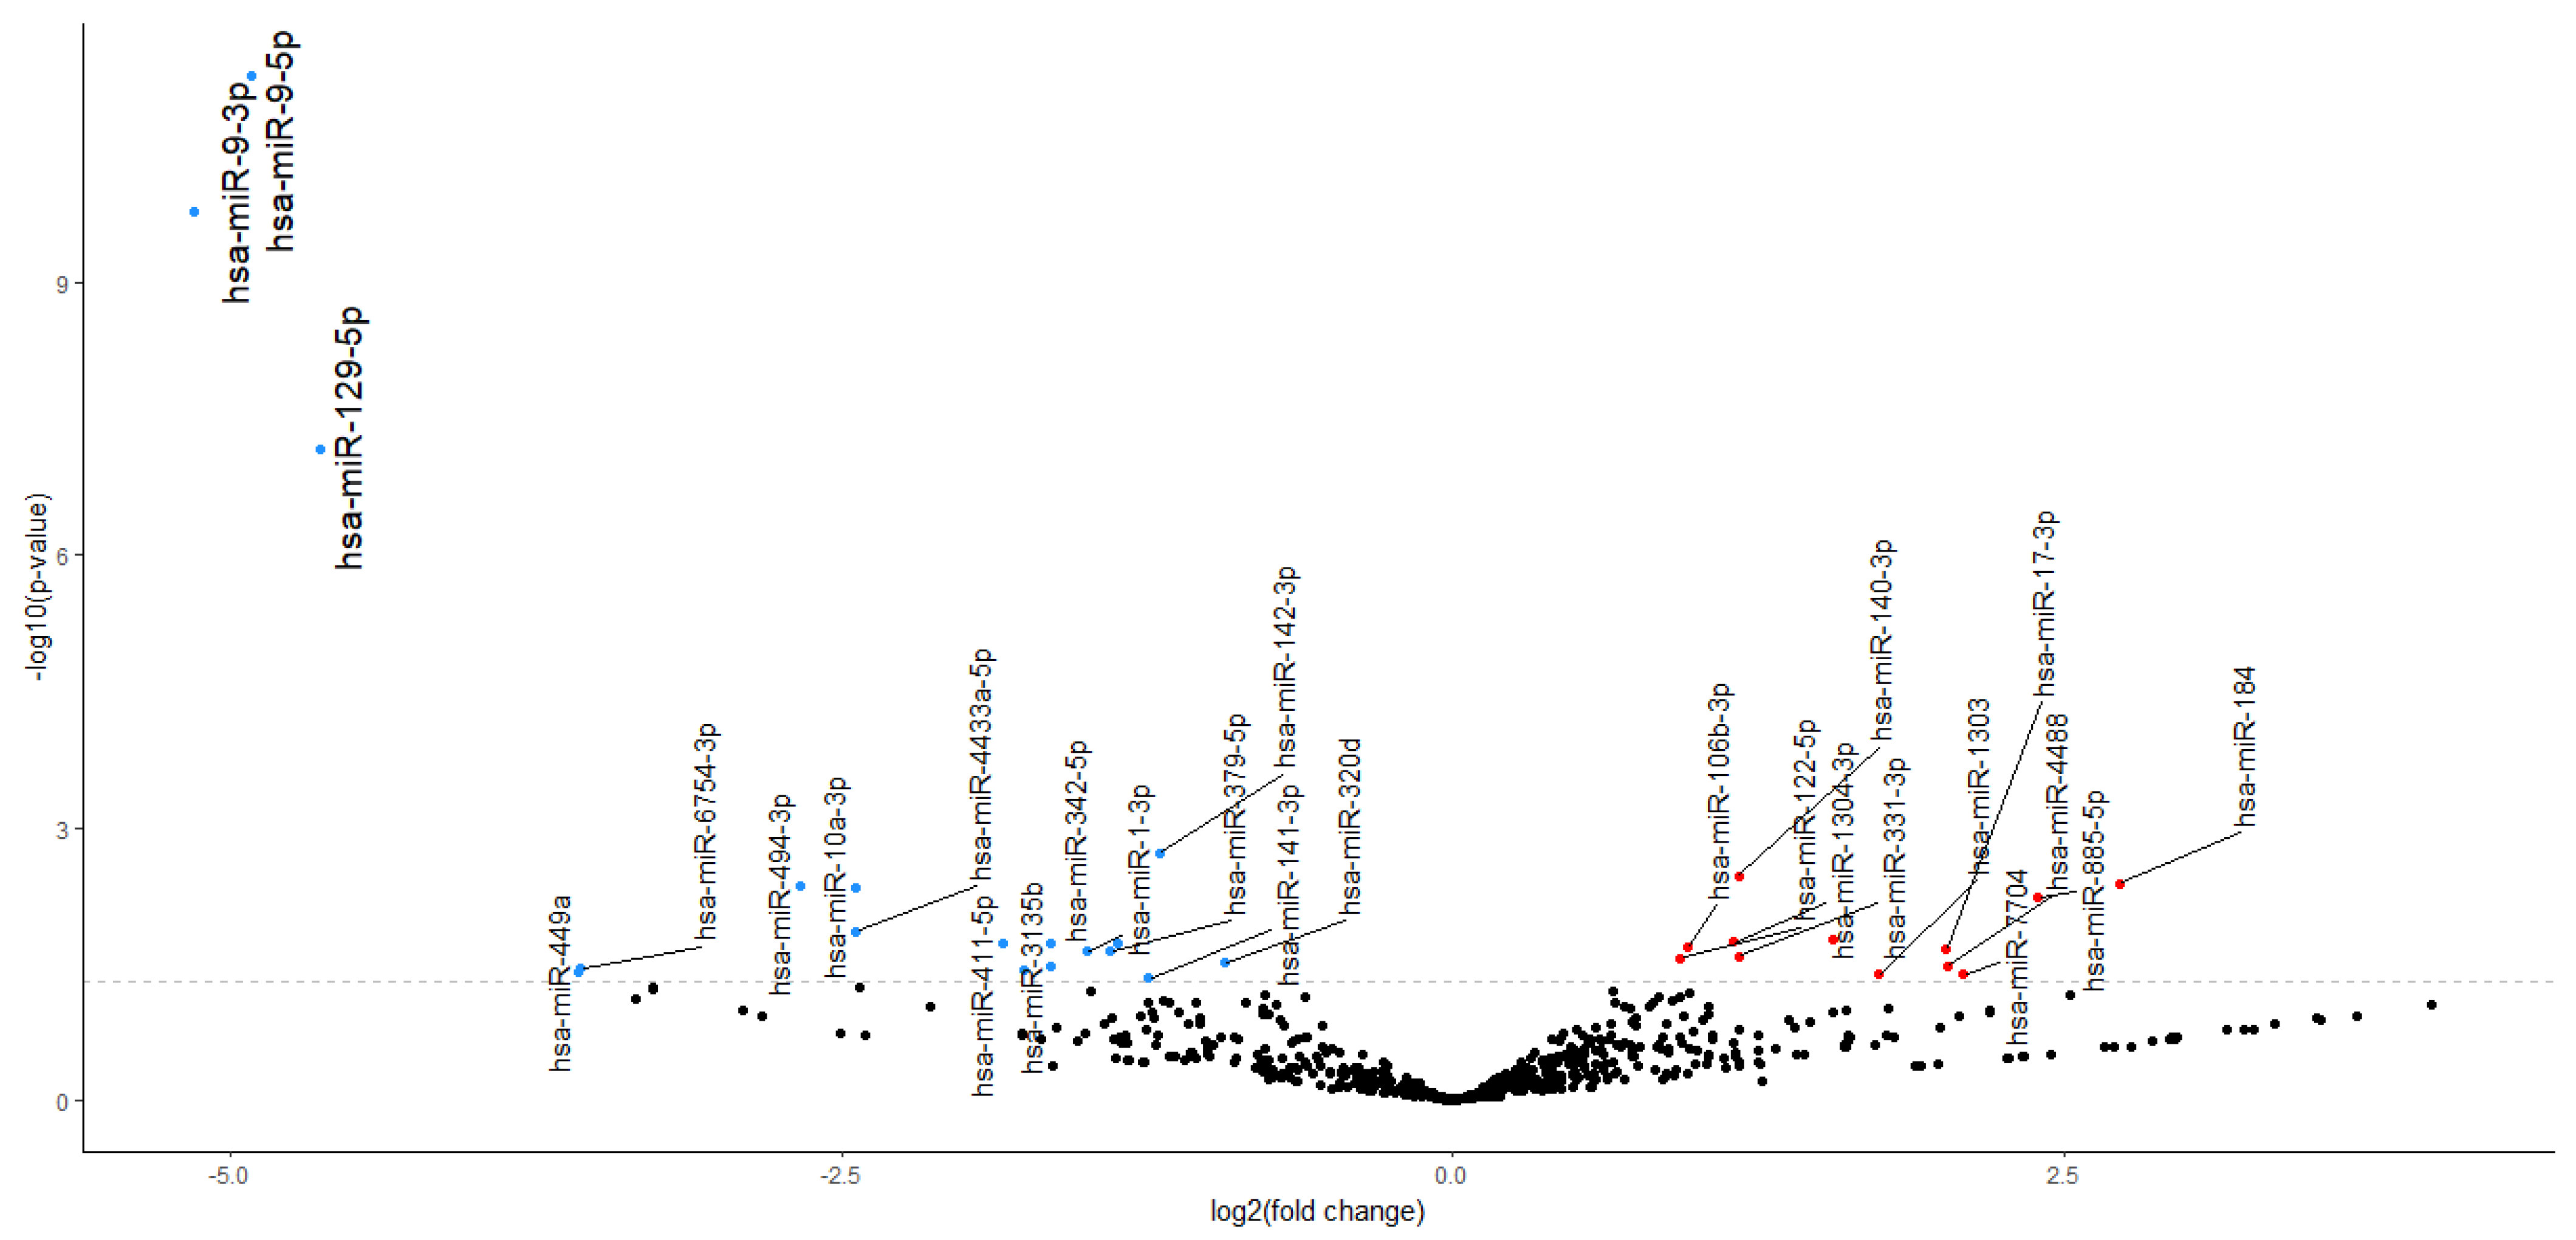
2.2. NGS miRNA Discovery
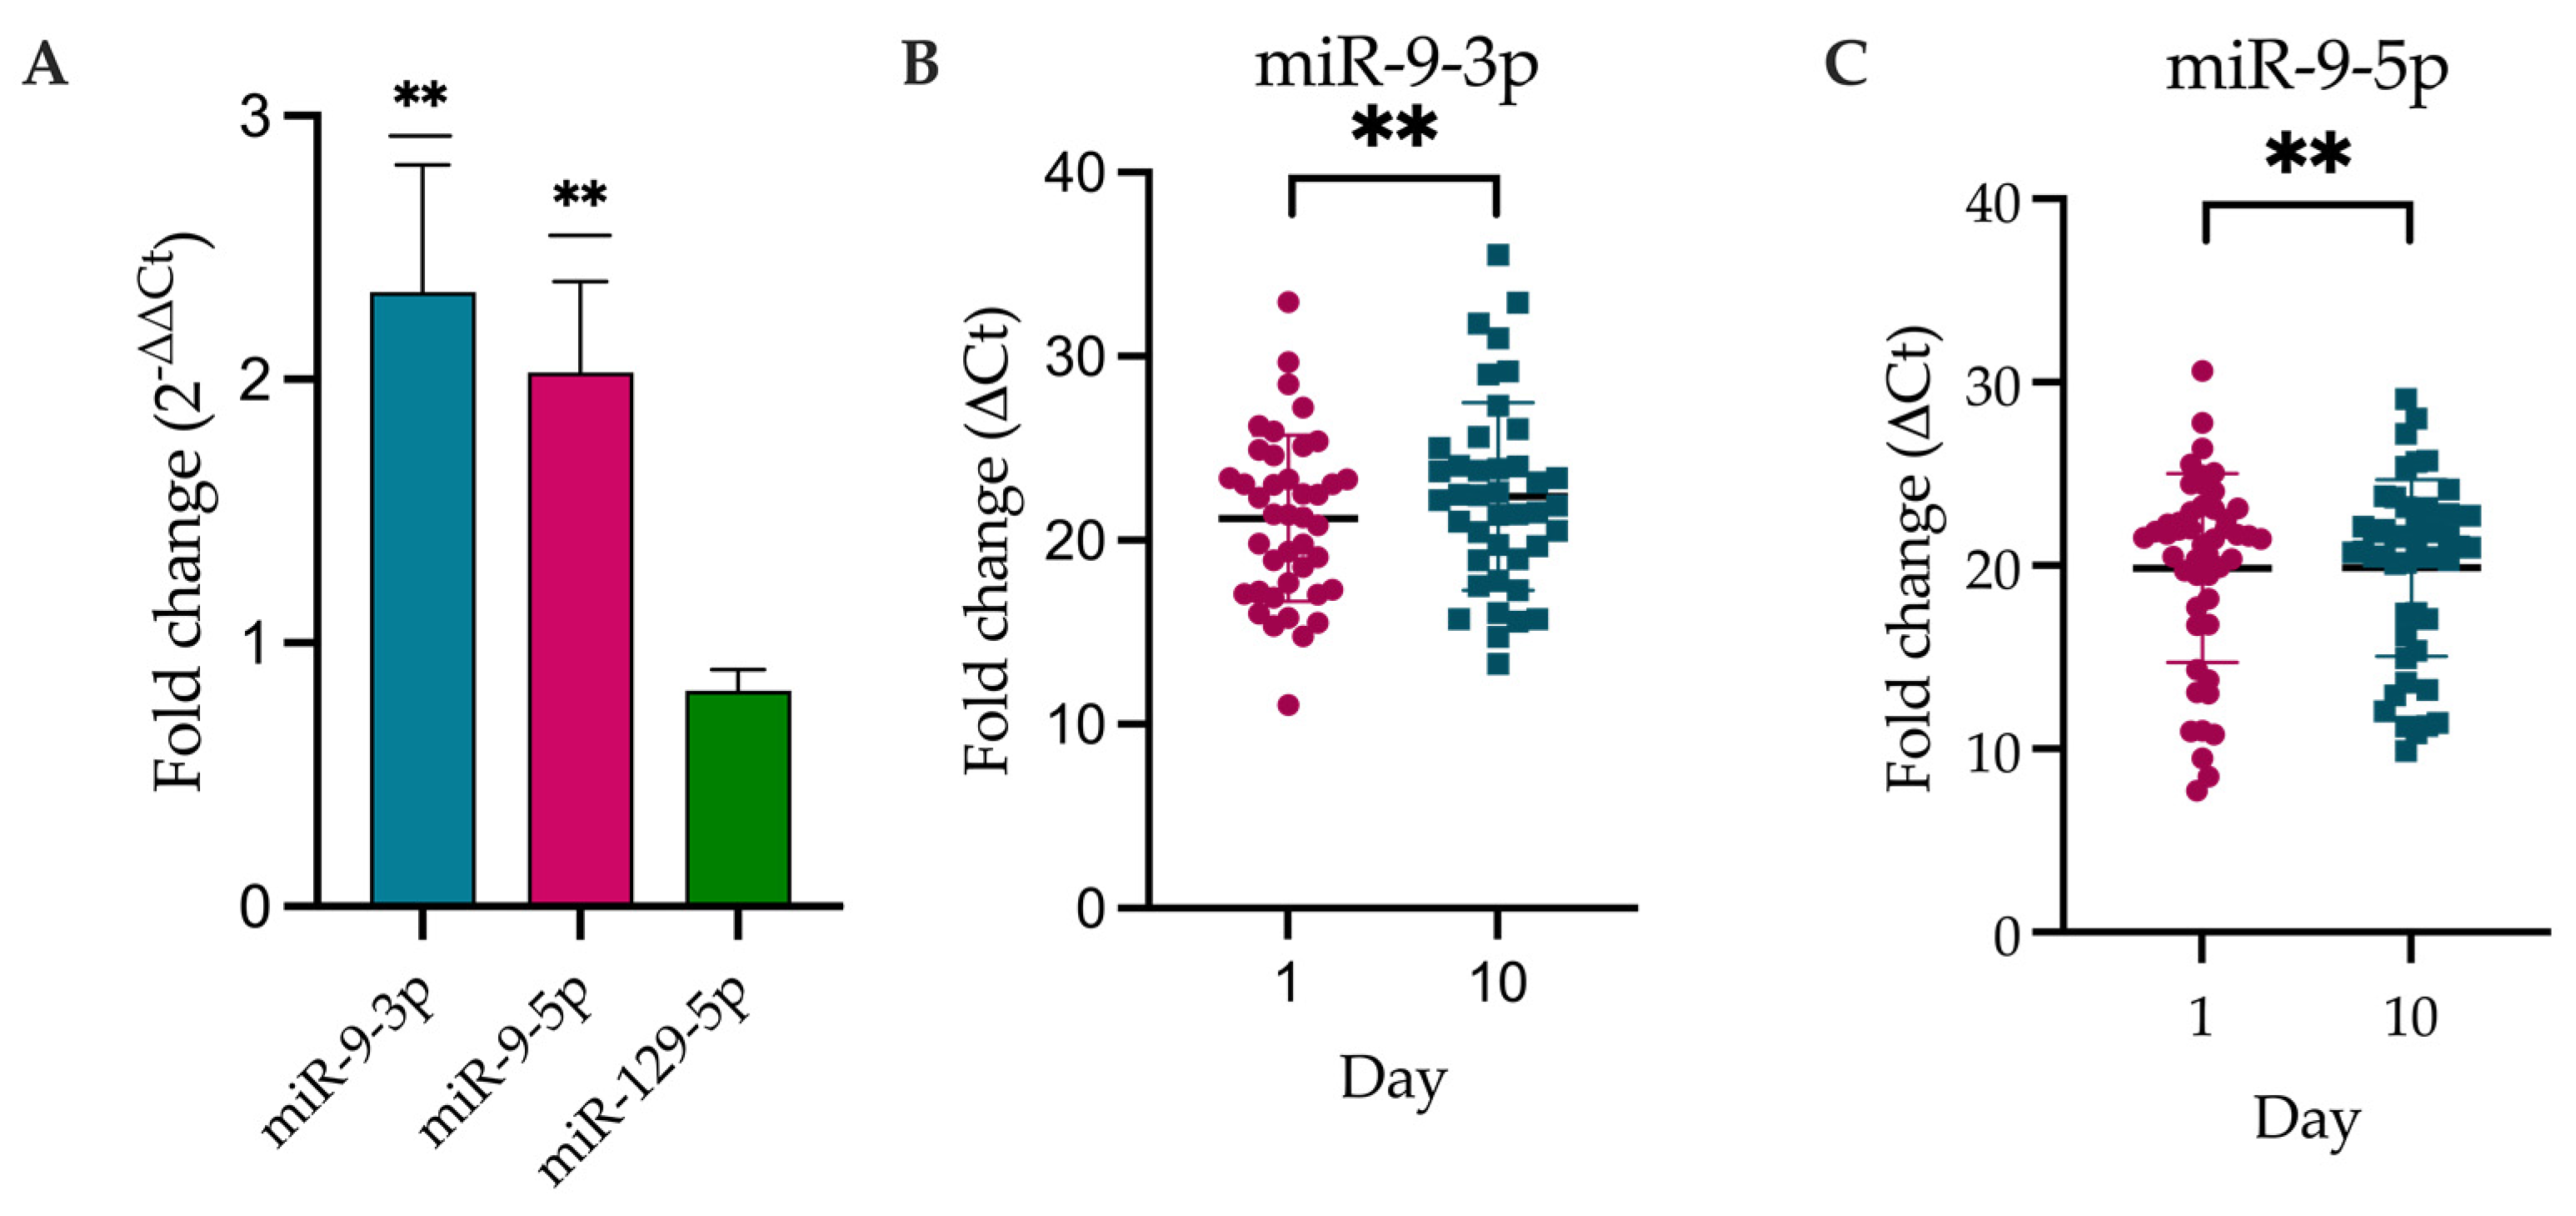
2.3. DE-miRNAs Validation
2.4. miRNA Target Prediction for DEmiRNAs
2.5. Pathway Enrichment for DEmiRNAs’ Targets Based on GO, HALLMARK, KEGG, and PANTHER Databases
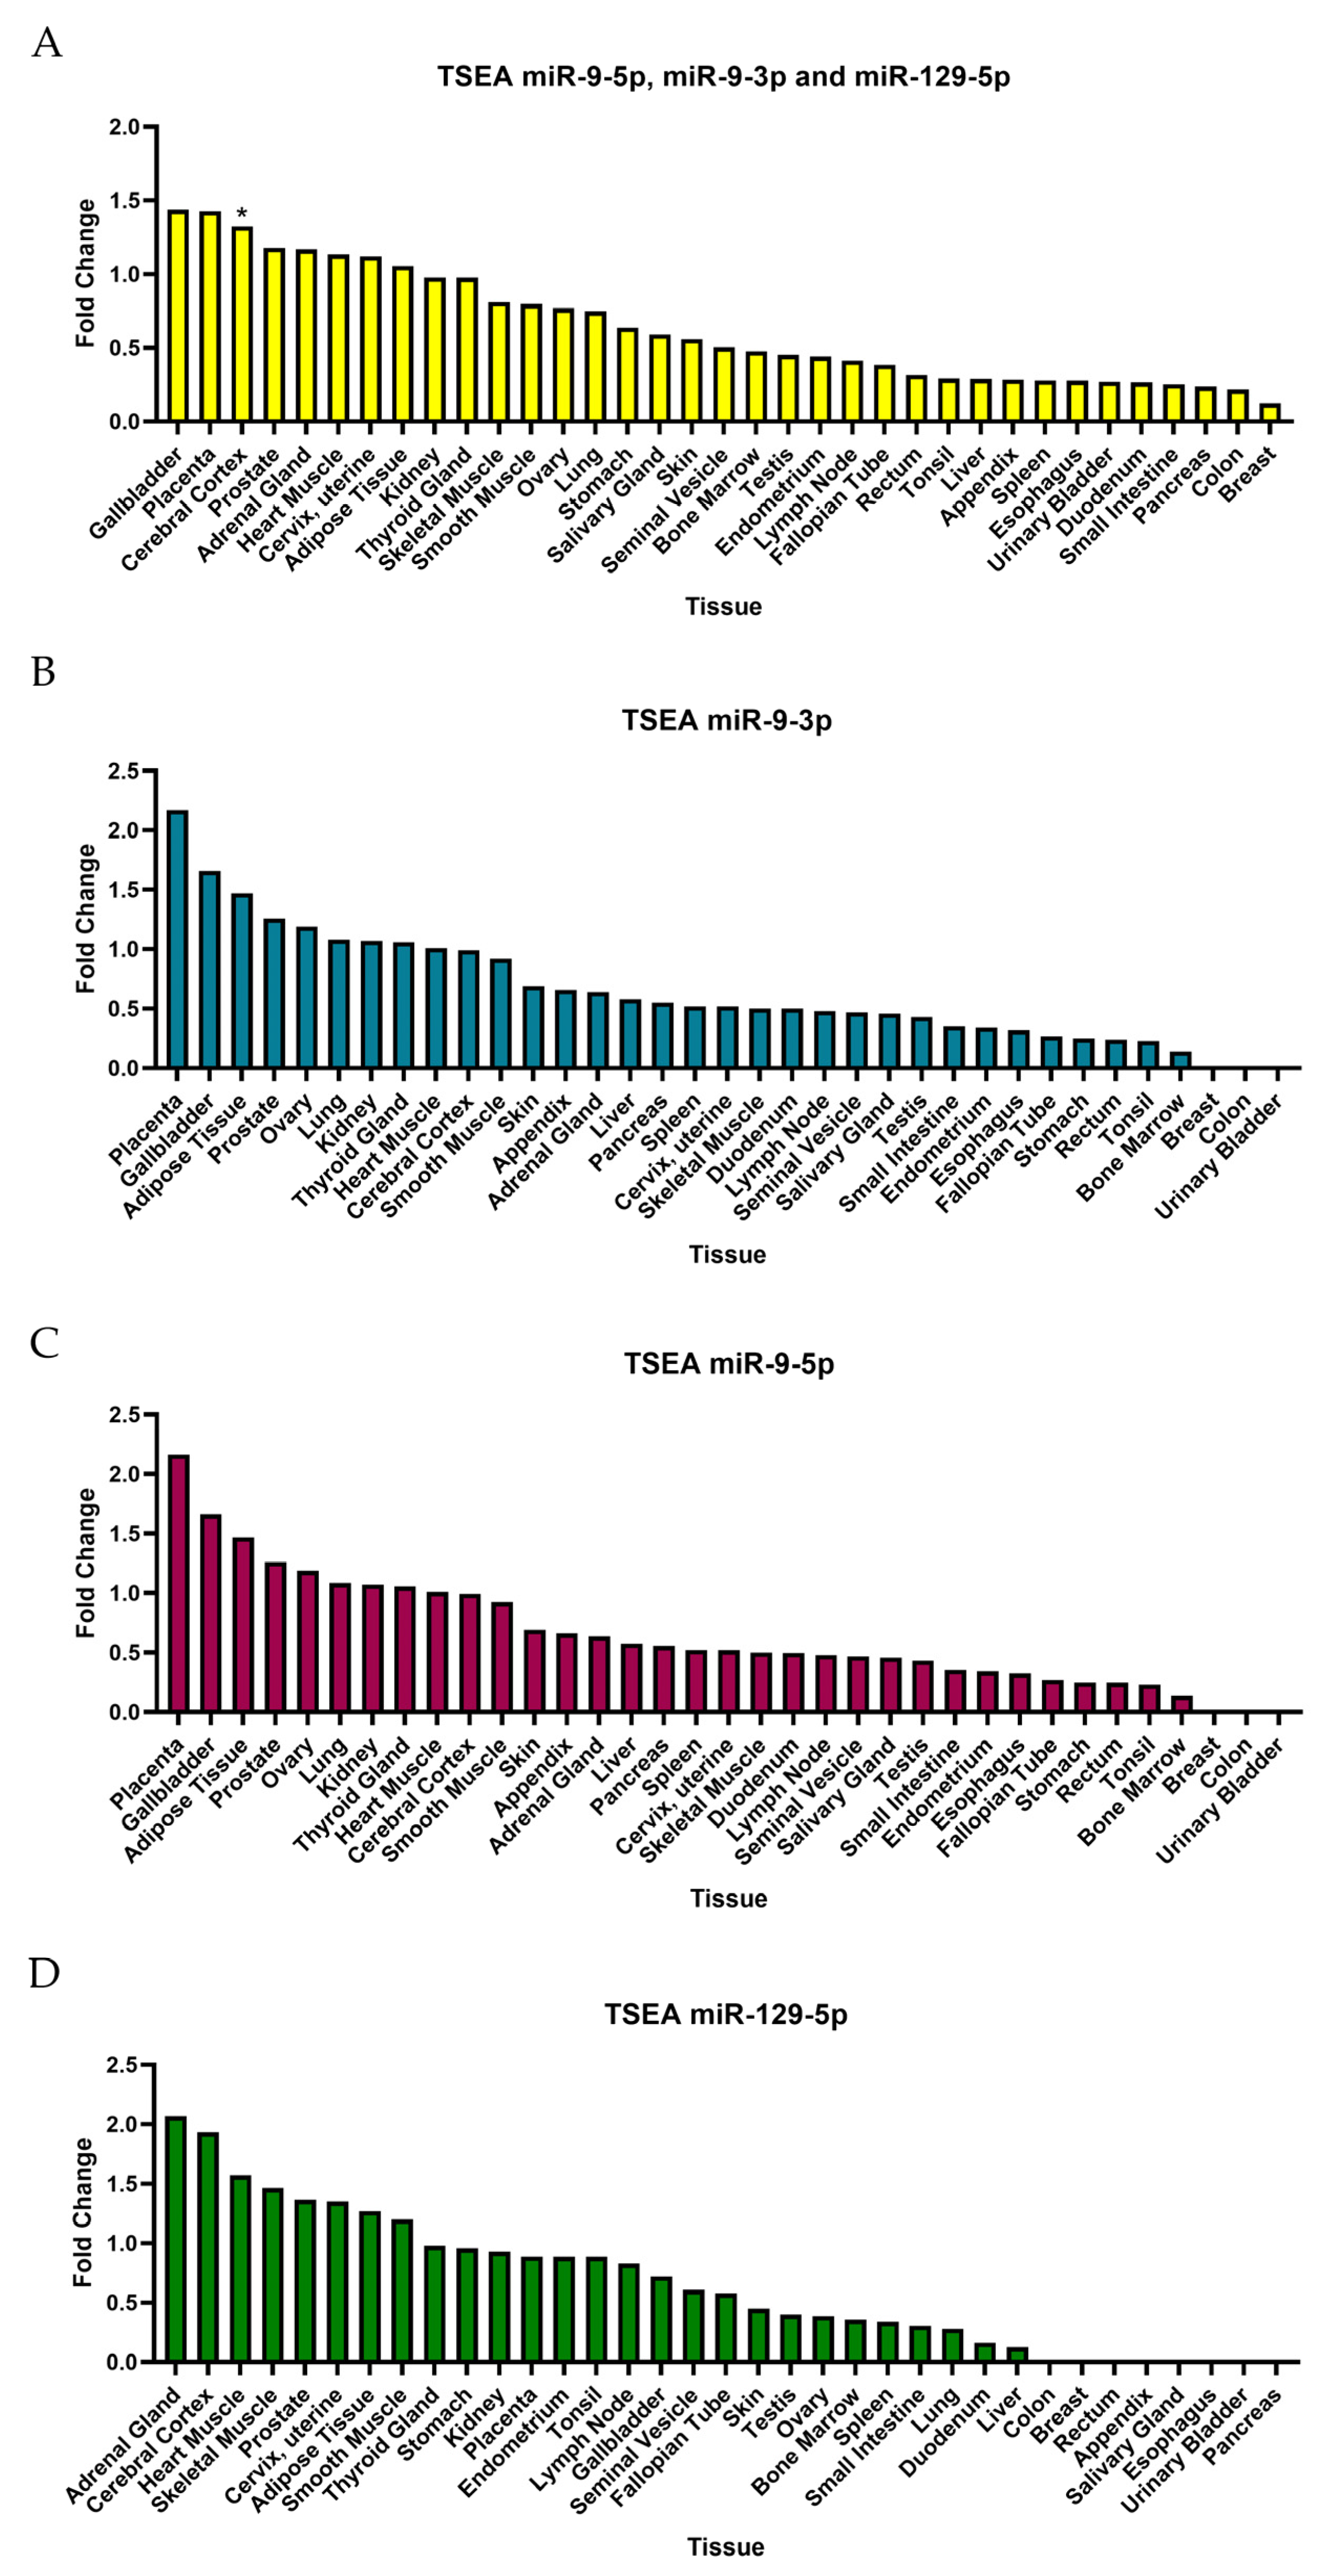
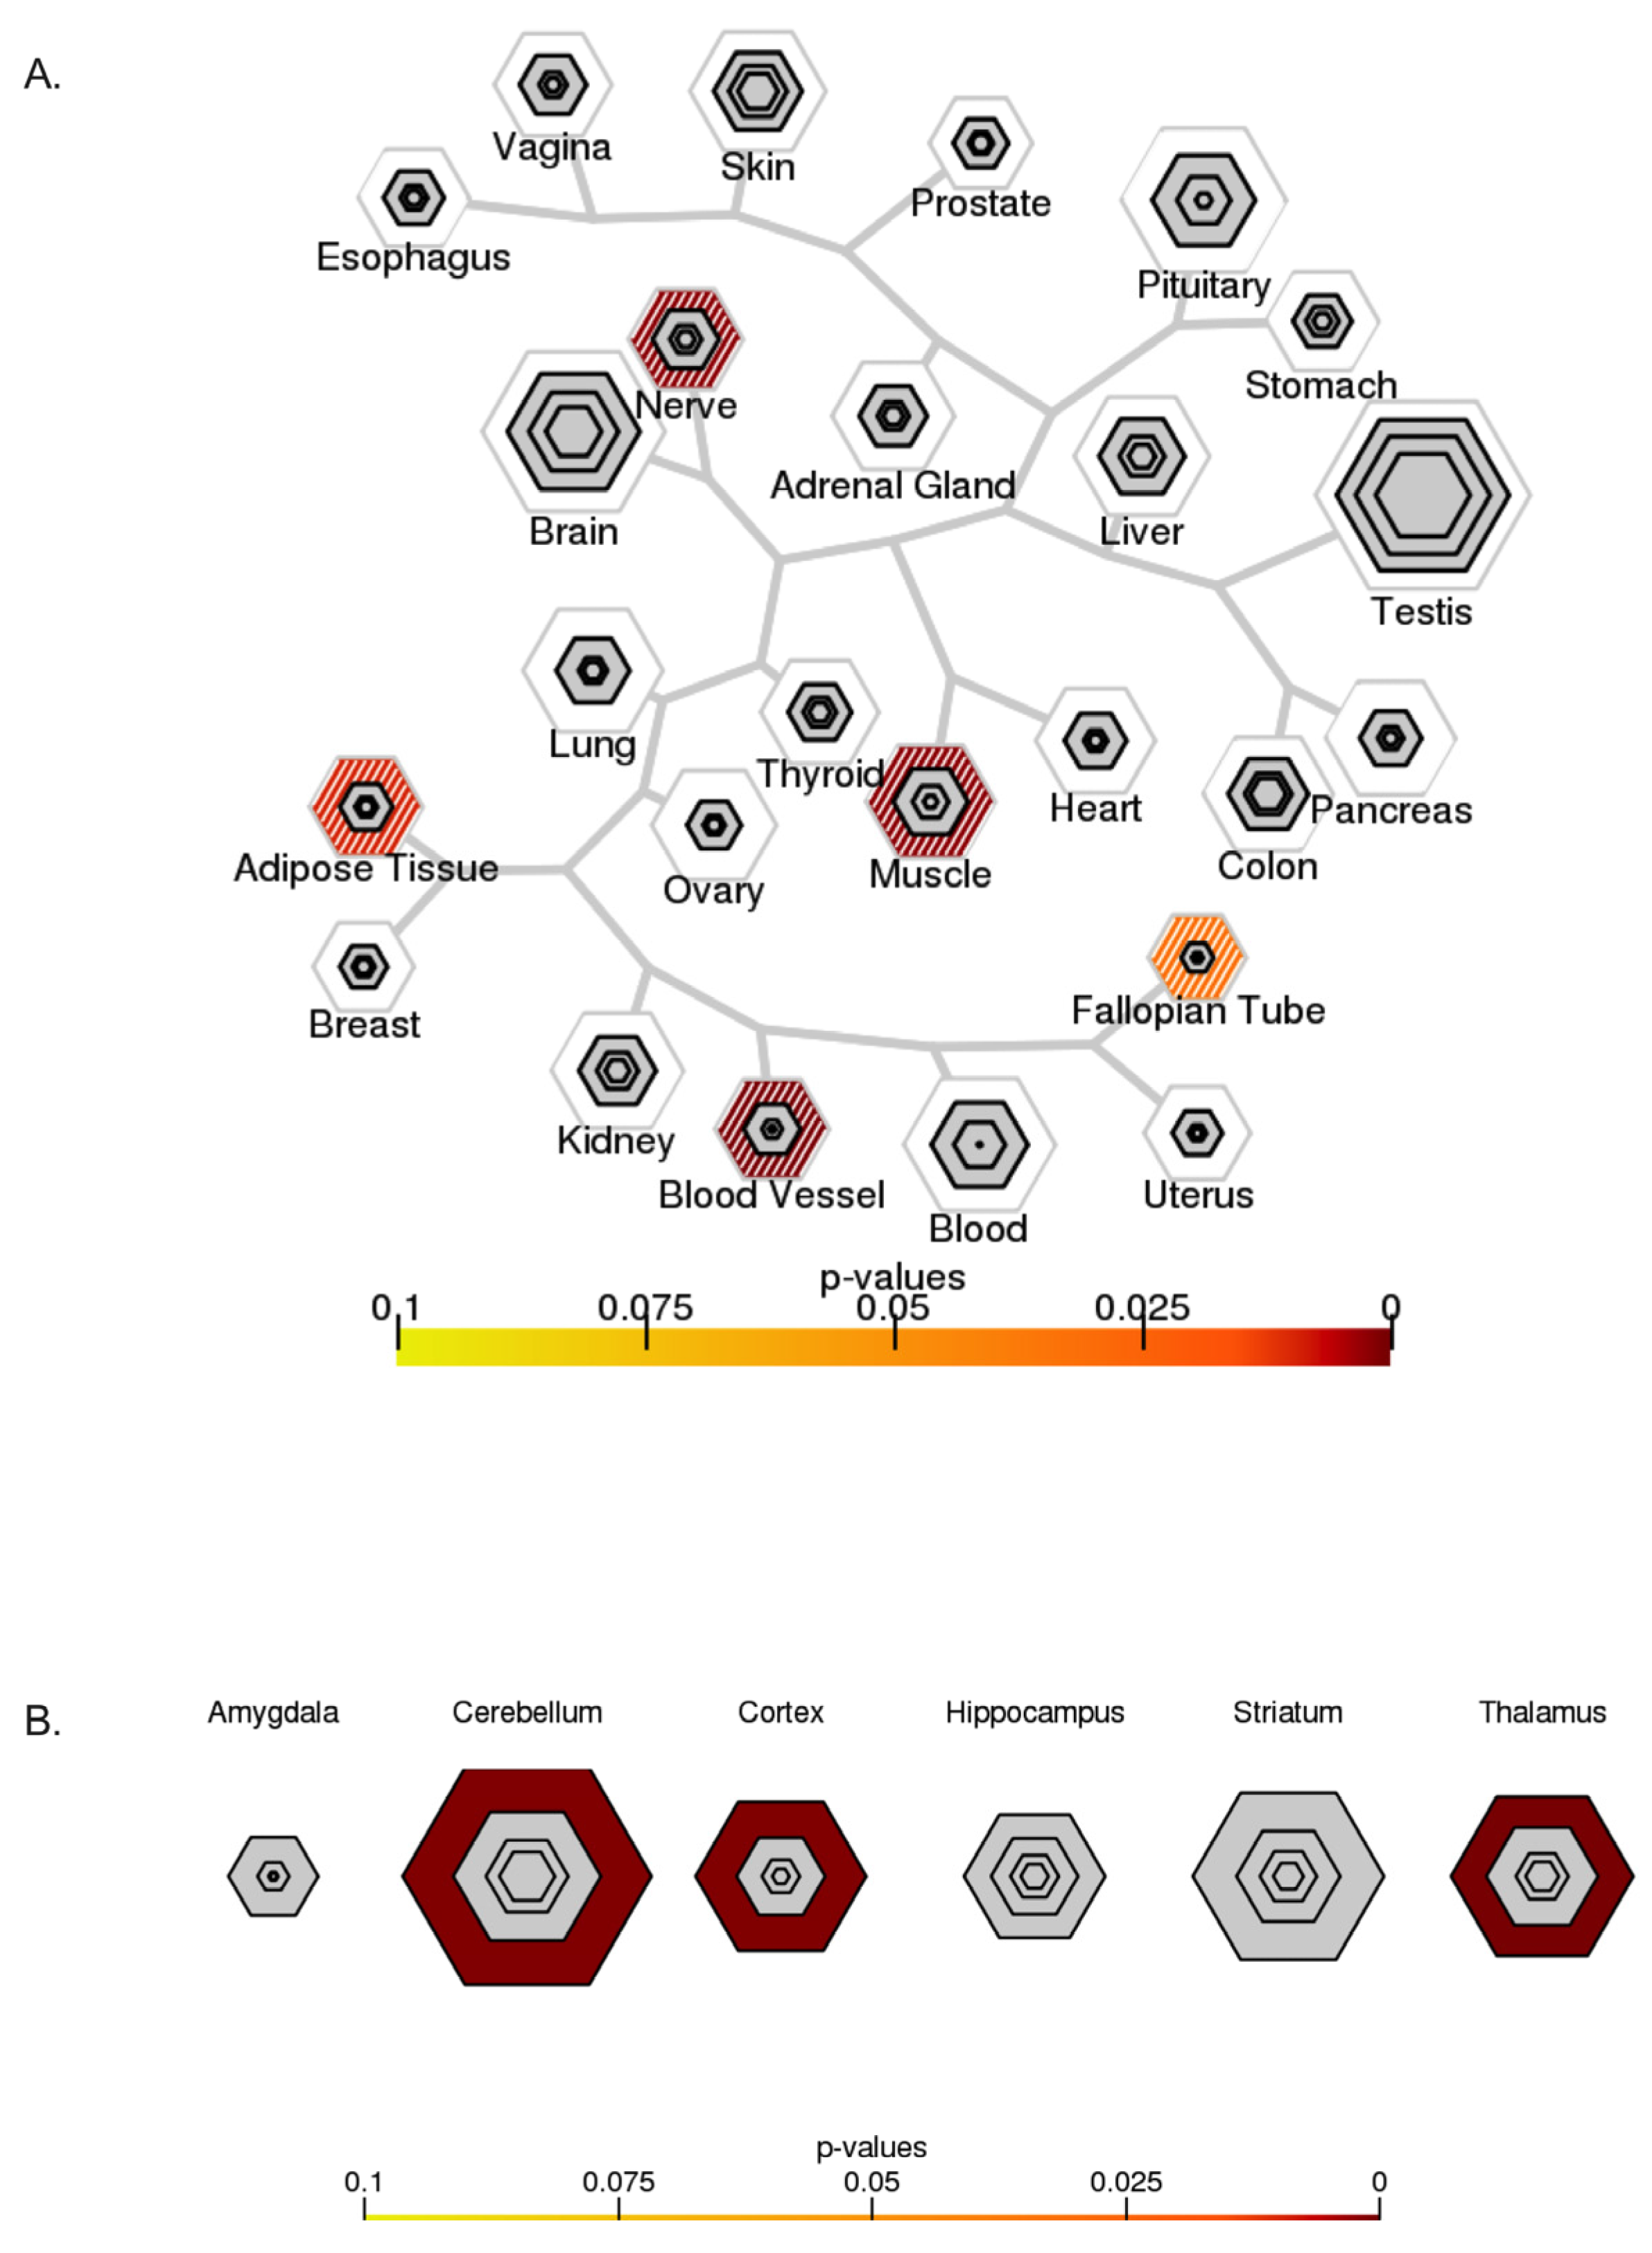
2.6. Tissue-Specific Expression Analysis (TSEA) and Cell-Type-Specific Expression Analysis (CSEA)
3. Discussion
Limitations
4. Materials and Methods
4.1. Study Population
4.2. Sampling of Serum
4.3. Library Preparation and Sequencing of miRNA/Small RNA-Seq from Serum
4.4. Quantification of miRNAs and Differential Expression Analysis of miRNA
4.5. DE-miRNAs Validaton
4.6. Target Estimation Based on NGS Analysis and Enrichment Analysis
4.7. Tissue-Specific Expression Analysis (TSEA) and Cell-Type-Specific Expression Analysis (CSEA)
5. Conclusions
Author Contributions
Funding
Institutional Review Board Statement
Informed Consent Statement
Data Availability Statement
Conflicts of Interest
References
- Murray, C.J.L.; Afshin, A.; Alam, T.; Ashbaugh, C.; Barthelemy, C.; Biehl, M.; Brauer, M.; Compton, K.; Cromwell, E.; Dandona, L.; et al. Global Burden of 369 Diseases and Injuries in 204 Countries and Territories, 1990–2019: A Systematic Analysis for the Global Burden of Disease Study 2019. Lancet 2020, 396, 1204–1222. [Google Scholar] [CrossRef]
- Goyal, M.; Menon, B.K.; van Zwam, W.H.; Dippel, D.W.J.; Mitchell, P.J.; Demchuk, A.M.; Dávalos, A.; Majoie, C.B.L.M.; van der Lugt, A.; de Miquel, M.A.; et al. Endovascular Thrombectomy after Large-Vessel Ischaemic Stroke: A Meta-Analysis of Individual Patient Data from Five Randomised Trials. Lancet 2016, 387, 1723–1731. [Google Scholar] [CrossRef]
- Albers, G.W.; Marks, M.P.; Kemp, S.; Christensen, S.; Tsai, J.P.; Ortega-Gutierrez, S.; McTaggart, R.A.; Torbey, M.T.; Kim-Tenser, M.; Leslie-Mazwi, T.; et al. Thrombectomy for Stroke at 6 to 16 Hours with Selection by Perfusion Imaging. N. Engl. J. Med. 2018, 378, 708–718. [Google Scholar] [CrossRef] [PubMed]
- Jovin, T.G.; Saver, J.L.; Ribo, M.; Pereira, V.; Furlan, A.; Bonafe, A.; Baxter, B.; Gupta, R.; Lopes, D.; Jansen, O.; et al. Diffusion-Weighted Imaging or Computerized Tomography Perfusion Assessment with Clinical Mismatch in the Triage of Wake up and Late Presenting Strokes Undergoing Neurointervention with Trevo (DAWN) Trial Methods. Int. J. Stroke 2017, 12, 641–652. [Google Scholar] [CrossRef] [PubMed]
- Kim, J.T.; Liebeskind, D.S.; Jahan, R.; Menon, B.K.; Goyal, M.; Nogueira, R.G.; Pereira, V.M.; Gralla, J.; Saver, J.L. Impact of Hyperglycemia According to the Collateral Status on Outcomes in Mechanical Thrombectomy. Stroke 2018, 49, 2706–2714. [Google Scholar] [CrossRef] [PubMed]
- Goyal, N.; Tsivgoulis, G.; Pandhi, A.; Dillard, K.; Katsanos, A.H.; Magoufis, G.; Chang, J.J.; Zand, R.; Hoit, D.; Safouris, A.; et al. Admission Hyperglycemia and Outcomes in Large Vessel Occlusion Strokes Treated with Mechanical Thrombectomy. J. Neurointerv. Surg. 2018, 10, 112–117. [Google Scholar] [CrossRef]
- Broocks, G.; Kemmling, A.; Aberle, J.; Kniep, H.; Bechstein, M.; Flottmann, F.; Leischner, H.; Faizy, T.D.; Nawabi, J.; Schön, G.; et al. Elevated Blood Glucose Is Associated with Aggravated Brain Edema in Acute Stroke. J. Neurol. 2020, 267, 440–448. [Google Scholar] [CrossRef]
- Zhang, Y.H.; Shi, M.C.; Wang, Z.X.; Li, C.; Sun, M.Y.; Zhou, J.; Zhang, W.B.; Huo, L.W.; Wang, S.C. Factors Associated with Poor Outcomes in Patients Undergoing Endovascular Therapy for Acute Ischemic Stroke Due to Large-Vessel Occlusion in Acute Anterior Circulation: A Retrospective Study. World Neurosurg. 2021, 149, e128–e134. [Google Scholar] [CrossRef]
- Vemuganti, R. All’s Well That Transcribes Well: Non-Coding RNAs and Post-Stroke Brain Damage. Neurochem. Int. 2013, 63, 438–449. [Google Scholar] [CrossRef]
- Long, G.; Wang, F.; Li, H.; Yin, Z.; Sandip, C.; Lou, Y.; Wang, Y.; Chen, C.; Wang, D.W. Circulating MiR-30a, MiR-126 and Let-7b as Biomarker for Ischemic Stroke in Humans. BMC Neurol. 2013, 13, 178. [Google Scholar] [CrossRef]
- Shah, J.S.; Soon, P.S.; Marsh, D.J. Comparison of Methodologies to Detect Low Levels of Hemolysis in Serum for Accurate Assessment of Serum MicroRNAs. PLoS ONE 2016, 11, e0153200. [Google Scholar] [CrossRef]
- Robinson, M.D.; Smyth, G.K. Moderated Statistical Tests for Assessing Differences in Tag Abundance. Bioinformatics 2007, 23, 2881–2887. [Google Scholar] [CrossRef]
- Motameny, S.; Wolters, S.; Nürnberg, P.; Schumacher, B. Next Generation Sequencing of MiRNAs—Strategies, Resources and Methods. Genes 2010, 1, 70–84. [Google Scholar] [CrossRef]
- Weisscher, N.; Vermeulen, M.; Roos, Y.B.; de Haan, R.J. What Should Be Defined as Good Outcome in Stroke Trials; a Modified Rankin Score of 0–1 or 0–2? J. Neurol. 2008, 255, 867–874. [Google Scholar] [CrossRef]
- Bejleri, J.; Jirström, E.; Donovan, P.; Williams, D.J.; Pfeiffer, S. Diagnostic and Prognostic Circulating MicroRNA in Acute Stroke: A Systematic and Bioinformatic Analysis of Current Evidence. J. Stroke 2021, 23, 162. [Google Scholar] [CrossRef] [PubMed]
- Gennarino, V.A.; D’Angelo, G.; Dharmalingam, G.; Fernandez, S.; Russolillo, G.; Sanges, R.; Mutarelli, M.; Belcastro, V.; Ballabio, A.; Verde, P.; et al. Identification of MicroRNA-Regulated Gene Networks by Expression Analysis of Target Genes. Genome Res. 2012, 22, 1163–1172. [Google Scholar] [CrossRef]
- Deng, Y.; Huang, P.; Zhang, F.; Chen, T. Association of MicroRNAs With Risk of Stroke: A Meta-Analysis. Front. Neurol. 2022, 13, 865265. [Google Scholar] [CrossRef]
- Eyileten, C.; Wicik, Z.; De Rosa, S.; Mirowska-Guzel, D.; Soplinska, A.; Indolfi, C.; Jastrzebska-Kurkowska, I.; Czlonkowska, A.; Postula, M. Cells MicroRNAs as Diagnostic and Prognostic Biomarkers in Ischemic Stroke-A Comprehensive Review and Bioinformatic Analysis. Cells 2018, 7, 249. [Google Scholar] [CrossRef]
- Wang, Q.; Wang, F.; Fu, F.; Liu, J.; Sun, W.; Chen, Y. Diagnostic and Prognostic Value of Serum MiR-9-5p and MiR-128-3p Levels in Early-Stage Acute Ischemic Stroke. Clinics 2021, 76, e2958. [Google Scholar] [CrossRef] [PubMed]
- Ji, Q.; Ji, Y.; Peng, J.; Zhou, X.; Chen, X.; Zhao, H.; Xu, T.; Chen, L.; Xu, Y. Increased Brain-Specific MiR-9 and MiR-124 in the Serum Exosomes of Acute Ischemic Stroke Patients. PLoS ONE 2016, 11, e0163645. [Google Scholar] [CrossRef] [PubMed]
- Sorensen, S.S.; Nygaard, A.-B.; Carlsen, A.L.; Heegaard, N.H.H.; Bak, M.; Christensen, T. Elevation of Brain-Enriched MiRNAs in Cerebrospinal Fluid of Patients with Acute Ischemic Stroke. Biomark. Res. 2017, 5, 24. [Google Scholar] [CrossRef] [PubMed]
- Abdelaleem, O.O.; Shaker, O.G.; Mohamed, M.M.; Ahmed, T.I.; Elkhateeb, A.F.; Abdelghaffar, N.K.; Ahmed, N.A.; Khalefa, A.A.; Hemeda, N.F.; Mahmoud, R.H. Differential Expression of Serum TUG1, LINC00657, MiR-9, and MiR-106a in Diabetic Patients with and without Ischemic Stroke. Front. Mol. Biosci. 2022, 8, 1382. [Google Scholar] [CrossRef] [PubMed]
- Bache, S.; Rasmussen, R.; Wolcott, Z.; Rossing, M.; Møgelvang, R.; Tolnai, D.; Hassager, C.; Forman, J.L.; Køber, L.; Nielsen, F.C.; et al. Elevated MiR-9 in Cerebrospinal Fluid Is Associated with Poor Functional Outcome After Subarachnoid Hemorrhage. Transl. Stroke Res. 2020, 11, 1243–1252. [Google Scholar] [CrossRef]
- O’Connell, G.C.; Smothers, C.G.; Winkelman, C. Bioinformatic Analysis of Brain-Specific MiRNAs for Identification of Candidate Traumatic Brain Injury Blood Biomarkers. Brain Inj. 2020, 34, 965–974. [Google Scholar] [CrossRef]
- Beske, R.P.; Bache, S.; Abild Stengaard Meyer, M.; Kjærgaard, J.; Bro-Jeppesen, J.; Obling, L.; Olsen, M.H.; Rossing, M.; Nielsen, F.C.; Møller, K.; et al. MicroRNA-9-3p: A Novel Predictor of Neurological Outcome after Cardiac Arrest. Eur. Heart J. Acute Cardiovasc. Care 2022, 11, 609–616. [Google Scholar] [CrossRef]
- Sepramaniam, S.; Tan, J.-R.; Tan, K.-S.; DeSilva, D.; Tavintharan, S.; Woon, F.-P.; Wang, C.-W.; Yong, F.-L.; Karolina, D.-S.; Kaur, P.; et al. Circulating MicroRNAs as Biomarkers of Acute Stroke. Int. J. Mol. Sci. 2014, 15, 1418–1432. [Google Scholar] [CrossRef] [PubMed]
- Lonze, B.E.; Ginty, D.D. Function and Regulation of CREB Family Transcription Factors in the Nervous System. Neuron 2002, 35, 605–623. [Google Scholar] [CrossRef]
- Kitagawa, K. CREB and CAMP Response Element-Mediated Gene Expression in the Ischemic Brain. FEBS J. 2007, 274, 3210–3217. [Google Scholar] [CrossRef]
- Harrison, T.C.; Silasi, G.; Boyd, J.D.; Murphy, T.H. Displacement of Sensory Maps and Disorganization of Motor Cortex after Targeted Stroke in Mice. Stroke 2013, 44, 2300–2306. [Google Scholar] [CrossRef]
- Brown, C.E.; Aminoltejari, K.; Erb, H.; Winship, I.R.; Murphy, T.H. In Vivo Voltage-Sensitive Dye Imaging in Adult Mice Reveals That Somatosensory Maps Lost to Stroke Are Replaced over Weeks by New Structural and Functional Circuits with Prolonged Modes of Activation within Both the Peri-Infarct Zone and Distant Sites. J. Neurosci. 2009, 29, 1719–1734. [Google Scholar] [CrossRef]
- Caracciolo, L.; Marosi, M.; Mazzitelli, J.; Latifi, S.; Sano, Y.; Galvan, L.; Kawaguchi, R.; Holley, S.; Levine, M.S.; Coppola, G.; et al. CREB Controls Cortical Circuit Plasticity and Functional Recovery after Stroke. Nat. Commun. 2018, 9, 2250. [Google Scholar] [CrossRef] [PubMed]
- Lee, S.-S.; Kim, C.-J.; Shin, M.-S.; Lim, B.-V.; Lee, S.-S.; Kim, C.-J.; Shin, M.-S.; Lim, B.-V. Treadmill Exercise Ameliorates Memory Impairment through ERK-Akt-CREB-BDNF Signaling Pathway in Cerebral Ischemia Gerbils. J. Exerc. Rehabil. 2020, 16, 49–57. [Google Scholar] [CrossRef]
- Ortega-Martínez, S. A New Perspective on the Role of the CREB Family of Transcription Factors in Memory Consolidation via Adult Hippocampal Neurogenesis. Front. Mol. Neurosci. 2015, 8, 46. [Google Scholar] [CrossRef] [PubMed]
- Cramer, S.C. Repairing the Human Brain after Stroke: I. Mechanisms of Spontaneous Recovery. Ann. Neurol. 2008, 63, 272–287. [Google Scholar] [CrossRef] [PubMed]
- Wen, A.Y.; Sakamoto, K.M.; Miller, L.S. The Role of the Transcription Factor CREB in Immune Function. J. Immunol. 2010, 185, 6413–6419. [Google Scholar] [CrossRef] [PubMed]
- Ai, Z.; Udalova, I.A. Transcriptional Regulation of Neutrophil Differentiation and Function during Inflammation. J. Leukoc. Biol. 2020, 107, 419–430. [Google Scholar] [CrossRef]
- Sherman, D.; Bes, A.; Easton, J.D.; Hacke, W.; Kaste, M.; Polmar, S.H.; Zivin, J.A.; Clark, W.; Schneider, D.; Whisnant, J.; et al. Use of Anti-ICAM-1 Therapy in Ischemic Stroke: Results of the Enlimomab Acute Stroke Trial. Neurology 2001, 57, 1428–1434. [Google Scholar] [CrossRef]
- Krams, M.; Lees, K.R.; Hacke, W.; Grieve, A.P.; Orgogozo, J.-M.; Ford, G.A.; ASTIN Study Investigators. Acute Stroke Therapy by Inhibition of Neutrophils (ASTIN): An Adaptive Dose-Response Study of UK—279,276 in Acute Ischemic Stroke. Stroke 2003, 34, 2543–2548. [Google Scholar] [CrossRef]
- Sakai, S.; Shichita, T. Inflammation and Neural Repair after Ischemic Brain Injury. Neurochem. Int. 2019, 130, 104316. [Google Scholar] [CrossRef]
- Jickling, G.C.; Liu, D.; Ander, B.P.; Stamova, B.; Zhan, X.; Sharp, F.R. Targeting Neutrophils in Ischemic Stroke: Translational Insights from Experimental Studies. J. Cereb. Blood Flow Metab. 2015, 35, 888–901. [Google Scholar] [CrossRef]
- Evans, P.C.; Smith, T.S.; Lai, M.-J.; Williams, M.G.; Burke, D.F.; Heyninck, K.; Kreike, M.M.; Beyaert, R.; Blundell, T.L.; Kilshaw, P.J. A Novel Type of Deubiquitinating Enzyme. J. Biol. Chem. 2003, 278, 23180–23186. [Google Scholar] [CrossRef] [PubMed]
- Enesa, K.; Zakkar, M.; Chaudhury, H.; Luong, L.A.; Rawlinson, L.; Mason, J.C.; Haskard, D.O.; Dean, J.L.E.; Evans, P.C. NF-ΚB Suppression by the Deubiquitinating Enzyme Cezanne: A NOVEL NEGATIVE FEEDBACK LOOP IN PRO-INFLAMMATORY SIGNALING. J. Biol. Chem. 2008, 283, 7036–7045. [Google Scholar] [CrossRef]
- Ji, Y.; Cao, L.; Zeng, L.; Zhang, Z.; Xiao, Q.; Guan, P.; Chen, S.; Chen, Y.; Wang, M.; Guo, D. The N-terminal Ubiquitin-associated Domain of Cezanne Is Crucial for Its Function to Suppress NF-κB Pathway. J. Cell. Biochem. 2018, 119, 1979–1991. [Google Scholar] [CrossRef] [PubMed]
- Zhang, J.; Zha, Y.; Jiao, Y.; Li, Y.; Wang, J.; Zhang, S. OTUD7B (Cezanne) Ameliorates Fibrosis after Myocardial Infarction via FAK-ERK/P38 MAPK Signaling Pathway. Arch. Biochem. Biophys. 2022, 724, 109266. [Google Scholar] [CrossRef] [PubMed]
- Cheng, J.; Fan, Y.-Q.; Jiang, H.-X.; Chen, S.-F.; Chen, J.; Liao, X.-Y.; Zou, Y.-Y.; Lan, H.; Cui, Y.; Chen, Z.-B.; et al. Transcranial Direct-Current Stimulation Protects against Cerebral Ischemia-Reperfusion Injury through Regulating Cezanne-Dependent Signaling. Exp. Neurol. 2021, 345, 113818. [Google Scholar] [CrossRef]
- Sinden, J.D.; Hicks, C.; Stroemer, P.; Vishnubhatla, I.; Corteling, R. Human Neural Stem Cell Therapy for Chronic Ischemic Stroke: Charting Progress from Laboratory to Patients. Stem Cells Dev. 2017, 26, 933–947. [Google Scholar] [CrossRef]
- Yoshida, K.; Yoshitomo-Nakagawa, K.; Seki, N.; Sasaki, M.; Sugano, S. Cloning, Expression Analysis, and Chromosomal Localization of BH-Protocadherin (PCDH7), a Novel Member of the Cadherin Superfamily. Genomics 1998, 49, 458–461. [Google Scholar] [CrossRef]
- Zamanian, J.L.; Xu, L.; Foo, L.C.; Nouri, N.; Zhou, L.; Giffard, R.G.; Barres, B.A. Genomic Analysis of Reactive Astrogliosis. J. Neurosci. 2012, 32, 6391–6410. [Google Scholar] [CrossRef] [PubMed]
- Hayashi, S.; Takeichi, M. Emerging Roles of Protocadherins: From Self-Avoidance to Enhancement of Motility. J. Cell Sci. 2015, 128, 1455–1464. [Google Scholar] [CrossRef] [PubMed]
- Redies, C.; Vanhalst, K.; Roy, F. van δ-Protocadherins: Unique Structures and Functions. Cell. Mol. Life Sci. 2005, 62, 2840–2852. [Google Scholar] [CrossRef]
- Kim, S.-Y.; Yasuda, S.; Tanaka, H.; Yamagata, K.; Kim, H. Non-Clustered Protocadherin. Cell Adh. Migr. 2011, 5, 97–105. [Google Scholar] [CrossRef]
- Loh, K.H.; Stawski, P.S.; Draycott, A.S.; Udeshi, N.D.; Lehrman, E.K.; Wilton, D.K.; Svinkina, T.; Deerinck, T.J.; Ellisman, M.H.; Stevens, B.; et al. Proteomic Analysis of Unbounded Cellular Compartments: Synaptic Clefts. Cell 2016, 166, 1295–1307.e21. [Google Scholar] [CrossRef]
- Wang, Y.; Kerrisk Campbell, M.; Tom, I.; Foreman, O.; Hanson, J.E.; Sheng, M. PCDH7 Interacts with GluN1 and Regulates Dendritic Spine Morphology and Synaptic Function. Sci. Rep. 2020, 10, 10951. [Google Scholar] [CrossRef]
- Miyake, K.; Hirasawa, T.; Soutome, M.; Itoh, M.; Goto, Y.; Endoh, K.; Takahashi, K.; Kudo, S.; Nakagawa, T.; Yokoi, S.; et al. The Protocadherins, PCDHB1 and PCDH7, Are Regulated by MeCP2 in Neuronal Cells and Brain Tissues: Implication for Pathogenesis of Rett Syndrome. BMC Neurosci. 2011, 12, 81. [Google Scholar] [CrossRef] [PubMed]
- Ollila, H.M.; Kettunen, J.; Pietiläinen, O.; Aho, V.; Silander, K.; Kronholm, E.; Perola, M.; Lahti, J.; Räikkönen, K.; Widen, E.; et al. Genome-Wide Association Study of Sleep Duration in the Finnish Population. J. Sleep Res. 2014, 23, 609–618. [Google Scholar] [CrossRef] [PubMed]
- Yu, H.; Yan, H.; Wang, L.; Li, J.; Tan, L.; Deng, W.; Chen, Q.; Yang, G.; Zhang, F.; Lu, T.; et al. Five Novel Loci Associated with Antipsychotic Treatment Response in Patients with Schizophrenia: A Genome-Wide Association Study. Lancet Psychiatry 2018, 5, 327–338. [Google Scholar] [CrossRef] [PubMed]
- Armstrong, N.D.; Srinivasasainagendra, V.; Patki, A.; Tanner, R.M.; Hidalgo, B.A.; Tiwari, H.K.; Limdi, N.A.; Lange, E.M.; Lange, L.A.; Arnett, D.K.; et al. Genetic Contributors of Incident Stroke in 10,700 African Americans With Hypertension: A Meta-Analysis from the Genetics of Hypertension Associated Treatments and Reasons for Geographic and Racial Differences in Stroke Studies. Front. Genet. 2021, 12, 781451. [Google Scholar] [CrossRef] [PubMed]
- de Semir, D.; Bezrookove, V.; Nosrati, M.; Dar, A.A.; Wu, C.; Shen, J.; Rieken, C.; Venkatasubramanian, M.; Miller, J.R.; Desprez, P.-Y.; et al. PHIP as a Therapeutic Target for Driver-Negative Subtypes of Melanoma, Breast, and Lung Cancer. Proc. Natl. Acad. Sci. USA 2018, 115, E5766–E5775. [Google Scholar] [CrossRef] [PubMed]
- Bezrookove, V.; Nosrati, M.; Miller, J.R.; De Semir, D.; Dar, A.A.; Vosoughi, E.; Vaquero, E.; Sucker, A.; Lazar, A.J.; Gershenwald, J.E.; et al. Role of Elevated PHIP Copy Number as a Prognostic and Progression Marker for Cutaneous Melanoma. Clin. Cancer Res. 2018, 24, 4119–4125. [Google Scholar] [CrossRef] [PubMed]
- Jang, S.M.; Nathans, J.F.; Fu, H.; Redon, C.E.; Jenkins, L.M.; Thakur, B.L.; Pongor, L.S.; Baris, A.M.; Gross, J.M.; OʹNeill, M.J.; et al. The RepID–CRL4 Ubiquitin Ligase Complex Regulates Metaphase to Anaphase Transition via BUB3 Degradation. Nat. Commun. 2020, 11, 24. [Google Scholar] [CrossRef]
- Marenne, G.; Hendricks, A.E.; Perdikari, A.; Bounds, R.; Payne, F.; Keogh, J.M.; Lelliott, C.J.; Henning, E.; Pathan, S.; Ashford, S.; et al. Exome Sequencing Identifies Genes and Gene Sets Contributing to Severe Childhood Obesity, Linking PHIP Variants to Repressed POMC Transcription. Cell Metab. 2020, 31, 1107–1119.e12. [Google Scholar] [CrossRef]
- Li, S.; Francisco, A.B.; Han, C.; Pattabiraman, S.; Foote, M.R.; Giesy, S.L.; Wang, C.; Schimenti, J.C.; Boisclair, Y.R.; Long, Q. The Full-Length Isoform of the Mouse Pleckstrin Homology Domain-Interacting Protein (PHIP) Is Required for Postnatal Growth. FEBS Lett. 2010, 584, 4121–4127. [Google Scholar] [CrossRef] [PubMed]
- Morgan, M.A.J.; Popova, I.K.; Vaidya, A.; Burg, J.M.; Marunde, M.R.; Rendleman, E.J.; Dumar, Z.J.; Watson, R.; Meiners, M.J.; Howard, S.A.; et al. A Trivalent Nucleosome Interaction by PHIP/BRWD2 Is Disrupted in Neurodevelopmental Disorders and Cancer. Genes Dev. 2021, 35, 1642–1656. [Google Scholar] [CrossRef] [PubMed]
- Webster, E.; Cho, M.T.; Alexander, N.; Desai, S.; Naidu, S.; Bekheirnia, M.R.; Lewis, A.; Retterer, K.; Juusola, J.; Chung, W.K. De Novo PHIP-Predicted Deleterious Variants Are Associated with Developmental Delay, Intellectual Disability, Obesity, and Dysmorphic Features. Cold Spring Harb. Mol. Case Stud. 2016, 2, a001172. [Google Scholar] [CrossRef] [PubMed]
- Dietrich, J.; Lovell, S.; Veatch, O.J.; Butler, M.G. PHIP Gene Variants with Protein Modeling, Interactions, and Clinical Phenotypes. Am. J. Med. Genet. Part A 2022, 188, 579–589. [Google Scholar] [CrossRef] [PubMed]
- Ferdinand, P.; Roffe, C. Hypoxia after Stroke: A Review of Experimental and Clinical Evidence. Exp. Transl. Stroke Med. 2016, 8, 9. [Google Scholar] [CrossRef] [PubMed]
- Zhao, H.; Li, F.; Huang, Y.; Zhang, S.; Li, L.; Yang, Z.; Wang, R.; Tao, Z.; Han, Z.; Fan, J.; et al. Prognostic Significance of Plasma IL-2 and SIL-2Rα in Patients with First-Ever Ischaemic Stroke. J. Neuroinflamm. 2020, 17, 237. [Google Scholar] [CrossRef] [PubMed]
- Lasek-Bal, A.; Jedrzejowska-Szypulka, H.; Student, S.; Warsz-Wianecka, A.; Zareba, K.; Puz, P.; Bal, W.; Pawletko, K.; Lewin-Kowalik, J. The Importance of Selected Markers of Inflammation and Blood-Brain Barrier Damage for Short-Term Ischemic Stroke Prognosis. J. Physiol. Pharmacol. 2019, 70, 209–217. [Google Scholar] [CrossRef]
- Villa-González, M.; Martín-López, G.; Pérez-Álvarez, M.J. Dysregulation of MTOR Signaling after Brain Ischemia. Int. J. Mol. Sci. 2022, 23, 2814. [Google Scholar] [CrossRef]
- Cuartero, M.I.; García-Culebras, A.; Torres-López, C.; Medina, V.; Fraga, E.; Vázquez-Reyes, S.; Jareño-Flores, T.; García-Segura, J.M.; Lizasoain, I.; Moro, M.Á. Post-Stroke Neurogenesis: Friend or Foe? Front. Cell Dev. Biol. 2021, 9, 613. [Google Scholar] [CrossRef]
- Zhu, Z.; Ge, M.; Li, C.; Yu, L.; Gu, Y.; Hu, Y.; Cao, Z. Effects of P38 MAPK Signaling Pathway on Cognitive Function and Recovery of Neuronal Function after Hypoxic-Ischemic Brain Injury in Newborn Rats. J. Clin. Neurosci. 2020, 78, 365–370. [Google Scholar] [CrossRef]
- Ahmed, H.A.; Ishrat, T.; Pillai, B.; Fouda, A.Y.; Sayed, M.A.; Eldahshan, W.; Waller, J.L.; Ergul, A.; Fagan, S.C. RAS Modulation Prevents Progressive Cognitive Impairment after Experimental Stroke: A Randomized, Blinded Preclinical Trial. J. Neuroinflamm. 2018, 15, 229. [Google Scholar] [CrossRef]
- Almeida, A.; Sánchez-Morán, I.; Rodríguez, C. Mitochondrial–Nuclear P53 Trafficking Controls Neuronal Susceptibility in Stroke. IUBMB Life 2021, 73, 582–591. [Google Scholar] [CrossRef]
- Sil, S.; Periyasamy, P.; Thangaraj, A.; Chivero, E.T.; Buch, S. PDGF/PDGFR Axis in the Neural Systems. Mol. Aspects Med. 2018, 62, 63–74. [Google Scholar] [CrossRef]
- Gulati, A. Endothelin Receptors, Mitochondria and Neurogenesis in Cerebral Ischemia. Curr. Neuropharmacol. 2016, 14, 619–626. [Google Scholar] [CrossRef]
- Edwards, D.N.; Bix, G.J. The Inflammatory Response After Ischemic Stroke: Targeting Β2 and Β1 Integrins. Front. Neurosci. 2019, 13, 540. [Google Scholar] [CrossRef] [PubMed]
- Hayakawa, K.; Seo, J.H.; Miyamoto, N.; Pham, L.-D.D.; Navaratna, D.; Lo, E.H.; Arai, K. Brain Angiogenesis After Stroke. In Biochemical Basis and Therapeutic Implications of Angiogenesis; Springer International Publishing: Cham, Switzerland, 2017; pp. 473–494. [Google Scholar]
- Yeh, E.T.H.; Chang, H.M. Cancer and Clot: Between a Rock and a Hard Place. J. Am. Coll. Cardiol. 2017, 70, 939–941. [Google Scholar] [CrossRef] [PubMed]
- Demers, M.; Wagner, D.D. NETosis: A New Factor in Tumor Progression and Cancer-Associated Thrombosis. Semin. Thromb. Hemost. 2014, 40, 277–283. [Google Scholar] [CrossRef] [PubMed]
- Riedl, J.; Preusser, M.; Nazari, P.M.S.; Posch, F.; Panzer, S.; Marosi, C.; Birner, P.; Thaler, J.; Brostjan, C.; Lötsch, D.; et al. Podoplanin Expression in Primary Brain Tumors Induces Platelet Aggregation and Increases Risk of Venous Thromboembolism. Blood 2017, 129, 1831–1839. [Google Scholar] [CrossRef] [PubMed]
- Subramanian, A.; Tamayo, P.; Mootha, V.K.; Mukherjee, S.; Ebert, B.L.; Gillette, M.A.; Paulovich, A.; Pomeroy, S.L.; Golub, T.R.; Lander, E.S.; et al. Gene Set Enrichment Analysis: A Knowledge-Based Approach for Interpreting Genome-Wide Expression Profiles. Proc. Natl. Acad. Sci. USA 2005, 102, 15545–15550. [Google Scholar] [CrossRef] [PubMed]
- Liberzon, A.; Birger, C.; Thorvaldsdóttir, H.; Ghandi, M.; Mesirov, J.P.; Tamayo, P. The Molecular Signatures Database HALLMARK Gene Set Collection. Cell Syst. 2015, 1, 417–425. [Google Scholar] [CrossRef]
- Livak, K.J.; Schmittgen, T.D. Analysis of Relative Gene Expression Data Using Real-Time Quantitative PCR and the 2−ΔΔCT Method. Methods 2001, 25, 402–408. [Google Scholar] [CrossRef] [PubMed]
- Ru, Y.; Kechris, K.J.; Tabakoff, B.; Hoffman, P.; Radcliffe, R.A.; Bowler, R.; Mahaffey, S.; Rossi, S.; Calin, G.A.; Bemis, L.; et al. The MultiMiR R Package and Database: Integration of MicroRNA-Target Interactions along with Their Disease and Drug Associations. Nucleic Acids Res. 2014, 42, 133. [Google Scholar] [CrossRef]
- Liberzon, A.; Subramanian, A.; Pinchback, R.; Thorvaldsdottir, H.; Tamayo, P.; Mesirov, J.P. Molecular Signatures Database (MSigDB) 3.0. Bioinformatics 2011, 27, 1739–1740. [Google Scholar] [CrossRef] [PubMed]
- Ashburner, M.; Ball, C.A.; Blake, J.A.; Botstein, D.; Butler, H.; Cherry, J.M.; Davis, A.P.; Dolinski, K.; Dwight, S.S.; Eppig, J.T.; et al. Gene Ontology: Tool for the Unification of Biology. The Gene Ontology Consortium. Nat. Genet. 2000, 25, 25–29. [Google Scholar] [CrossRef] [PubMed]
- Carbon, S.; Douglass, E.; Good, B.M.; Unni, D.R.; Harris, N.L.; Mungall, C.J.; Basu, S.; Chisholm, R.L.; Dodson, R.J.; Hartline, E.; et al. The Gene Ontology Resource: Enriching a GOld Mine. Nucleic Acids Res. 2021, 49, D325–D334. [Google Scholar] [CrossRef]
- Mi, H.; Muruganujan, A.; Thomas, P.D. PANTHER in 2013: Modeling the Evolution of Gene Function, and Other Gene Attributes, in the Context of Phylogenetic Trees. Nucleic Acids Res. 2013, 41, D377–D386. [Google Scholar] [CrossRef]
- Thomas, P.D.; Ebert, D.; Muruganujan, A.; Mushayahama, T.; Albou, L.; Mi, H. PANTHER: Making Genome-scale Phylogenetics Accessible to All. Protein Sci. 2022, 31, 8–22. [Google Scholar] [CrossRef] [PubMed]
- Kanehisa, M.; Sato, Y.; Kawashima, M. KEGG Mapping Tools for Uncovering Hidden Features in Biological Data. Protein Sci. 2022, 31, 47–53. [Google Scholar] [CrossRef]
- Kanehisa, M.; Sato, Y. KEGG Mapper for Inferring Cellular Functions from Protein Sequences. Protein Sci. 2020, 29, 28–35. [Google Scholar] [CrossRef]
- Huang, D.W.; Sherman, B.T.; Lempicki, R.A. Bioinformatics Enrichment Tools: Paths toward the Comprehensive Functional Analysis of Large Gene Lists. Nucleic Acids Res. 2009, 37, 1–13. [Google Scholar] [CrossRef]
- Wiebe, D.S.; Omelyanchuk, N.A.; Mukhin, A.M.; Grosse, I.; Lashin, S.A.; Zemlyanskaya, E.V.; Mironova, V.V. Fold-Change-Specific Enrichment Analysis (FSEA): Quantification of Transcriptional Response Magnitude for Functional Gene Groups. Genes 2020, 11, 434. [Google Scholar] [CrossRef]
- Jain, A.; Tuteja, G. TissueEnrich: Tissue-Specific Gene Enrichment Analysis. Bioinformatics 2019, 35, 1966–1967. [Google Scholar] [CrossRef]
- Xu, X.; Wells, A.B.; O’Brien, D.R.; Nehorai, A.; Dougherty, J.D. Cell Type-Specific Expression Analysis to Identify Putative Cellular Mechanisms for Neurogenetic Disorders. J. Neurosci. 2014, 34, 1420–1431. [Google Scholar] [CrossRef]
- Dougherty, J.D.; Schmidt, E.F.; Nakajima, M.; Heintz, N. Analytical Approaches to RNA Profiling Data for the Identification of Genes Enriched in Specific Cells. Nucleic Acids Res. 2010, 38, 4218–4230. [Google Scholar] [CrossRef] [PubMed]
- Miller, J.A.; Ding, S.-L.; Sunkin, S.M.; Smith, K.A.; Ng, L.; Szafer, A.; Ebbert, A.; Riley, Z.L.; Royall, J.J.; Aiona, K.; et al. Transcriptional Landscape of the Prenatal Human Brain. Nature 2014, 508, 199–206. [Google Scholar] [CrossRef] [PubMed]
- Ge, S.X.; Jung, D.; Yao, R. ShinyGO: A Graphical Gene-Set Enrichment Tool for Animals and Plants. Bioinformatics 2020, 36, 2628–2629. [Google Scholar] [CrossRef] [PubMed]
- Wells, A.; Kopp, N.; Xu, X.; O’Brien, D.R.; Yang, W.; Nehorai, A.; Adair-Kirk, T.L.; Kopan, R.; Dougherty, J.D. The Anatomical Distribution of Genetic Associations. Nucleic Acids Res. 2015, 43, 10804–10820. [Google Scholar] [CrossRef] [PubMed]

| Parameter | Patients, n = 5 |
|---|---|
| Age, mean., med. [ref.] | 66.6, 64 [50–82] |
| Occluded artery | |
| MCA right | 3 (60%) |
| ICA left | 2 (40%) |
| rtPA | 4 (80%) |
| OCSP_TACI | 5 (100%) |
| TOAST_A | 3 (60%) |
| TOAST_C | 2 (40%) |
| MT | |
| Stent retriever | 4 (80%) |
| Aspiration | 1 (20%) |
| Stroke onset–groin puncture, mean [ref.] min. | 270 [210–360] |
| TICI | |
| 1 | 0 |
| 1a | 0 |
| 2b | 2 (40%) |
| 3 | 3 (60%) |
| AF | 2 (40%) |
| AH | 5 (100%) |
| DM | 2(40%) |
| CAD | 2 (40%) |
| PAD | 1 (20%) |
| LD | 1 (20%) |
| RBC_1 | 4.32 × 10⁶/μL [4.00–5.00] |
| WBC_1 | 10.72 × 10³/μL [4.00–10.00] |
| Lymphocyte_1 | 1.89 × 10³/μL [1.00–4.50] |
| Neutrophile_1 | 8.39 × 10³/μL [2.00–6.14] |
| Basophile_1 | 0.03 × 10³/μL [0.00–0.10] |
| Eosinophile_1 | 0.08 × 10³/μL [0.05–0.50] |
| PLT_1 | 197 × 103/μL [135–350] |
| HCT_1 | 35.88% [36.00–47.00] |
| Hb_1 | 12.24 g/dL [12.00–16.00] |
| Creatinine | 0.57 mg/dL [0.51–0.95] |
| eGFR | 89 mL/min/1.73 m2 [>60] |
| CRP | 13.0 mg/l [<5.0] |
| RBC_10 | 4.20 × 10⁶/μL [4.00–5.00] |
| WBC_10 | 8.83 × 10⁶/μL [4.00–10.00] |
| PLT_10 | 320 × 103/μL [135–350] |
| HCT_10 | 36.20% [36.00–47.00] |
| Hb_10 | 12.35 g/dL [12.00–16.00] |
| Smoking | 1 (20%) |
| NIHSS_1 med. [ref.] | 13 [5–19] |
| NIHSS_2 | 13 [6–18] |
| NIHSS_10 | 8 [0–16] |
| mRS_dis | 3 [0–4] |
| mRS_3m | 3 [0–5] |
| Parameter | Patients, n = 5 |
| Age, mean., med. [ref.] | 66.6, 64 [50–82] |
| Occluded artery | |
| MCA right | 3 (60%) |
| ICA left | 2 (40%) |
| rtPA | 4 (80%) |
| OCSP_TACI | 5 (100%) |
| TOAST_A | 3 (60%) |
| TOAST_C | 2 (40%) |
| MT | |
| Stent retriever | 4 (80%) |
| Aspiration | 1 (20%) |
| Stroke onset–groin puncture, mean [ref.] min. | 270 [210–360] |
| TICI | |
| 1 | 0 |
| 1a | 0 |
| 2b | 2 (40%) |
| 3 | 3 (60%) |
| AF | 2 (40%) |
| AH | 5 (100%) |
| DM | 2(40%) |
| CAD | 2 (40%) |
| PAD | 1 (20%) |
| LD | 1 (20%) |
| RBC_1 | 4.32 × 10⁶/μL [4.00–5.00] |
| WBC_1 | 10.72 × 10³/μL [4.00–10.00] |
| Lymphocyte_1 | 1.89 × 10³/μL [1.00–4.50] |
| Neutrophile_1 | 8.39 × 10³/μL [2.00–6.14] |
| Basophile_1 | 0.03 × 10³/μL [0.00–0.10] |
| Eosinophile_1 | 0.08 × 10³/μL [0.05–0.50] |
| PLT_1 | 197 × 103/μL [135–350] |
| HCT_1 | 35.88% [36.00–47.00] |
| Hb_1 | 12.24 g/dL [12.00–16.00] |
| Creatinine | 0.57 mg/dL [0.51–0.95] |
| eGFR | 89 mL/min/1.73 m2 [>60] |
| CRP | 13.0 mg/l [<5.0] |
| RBC_10 | 4.20 × 10⁶/μL [4.00–5.00] |
| WBC_10 | 8.83 × 10⁶/μL [4.00–10.00] |
| PLT_10 | 320 × 103/μL [135–350] |
| HCT_10 | 36.20% [36.00–47.00] |
| Hb_10 | 12.35 g/dL [12.00–16.00] |
| Smoking | 1 (20%) |
| NIHSS_1 med. [ref.] | 13 [5–19] |
| NIHSS_2 | 13 [6–18] |
| NIHSS_10 | 8 [0–16] |
| mRS_dis | 3 [0–4] |
| mRS_3m | 3 [0–5] |
| Parameter | Patients, n = 38 |
|---|---|
| Age, mean., med. [ref.] | 66.6, 64 [50–82] |
| Occluded artery | |
| MCA right | 7 (18.42%) |
| MCA left | 20 (52.63%) |
| ICA left | 4 (10.53%) |
| PCA left | 1 (2.63%) |
| VA right | 1(2.63%) |
| No occlusion | 5 (13.16%) |
| rtPA | 28 (73.7%) |
| OCSP_TACI | 12 (31.58%) |
| OCSP_PACI | 21 (55.26%) |
| OCSP_LACI | 3 (7.89%) |
| OCSP_POCI | 2 (5.26%) |
| TOAST_A | 14 (36.84%) |
| TOAST_C | 11 (28.95%) |
| TOAST_S | 11 (28.95%) |
| TOAST_U | 2 (5.26%) |
| MT | |
| Stent retriever | 18 (47.37%) |
| Aspiration | 8 (21.05%) |
| Stroke onset–groin puncture, mean [ref.] min. | 282 [145–360] |
| TICI | |
| 0 | 2 (5.26%) |
| 2C | 1 (2.63%) |
| 3 | 23 (60.53%) |
| AF | 16 (42.11%) |
| AH | 36 (94.74%) |
| DM | 16 (42.11%) |
| CAD | 17 (44.74%) |
| PAD | 14 (36.84%) |
| LD | 23 (60.52%) |
| RBC_1 | 4,03 × 10⁶/μL [4.00–5.00] |
| WBC_1 | 8,44 × 10³/μL [4.00–10.00] |
| Lymphocyte_1 | 1.36 × 10³/μL [1.00–4.50] |
| Neutrophile_1 | 6.09 × 10³/μL [2.00–6.14] |
| Basophile_1 | 0.03 × 10³/μL [0.00–0.10] |
| Eosinophile_1 | 0.04 × 10³/μL [0.05–0.50] |
| PLT_1 | 201 × 103/μL [135–350] |
| HCT_1 | 36.95% [36.00–47.00] |
| Hb_1 | 12.9 g/dL [12.00–16.00] |
| creatinine | 0.87 mg/dL [0.51–0.95] |
| eGFR | 83 mL/min/1.73 m2 [>60] |
| CRP | 9.4 mg/L [<5.0] |
| RBC_10 | 4.06 × 10⁶/μL [4.00–5.00] |
| WBC_10 | 7.8 × 10⁶/μL [4.00–10.00] |
| PLT_10 | 228 × 103/μL [135–350] |
| HCT_10 | 36.75% [36.00–47.00] |
| Hb_10 | 12.6 g/dL [12.00–16.00] |
| Smoking | 12 (31.59%) |
| Statins | 15 (39.5%) |
| ASA | 9 (23.7%) |
| DAPT | 3 (7.9%) |
| VKA | 5 (13.16%) |
| NIHSS_1 med. [ref.] | 12 [1–28] |
| NIHSS_2 | 4.5 [0–28] |
| NIHSS_10 | 2 [0–24] |
| mRS_dis | 2 [0–6] |
| mRS_3m | 2 [0–6] |
| miRNA | Sequence |
|---|---|
| miR-9-3p | 5′AUAAAGCUAGAUAACCGAAAGU |
| miR-9-5p | 5′UCUUUGGUUAUCUAGCUGUAUGA |
| miR-129-5p | 5′CUUUUUGCGGUCUGGGCUUGC |
Disclaimer/Publisher’s Note: The statements, opinions and data contained in all publications are solely those of the individual author(s) and contributor(s) and not of MDPI and/or the editor(s). MDPI and/or the editor(s) disclaim responsibility for any injury to people or property resulting from any ideas, methods, instructions or products referred to in the content. |
© 2024 by the authors. Licensee MDPI, Basel, Switzerland. This article is an open access article distributed under the terms and conditions of the Creative Commons Attribution (CC BY) license (https://creativecommons.org/licenses/by/4.0/).
Share and Cite
Gendosz de Carrillo, D.; Kocikowska, O.; Rak, M.; Krzan, A.; Student, S.; Jędrzejowska-Szypułka, H.; Pawletko, K.; Lasek-Bal, A. The Relevance of Reperfusion Stroke Therapy for miR-9-3p and miR-9-5p Expression in Acute Stroke—A Preliminary Study. Int. J. Mol. Sci. 2024, 25, 2766. https://doi.org/10.3390/ijms25052766
Gendosz de Carrillo D, Kocikowska O, Rak M, Krzan A, Student S, Jędrzejowska-Szypułka H, Pawletko K, Lasek-Bal A. The Relevance of Reperfusion Stroke Therapy for miR-9-3p and miR-9-5p Expression in Acute Stroke—A Preliminary Study. International Journal of Molecular Sciences. 2024; 25(5):2766. https://doi.org/10.3390/ijms25052766
Chicago/Turabian StyleGendosz de Carrillo, Daria, Olga Kocikowska, Małgorzata Rak, Aleksandra Krzan, Sebastian Student, Halina Jędrzejowska-Szypułka, Katarzyna Pawletko, and Anetta Lasek-Bal. 2024. "The Relevance of Reperfusion Stroke Therapy for miR-9-3p and miR-9-5p Expression in Acute Stroke—A Preliminary Study" International Journal of Molecular Sciences 25, no. 5: 2766. https://doi.org/10.3390/ijms25052766
APA StyleGendosz de Carrillo, D., Kocikowska, O., Rak, M., Krzan, A., Student, S., Jędrzejowska-Szypułka, H., Pawletko, K., & Lasek-Bal, A. (2024). The Relevance of Reperfusion Stroke Therapy for miR-9-3p and miR-9-5p Expression in Acute Stroke—A Preliminary Study. International Journal of Molecular Sciences, 25(5), 2766. https://doi.org/10.3390/ijms25052766