Article

Arsenic Impairs Wound Healing Processes in Dermal Fibroblasts and Mice

by
Sara R. Dresler
1,
Bronson I. Pinto
1,
Matthew C. Salanga
1,
Catherine R. Propper
1,
Savannah R. Berry
1 and
Robert S. Kellar
1,2,*
1
Department of Biological Sciences, Northern Arizona University, Flagstaff, AZ 86011, USA
2
Center for Materials Interfaces in Research & Applications, ¡MIRA!, Flagstaff, AZ 86011, USA
*
Author to whom correspondence should be addressed.
Int. J. Mol. Sci. 2024, 25(4), 2161; https://doi.org/10.3390/ijms25042161
Submission received: 5 December 2023 / Revised: 3 February 2024 / Accepted: 7 February 2024 / Published: 10 February 2024
(This article belongs to the Special Issue Cutaneous Biology, Molecular Dermatology and Dermatopathology)

Abstract

:
Inorganic arsenic (NaAsO2) is a naturally occurring metalloid found in water resources globally and in the United States at concentrations exceeding the U.S. Environmental Protection Agency Maximum Contamination Level of 10 ppb. While exposure to arsenic has been linked to cancer, cardiovascular disease, and skin lesions, the impact of arsenic exposure on wound healing is not fully understood. Cultured dermal fibroblasts exposed to NaAsO2 displayed reduced migration (scratch closure), proliferation, and viability with a lowest observable effect level (LOEL) of 10 µM NaAsO2 following 24 h exposure. An enrichment of Matrix Metalloproteinase 1 (MMP1) transcripts was observed at a LOEL of 1 µM NaAsO2 and 24 h exposure. In vivo, C57BL/6 mice were exposed to 10 µM NaAsO2 in their drinking water for eight weeks, then subjected to two full thickness dorsal wounds. Wounds were evaluated for closure after 6 days. Female mice displayed a significant reduction in wound closure and higher erythema levels, while males showed no effects. Gene expression analysis from skin excised from the wound site revealed significant enrichment in Arsenic 3-Methyltransferase (As3mt) and Estrogen Receptor 2 (Esr2) mRNA in the skin of female mice. These results indicate that arsenic at environmentally relevant concentrations may negatively impact wound healing processes in a sex-specific manner.

1. Introduction

Arsenic is a well-documented environmental human health hazard, with chronic ingestion of contaminated drinking water being the most prevalent route of exposure [1,2,3,4]. In 2000, approximately 50 million Bangladesh citizens were exposed to high levels of arsenic by way of contaminated drinking water, which was considered the largest population-level poisoning in history [5]. As a result of large-scale contaminations, such as happened in Bangladesh, the World Health Organization (WHO) and the United States Environmental Protection Agency (USEPA) established a maximum contaminant level (MCL) in drinking water of 10 µg/L (10 ppb) in 2003, which was lowered from the previous MCL of 50 µg/L [6,7].
Although the MCL was lowered in 2003, many water resources in the USA still exceed 10 ppb. In the southwest United States, numerous groundwater, well water, and springs have been documented with concerning levels of arsenic [8]. For example, in Verde Valley, AZ, Montezuma Well contains 210 µg/L (210 ppb) of arsenic [9], groundwater around the Verde River, AZ, contains 16 µg/L (16 ppb) of arsenic on average, with peak values reaching 1.3 mg/L (1.3 ppm) [10]. Notably, many wells in the Verde Valley exceed 50 µg/L (50 ppb) [11]. Similar exceedances occur across Arizona [12].
While exposure to arsenic at or below the MCL is considered safe by some authorities, studies have shown detrimental results from chronic arsenic exposure below the MCL, including prostate cancer [13], diabetes [14,15,16], cardiovascular diseases [17,18,19], and disrupted microbiomes in non-human organisms such as zebrafish [20]. A 2010 review described arsenic-induced shifts in the expression of genes responsible for numerous cellular processes, including oxidative stress, inflammation, proteotoxicity, proliferation, DNA repair, cell cycle control, and apoptosis [21]. Wound healing requires the orchestration of several of these processes and, therefore, could be at risk for disruption from arsenic exposure.
Exposure to very high concentrations of arsenic, such as those found in the Bangladesh disaster, increases the risk of dermal skin lesions, leaving chronically exposed populations at risk for subsequent co-morbidities associated with open skin wounds [22,23,24]. Moreover, arsenic impairs dermal fibroblast viability [25] and functions such as cellular migration, and proliferation, which are key components in wound closure [26,27]. These studies suggest that arsenic disrupts skin homeostasis, which may lead to poor wound healing outcomes, and places chronically exposed populations at higher risk for infections in healing wounds.
Toxic metalloids, such as arsenic, have the potential to interact with endogenous hormones and can disrupt cellular signaling. Hormonal influences, especially estrogen, are imperative to the proper healing of wounds [28]. Estrogen prohibits excessive recruitment of neutrophils to the wound site post-wound bed clearance [29] in an anti-inflammatory role that contributes to normal wound healing. Arsenic has been shown to bind to estrogen [30], potentially limiting its availability at the receptor, and low dose exposure to arsenic inhibits estrogen-regulated gene expression both in vitro and in vivo [31]. These studies suggest that arsenic exposure may inhibit the estrogenic effects on wound healing and impart a greater risk of developing chronic wounds. While the effects of estrogen on arsenic-exposed dermal fibroblasts have been described previously [26], the effects of these complex interactions have not been studied in vivo, which is imperative to understanding how wound healing can be influenced.
In the current studies, the effects of environmentally relevant concentrations of sodium arsenite (NaAsO2) on dermal fibroblast scratch closure, metabolic activity, viability, and gene expression were evaluated. In addition, the impacts of NaAsO2 exposure on wound healing components, including wound closure, wound erythema, and gene expression were investigated in vivo using a murine full-thickness wound model. These studies unmask the detriments of NaAsO2 on wound healing functions in both in vitro and in vivo models.

2. Results

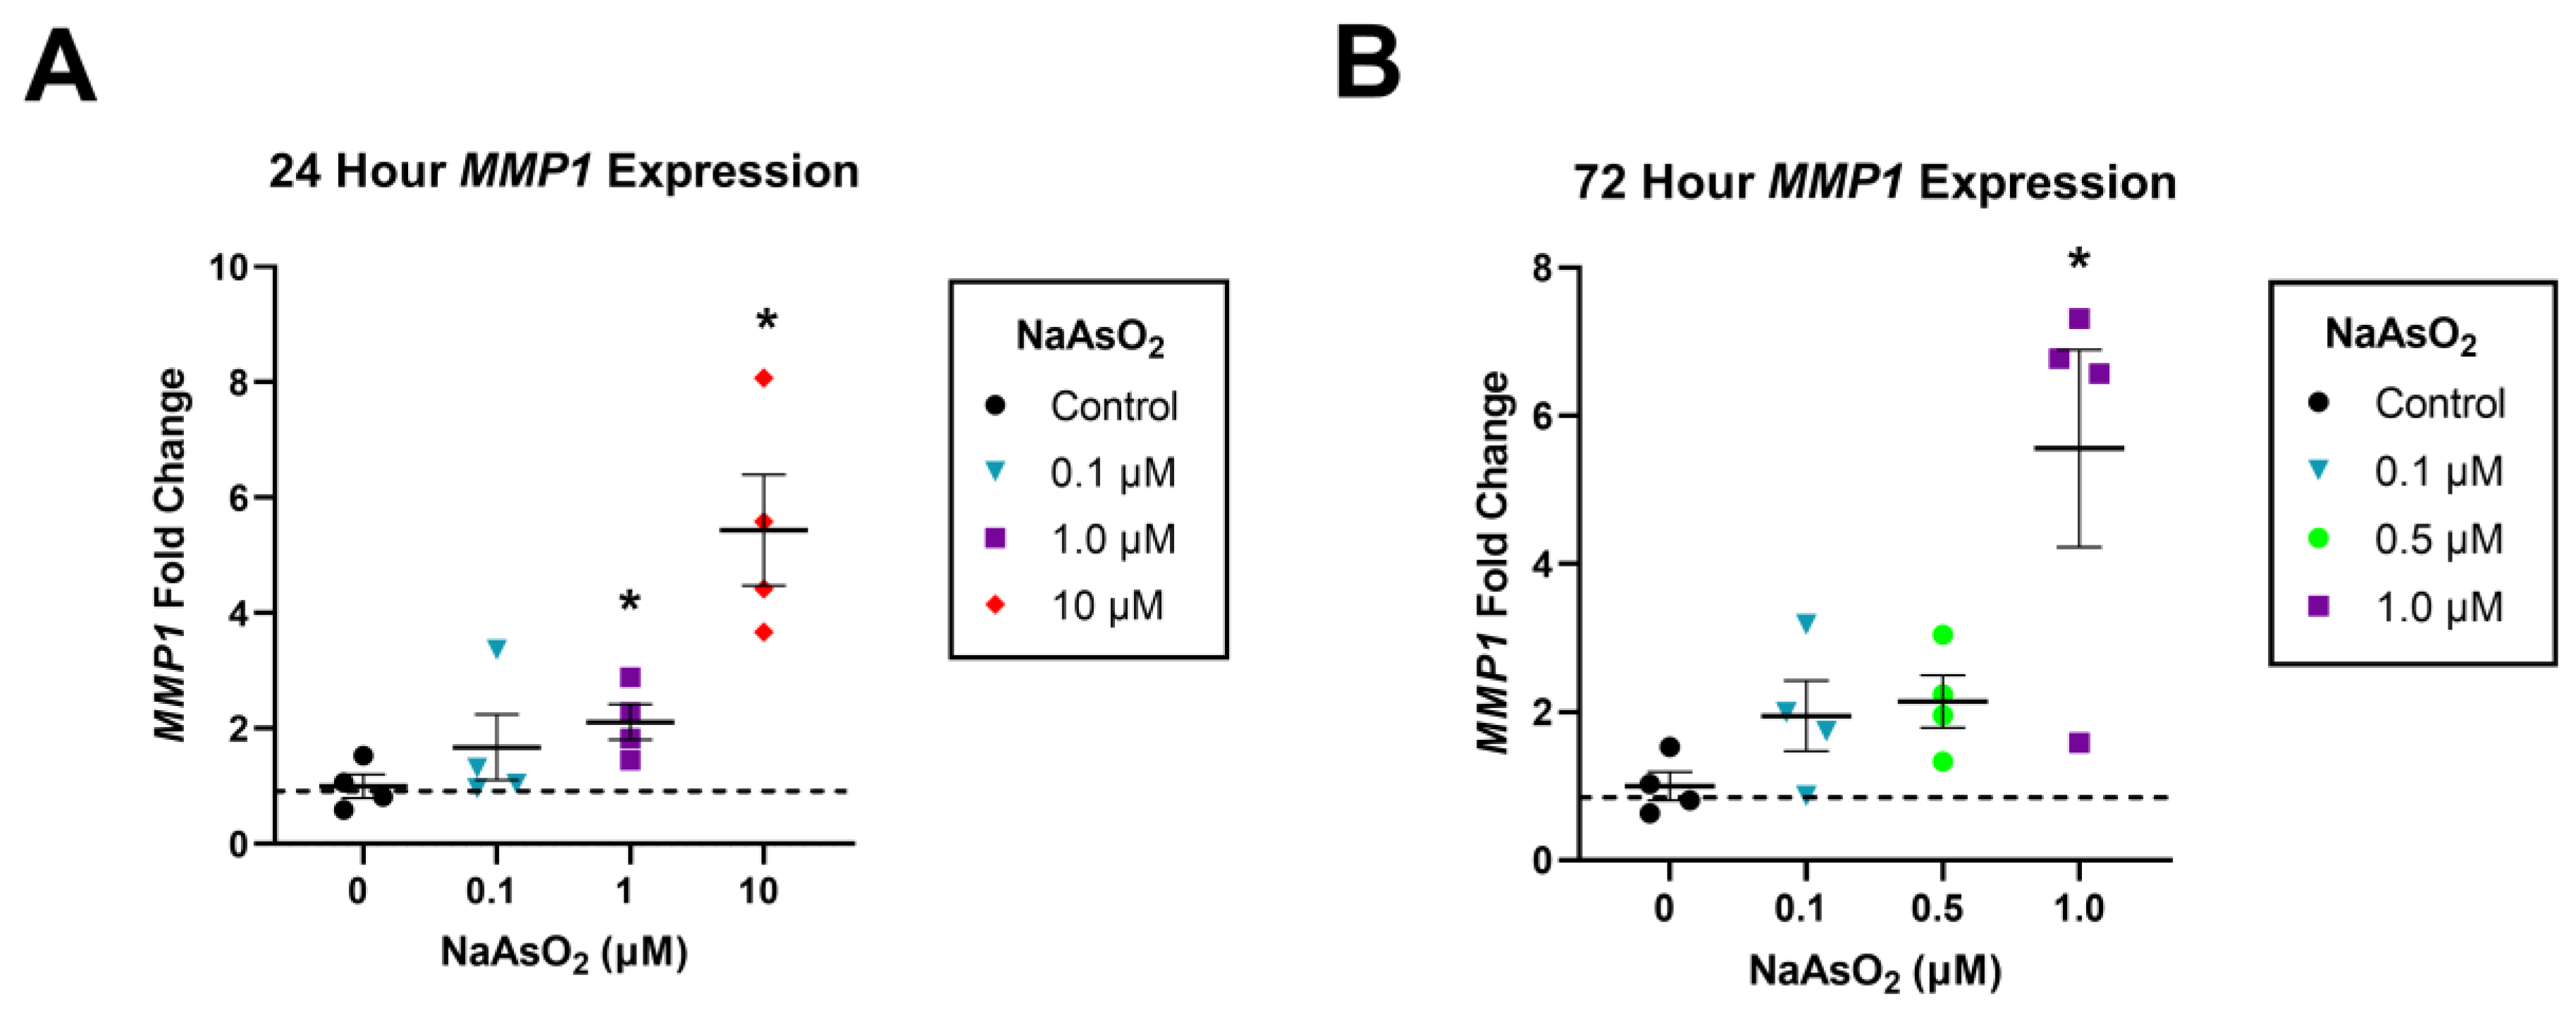
2.1. NaAsO2 Exposure Impairs Scratch Closure and Upregulates MMP1 in Cultured Dermal Fibroblasts

Arsenic slowed scratch closure in human dermal fibroblasts in both 24 and 72 h exposures. While a 24 h exposure to 1 µM NaAsO2 prior to scratching had little effect on scratch closure, 24 h exposure to 10 µM NaAsO2 prior to scratching significantly decreased scratch closure compared to control, and a LOEL was determined (n = 21, F = 53.58, p < 0.001; Figure 1A,B). A 72 h exposure to 1 µM NaAsO2 prior to scratching decreased scratch closure, although not significantly, while a 72 h exposure to 10 µM NaAsO2 was cytotoxic (n = 12, F = 2.51, p = 0.0512; Figure 1C,D).
Human dermal fibroblasts exposed to 1 and 10 µM NaAsO2 in the scratch assay additionally displayed an upregulation of MMP1 expression at 24 h (n = 4, F = 12.1, p < 0.001). A 24 h exposure to 1 µM NaAsO2 resulted in a 2.14-fold upregulation of MMP1 compared to control (Tukey’s, p < 0.05), and a 24 h exposure to 10 µM NaAsO2 led to a 5.4-fold upregulation of MMP1 compared to control (ANOVA, n = 4, F = 12.1, p < 0.001; Figure 2A). A 72 h exposure to 1 µM NaAsO2 resulted in a 5.56-fold upregulation of MMP1 compared to control, while a 72 h exposure to 10 µM NaAsO2 was cytotoxic (Tukey’s, p < 0.05; Figure 2B).

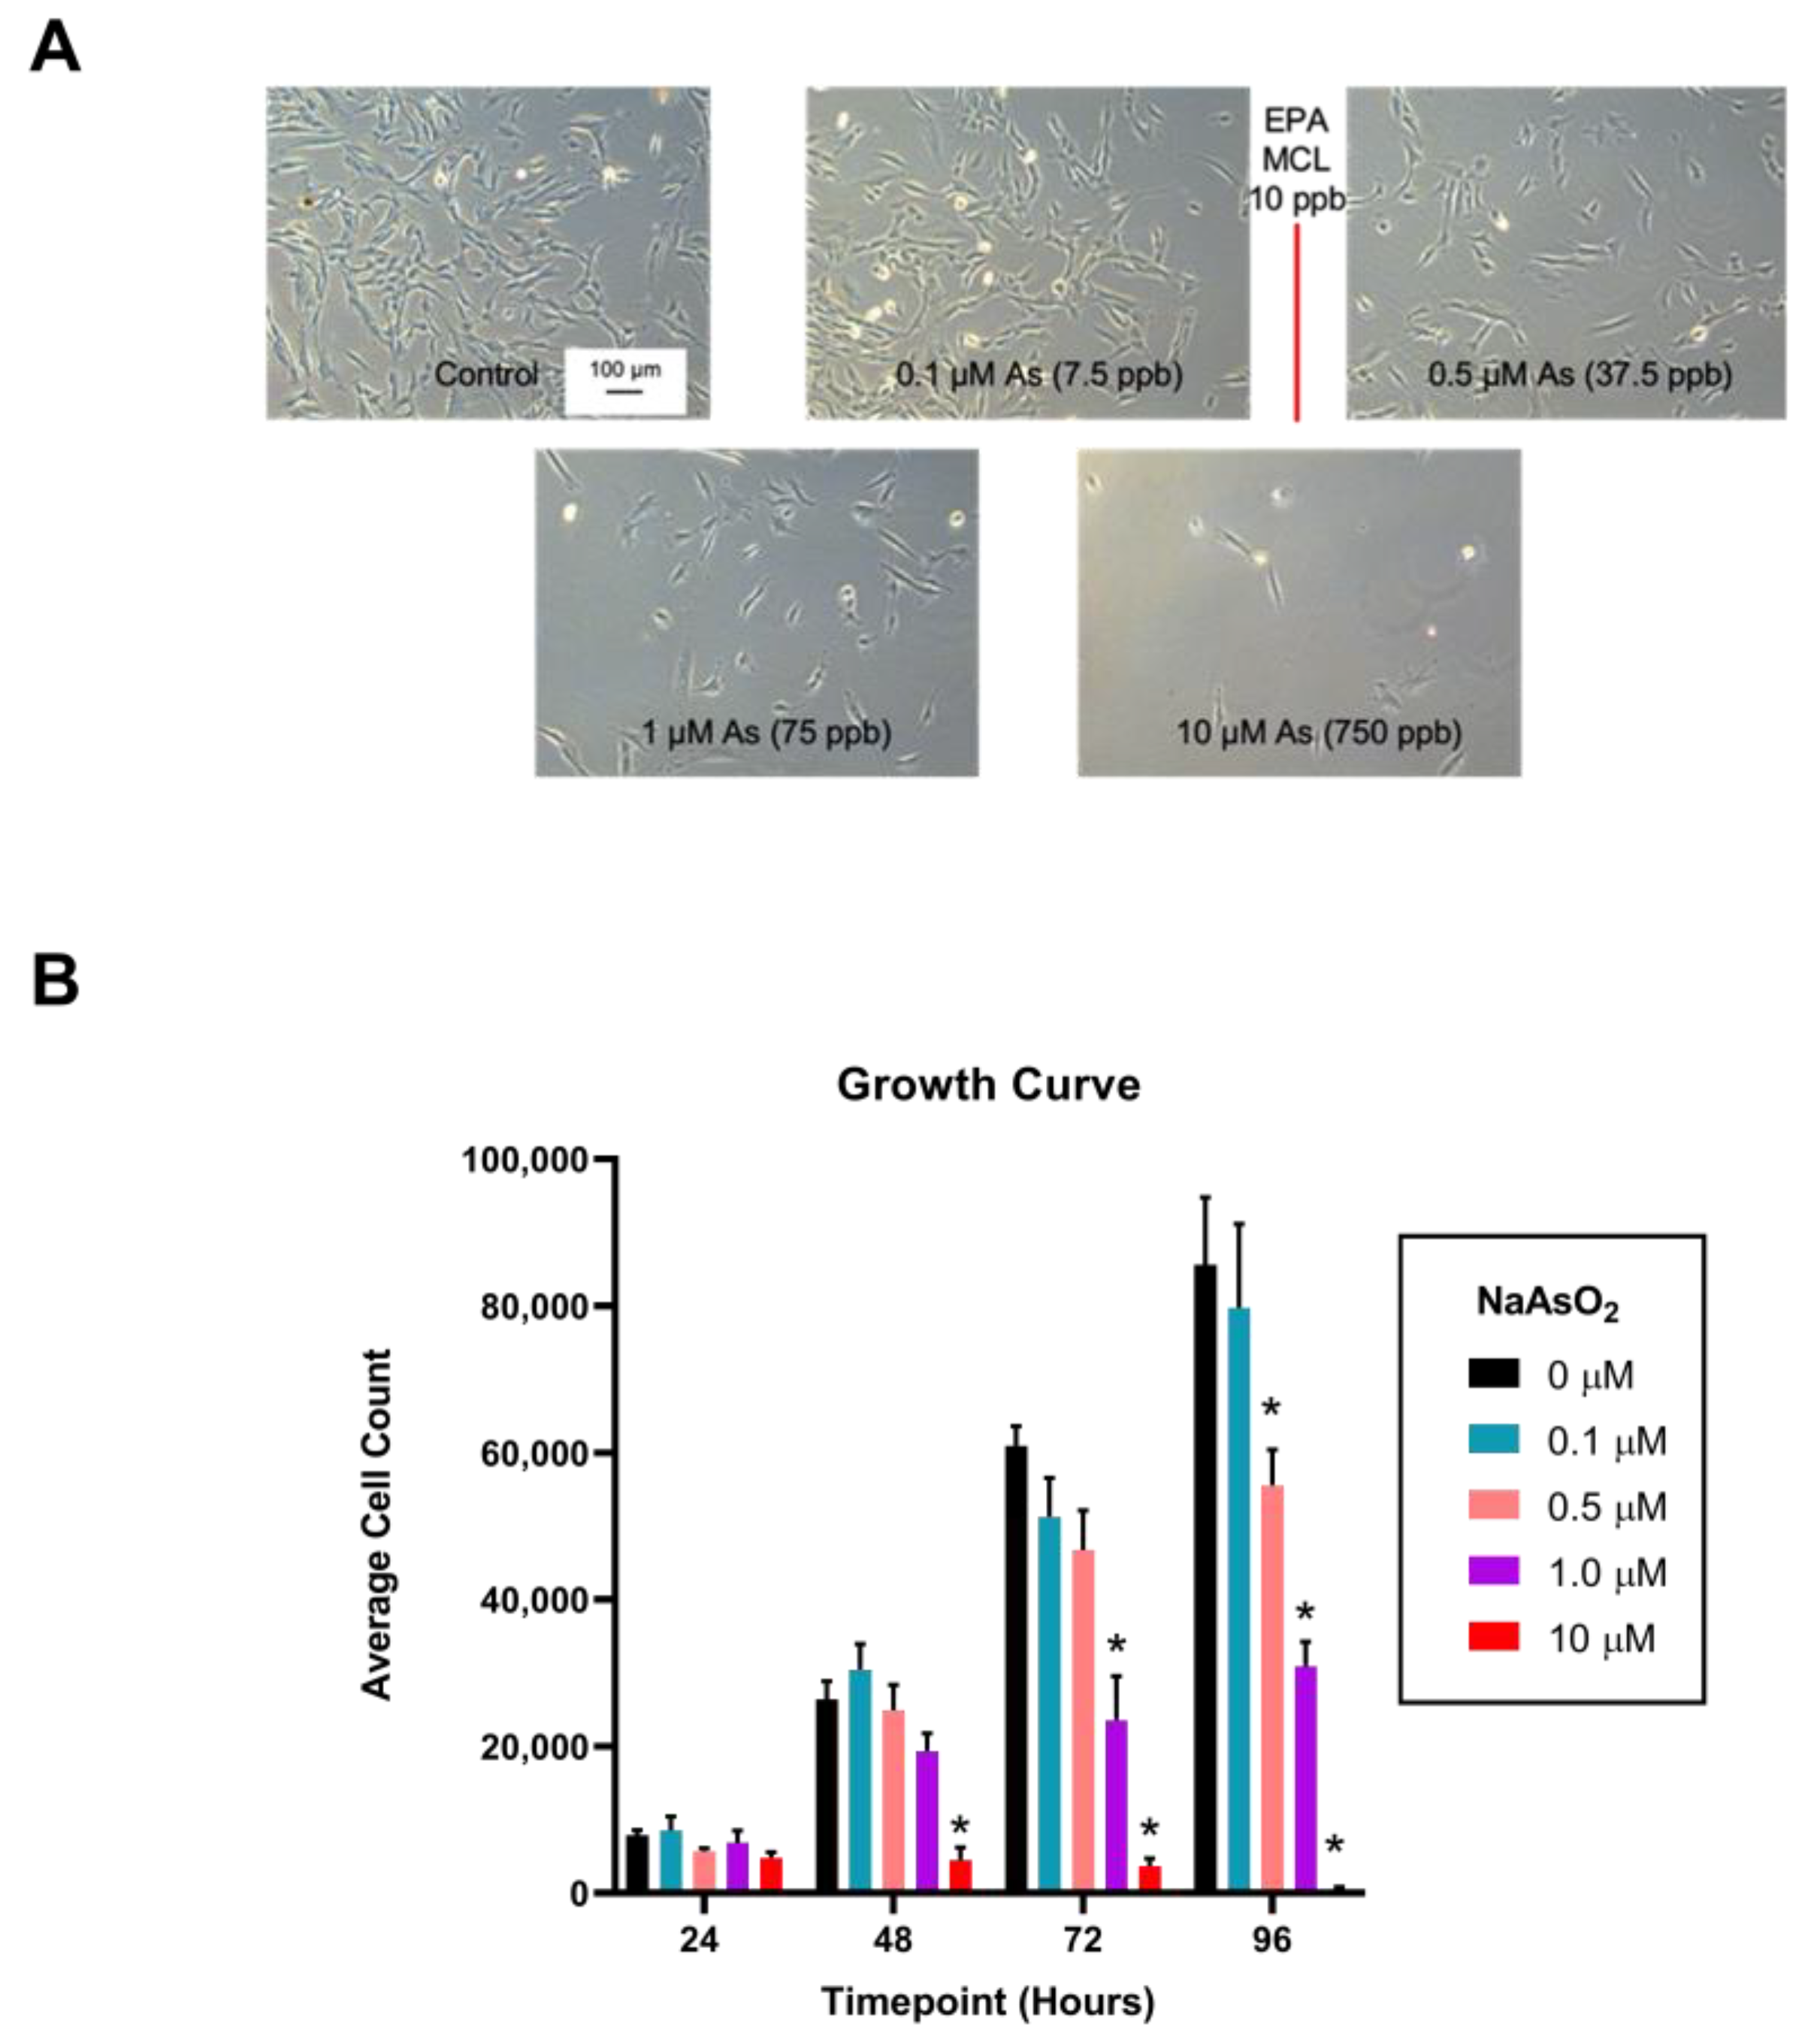
2.2. Exposure to NaAsO2 in Dermal Fibroblasts Alters Cell Morphology and Slows Proliferation

Arsenic exposure affected overall cellular appearance and growth of fibroblasts in a dose-dependent pattern. Control and 0.1 µM NaAsO2-exposed fibroblasts remained adherent and displayed spindle-like morphology with lamellipodial and filopodial extensions protruding outward from the cell body, indicative of a ‘normal’ cell. In contrast, the 0.5, 1, and 10 µM NaAsO2-treated cells appeared rounded in shape and were frequently observed suspended in the media indicating a loss of adherence (Figure 3A). Cell counting revealed lower population numbers after 48 h in the presence of 10 µM NaAsO2-treatment (n = 4, F = 12.86, p < 0.001), with reduced growth appearing at 72 h of exposure with 1 µM NaAsO2 (n = 4, F = 26.81, p < 0.05; Figure 3B). By 96 h, reduced cell growth was observed in the 0.5 µM NaAsO2-treatment (n = 4, F = 25.01, p < 0.01; Figure 3B). After 96 h of growth, the 0.5, 1, and 10 µM NaAsO2 treatments significantly slowed cellular proliferation with average cell counts of 55,527, 30,895, and 417, respectively, compared to control. After 144 h of growth, cellular proliferation contributed no further changes or return to baseline.

2.3. NaAsO2 Exposure for 24 h at the Time of Scratch Reduces Cell Metabolism and Alters DNA Quantity

While PrestoBlue is an indicator of viable DNA of all the cells in any one well, which under conditions of cell stress, such as occurs during exposure to toxicants, may not be a true measure of cell viability. Therefore, we used a combination of the PrestoBlue assay and the CyQuant assay, which is used as a proliferation assay for determining metabolic activity, and the combination of PrestoBlue and CyQuant as a measure of metabolism/living DNA to represent a cell metabolic index. Fibroblasts exposed to NaAsO2 for 24 h displayed a dose-dependent decrease in metabolism measured by PrestoBlue as treatment doses increased (n = 6, F = 29.19, p < 0.001, Tukey’s, p < 0.05; Figure 4A). While a 24 h exposure to NaAsO2 reduced metabolism, NaAsO2 treatment induced a non-monotonic dose response with increased proliferation at 0.1 µM, no effect at 1 µM, and decreased proliferation at higher doses compared to the control (n = 6, F = 131.9, p < 0.001; Tukey’s, p < 0.05; Figure 4B).

2.4. Exposure to NaAsO2 for 72 h Reduces Cell Metabolism and Alters DNA Quantity as a Measure of Viability

Fibroblasts exposed to NaAsO2 for 72 h displayed changes in cell metabolism measured by PrestoBlue at all treatment doses (n = 10, F = 2040.7, p < 0.001; Figure 4D; Tukey’s, p < 0.05). There was a dose-dependent decrease in viability with increasing NaAsO2 concentrations beginning at 1 µM (Tukey’s, p < 0.05; Figure 4D). However, there was an increase in viability in cells exposed to 0.1 µM NaAsO2 (Tukey’s, p < 0.05; Figure 4D).
Fibroblasts exposed to NaAsO2 for 72 h displayed changes in proliferation measured by CyQuant (n = 10, F = 2735.1, p < 0.001; Figure 4E). This exposure to NaAsO2 for 72 h resulted in a dose-dependent decrease in proliferation with increasing NaAsO2 concentrations beginning at 1 µM (Tukey’s, p < 0.05). Furthermore, increasing time of exposure from 24 to 72 h decreased the LOEL from 2.5 to 1 µM (Figure 4E).

2.5. Reduction in Metabolic Output Relative to Viable DNA Content after 24 and 72 h Exposure to NaAsO2

A non-monotonic dose-response was observed in which 24 h NaAsO2 exposures decreased cellular metabolic rate relative to viable DNA content at all treatment doses compared to control (n = 6, F = 7.58, p < 0.001; Tukey’s, p < 0.05; Figure 4C). Exposure to NaAsO2 for 72 h also affected metabolic output per unit of DNA (n = 10, F = 19.6, p < 0.001) but only at doses 2.5 µM and greater (Tukey’s, p < 0.05; Figure 4F).

2.6. Wound Healing Processes in Female Mice Are Negatively Affected by NaAsO2-Exposure

An 8-week exposure to 10 µM NaAsO2 in drinking water impeded wound closure in mice 6 days post-wounding (Chi2 = 13.3458; p = 0.0039, Figure 5A). Wound closure areas were significantly decreased in NaAsO2-treated females compared to control or NaAsO2-treated males (Z = 2.817; p = 0.0290) and control females (Z = −3.185; p = 0.0087; Figure 5A).
NaAsO2-treated female mice displayed increased wound erythema levels compared to all other groups (Figure 5B). A Kruskal Wallis test revealed a significant effect among all treatment groups (Chi2 = 9.456; p = 0.0238). Macroscopic observations revealed increased visual erythema in NaAsO2-treated female mice at day 6 with no difference observed in other treatment groups (Figure 5C). Water consumption was significantly higher in males vs. females (ANOVA, p < 0.0001) with post hoc tests revealing no difference between control and arsenic male mice (Dunn’s, p > 0.9999) and no difference between control and arsenic female mice (Dunn’s, ANOVA p = 0.1639).

2.7. Altered Gene Expression in Mouse Wound Biopsies due to NaAsO2-Exposure

An 8-week exposure to 10 µM NaAsO2 in drinking water altered gene expression in wound biopsies (Figure 6). One-way ANOVAs revealed significant differences in both As3mt (W = 12.20; p = 0.0008) and Esr2 expression (W = 19.30; p = 0.0002) across groups. As3mt was significantly upregulated in wounds of NaAsO2-treated females compared to control females, control males, and NaAsO2-treated males (n = 6; p < 0.0001; p < 0.0001; p = 0.0230, respectively). Esr2 was significantly upregulated in wounds of NaAsO2-treated females compared to control female and NaAsO2-treated male groups (n = 6; p = 0.006; p = 0.006, respectively). No significant differences in transcript levels were detected for Esr1, Gper1, Mmp1a, or Timp1 in wound sites (Figure 6).

3. Discussion

In the current study, arsenic (NaAsO2) exposure interfered with normal wound healing processes modeled using in vitro and in vivo experimental tests. In cell culture experiments, dermal fibroblasts exposed to environmentally relevant concentrations of NaAsO2 displayed slowed scratch closure, decreased cell proliferation, and decreased cell metabolism relative to viable DNA content. Increased transcription of MMP1 was detected in dermal fibroblasts exposed to NaAsO2. In mice, 10 µM NaAsO2 negatively impacted wound healing outcomes in female mice displaying slower wound closure and higher erythema scores. Increased transcription of Esr2 and As3mt were also measured in mouse wound biopsies. Here, we demonstrated the use of in vitro techniques to help guide study designs in an in vivo full thickness wound model where NaAsO2 exposure was found to impair wound healing functions and outcomes in both models.
Our results demonstrated that scratch closure, proliferation, metabolic activity, and cell viability of fibroblasts were detrimentally affected when exposed to environmentally relevant NaAsO2 concentrations. Altered fibroblast activity during the wound healing process may lead to poor wound healing outcomes, including an increased risk for non-healing wounds and infection [32,33]. In the scratch assay, NaAsO2 exposure at the time of scratching negatively impacted closure, and 72 h exposure to NaAsO2 prior to scratching exacerbated the effect, in some cases reducing the LOEL by 10-fold. This shift in exposure timing and LOEL suggests that long-term exposure to arsenic is more detrimental to cellular processes than short-term exposure.
Cellular proliferation was also impacted by NaAsO2 exposure, which was evident by the dose-dependent decline in cell counts. This trend was consistent with Xiong et al.’s findings of arsenic induced cell cycle arrest in neuroblastoma cells. This group treated cells with similar concentrations of As2O3 (1, 2, or 4 µM), in which 4 µM induced cell cycle arrest leading to decreased cellular proliferation [34].
The decrease in scratch closure and proliferation of continuously exposed fibroblasts were accompanied by decreased cellular metabolism relative to viable DNA content. The detrimental effects of NaAsO2 on metabolic activity and cell viability reported here were expected due to arsenic’s known affinity for thiol groups and disruption of sulfhydryl group-containing enzymes, many of which have prominent roles in several metabolic pathways [35]. In addition to decreases in cell metabolism, increased cell death due to NaAsO2 exposure has been previously described. One study found that exposure to low-dose NaAsO2 (0.5 µM) exhibited cytotoxic effects both acutely and chronically in lung fibroblasts [36], and our dermal fibroblast viability results were consistent with their studies. Interestingly, 0.1 µM NaAsO2 slightly increased proliferation and metabolism in our study. Low levels of arsenic may induce these changes through a variety of pathways, which may include a non-detectable change in oxidative stress and reduced cell autophagy [37]. Like most toxicants, effects of arsenic are likely concentration-dependent, in which increasing concentrations no longer provide stimulatory changes, but rather detrimental consequences [38].
While other matrix remodeling genes were analyzed in this study (not published), only MMP1 was significantly upregulated in dermal fibroblasts. MMP1 transcript levels were enriched in NaAsO2-treated fibroblasts, which was consistent with a reported significant upregulation of MMP1 gene expression, however, in human uroepithelial cells (SV-HUC-1) exposed to arsenic [39]. MMP1 functions to remodel the extracellular matrix (ECM) of a healing wound through proteolytic digestion of collagen, which then stimulates fibroblasts to lay down new collagen for cell adherence and subsequent cellularization [40,41]. The dynamic process of ECM remodeling by dermal fibroblasts during tissue remodeling is a delicate balance of collagen deposition and MMP1 enzymatic digestion. For example, increased collagen deposition during the final stages of wound healing can lead to hypertrophic scarring or the formation of a keloid scar [42]. In contrast, elevated levels of MMP1 are implicated in the pathogenesis of chronic wounds; therefore, results from the current study suggest that arsenic may play a role in the pathogenesis of chronic wound formation in individuals who are repeatedly exposed for extended periods [43,44].
While NaAsO2 impeded fibroblast functions, multiple cell types, including epithelial cells, fibroblasts, and leukocytes, work together to close and remodel wounds in a living organism. The effects of NaAsO2 were further explored in a full thickness wound model in mice to evaluate if in vitro findings translated to in vivo models. Exposure to 10 µM (10 ppb) NaAsO2 for 8 weeks diminished wound closure and increased erythema in female mice, with no visual detriments observed in male mice. Sex differences were seen in wound healing for both gross evaluations and gene expression analysis, which suggests disrupted hormone signaling. Additionally, water consumption in our study was significantly different between male and female mice, but not within treatment groups. Sex difference results were expected and have been reported in the literature previously [45]. Water consumption data in our study may have been influenced by a variety of variables including cage movement and water leakage during water changes.
Hormone signaling plays an imperative role in cell communication, specifically in wound healing. Under normal inflammatory processes, neutrophils are rapidly recruited to the wound site in a spatial pattern surrounding the wound [46] and undergo apoptosis after wound bed clearance [47], which slows the recruitment of additional neutrophils. Estrogen inhibits excessive neutrophil recruitment by upregulating mitogen-activated protein kinase phosphatase 2 (MKP-2) [29], and by reducing leukocyte interleukin-1β (IL-1β) secretion [29,48,49]. Because of arsenic’s affinity for endogenous estrogen [30], the presence of NaAsO2 in our study may have inhibited estrogen’s ability to promote normal wound healing in female mice.
There is evidence that arsenic acts as an endocrine disruptor through several potential molecular mechanisms. Arsenic binds to estrogen directly [30], and many studies have investigated the endocrine disrupting properties of arsenic [50,51,52,53]; however, there is limited literature regarding arsenic–estrogen interactions in skin. In the current study, we evaluated estrogen receptor mRNA expression in vivo (Esr1, Esr2, and Gpr30) and found that Esr2 was upregulated in the wound sites of female mice exposed to NaAsO2. In skin, Esr1 exhibits low expression [54], while Esr2 expression is widespread [55]. One study showed that knockout mice for estrogen receptor beta (Erβ), encoded by the Esr2 gene, showed impaired wound healing [56], indicating that Erβ activity in the skin is vital to wound closure. These results suggest that arsenic may interfere with wound healing through disruption of estrogen signaling.
There was a significant upregulation of the As3mt gene in the wound sites of both sexes in vivo. Arsenic methyltransferase (AS3MT) detoxifies inorganic arsenic in many species including humans [57], rodents [58], and fish [59,60]. The upregulation of the AS3MT gene in the skin of both male and female mice exposed to NaAsO2 in this study demonstrated the ability of NaAsO2 to affect the skin. One study found that As3mt is required for NaAsO2 metabolism in mice, with As3mt knockout mice retaining toxic arsenic metabolites in tissues [61]. Interestingly, polymorphisms in the human AS3MT gene may also lead to a higher risk of arsenic-induced premalignant skin lesions [62], indicating that human AS3MT expression in skin may play a protective role. The As3mt upregulation in the wound sites of mice in the current study may have been a sign of detoxification in the skin, and therefore may have been protective. Additionally, one study has previously shown that when exposed to arsenate, GAPDH acts as an AsV reductase, and therefore shows that in the presence of arsenate and other isoforms of arsenic, GAPDH is present [63]. The presence of GAPDH during arsenic detoxification supports the use of this gene as a housekeeping gene in these studies.
In normal human wound healing processes, MMP1 degrades type 1 collagen to remodel the wound bed, while its inhibitor, TIMP1, acts to inhibit MMP1 activity [64,65]. The in vivo results paralleled the cytotoxic effects seen in fibroblasts exposed to 10 µM NaAsO2 for 72 h. While there were no significant differences in the expression of Mmp1a and Timp1, the expression of other collagenases, gelatinases, and MMP inhibitors may have changed in response to NaAsO2 exposure for 72 h. In our study, wound sites may have had reduced ECM at the time of tissue collection (6 days post-wound creation). Another study identified a 7–14 day matrix remodeling phase in murine wound models [66]. This finding of a longer murine wound remodeling phase may suggest that the timepoint of tissue collection was critical for analysis of matrix remodeling genes.
Limitations to our study include time of tissue collection, which is mentioned previously, and length of arsenic exposure. Some studies utilizing a chronic model of arsenic exposure dosed for more than 8 weeks [66]; however, longer exposure times were out of the scope of the current study. Additionally, dermal protein expression, histological analysis, and flow cytometry may provide more insight into cellular changes; however, these studies are out of the scope of the current study.
These data underscore the significance to human and environmental health concerns of long-term arsenic exposure. This study used NaAsO2 concentrations between 0.1 and 10 µM, which capture the USEPA MCL of 0.13 µM (10 ppb); however, global surface and groundwater resources often contain levels well above 0.13 µM. These arsenic-contaminated resources (many above 10 µM) are found globally, including areas in Asia and the Americas [1,4,5,12,67,68,69,70]. Overall, these data suggest that individuals who experience delayed wound closure and/or the formation of chronic non-healing skin wounds are at particular risk if chronically exposed to arsenic.

4. Materials and Methods

4.1. Arsenic Preparation

Sodium arsenite (CAS#: 7784-46-5, Sigma-Aldrich, St. Louis, MO, USA) was weighed and diluted in reverse osmosis deionized (DI) water to create a 10 mM stock solution. For cell culture assays and mouse experiments, 10 mM NaAsO2 stocks were further diluted into either cell culture medium or reconditioned RO water to reach a final concentration of 10 µM.

4.2. General Cell Culture Conditions

Human neonatal dermal fibroblasts (hDFn), primary isolates up to 5th passage, (Cell Applications, Inc, San Diego, CA, USA) were grown as a monolayer in a tissue culture treated T75 flask (Corning Inc., Corning, NY, USA) at a seeding density of 5000 cells/cm2 and passaged at 70–80% confluence. All cell counts were generated using a hemocytometer. The cells were grown in Dulbecco’s Modified Eagle Medium (DMEM, Life Technologies, Carlsbad, CA, USA) supplemented with 10% v/v fetal bovine serum (FBS, Life Technologies, Carlsbad, CA, USA). Cells were incubated at 37 °C, 5% CO2.

4.3. Exposure for 24 h and 72 h Cell Scratch Assay

Cells were sub-cultured into a tissue culture-treated 12-well plate (Corning Inc., Corning, NY, USA) at a seeding density of 5000 cells/cm2 and incubated for 2–3 days until the cells reached 100% confluence. Upon reaching confluence, the monolayer was scratched by hand using a P200 pipet tip (Gilson Inc., Middleton, WI, USA). Next, the media were removed, the wells rinsed with 1x Hanks Balanced Salt Solution (HBSS, Life Technologies, Carlsbad, CA, USA) to remove detached cells, and NaAsO2 in DMEM at 0.01, 0.1, 0.5, 1, and 10 µM concentrations were added. Independent scratch assays were conducted to assess the effect of 24 h versus 72 h NaAsO2 exposure on wound closure. In the 24 h exposure assays, the cells were scratched and concomitantly exposed to NaAsO2 concentrations. In the 72 h exposure assays, cells were exposed to NaAsO2 for 72 h prior to performing the scratch. In both assays, an inverted microscope and digital camera (Leica, Wetzlar, Germany) were used to capture images every four hours for 24 h to record cellular migration. Scratch closure was quantified for all experimental conditions and compared to control conditions using an automated algorithm that was developed to quantify cellular migration using MatLab (See Supplemental File). Summed area under the curve (AUC) was calculated using the summed trapezoid method of the percent closure values over a 24 h period from individual wells. At the experiment’s conclusion, all cells were lysed in 300 µL TRIzol reagent (Thermo Fisher, Waltham, MA, USA), and the lysates were stored at −80 °C to be used later for gene expression analysis.

4.4. Quantitative Polymerase Chain Reaction (qPCR) in Human Dermal Fibroblasts

Total RNA was isolated from the same cells used in the scratch assay (stored in TRIzol at −80 °C) with a DirectZol MicroPrep RNA kit (Zymo, Irvine, CA, USA). RNA quantity and ribosomal RNA integrity (RIN) was determined using a fragment analyzer (Advanced Analytical, Ankeny, IA, USA). First-strand cDNA was synthesized using the iScript cDNA synthesis kit (BioRad, Hercules, CA, USA) from 1 µg of RNA. All qPCR assays utilized primers designed using design software (Primer3, NCBI: https://www.ncbi.nlm.nih.gov/tools/primer-blast/ accessed 1 August 2019) and synthesized by Integrated DNA Technologies (Coralville, IA, USA) (Table 1). A standard curve was run for each primer set, and melting peaks were assessed. All assays were performed using qPCR SYBR Green Master Mix chemistry (BioRad, Hercules, CA, USA) and a CFX384-TOUCH real-time thermocycler. All samples were conducted in quadruplicate technical replicates. Cycling conditions were polymerase activation at 95 °C (30 s), followed by 40 amplification cycles of template denaturation at 95 °C (15 s), primer annealing/extension/detection at 60 °C (30 s), and a melt analysis at 65–95 °C (Δ0.5 °C/5 s). Expression was determined using the delta-delta cT method and presented as “log 2-fold change” relative to untreated control samples normalized to the geometric mean of 2 housekeeping genes in control and treated samples.

4.5. Cell Proliferation and Viability Assays

Human neonatal dermal fibroblasts (hDFn) were grown as a monolayer in a tissue culture treated T75 flask at a seeding density of 5000 cells/cm2 and passaged at 70–80% confluence. Cells were sub-cultured into a black wall, clear bottom, tissue culture-treated 96-well plate (Corning Inc., Corning, NY, USA) at a seeding density of 7000 cells/cm2 in 200 µL media/well, with 200 µL water blanks in outer periphery of wells to prevent media evaporation of inner treatment wells. Cells were grown for 24 h, then exposed to NaAsO2 concentrations (0, 0.1, 1, 2.5, 5, and 10 µM) for either 24 or 72 h prior to the addition of fluorescent dyes. On the day of experiment, PrestoBlue (PB, Invitrogen, Carlsbad, CA, USA) and CyQuant (CQ, Invitrogen, Carlsbad, CA, USA) solutions were prepared according to the manufacturer’s protocol. A portion of media was removed from each of the wells (150 µL) and replaced with 50 µL diluted PB, leaving 100 µL total volume per well. Once PB was added, the plate was incubated for 10 min at 37 °C, 5% CO2 and read on a Biotek Synergy HT fluorescent plate reader (Biotek, Winooski, VT, USA) at 560/590 nm and gain set at 45. Next, 100 µL of CQ diluent was added to each well. The plate was incubated for 60 min at 37 °C, 5% CO2 and read on a Biotek Synergy HT fluorescent plate reader at 480/538 nm and gain set at 70. Relative fluorescent units (RFU) were generated for each well, which was directly correlated to cell metabolic output per unit DNA.

4.6. Growth Curve Assay

Cells were sub-cultured into tissue culture-treated 12-well plates at a seeding density of 2630 cells/cm2 into a total of 12 plates. At the time of seeding in 12-well plates, concentrations of NaAsO2 (0, 0.1, 0.5, 1, and 10 µM) were added. Cells from 4 wells/plate were counted using a hemocytometer every 24 h over a 6-day period. At the end of the 6-day period, the cell counts from each day were used to assess fibroblast proliferation in the presence of increasing NaAsO2.

4.7. Full-Thickness Wound Creation and Image Analysis

Twelve female and twelve male 8-week-old mice (Mus musculus C57BL/6) were purchased from Jackson Laboratory (Bar Harbor, ME, USA). These mice were used in accordance with Northern Arizona University’s (NAU) Institutional Animal Care and Use Committee (Protocol# 18-018). The mice arrived in a healthy condition at NAU’s Research Annex and were allowed a 28-day acclimatization period, during which animal care staff placed mice in cages in a blinded fashion without interference from research staff. Mice were randomly selected (6 female and 6 male) to receive RO water containing 10 µM NaAsO2, while the rest of the groups (6 female and 6 male) received RO water. Once dosing began, cages and food were changed weekly, and water was changed every 3 days. Water intake was measured per cage every 3 days using a 500 mL graduated cylinder.
After 8 weeks of dosing, mice were anesthetized using 3% Isoflurane and two full-thickness wounds were created, one on each side of the midline of the dorsum of each animal using a sterile 6 mm dermal punch and tissue excision following prior methods [71]. All animals were treated with Tegaderm (3M., St Paul, MN, USA) dressings to cover the wound sites and butterfly harnesses (LOMIR INC., Malone, NY, USA) to prevent animal interference with wound sites. Mice were individually housed for the duration of the experiment. Left- and right-wound sites for each mouse were photographed with a Nikon DSLR camera with lightbox and macro lens attachments on days 0 and 6.
Wound images from days 0 and 6 post-operation were analyzed with ImageJ software v.1.54h (U. S. National Institutes of Health, Bethesda, MD, USA). Scale was determined by measuring a 1 mm line on the ruler in every photo (using the line tool). Wound areas were traced along the inside wound edge (using the freehand selections tool) and the total area was computed. Percent wound closure was calculated using the below equation:
% Wound Closure = [(Initial Wound Area − Final Wound Area) × 100]/(Initial Wound Area)
Erythema was measured using a qualitative rating scale for all images at each timepoint across cohorts. Images were ranked from 1–10, with 1 being the least red and 10 being the reddest.

4.8. Tissue Collection and Quantitative Polymerase Chain Reaction (qPCR) in Mouse Wound Biopsies

On day 6, all animals were euthanized by 5% Isoflurane overdose and cervical dislocation. Animals were weighed and all wound areas (2 per mouse) were excised, placed in 1 mL RNAlater™ Stabilization Solution (Thermo Fisher, Waltham, WA, USA), and stored at −80 °C until RNA isolation. Dermal punches were sent to University of Arizona Genetics Core (Tucson, AZ, USA) for RNA isolation. Total RNA was isolated from each mouse skin tissue sample using the Invitrogen PureLink RNA Mini extraction kit (Invitrogen, Carlsbad, CA, USA). RNA quantity and ribosomal RNA integrity (RIN) was determined using the 2100 Bioanalyzer Instrument (Agilent Technologies, Santa Clara, CA, USA). Primers for Gapdh, Sdha, As3mt, Mmp1a, Timp1, Esr1, Esr2, and Gper1 were designed using the total gene sequences (Primer3, NCBI) for each target gene assessed (Integrated Data Technologies, Coralville, IA, USA) (Table 1). A standard curve was run for each primer set and melting peaks were assessed. Reagents for cDNA synthesis/qPCR and thermocycler settings were previously described.

4.9. Statistical Analysis

Statistically significant differences among experimental conditions in vitro were determined using the R-Program for Statistical Computation (V3.2.2 GUI 2014) using an ANOVA with a Tukey’s HSD post hoc evaluation. In vivo data were statistically evaluated using JMP® (Version 15. SAS Institute Inc., Cary, NC, USA) software. Data were evaluated for normality and homogeneity of variance, with the alpha set at 0.05. Wound area, erythema endpoints, and water consumption were assessed using a one-way Kruskal Wallis test with a Dunn’s post hoc test for non-parametric data. Transcript levels assayed by qPCR were compared using a one-way ANOVA and Tukey’s HSD post hoc evaluation. Graphing was performed using GraphPad Prism version 9.0.0 for Windows, GraphPad Software v9.4.1, San Diego, CA, USA.

Supplementary Materials

The following supporting information can be downloaded at: https://www.mdpi.com/article/10.3390/ijms25042161/s1.

Author Contributions

Conceptualization, S.R.D., B.I.P., C.R.P., M.C.S. and R.S.K.; Methodology, S.R.D., B.I.P., S.R.B., C.R.P., M.C.S. and R.S.K.; Software, S.R.D., B.I.P., M.C.S. and C.R.P.; Formal Analysis, S.R.D., B.I.P., C.R.P., M.C.S. and R.S.K.; Investigation, C.R.P., M.C.S. and R.S.K.; Resources, C.R.P., M.C.S. and R.S.K.; Data Curation, S.R.D., B.I.P., C.R.P., M.C.S. and R.S.K.; Writing—Original Draft Preparation, S.R.D., B.I.P. and R.S.K.; Writing—Review and Editing, C.R.P., M.C.S., R.S.K. and S.R.B.; Visualization, S.R.D., B.I.P., S.R.B. and M.C.S.; Supervision, C.R.P., R.S.K. and M.C.S.; Project Administration, C.R.P. and R.S.K.; Funding Acquisition, C.R.P. and R.S.K. All authors have read and agreed to the published version of the manuscript.

Funding

Southwest Health Equity Research Collaborative (NIH RCMI, 1 U54 MD012388-01).

Institutional Review Board Statement

The animal study protocol was approved by IACUC of Northern Arizona University (Protocol # 18-018, approved 30 August 2018).

Informed Consent Statement

Not applicable.

Data Availability Statement

The data presented in this study are available on request from the corresponding author. The data are not publicly available due to confidentiality concerns.

Acknowledgments

We thank the members of Northern Arizona University Tissue Engineering and Regenerative Medicine (TERM) lab, the Northern Arizona University Biological Science Annex (BSA), and the University of Arizona Genomics Core (UAGC). We would also like to thank the National Institute on Minority Health and Health Disparities of the National Institutes of Health (U54MD01238) for funding this research.

Conflicts of Interest

The authors declare that there are no conflicts of interest.

References

  1. Ayotte, J.D.; Medalie, L.; Qi, S.L.; Backer, L.C.; Nolan, B.T. Estimating the High-Arsenic Domestic-Well Population in the Conterminous United States. Environ. Sci. Technol. 2017, 51, 12443–12454. [Google Scholar] [CrossRef] [PubMed]
  2. Abdul, K.S.; Jayasinghe, S.S.; Chandana, E.P.; Jayasumana, C.; De Silva, P.M. Arsenic and human health effects: A review. Environ. Toxicol. Pharmacol. 2015, 40, 828–846. [Google Scholar] [CrossRef] [PubMed]
  3. Berg, M.; Tran, H.C.; Nguyen, T.C.; Pham, H.V.; Schertenleib, R.; Giger, W. Arsenic contamination of groundwater and drinking water in Vietnam: A human health threat. Environ. Sci. Technol. 2001, 35, 2621–2626. [Google Scholar] [CrossRef] [PubMed]
  4. George, C.M.; Sima, L.; Arias, M.H.; Mihalic, J.; Cabrera, L.Z.; Danz, D.; Checkley, W.; Gilman, R.H. Arsenic exposure in drinking water: An unrecognized health threat in Peru. Bull. World Health Organ. 2014, 92, 565–572. [Google Scholar] [CrossRef] [PubMed]
  5. Smith, A.H.; Lingas, E.O.; Rahman, M. Contamination of drinking-water by arsenic in Bangladesh: A public health emergency. Bull. World Health Organ. 2000, 78, 1093–1103. [Google Scholar] [PubMed]
  6. World Health Organization. Arsenic in Drinking-Water: Background Document for Development of WHO Guidelines for Drinking-Water Quality; World Health Organization: Geneva, Switzerland, 2003.
  7. Environmental Protection, A. National primary drinking water regulations: Long Term 1 Enhanced Surface Water Treatment Rule. Final rule. Fed. Regist. 2002, 67, 1811–1844. [Google Scholar]
  8. Beamer, P.I.; Klimecki, W.T.; Loh, M.; Van Horne, Y.O.; Sugeng, A.J.; Lothrop, N.; Billheimer, D.; Guerra, S.; Lantz, R.C.; Canales, R.A.; et al. Association of Children’s Urinary CC16 Levels with Arsenic Concentrations in Multiple Environmental Media. Int. J. Environ. Res. Public Health 2016, 13, 521. [Google Scholar] [CrossRef]
  9. Foust, R.D., Jr.; Mohapatra, P.; Compton-O’Brien, A.-M.; Reifel, J. Groundwater arsenic in the Verde Valley in central Arizona, USA. Appl. Geochem. 2004, 19, 251–255. [Google Scholar] [CrossRef]
  10. Robertson, F.N. Arsenic in ground-water under oxidizing conditions, south-west United States. Environ. Geochem. Health 1989, 11, 171–185. [Google Scholar] [CrossRef]
  11. ADEQ. The Status of Water Quality in Arizona: Arizona’s Integrated 305(b) Assessment and 303(d) Listing Report. In Ground Water Quality; Chapter VII; Arizona Department of Environmental Quality: Tucson, AZ, USA, 2004. [Google Scholar]
  12. Jones, M.C.; Credo, J.M.; Ingram, J.C.; Baldwin, J.A.; Trotter, R.T., Jr.; Propper, C.R. Arsenic Concentrations in Ground and Surface Waters across Arizona Including Native Lands. J. Contemp. Water Res. Educ. 2020, 169, 44–60. [Google Scholar] [CrossRef]
  13. Roh, T.; Lynch, C.F.; Weyer, P.; Wang, K.; Kelly, K.M.; Ludewig, G. Low-level arsenic exposure from drinking water is associated with prostate cancer in Iowa. Environ. Res. 2017, 159, 338–343. [Google Scholar] [CrossRef]
  14. Ettinger, A.S.; Zota, A.R.; Amarasiriwardena, C.J.; Hopkins, M.R.; Schwartz, J.; Hu, H.; Wright, R.O. Maternal arsenic exposure and impaired glucose tolerance during pregnancy. Environ. Health Perspect. 2009, 117, 1059–1064. [Google Scholar] [CrossRef] [PubMed]
  15. James, K.A.; Marshall, J.A.; Hokanson, J.E.; Meliker, J.R.; Zerbe, G.O.; Byers, T.E. A case-cohort study examining lifetime exposure to inorganic arsenic in drinking water and diabetes mellitus. Environ. Res. 2013, 123, 33–38. [Google Scholar] [CrossRef] [PubMed]
  16. Maull, E.A.; Ahsan, H.; Edwards, J.; Longnecker, M.P.; Navas-Acien, A.; Pi, J.; Silbergeld, E.K.; Styblo, M.; Tseng, C.H.; Thayer, K.A.; et al. Evaluation of the association between arsenic and diabetes: A National Toxicology Program workshop review. Environ. Health Perspect. 2012, 120, 1658–1670. [Google Scholar] [CrossRef] [PubMed]
  17. Abhyankar, L.N.; Jones, M.R.; Guallar, E.; Navas-Acien, A. Arsenic exposure and hypertension: A systematic review. Environ. Health Perspect. 2012, 120, 494–500. [Google Scholar] [CrossRef] [PubMed]
  18. Balakumar, P.; Kaur, J. Arsenic exposure and cardiovascular disorders: An overview. Cardiovasc. Toxicol. 2009, 9, 169–176. [Google Scholar] [CrossRef] [PubMed]
  19. Chen, Y.; Karagas, M.R. Arsenic and cardiovascular disease: New evidence from the United States. Ann. Intern. Med. 2013, 159, 713–714. [Google Scholar] [CrossRef] [PubMed]
  20. Dahan, D.; Jude, B.A.; Lamendella, R.; Keesing, F.; Perron, G.G. Exposure to Arsenic Alters the Microbiome of Larval Zebrafish. Front. Microbiol. 2018, 9, 1323. [Google Scholar] [CrossRef]
  21. Gentry, P.R.; McDonald, T.B.; Sullivan, D.E.; Shipp, A.M.; Yager, J.W.; Clewell, H.J., 3rd. Analysis of genomic dose-response information on arsenic to inform key events in a mode of action for carcinogenicity. Environ. Mol. Mutagen. 2010, 51, 1–14. [Google Scholar] [CrossRef]
  22. Chen, Y.; Graziano, J.H.; Parvez, F.; Hussain, I.; Momotaj, H.; van Geen, A.; Howe, G.R.; Ahsan, H. Modification of risk of arsenic-induced skin lesions by sunlight exposure, smoking, and occupational exposures in Bangladesh. Epidemiology 2006, 17, 459–467. [Google Scholar] [CrossRef]
  23. Li, Y.; Jing, D.; Xiao, Y.; Huang, X.; Shen, M. Patient-Reported Outcomes of Arsenic-Related Skin Lesions in China. Biomed. Res. Int. 2020, 2020, 6195975. [Google Scholar] [CrossRef] [PubMed]
  24. Wei, S.; Zhang, H.; Tao, S. A review of arsenic exposure and lung cancer. Toxicol. Res. 2019, 8, 319–327. [Google Scholar] [CrossRef] [PubMed]
  25. Chayapong, J.; Madhyastha, H.; Madhyastha, R.; Nurrahmah, Q.I.; Nakajima, Y.; Choijookhuu, N.; Hishikawa, Y.; Maruyama, M. Arsenic trioxide induces ROS activity and DNA damage, leading to G0/G1 extension in skin fibroblasts through the ATM-ATR-associated Chk pathway. Environ. Sci. Pollut. Res. Int. 2017, 24, 5316–5325. [Google Scholar] [CrossRef] [PubMed]
  26. Pinto, B.I.; Lujan, O.R.; Ramos, S.A.; Propper, C.R.; Kellar, R.S. Estrogen Mitigates the Negative Effects of Arsenic Contamination in an In Vitro Wound Model. Appl. In Vitro Toxicol. 2018, 4, 24–29. [Google Scholar] [CrossRef] [PubMed]
  27. Yamaguchi, Y.; Madhyastha, H.; Madhyastha, R.; Choijookhuu, N.; Hishikawa, Y.; Pengjam, Y.; Nakajima, Y.; Maruyama, M. Arsenic acid inhibits proliferation of skin fibroblasts, and increases cellular senescence through ROS mediated MST1-FOXO signaling pathway. J. Toxicol. Sci. 2016, 41, 105–113. [Google Scholar] [CrossRef] [PubMed]
  28. Horng, H.C.; Chang, W.H.; Yeh, C.C.; Huang, B.S.; Chang, C.P.; Chen, Y.J.; Tsui, K.H.; Wang, P.H. Estrogen Effects on Wound Healing. Int. J. Mol. Sci. 2017, 18, 2325. [Google Scholar] [CrossRef] [PubMed]
  29. Zhang, P.; Fu, Y.; Ju, J.; Wan, D.; Su, H.; Wang, Z.; Rui, H.; Jin, Q.; Le, Y.; Hou, R. Estradiol inhibits fMLP-induced neutrophil migration and superoxide production by upregulating MKP-2 and dephosphorylating ERK. Int. Immunopharmacol. 2019, 75, 105787. [Google Scholar] [CrossRef] [PubMed]
  30. Kumar, S.; Mukherjee, T.K.; Guptasarma, P. Arsenic and 17-beta-estradiol bind to each other and neutralize each other’s signaling effects. Biochem. Biophys. Res. Commun. 2016, 477, 575–580. [Google Scholar] [CrossRef]
  31. Davey, J.C.; Nomikos, A.P.; Wungjiranirun, M.; Sherman, J.R.; Ingram, L.; Batki, C.; Lariviere, J.P.; Hamilton, J.W. Arsenic as an endocrine disruptor: Arsenic disrupts retinoic acid receptor-and thyroid hormone receptor-mediated gene regulation and thyroid hormone-mediated amphibian tail metamorphosis. Environ. Health Perspect. 2008, 116, 165–172. [Google Scholar] [CrossRef]
  32. Wall, I.B.; Moseley, R.; Baird, D.M.; Kipling, D.; Giles, P.; Laffafian, I.; Price, P.E.; Thomas, D.W.; Stephens, P. Fibroblast dysfunction is a key factor in the non-healing of chronic venous leg ulcers. J. Investig. Dermatol. 2008, 128, 2526–2549. [Google Scholar] [CrossRef]
  33. Maione, A.G.; Smith, A.; Kashpur, O.; Yanez, V.; Knight, E.; Mooney, D.J.; Veves, A.; Tomic-Canic, M.; Garlick, J.A. Altered ECM deposition by diabetic foot ulcer-derived fibroblasts implicates fibronectin in chronic wound repair. Wound Repair. Regen. 2016, 24, 630–643. [Google Scholar] [CrossRef] [PubMed]
  34. Xiong, X.; Li, Y.; Liu, L.; Qi, K.; Zhang, C.; Chen, Y.; Fang, J. Arsenic trioxide induces cell cycle arrest and affects Trk receptor expression in human neuroblastoma SK-N-SH cells. Biol. Res. 2018, 51, 18. [Google Scholar] [CrossRef] [PubMed]
  35. Delnomdedieu, M.; Basti, M.M.; Otvos, J.D.; Thomas, D.J. Transfer of arsenite from glutathione to dithiols: A model of interaction. Chem. Res. Toxicol. 1993, 6, 598–602. [Google Scholar] [CrossRef] [PubMed]
  36. Xie, H.; Huang, S.; Martin, S.; Wise, J.P., Sr. Arsenic is cytotoxic and genotoxic to primary human lung cells. Mutat. Res. Genet. Toxicol. Environ. Mutagen. 2014, 760, 33–41. [Google Scholar] [CrossRef] [PubMed]
  37. Dodson, M.; de la Vega, M.R.; Harder, B.; Castro-Portuguez, R.; Rodrigues, S.D.; Wong, P.K.; Chapman, E.; Zhang, D.D. Low-level arsenic causes proteotoxic stress and not oxidative stress. Toxicol. Appl. Pharmacol. 2018, 341, 106–113. [Google Scholar] [CrossRef] [PubMed]
  38. Li, J.; Lou, B.; Wu, R.; Wang, G.; Lu, C.; Wang, H.; Pi, J.; Xu, Y. The Role of Reactive Oxygen Species in Arsenic Toxicity. Biomolecules 2020, 10, 240. [Google Scholar]
  39. Liu, S.; Wang, F.; Liu, J.; Jin, P.; Wang, X.; Yang, L.; Xi, S. ATF2 partly mediated the expressions of proliferative factors and inhibited pro-inflammatory factors’ secretion in arsenite-treated human uroepithelial cells. Toxicol. Res. 2017, 6, 468–476. [Google Scholar] [CrossRef]
  40. Pilcher, B.K.; Dumin, J.A.; Sudbeck, B.D.; Krane, S.M.; Welgus, H.G.; Parks, W.C. The activity of collagenase-1 is required for keratinocyte migration on a type I collagen matrix. J. Cell Biol. 1997, 137, 1445–1457. [Google Scholar] [CrossRef]
  41. Medina, A.; Scott, P.G.; Ghahary, A.; Tredget, E.E. Pathophysiology of chronic nonhealing wounds. J. Burn. Care Rehabil. 2005, 26, 306–319. [Google Scholar] [CrossRef]
  42. Berman, B.; Bieley, H.C. Keloids. J. Am. Acad. Dermatol. 1995, 33, 117–123. [Google Scholar] [CrossRef]
  43. Barone, E.J.; Yager, D.R.; Pozez, A.L.; Olutoye, O.O.; Crossland, M.C.; Diegelmann, R.F.; Cohen, K.I. Interleukin 1 alpha and collagenase activity are elevated in chronic wounds. Plast. Reconstr. Surg. 1998, 102, 1028–1029. [Google Scholar] [CrossRef]
  44. Lobmann, R.; Ambrosch, A.; Schultz, G.; Waldmann, K.; Schiweck, S.; Lehnert, H. Expression of matrix-metalloproteinases and their inhibitors in the wounds of diabetic and non-diabetic patients. Diabetologia 2002, 45, 1011–1016. [Google Scholar] [CrossRef] [PubMed]
  45. Muhetaer, M.; Yang, M.; Xia, R.; Lai, Y.; Wu, J. Gender difference in arsenic biotransformation is an important metabolic basis for arsenic toxicity. BMC Pharmacol. Toxicol. 2022, 23, 15. [Google Scholar] [CrossRef] [PubMed]
  46. Tordoff, M.G.; Bachmanov, A.A.; Reed, D.R. Forty mouse strain survey of water and sodium intake. Physiol. Behav. 2007, 91, 620–631. [Google Scholar] [CrossRef] [PubMed]
  47. Niethammer, P.; Grabher, C.; Look, A.T.; Mitchison, T.J. A tissue-scale gradient of hydrogen peroxide mediates rapid wound detection in zebrafish. Nature 2009, 459, 996–999. [Google Scholar] [CrossRef] [PubMed]
  48. Savill, J.; Dransfield, I.; Gregory, C.; Haslett, C. A blast from the past: Clearance of apoptotic cells regulates immune responses. Nat. Rev. Immunol. 2002, 2, 965–975. [Google Scholar] [CrossRef] [PubMed]
  49. Adachi, A.; Honda, T.; Egawa, G.; Kanameishi, S.; Takimoto, R.; Miyake, T.; Hossain, M.R.; Komine, M.; Ohtsuki, M.; Gunzer, M.; et al. Estradiol suppresses psoriatic inflammation in mice by regulating neutrophil and macrophage functions. J. Allergy Clin. Immunol. 2022, 150, 909–919.e8. [Google Scholar] [CrossRef]
  50. Davey, J.C.; Bodwell, J.E.; Gosse, J.A.; Hamilton, J.W. Arsenic as an endocrine disruptor: Effects of arsenic on estrogen receptor-mediated gene expression in vivo and in cell culture. Toxicol. Sci. 2007, 98, 75–86. [Google Scholar] [CrossRef]
  51. Chatterjee, A.; Chatterji, U. Arsenic abrogates the estrogen-signaling pathway in the rat uterus. Reprod. Biol. Endocrinol. 2010, 8, 80. [Google Scholar] [CrossRef]
  52. Treas, J.N.; Tyagi, T.; Singh, K.P. Effects of chronic exposure to arsenic and estrogen on epigenetic regulatory genes expression and epigenetic code in human prostate epithelial cells. PLoS ONE 2012, 7, e43880. [Google Scholar] [CrossRef]
  53. Kitchin, K.T.; Wallace, K. Arsenite binding to synthetic peptides based on the Zn finger region and the estrogen binding region of the human estrogen receptor-alpha. Toxicol. Appl. Pharmacol. 2005, 206, 66–72. [Google Scholar] [CrossRef] [PubMed]
  54. Maekawa, R.; Sato, S.; Okada, M.; Lee, L.; Tamura, I.; Jozaki, K.; Kajimura, T.; Asada, H.; Yamagata, Y.; Tamura, H.; et al. Tissue-Specific Expression of Estrogen Receptor 1 Is Regulated by DNA Methylation in a T-DMR. Mol. Endocrinol. 2016, 30, 335–347. [Google Scholar] [CrossRef]
  55. Thornton, M.J.; Taylor, A.H.; Mulligan, K.; Al-Azzawi, F.; Lyon, C.C.; O’Driscoll, J.; Messenger, A.G. The distribution of estrogen receptor beta is distinct to that of estrogen receptor alpha and the androgen receptor in human skin and the pilosebaceous unit. J. Investig. Dermatol. Symp. Proc. 2003, 8, 100–103. [Google Scholar] [CrossRef]
  56. Campbell, L.; Emmerson, E.; Davies, F.; Gilliver, S.C.; Krust, A.; Chambon, P.; Ashcroft, G.S.; Hardman, M.J. Estrogen promotes cutaneous wound healing via estrogen receptor beta independent of its antiinflammatory activities. J. Exp. Med. 2010, 207, 1825–1833. [Google Scholar] [CrossRef]
  57. Meza, M.M.; Yu, L.; Rodriguez, Y.Y.; Guild, M.; Thompson, D.; Gandolfi, A.J.; Klimecki, W.T. Developmentally restricted genetic determinants of human arsenic metabolism: Association between urinary methylated arsenic and CYT19 polymorphisms in children. Environ. Health Perspect. 2005, 113, 775–781. [Google Scholar] [CrossRef] [PubMed]
  58. Huang, M.C.; Douillet, C.; Su, M.; Zhou, K.; Wu, T.; Chen, W.; Galanko, J.A.; Drobna, Z.; Saunders, R.J.; Martin, E.; et al. Metabolomic profiles of arsenic (+3 oxidation state) methyltransferase knockout mice: Effect of sex and arsenic exposure. Arch. Toxicol. 2017, 91, 189–202. [Google Scholar] [CrossRef]
  59. Park, D.; Propper, C.R.; Wang, G.; Salanga, M.C. Synonymous single nucleotide polymorphism in arsenic (+3) methyltransferase of the Western mosquitofish (Gambusia affinis) and its gene expression among field populations. Ecotoxicology 2021, 30, 711–718. [Google Scholar] [CrossRef]
  60. Thomas, D.J.; Li, J.; Waters, S.B.; Xing, W.; Adair, B.M.; Drobna, Z.; Devesa, V.; Styblo, M. Arsenic (+3 oxidation state) methyltransferase and the methylation of arsenicals. Exp. Biol. Med. 2007, 232, 3–13. [Google Scholar]
  61. Drobna, Z.; Naranmandura, H.; Kubachka, K.M.; Edwards, B.C.; Herbin-Davis, K.; Styblo, M.; Le, X.C.; Creed, J.T.; Maeda, N.; Hughes, M.F.; et al. Disruption of the arsenic (+3 oxidation state) methyltransferase gene in the mouse alters the phenotype for methylation of arsenic and affects distribution and retention of orally administered arsenate. Chem. Res. Toxicol. 2009, 22, 1713–1720. [Google Scholar] [CrossRef]
  62. Valenzuela, O.L.; Drobna, Z.; Hernandez-Castellanos, E.; Sanchez-Pena, L.C.; Garcia-Vargas, G.G.; Borja-Aburto, V.H.; Styblo, M.; Del Razo, L.M. Association of AS3MT polymorphisms and the risk of premalignant arsenic skin lesions. Toxicol. Appl. Pharmacol. 2009, 239, 200–207. [Google Scholar] [CrossRef]
  63. Nemeti, B.; Csanaky, I.; Gregus, Z. Effect of an inactivator of glyceraldehyde-3-phosphate dehydrogenase, a fortuitous arsenate reductase, on disposition of arsenate in rats. Toxicol. Sci. 2006, 90, 49–60. [Google Scholar] [CrossRef]
  64. Barton, P.J.; Birks, E.J.; Felkin, L.E.; Cullen, M.E.; Koban, M.U.; Yacoub, M.H. Increased expression of extracellular matrix regulators TIMP1 and MMP1 in deteriorating heart failure. J. Heart Lung Transplant. 2003, 22, 738–744. [Google Scholar] [CrossRef]
  65. Vaalamo, M.; Weckroth, M.; Puolakkainen, P.; Kere, J.; Saarinen, P.; Lauharanta, J.; Saarialho-Kere, U.K. Patterns of matrix metalloproteinase and TIMP-1 expression in chronic and normally healing human cutaneous wounds. Br. J. Dermatol. 1996, 135, 52–59. [Google Scholar] [CrossRef]
  66. Masson-Meyers, D.S.; Andrade, T.A.M.; Caetano, G.F.; Guimaraes, F.R.; Leite, M.N.; Leite, S.N.; Frade, M.A.C. Experimental models and methods for cutaneous wound healing assessment. Int. J. Exp. Pathol. 2020, 101, 21–37. [Google Scholar] [CrossRef] [PubMed]
  67. Podgorski, J.; Berg, M. Global threat of arsenic in groundwater. Science 2020, 368, 845–850. [Google Scholar] [CrossRef] [PubMed]
  68. Hoover, J.; Gonzales, M.; Shuey, C.; Barney, Y.; Lewis, J. Elevated Arsenic and Uranium Concentrations in Unregulated Water Sources on the Navajo Nation, USA. Expo Health 2017, 9, 113–124. [Google Scholar] [CrossRef]
  69. Ingram, J.C.; Jones, L.; Credo, J.; Rock, T. Uranium and arsenic unregulated water issues on Navajo lands. J. Vac. Sci. Technol. A 2020, 38, 031003. [Google Scholar] [CrossRef] [PubMed]
  70. Ahangarpour, A.; Zeidooni, L.; Samimi, A.; Alboghobeish, S.; Khorsandi, L.S.; Moradi, M. Chronic exposure to arsenic and high fat diet additively induced cardiotoxicity in male mice. Res. Pharm. Sci. 2018, 13, 47–56. [Google Scholar] [PubMed]
  71. Machula, H.; Ensley, B.; Kellar, R. Electrospun Tropoelastin for Delivery of Therapeutic Adipose-Derived Stem Cells to Full-Thickness Dermal Wounds. Adv. Wound Care 2014, 3, 367–375. [Google Scholar] [CrossRef]
Figure 1. NaAsO2 exposure for 24 h and 72 h and its effects on scratch closure. (A) Quantification of dermal fibroblast migration in the scratch assay following NaAsO2 exposure for 24 h. Mean area under the curve (AUC) values for each treatment group are represented +/− SEM (n = 21, F = 53.58, p < 0.001). (B) Light micrographs of cells from the 24 h arsenic exposure scratch assay over a 20 h period. (C) Quantification of dermal fibroblast migration in the scratch assay following NaAsO2 exposure for 72 h. Mean AUC values for each treatment group are represented +/− SEM (n = 12, F = 2.51, p = 0.0512). (D) Light micrographs of cells from the 72 h arsenic exposure scratch assay over a 20 h period. 72 pre-scratch exposure to 10 µM arsenic killed all cells thus no images were taken. * Statistically significant values (p < 0.05) compared to control (Tukey’s post hoc test).
Ijms 25 02161 g001
Figure 2. Relative gene expression of MMP1 in dermal fibroblasts exposed to NaAsO2. (A) Effect of 0, 0.1, 1, and 10 µM NaAsO2 on MMP1 gene expression in dermal fibroblasts collected after 24 h in the scratch closure assay (n = 4, F = 12.1, p < 0.001). (B) Effect of 0, 0.1, 0.5, and 1 µM NaAsO2 on MMP1 gene expression in dermal fibroblasts collected after 72 h in the scratch closure assay (n = 4, F = 12.1, p < 0.001). Individual data points represent fold changes per replicate +/− SEM. * Statistically significant values (p < 0.05) compared to control (Tukey’s post hoc test).
Ijms 25 02161 g002
Figure 3. NaAsO2 exposure over a 96 h time period and its effects on dermal fibroblast proliferation. (A) Light micrographs of cells exposed to NaAsO2 for 96 h. (B) Effect of arsenic exposure on dermal fibroblast proliferation over a 96 h period. Mean cell counts are represented for each day and treatment group +/− SEM (n = 4). * Statistically significant values (p < 0.05) compared to control (Tukey’s post hoc test).
Ijms 25 02161 g003
Figure 4. NaAsO2 exposure for 24 h and 72 h and its effects on metabolic activity, viability, and metabolic ratio (value of PrestBlue:CyQuant) (A) Effect of 24 h NaAsO2 exposure on metabolic activity. Mean RFU values for each treatment group are represented +/− SEM (n = 6, F = 29.19, p < 0.001). (B) Effect of 24 h NaAsO2 exposure on DNA content. Mean RFU values for each treatment group are represented +/− SEM (n = 6, F = 131.9, p < 0.001). (C) Effect of 24 h NaAsO2 exposure on metabolic output per unit of viable DNA. The ratio of RFU values for each treatment group are represented +/− SEM (n = 6, F = 7.58, p < 0.001). (D) Effect of 72 h NaAsO2 exposure on metabolic activity. Mean RFU values for each treatment group are represented +/− SEM (n = 10, F = 2040.7, p < 0.001). (E) Effect of 72 h NaAsO2 exposure on DNA content. Mean RFU values for each treatment group are represented +/− SEM (n = 10, F = 2735.1, p < 0.001). (F) Effect of 72 h NaAsO2 exposure on metabolic output per unit DNA. The ratio of RFU values for each treatment group are represented +/− SEM (n = 10, F = 19.6, p < 0.001). * Statistically significant values (p < 0.05) compared to control (Tukey’s post hoc test).
Ijms 25 02161 g004
Figure 5. Wound closure areas, wound erythema, and representative wound images at day 6 post-wounding in mice exposed to 10 µM NaAsO2 for 8 weeks (A) Wound closures in NaAsO2-treated females were significantly decreased compared to control females (Chi2 = 16.5095, p = 0.0022) and NaAsO2-treated males (Chi2 = 16.5095, p = 0.0091). Mean wound closure areas for each treatment group are represented +/− SEM (n = 12). (B) Erythema scores in NaAsO2-treated females were significantly elevated compared to control females (Chi2 = 19.3237, p < 0.0001). Mean erythema values for each treatment group are represented +/− SEM (n = 12). (C) Representative gross images of wound sites from vehicle and NaAsO2-treated mice on day 0 and on day 6. * Statistically significant values (p < 0.05) compared to control (Dunn’s post hoc test).
Ijms 25 02161 g005
Figure 6. Relative gene expression of arsenic metabolism, matrix remodeling, and estrogen signaling genes in mice exposed to 10 µM NaAsO2 for 8 weeks. Exposure to NaAsO2 significantly increased As3mt expression in NaAsO2-treated female mice compared to control groups (W = 12.20, p = 0.008). Exposure to NaAsO2 significantly increased Esr2 expression in NaAsO2-treated female mice compared to control groups (W = 19.30, p = 0.0002). Individual data points represent fold changes per replicate +/− SEM (n = 6). * Statistically significant (p < 0.05) compared to control (Tukey’s post hoc test).
Ijms 25 02161 g006
Table 1. Real-time qPCR gene targets and primer sequences for human dermal fibroblasts and Mus musculus.
Gene TranscriptGene AbbreviationPrimer SequenceAnnealing Temperature (°C)Amplicon Length
Human
Glyceraldehyde 3-phosphate dehydrogenaseGAPDHF-CTCCAAAATCAAGTGGGGCGA60.8970
R-CATGGTGGTGAAGACGCCAG61.3
Succinate dehydrogenase complex subunit ASDHAF-TGGCCCTGAGAAAGATCACG59.75193
R-GACCTGCCCCTTGTAGTTGG60.32
Matrix metalloproteinase 1MMP1F-GGCCACAAAGTTGATGCAGTT59.93137
R-TTCCTGCAGTTGAACCAGCTA59.58
Mouse
Glyceraldehyde 3-phosphate dehydrogenaseGAPDHF-CATCACTGCCACCCAGAAGACTG63.28153
R-ATGCCAGTGAGCTTCCCGTTCAG65.15
Succinate dehydrogenase complex subunit ASDHAF-GAGATACGCACCTGTTGCCAAG61.82113
R-GGTAGACGTGATCTTTCTCAGGG60.18
Matrix metalloproteinase 1aMMP1aF-AGGAAGGCGATATTGTGCTCTCC62.3798
R-TGGCTGGAAAGTGTGTGAGCAAGC63.85
TIMP metallopeptidase inhibitor 1TIMP1F-TCTTGGTTCCCTGGCGTACTCT63.08131
R-GTGAGTGTCACTCTCCAGTTTGC61.59
Arsenic 3-methyltransferaseAS3MTF-TCCACGTTTGGTCACTGCCGAT64.71100
R-GAAGAGGCGAAATGTGGCAGAC62.07
G-Protein coupled estrogen receptor 1GPER1F-GCCACATAGTCAACCTTGCAGC62.34113
R-CGTCTTCTGCTCCACATAGAGC60.8
Estrogen receptor 1ESR1F-TCTGCCAAGGAGACTCGCTACT62.86153
R-GGTGCATTGGTTTGTAGCTGGAC62.46
Estrogen receptor 2ESR2F-GGTCCTGTGAAGGATGTAAGGC60.68139
R-TAACACTTGCGAAGTCGGCAGG63.35
Disclaimer/Publisher’s Note: The statements, opinions and data contained in all publications are solely those of the individual author(s) and contributor(s) and not of MDPI and/or the editor(s). MDPI and/or the editor(s) disclaim responsibility for any injury to people or property resulting from any ideas, methods, instructions or products referred to in the content.

