Article

Identification of Yellow Seed Color Genes Using Bulked Segregant RNA Sequencing in Brassica juncea L.

State Key Laboratory of Crop Stress Biology for Arid Areas, College of Agronomy, Northwest A&F University, Xianyang 712100, China
*
Authors to whom correspondence should be addressed.
These authors contributed equally to this work.
Int. J. Mol. Sci. 2024, 25(3), 1573; https://doi.org/10.3390/ijms25031573
Submission received: 23 November 2023 / Revised: 19 December 2023 / Accepted: 29 December 2023 / Published: 26 January 2024
(This article belongs to the Section Molecular Plant Sciences)

Abstract

:
Yellow seed breeding is an effective method to improve oil yield and quality in rapeseed (Brassica napus L.). However, naturally occurring yellow-seeded genotypes have not been identified in B. napus. Mustard (Brassica juncea L.) has some natural, yellow-seeded germplasms, yet the molecular mechanism underlying this trait remains unclear. In this study, a BC9 population derived from the cross of yellow seed mustard “Wuqi” and brown seed mustard “Wugong” was used to analyze the candidate genes controlling the yellow seed color of B. juncea. Subsequently, yellow-seeded (BY) and brown-seeded (BB) bulks were constructed in the BC9 population and subjected to bulked segregant RNA sequencing (BSR-Seq). A total of 511 differentially expressed genes (DEGs) were identified between the brown and yellow seed bulks. Enrichment analysis revealed that these DEGs were involved in the phenylpropanoid biosynthetic process and flavonoid biosynthetic process, including key genes such as 4CL, C4H, LDOX/TT18, PAL1, PAL2, PAL4, TT10, TT12, TT4, TT8, BAN, DFR/TT3, F3H/TT6, TT19, and CHI/TT5. In addition, 111,540 credible single-nucleotide polymorphisms (SNPs) and 86,319 INDELs were obtained and used for quantitative trait locus (QTL) identification. Subsequently, two significant QTLs on chromosome A09, namely, qSCA09-3 and qSCA09-7, were identified by G’ analysis, and five DEGs (BjuA09PAL2, BjuA09TT5, BjuA09TT6, BjuA09TT4, BjuA09TT3) involved in the flavonoid pathway were identified as hub genes based on the protein-to-protein network. Among these five genes, only BjuA09PAL2 and BjuA09F3H had SNPs between BY and BB bulks. Interestingly, the majority of SNPs in BjuA09PAL2 were consistent with the SNPs identified between the high-quality assembled B. juncea reference genome “T84-66” (brown-seed) and “AU213” (yellow-seed). Therefore, BjuA09PAL2, which encodes phenylalanine lyase, was considered as the candidate gene associated with yellow seed color of B. juncea. The identification of a novel gene associated with the yellow seed coloration of B. juncea through this study may play a significant role in enhancing yellow seed breeding in rapeseed.

1. Introduction

Brassica, a genus of the Brassicaceae family, encompasses significant agricultural and horticultural crops such as Brassica rapa L., Brassica napus L., and Brassica juncea L. [1]. Among these, B. napus and B. juncea are extensively used for the production of edible vegetable oil, industrial oil, and biofuel, collectively representing the third largest source of vegetable oil globally [2], surpassed only by soybean and sunflower. Therefore, increasing the oil content remains a constant goal of Brassica crop breeding [3]. Studies have shown that yellow-seeded rapeseed has higher oil and protein contents and lower crude fiber content compared to brown- or black-seeded rapeseed [4].
Although a large number of yellow-seeded varieties of B. napus have been developed through interspecific crosses [5]. Natural occurrences of yellow-seeded genotypes have not been identified in B. napus [6]. Due to its commercial importance, researchers have been studying the mechanism of yellow seed trait over the past decades. To elucidate the pigment compounds associated with this specific trait, a number of studies have been conducted. The manifestation of yellow seed color in rapeseed is largely determined by the presence of phenolic compounds [7,8,9]. The main phenolic compounds found in rapeseed are flavonoids [10]. Marles [11] found that the main pigments that affect the seed color are proanthocyanins (PAs). PAs are the end-products of the flavonoid biosynthesis pathway [12,13], a pathway that has been extensively explored at the genetic and biochemical levels in model plants such as Arabidopsis thaliana and Zea mays [14,15] Furthermore, certain studies have indicated that melanin exerts a significant effect on seed coat color [16]. In B. napus, seed color is controlled by different candidate genes depending on the genetic background, and the QTLs controlling seed color have been identified using classical genetic tools in diverse population [17,18,19,20,21,22]. However, most studies focus on B. napus, and the inheritance of yellow seed trait in B. napus is complex.
On the other hand, B. juncea, an allotetraploid species, harbors naturally occurring yellow-seeded germplasms with stable inheritance. Cultivated globally in countries such as India, China, Bangladesh, Ukraine, Canada, and Australia due to its wide adaption [23], B. juncea can be categorized into three classes, yellow-seeded, black-seeded, and brown-seeded. Therefore, cultivating high-yield and superior-quality yellow-seeded B. juncea is considered as one of the most important objectives for rapeseed breeding. Notably, the yellow-seeded landrace “Wuqi” mustard, a variety of B. juncea, has been cultivated in Northern Shaanxi, China. The yellow seed trait is controlled by a single recessive gene [24], offering a potential avenue for transferring the yellow seed gene to develop yellow-seeded B. napus. Despite this potential, few studies have been conducted on the mechanistic aspects of yellow seed development in B. juncea. Therefore, understanding the mechanism controlling the yellow seed trait in “Wuqi” is important for the oilseed industry. Previous studies have identified the A09 chromosome as the location of yellow seed color gene in “Wuqi” mustard, and a high-resolution genetic and physical map around this gene has been constructed [24]. However, the mechanism of yellow seed coat color remains elusive, and no gene controlling yellow seed coat color has been isolated to date. Some studies have indicated that the yellow seed color genes in Brassica are linked to the flavonoid biosynthesis pathway [25]. Whether the candidate genes identified in our study also participate in the flavonoid biosynthesis pathway is yet to be understood. Therefore, the objective of this study is to identify the candidate genes responsible for yellow seed color in B. juncea. The outcomes of this investigation will lay a strong foundation for comprehending the mechanism of yellow seed color in Brassica crops.

2. Result

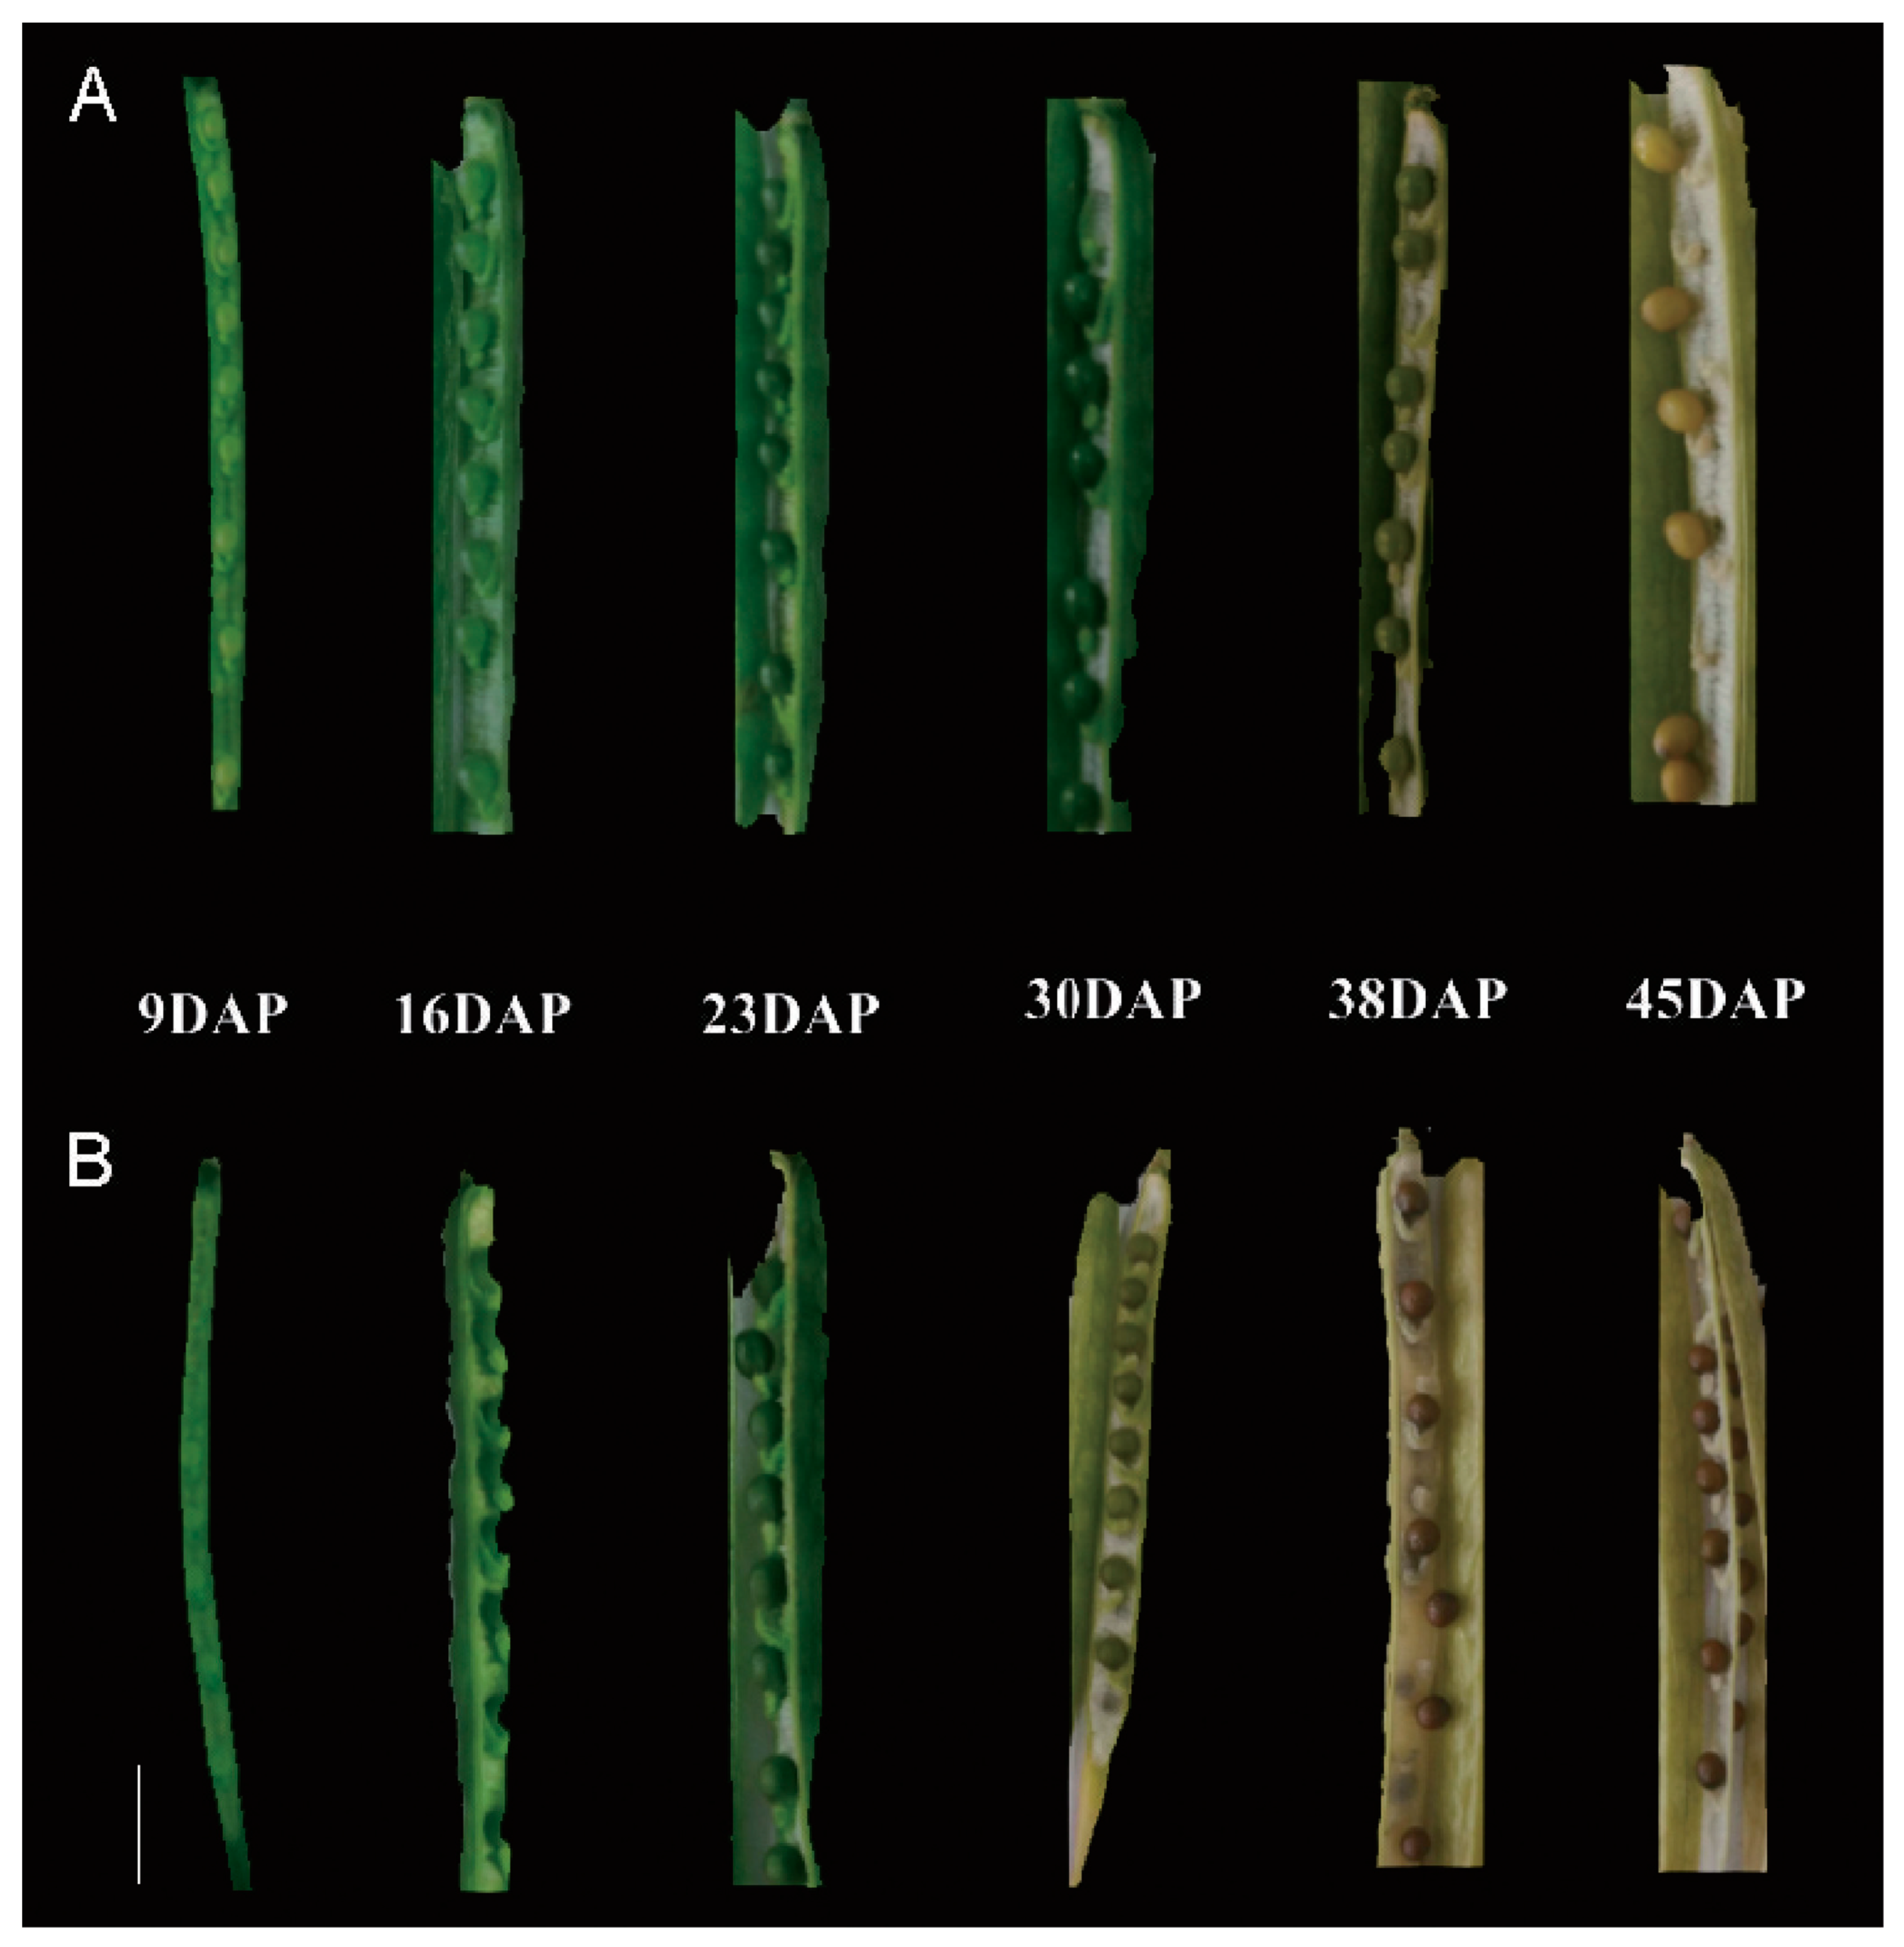
2.1. Critical Period of Seed Color Formation

To investigate the seed color formation process, we compared the seed colors of “Wuqi” and “Wugong” mustards at various seed development stages (Figure 1). In “Wuqi” mustard, the seed color exhibited a progression from light green at 9 to 16 days after pollination (DAP) to dark green at 23 and 30 DAP, followed by a transition to yellow at 38 DAP and eventually to full yellow at 45 DAP. In contrast, the seed of “Wugong” mustard displayed a light green color at 9 to 16 DAP, transitioning to dark green at 23 DAP and brown color at 30 DAP. The brown coloration became more pronounced at 38 and 45 DAP. These observations indicate a noticeable divergence in seed coat color between “Wuqi” and “Wugong” mustards, which becomes evident from 30 DAP.
The levels of flavonoids, anthocyanins, melanin, and total phenol were assessed at different seed developmental stages of “Wuqi” and “Wugong” mustards. The anthocyanin content and total phenol were consistently high at all stages, with the “Wugong” mustard exhibiting higher concentrations compared to the “Wuqi” mustard. During the developmental stages of seeds, the contents of flavonoid (except at 9 DAP and 16 DAP), anthocyanidin, and melanin and the total phenol of the “Wugong” mustard were significantly higher than those in the “Wuqi” mustard (p < 0.01). The contents of flavonoids, melanin, and total phenol in both “Wuqi” mustard and “Wugong” mustard steadily increased during seed development, with the maximum value detected at 45 DAP. Notably, the synthesis of these compounds occurred earlier in the “Wugong” mustard than the “Wuqi” mustard. The difference in flavonoid and anthocyanin contents in the two parents reached its maximum at 38 DAP and 30 DAP, respectively (Table 1). Therefore, the critical period in seed color formation was identified as 30 DAP.

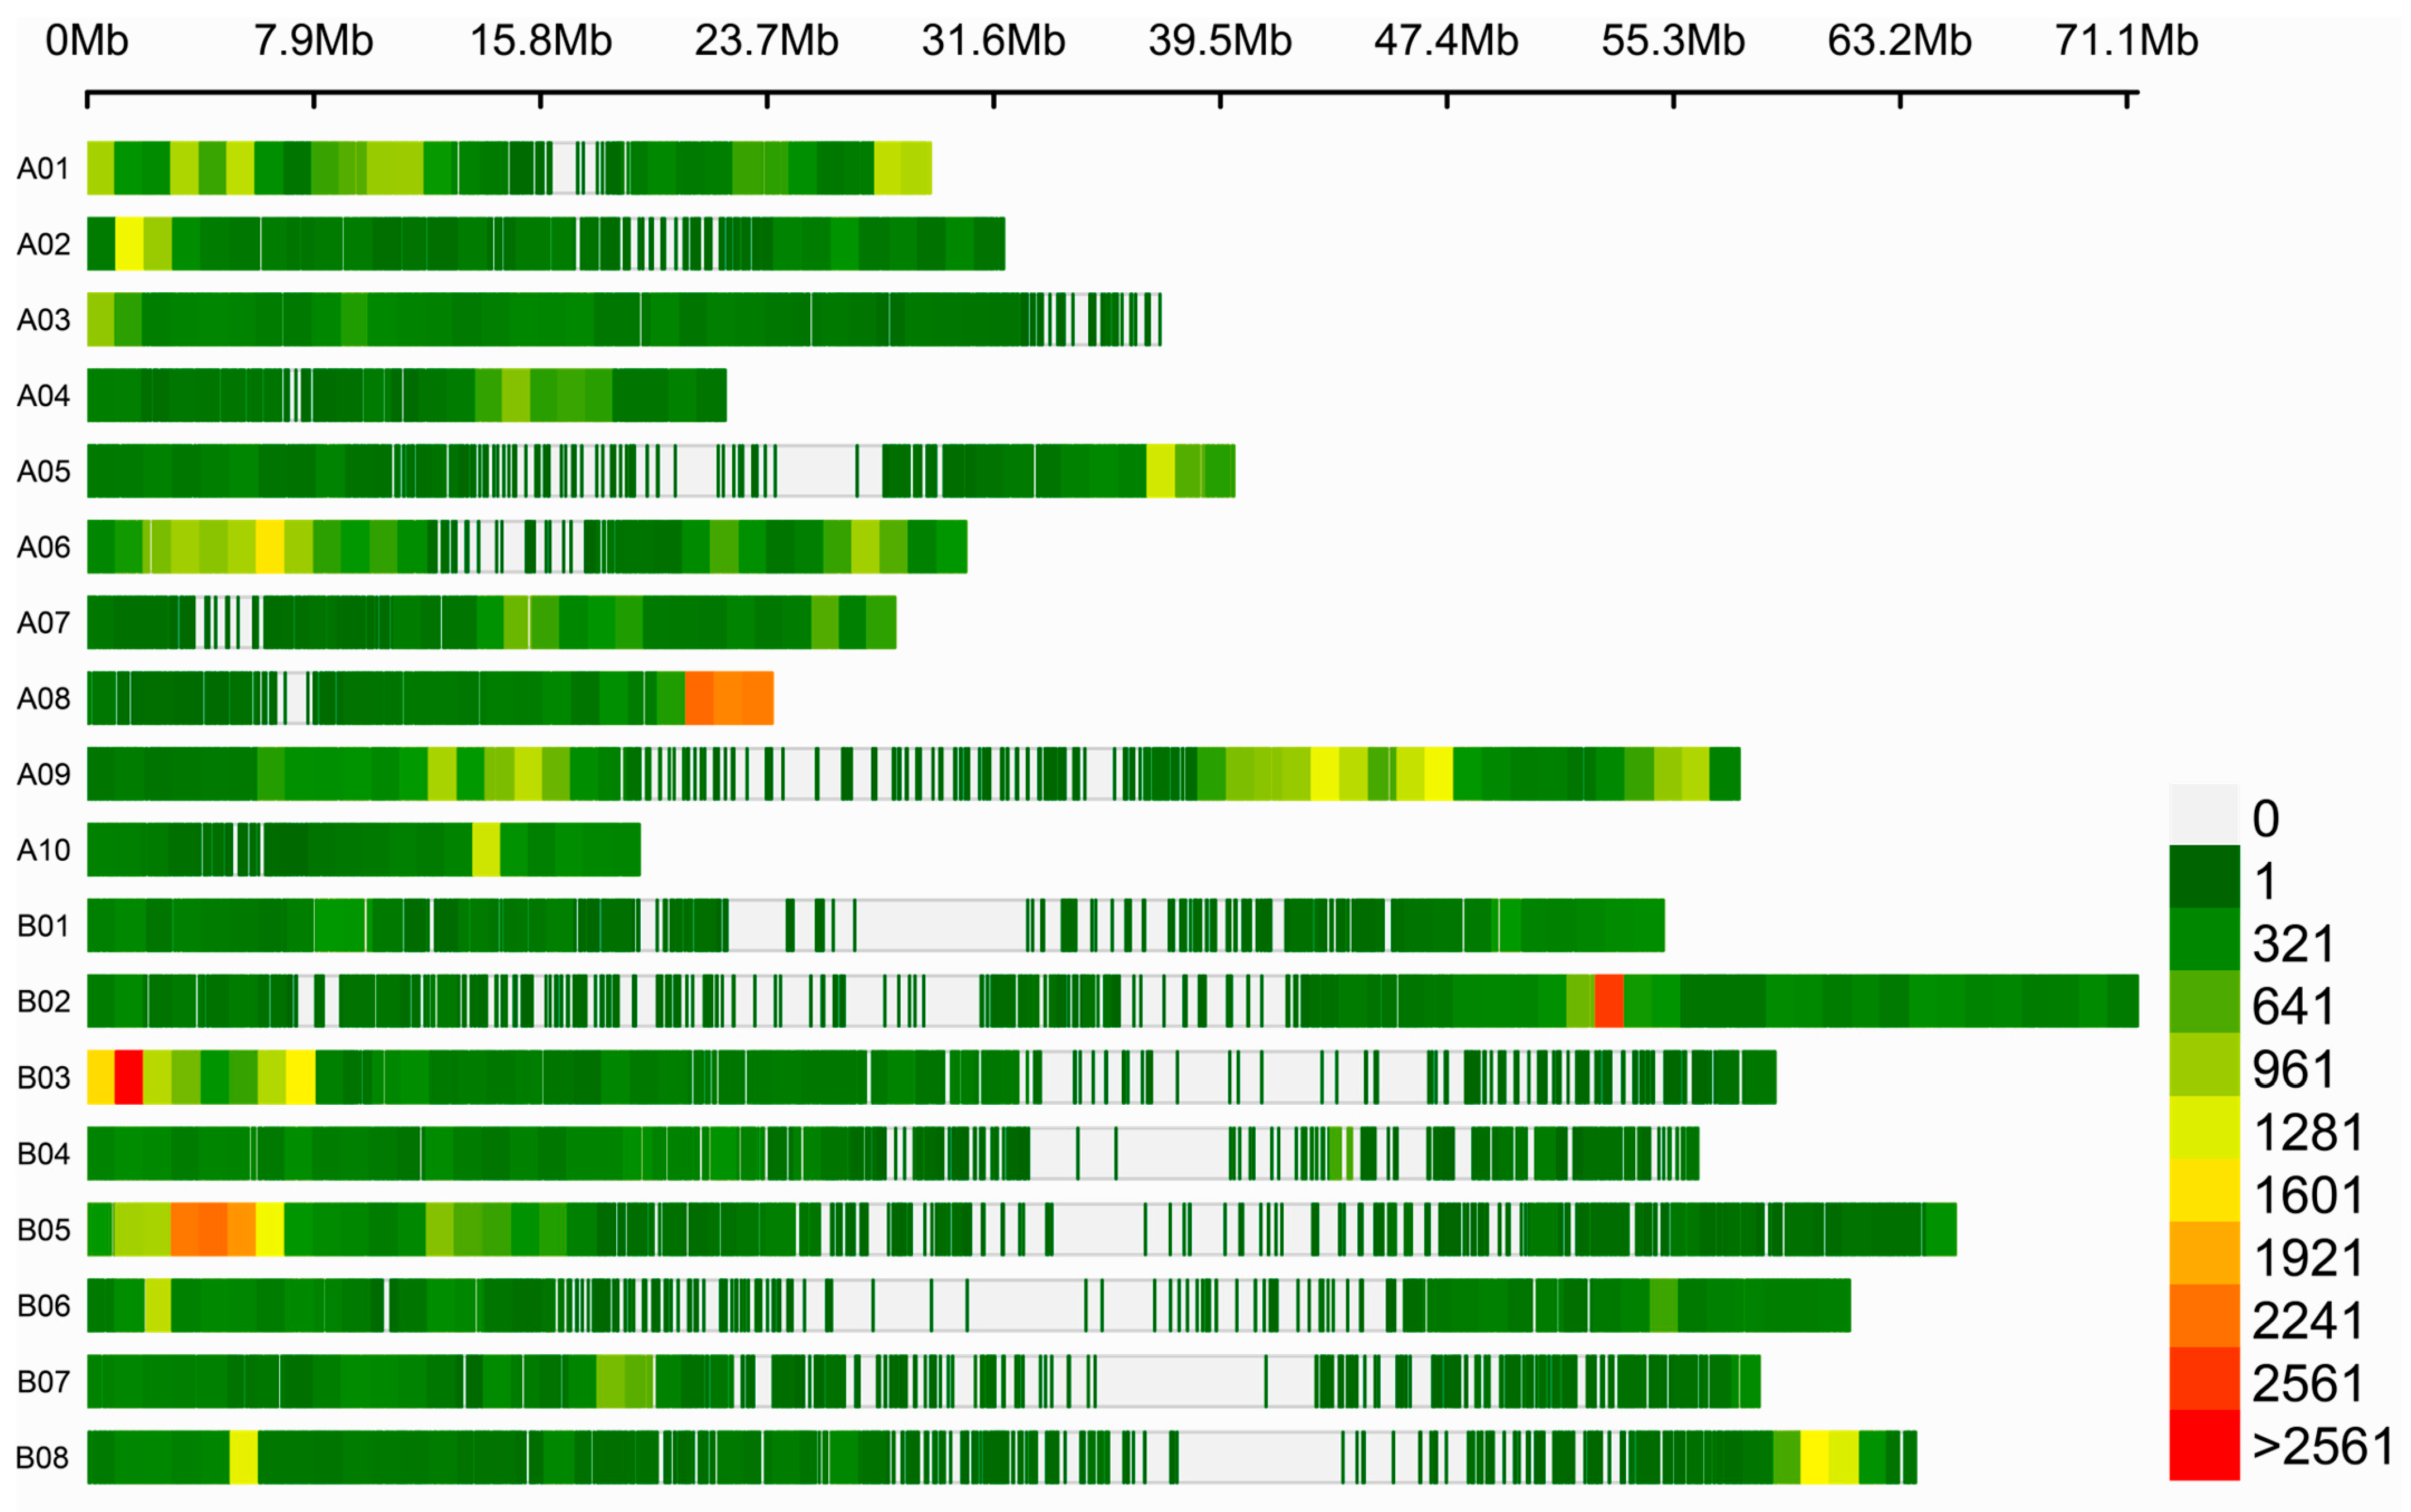
2.2. Alignment of BSR-Seq

In order to investigate the molecular mechanisms underlying the difference in seed coat colors between yellow-seeded and brown-seeded B. juncea and to pinpoint key genes regulating this trait, 30 extreme yellow-seeded (BY) and 30 brown-seeded (BB) samples at 30 DAP were selected from the BC9 population, derived from the cross between “Wuqi” and “Wugong” mustards, for bulked segregant RNA sequencing (BSR-Seq).
A total of 79.3 million clean reads were generated from the BB and BY pooled samples through BSR-Seq. After removing adaptor sequences and low-quality reads, RNA-seq generated 20,397,430–25,216,875 and 23,597,033–26,416,796 clean read pairs for the three replicates of BB and BY bulks, respectively. The percentage of bases with a quality score of Q30 exceeded 90.00%. Furthermore, 83.14–86.06% of the reads for the BB bulks aligned to those of the B. juncea cv.AU213 V1.0 [26] reference genome, in comparison to 89.19–90.11% of the reads for the BY bulks (Supplementary Table S1). Principal component analysis (PCA) revealed a clustering of replicates from each bulk along PC1 and PC2, collectively explaining 95% of the variance between samples (Figure 2A). These results affirm the accuracy and high quality of the sequencing data for BSR-Seq analysis, validating its suitability for further analysis.

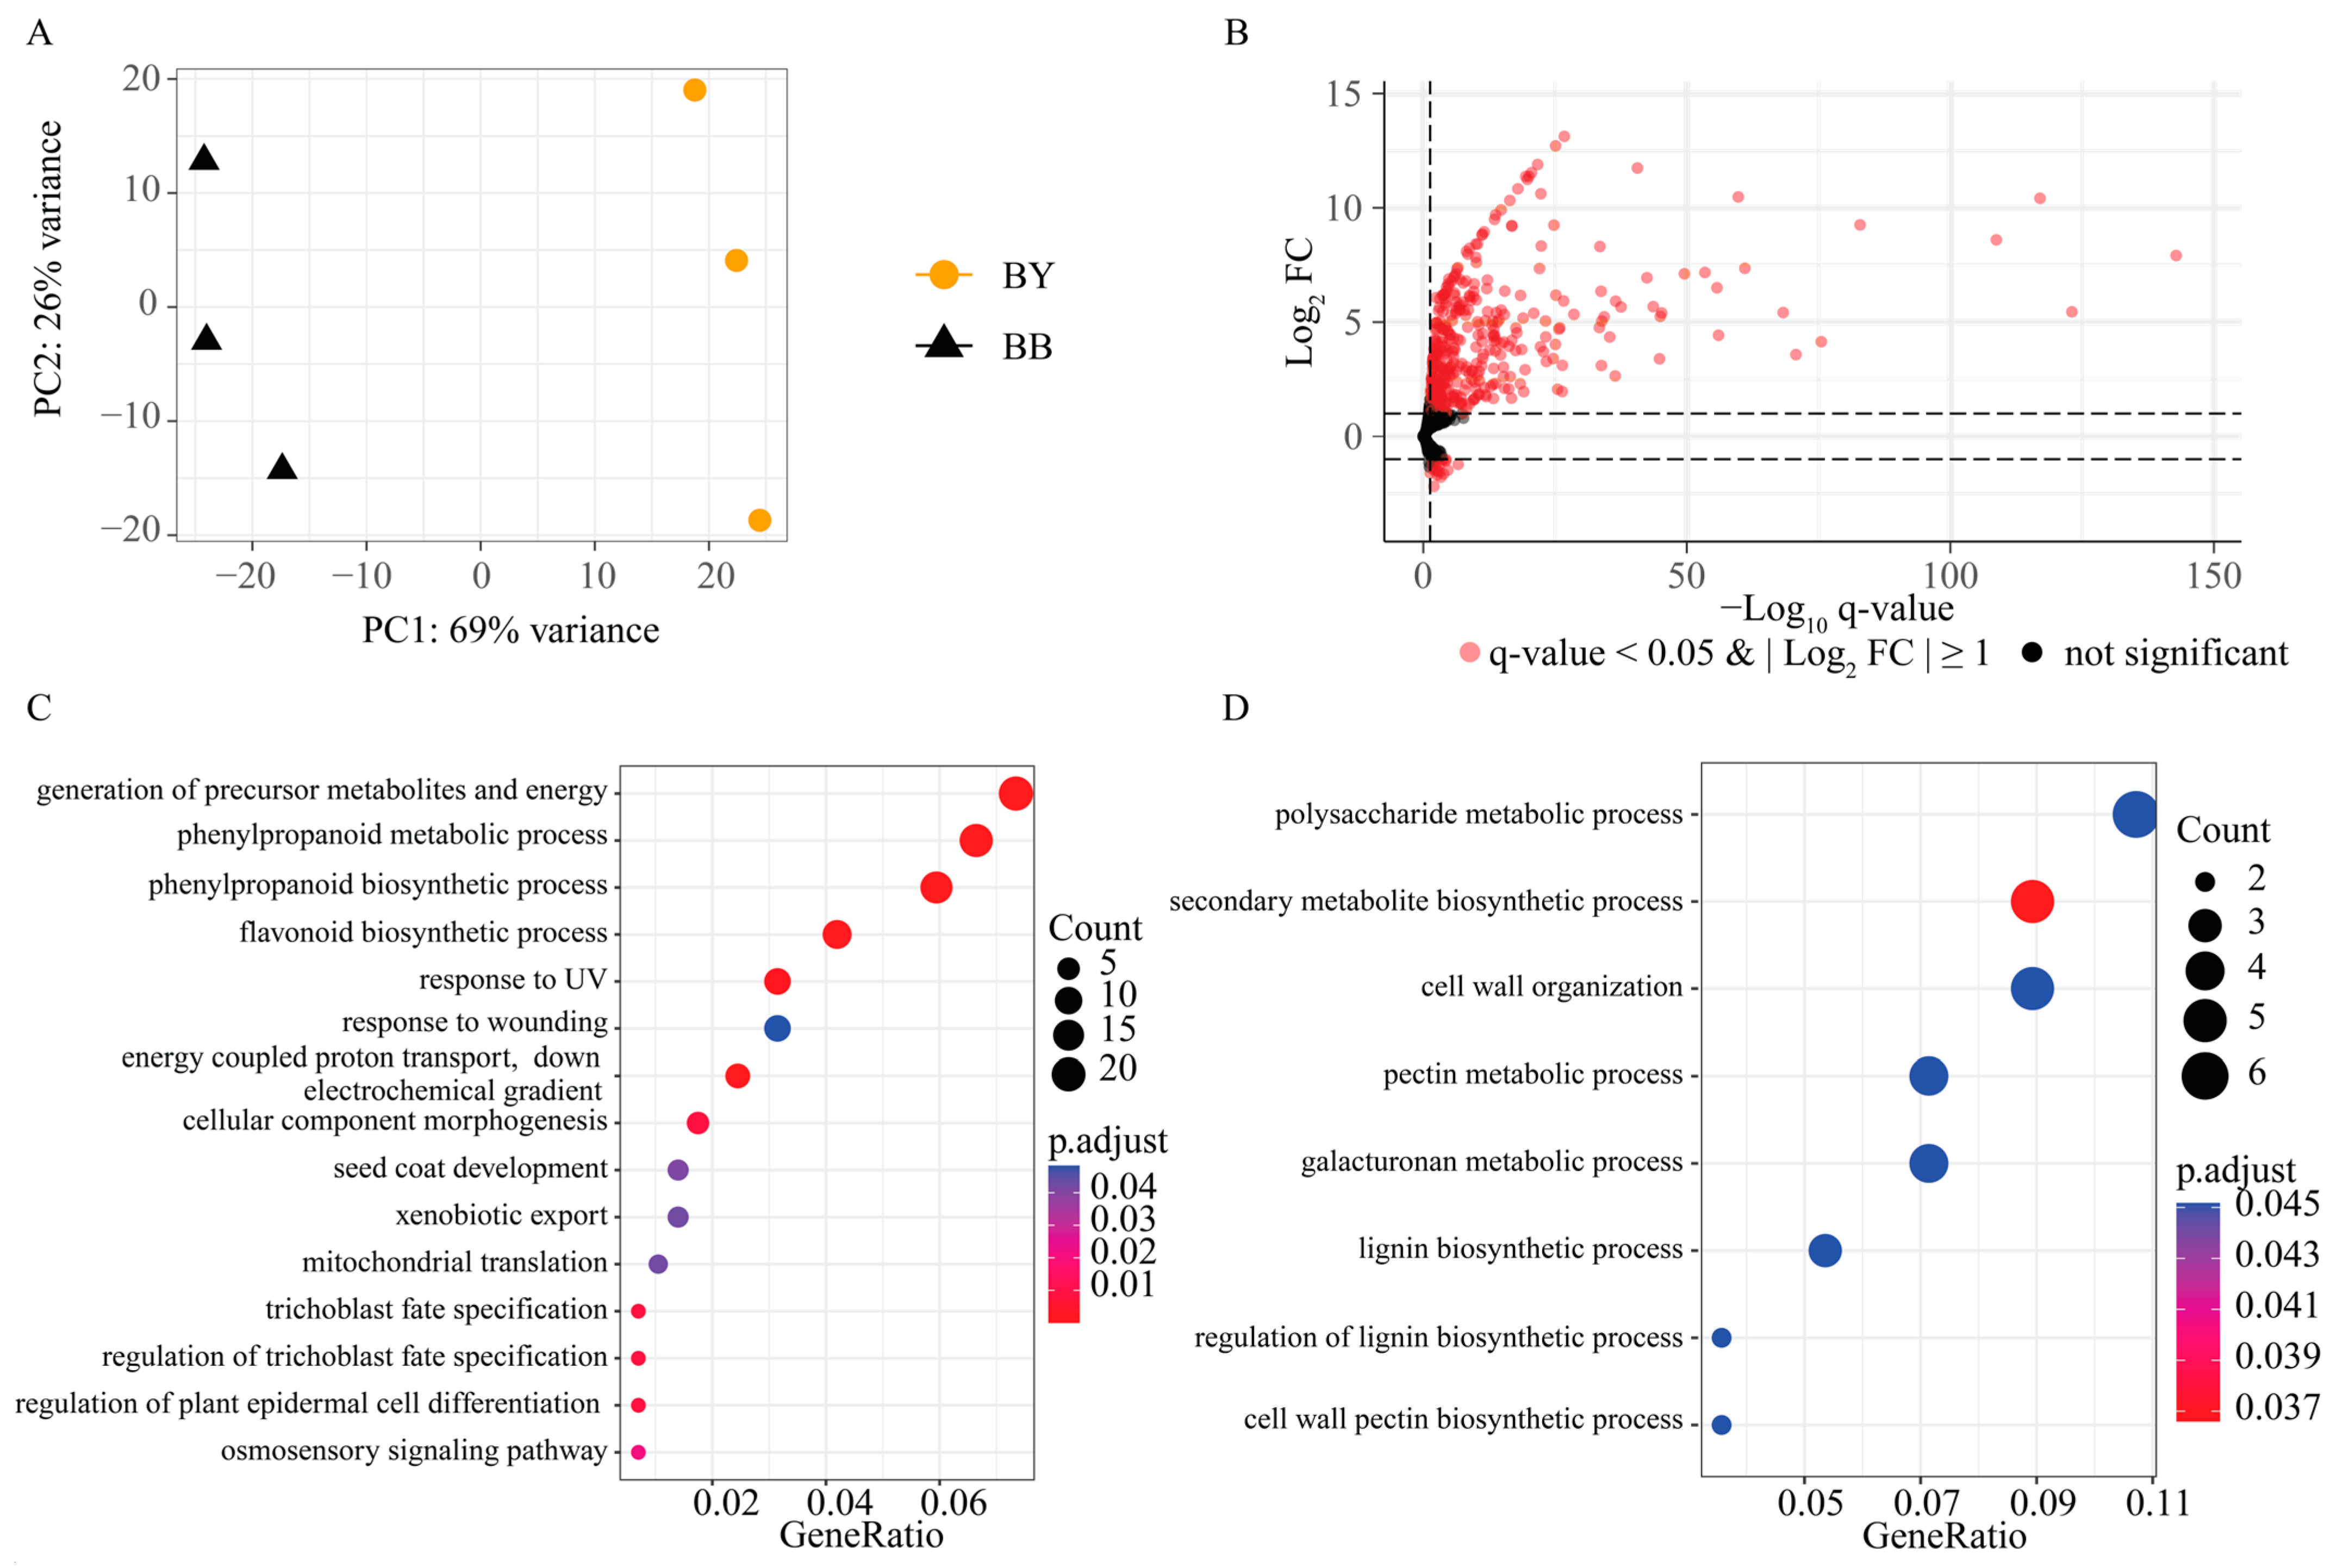
2.3. Identification of DEGs between the BY and BB Bulks

RNA-Seq analysis was performed to identify the DEGs between the BY and BB bulks. Of the 56,260 identified expressed genes, 511 were recognized as DEGs, meeting the criteria of |log2 FC| > 1 and padj < 0.05. Among these genes, 438 and 73 DEGs were up-regulated and down-regulated in BB bulks compared to BY bulks, respectively (Figure 2B and Supplementary Table S2). Furthermore, the up-regulated DEGs were predominantly enriched in biological processes such as phenylpropanoid metabolic process (GO:0009698), flavonoid biosynthetic process (GO:0009813), generation of precursor metabolites and energy (GO:0006091), and response to UV (GO:0009411) (Figure 2C). The down-regulated DEGs were mainly enriched in the pectin metabolic process (GO:0045488) (Figure 2D).

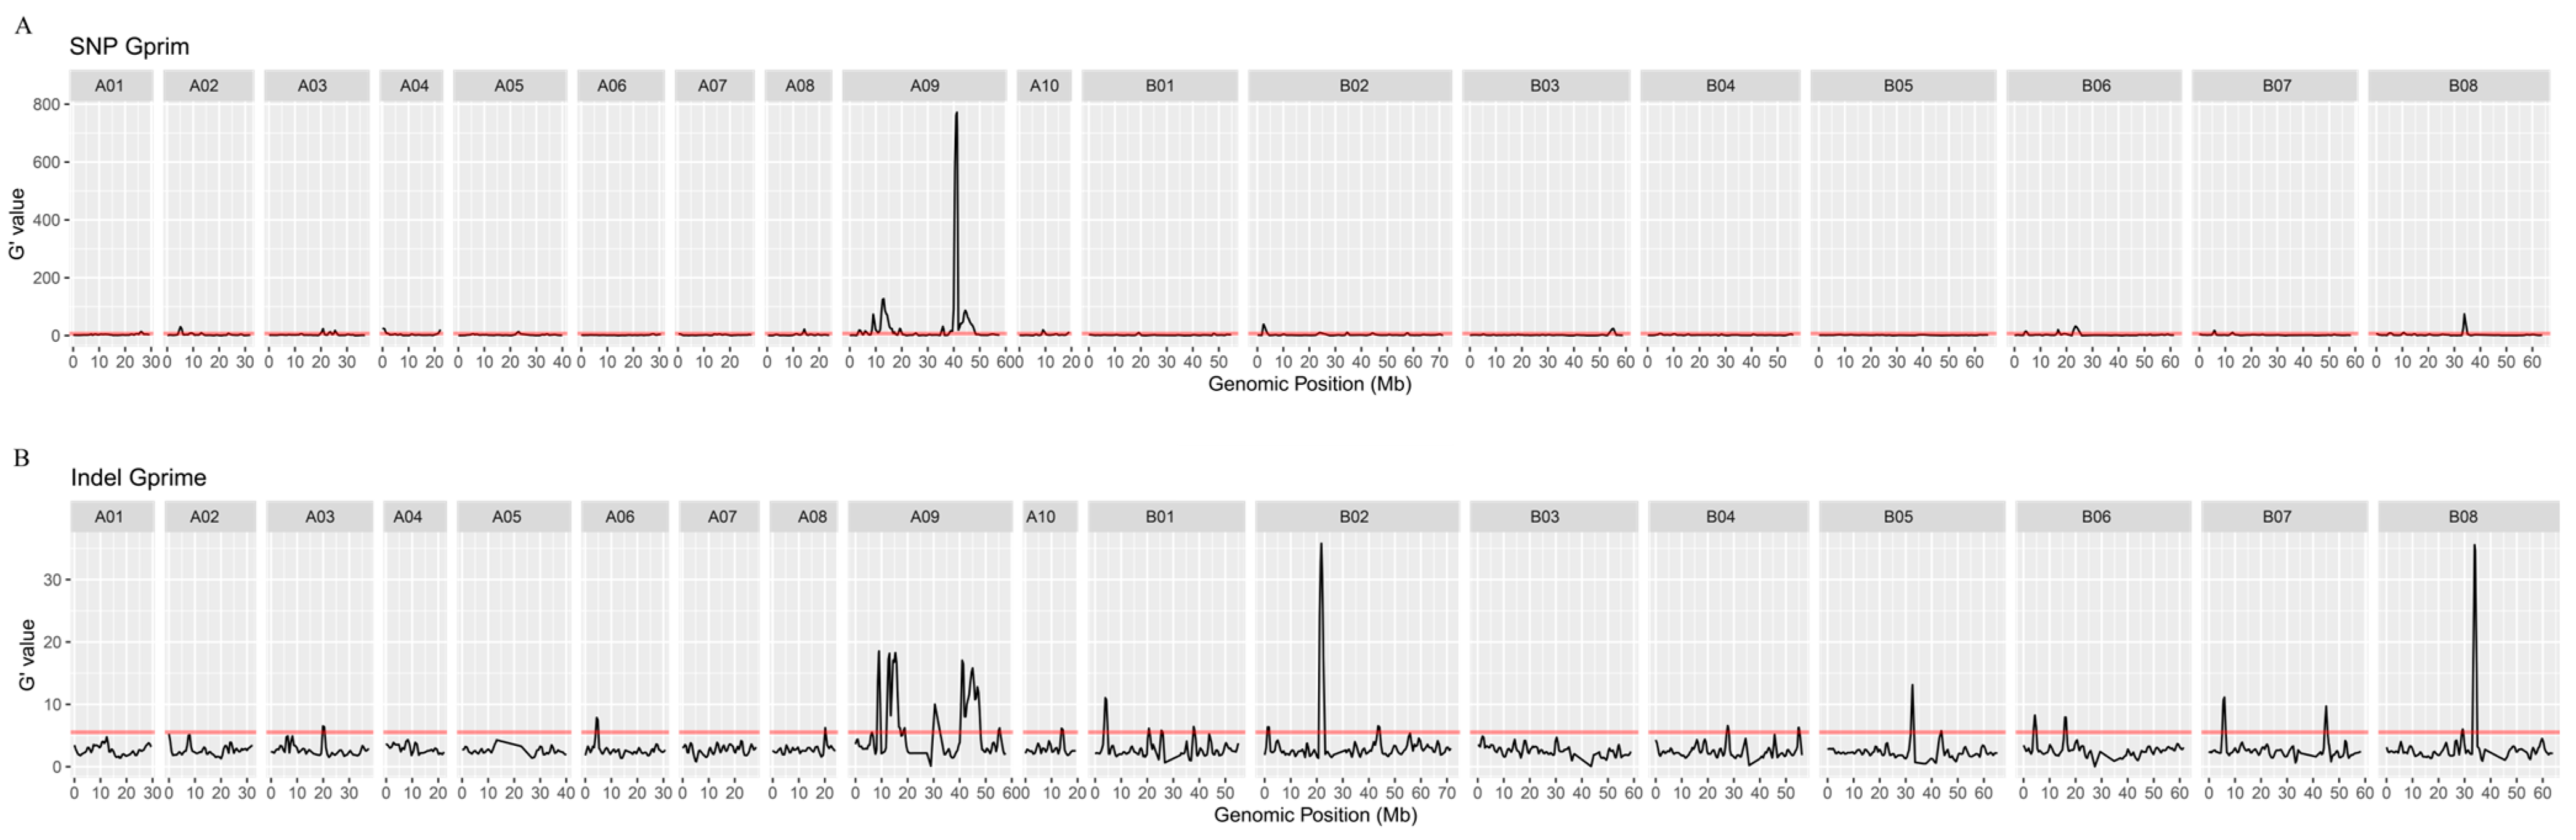
2.4. QTL Mapping of Seed Color Using BSR-Seq

To identify candidate QTLs related to yellow seed color, a total of 642,380 polymorphic SNPs and 388,259 INDELs between the pooled BB and BY samples were identified. After removing low read depth and low-quality SNPs and INDELs, 111,540 SNPs and 86,319 INDELs were retained for subsequent G’ analysis. Of these SNPs, 61,348 (55%) and 50,192 (45%) were situated on the A and B sub-genomes, respectively. Among these SNPs, 96,022 (76.91%) were located in exon regions, 9954 (7.973%) in intergenic regions, 7230 (5.791%) in intron regions, 6848 (5.49%) in 3′-UTR, and 3589 (2.88%) in 5′-UTR. Regarding the INDELs, 41,904 (49%) and 44,415 (51%) were distributed on the A and B sub-genomes, respectively (Figure 3 and Supplementary Table S3). The numbers of informative SNPs across 18 chromosomes ranged from 2276 (A10) to 15,545 (A09), while the numbers of informative INDELs ranged from 2,16 (A04) to 6974 (A09).
Subsequently, G’ analysis was used for mapping seed coat color genes. Seven significant QTLs were mapped on chromosome A09 with G’ analysis for SNPs. Among these, QTL qSCA09-7, spanning from 38.39 to 48.33 Mb, exhibited the highest mean G’ value, while QTL qSCA09-3, covering 8.26 to 17.32 Mb, emerged as the second most significant (Figure 4). The G’ values for the QTLs on other chromosomes were only slightly higher than the threshold, indicating that these were minor QTLs (Supplementary Table S4). It is worth noting that the regions of QTL qSCA09-3 and qSCA09-7 were also identified with G’ analysis for INDELs (Figure 4, Supplementary Table S5). Consequently, QTL qSCA09-3 and qSCA09-7 on chromosome A09 were identified as candidate QTLs associated with seed coat color. This region encompasses a total of 2724 annotated genes, as per the genome annotation information.

2.5. Overlapping Candidate Intervals and DEGs

In order to comprehensively and accurately identify genes governing seed coat color, 51 DEGs located in the region of qSCA09-3 and qSCA09-7 were identified as potential candidates. These candidate genes exhibited enrichment in GO terms, including response to UV-B and flavonoid biosynthetic process (Figure 5A and Table 2). To explore the molecular mechanism of seed color formation in B. juncea, protein–protein interaction (PPI) networks were constructed using the STRING database with these 51 candidate genes. Strikingly, the PPI networks of the candidate genes highlighted a predominant association with the flavonoid biosynthesis pathways (Figure 5B). Among these genes, BjuOA09G47290 (BjuA09PAL2), BjuOA09G49050 (BjuA09CHI1), BjuOA09G41640 (BjuA09CHS), BjuOA09G45170 (BjuA09F3H), and BjuOA09G20700 (BjuA09DFRA) emerged as the hub genes in the network, suggesting they might play critical roles in the seed color formation of B. juncea.
However, only two genes, namely, BjuA09PAL2 and BjuA09F3H, exhibited polymorphism between the BB and BY bulks (Table 3). We further compared the number of SNPs between the BY and BB bulks in these two genes. The analysis revealed 30 and 6 SNPs in BjuA09PAL2 and BjuA09F3H, respectively. To elucidate the role of these SNPs in the formation of yellow seed color, we compared the sequence of BjuA09PAL2 and BjuA09F3H in two additional B. juncea accessions: “T84-66” (brown-seed) [26] and “AU213” (yellow-seed) [26], respectively. Just one SNP was identified in BjuA09F3H between “T84-66” (brown-seed) and “AU213” (yellow-seed), and notably, this SNP did not align with the SNPs between BY and BB bulks. However, 23 SNPs between “T84-66” and “AU213” were identified in the region of BjuA09PAL2. Interestingly, 20 of these SNPs aligned with the SNPs between BY and BB bulks (Table 3). These results suggested that BjuA09PAL2 may be a pivotal gene associated with the regulation of seed color. Importantly, the Arabidopsis homolog of BjuA09PAL2 is AtPAL2, which encodes phenylalanine lyase.

3. Discussion

Yellow seed has been considered as a desirable trait related to seed quality for rapeseed breeders. However, the predominant approach for developing all-yellow seed materials in B. napus involves interspecific hybridization, resulting in challenges such as a low yellow seed rate and seediness [27,28]. Therefore, it is essential to explore the molecular mechanism of the yellow seed coloration of B. juncea, which possesses natural and original yellow seed genetic resources. In this study, we used a BC9 population derived from the cross of yellow-seeded mustard “Wuqi” and brown-seeded mustard “Wugong” to identify candidate genes controlling yellow seed color in B. juncea.
Over the years, substantial progress has been made in understanding the physiological and biochemical mechanisms of yellow seed coloration in rapeseed. In this study, we found that the products of the flavonoid pathway, such as flavonoid and anthocyanin, exhibited higher accumulation in brown-seeded mustard compared to yellow-seeded mustard, which is in agreement with the previous findings that the difference in seed coat color between the black seed and yellow seed is closely linked to polyphenols, flavonoids, anthocyanins, and melanin in Brassica species, maize, and wheat [16,29,30]. Compared with yellow-seeded mustard, the expression of most genes involved in the flavonoid synthesis pathway was significantly up-regulated in brown-seeded mustard, including 4CL, C4H, LDOX/TT18, PAL1, PAL2, PAL4, TT10, TT12, TT4, TT8, BAN, DFR/TT3, F3H/TT6, TT19, and CHI/TT5. The expression difference of genes involved in the flavonoid pathway was consistent with the previous findings [31,32,33]. Therefore, the mechanism of yellow seed coat coloration of B. juncea can be elucidated based on the variations in these key biochemical indices.
To date, numerous QTLs [19,21,34,35,36] and candidate genes [37,38,39,40] have been reported to be involved in determining the seed color of B. napus through methods such as QTL mapping, comparative genomic analysis, resequencing analysis, transcriptome analysis, and metabolome analysis. With the development of next-generation sequencing technology and the decline in sequencing costs, the genome sequence of many essential species has been successfully obtained. BSR-Seq, an economical and effective approach for gene mapping, is particularly valuable for species with reference genomes. Currently, the BSR-Seq mapping strategy has been widely used to map key genes in Brassica, maize, wheat, and other species [41,42,43,44]. In contrast to traditional methods, BSR-Seq yields comprehensive genetic information, such as SNPs and gene expression data, which greatly accelerates the process of gene mapping. In this study, BSR-Seq was used to locate yellow seed color genes on the A09 chromosome, which is consistent with previous studies which uncovered that the seed color of B. napus is regulated by a limited number of QTLs located on chromosome A09 [20,21,35].
Several genes have been functionally validated in B. napus, such as TT7, TT18, TT10, TT1, TT2, and TT12 [5,38,39]. The majority of genes identified in Brassica species as regulators of yellow seed color are associated with the flavonoid synthesis pathway and anthocyanin synthesis pathway. In this study, we identified a novel candidate gene, BjuPAL2, potentially controlling the yellow seed color trait by integrating DEG analysis, BSR analysis, and comparative genomic analyses of published yellow- and brown-seeded reference genomes. Phenylalanine ammonia-lyase (PAL) initiates the phenylpropanoid pathway, which produces a range of important secondary metabolites. Serving as the initial phase of the flavonoid synthesis pathway, the phenylpropanid synthesis pathway plays an important role in anthocyanin synthesis. There are four PAL genes (PAL1, PAL2, PAL3, and PAL4) in Arabidopsis. Huang et al. reported that the double mutants of PAL1 and PAL2 produced yellow seeds and attributed this to the absence of condensed tannin pigments in the seed. These mutants exhibited a heightened sensitivity to ultraviolet-B light but an increased tolerance to drought [45]. Consequently, exploring the additional functions of PAL in Brassica species is imperative for a comprehensive understanding of the role of PAL in plants. Further studies are needed to verity its function in rapeseed using transgenic technology.

4. Materials and Methods

4.1. Plant Materials and Growth Condition

Inbred lines of “Wuqi” (yellow-seeded) and “Wugong” (brown-seeded) mustard, along with the backcross 9 population (BC9) derived from the cross between “Wuqi” and “Wugong” (“Wuqi” is the recurrent parent) were used in this study. The parental lines were cultivated in a greenhouse (Northwest A&F University, Yangling, Shaanxi, China), maintaining a temperature of 25 °C during the day (16 h) and 20 °C at night (8 h). Seeds at various developmental stages (9, 16, 23, 30, 38, and 45 DAP) from both parental lines were systematically observed and documented. Meanwhile, these seeds were collected, immediately frozen in liquid nitrogen and stored at −80 °C. Plants of BC9 were grown in the field station of Northwest A&F University for BSR-Seq.

4.2. Determination of Total Flavonoids, Anthocyanin, Total Phenol, and Melanin Content

The contents of flavonoids, anthocyanin, and total phenol were measured by a colorimetric assay with a hydrochloric acid methanol method [46]. A total of 0.1 g seed was ground in 5 mL acetone (Sigma-Aldrich, Shanghai, China), and then incubated in water bath at 30 °C for 1 h to extract chlorophyll and lutein. Subsequently, the mixture was centrifuged at 3500 r/min for 15 min, and the supernatant was discarded. The precipitate was re-suspended in 5 mL methanol containing 5% hydrochloric acid and incubated in water bath at 60 °C for 1 h. The supernatant was collected, and the precipitate was re-extracted three times following the forementioned procedure. The extracts were combined and diluted in methanol containing 5% hydrochloric acid to a total volume of 10 mL. The content of total phenol [46], flavonoid [47], and anthocyanin [46] was determined by measuring the absorbance using spectrophotometer at 280 nm, 325 nm, and 530 nm, respectively. Regarding melanin, the measurement process is basically the same, except for the last step. After incubation at 60 °C for 1 h, the precipitate was immersed in 2 mL 2% NaOH, and then incubated in a 70 °C water bath until the color of the material completely faded. The melanin content was determined by measuring the absorbance of the mixture at 290 nm using spectrophotometer.

4.3. Bulk Construction and Bulked Segregant RNA Sequencing

At 30 DAP, seeds from individual plants in the BC9 population were collected and stored in liquid nitrogen. The seed color of each individual plant was recorded when the seeds were mature, and the seeds were categorized into yellow-seed (BY) and brown-seed (BY) bulks. Prior to RNA extraction, the seeds were pooled, with each pool consisting of 30 seeds from lines of BY and BB bulks, respectively. The number of BC9 lines in each bulk is listed in Table S1, and each bulk comprises 3 biological replicates for RNA sequencing (BSR-Seq). An RNA prep Pure Plant Kit (TIAN GEN, Beijing, China) was used for RNA extraction from each sample following the manufacturer’s instructions. The RNA concentration and quality were checked using a NanoDrop 2000c Spectrophotometer and an Agilent Bioanalyzer (RIN) for each sample. The mRNA was isolated and concentrated using magnetic beads attached with oligo d(T) for cDNA library preparation. The first-strand cDNA was synthesized from the mRNA using random hexamers. The cDNA libraries were prepared by ligating the cDNA fragments to the Illumina adapter followed by PCR amplification and purification with AMPure XP beads. The libraries were sequenced on an Illumina HiSeq 2000 platform with paired-end 150 bp reads by the SAGENE Company in Guangzhou, China.

4.4. Differentially Expressed Gene (DEG) Analysis

The raw reads with 150 paired-end base pair (bp) were filtered, and the clean reads were mapped to the Brassica juncea cv.AU213 V1.0 reference genome using Hisat2. Gene read counts were quantified by HTSeq. To filter genes with very low expression, a read count threshold of 5 was applied, retaining only those genes with at least 5 reads in one sample for subsequent analysis. The DESeq2 R package was employed to conduct differential expression analysis between the BY and BB pools. Genes were identified as differentially expressed genes if they met the criteria of |log2 FC| ≥ 1 and adjusted p-value (FDR) < 0.01. A principal component analysis (PCA) was carried out and visualized by the plotPCA() function in the DESeq2 package. We used homology-based methods to characterize the function of the DEGs in B. juncea, and the protein sequences of DEGs were aligned to Arabidopsis protein sequences using BLASTP (an E value cutoff of 1× 10⁻¹⁰). Gene Ontology (GO) enrichment analysis was performed by the clusterProfiler R package. GO terms with a corrected FDR ≤ 0.05 were considered significantly enriched.

4.5. Variant Detection and BSA (Bulk Segregant Analysis) Association Mapping

Prior to conducting the bulk segregant analysis, the sequencing reads from each individual were mapped to the Brassica juncea cv.AU213 V1.0 reference genome using STAR with two pass-mode. Additionally, subsequent SNP calling was identified by GATK 4.2.2.0. The variant information of each replicate was merged by the GATK for BY and BB bulks. SNPs and INDEls were first filtered for lower mapping quality (MQ < 25) and lower sequencing depth (DP < 3) and reference allele frequency < 0.05. After filtering, 111,540 SNPs and 86,319 INDELs were used for further analysis.
We performed BSA using G’ statistical approaches implemented in the QTLseqr [48] R package. Using the smoothed G’ statistic enables noise reduction and effectively addresses linkage disequilibrium between SNPs. The tricube smoothed Δ (SNP-index) and Δ (INDEL-index) were calculated within a 1 Mbp sliding window for both BB and BY bulks. The G and G’ statistics were calculated based on observed and expected allele depths, with smoothing achieved using a tricube smoothing kernel [49]. p-values were estimated using the non-parametric method described by Magwene [49]. The genomic region responsible for seed color was defined based on a significance threshold of Benjamini–Hochberg adjusted p-value < 0.05.

5. Conclusions

Overall, based on the BSR-Seq analysis, two candidate QTLs related to yellow trait in B. juncea were located on chromosome A09. In addition, DEG analysis showed that a large proportion of DEGs were enriched to flavonoid biosynthetic process. Meanwhile, five DEGs involved in the flavonoid biosynthetic process (BjuA09PAL2, BjuA09TT5, BjuA09TT6, BjuA09TT4, BjuA09TT3) were located in the two candidate QTLs. Combining comparative genomic analyses of published yellow- and brown-seeded reference genomes, we identified a novel candidate gene, BjuA09PAL2, potentially controlling the yellow seed trait of B. juncea. The candidate gene enables the development of molecular markers and will provide support for yellow seed breeding in rapeseed using molecular marker assisted selection.

Supplementary Materials

The following supporting information can be downloaded at: https://www.mdpi.com/article/10.3390/ijms25031573/s1.

Author Contributions

Z.H. and A.X. were responsible for designing and supervising this study; Y.W. and K.L. wrote the original manuscript draft; Y.W., H.L., L.L., X.L. and W.Z. performed experiments; Y.W. and K.L. performed data analysis; K.L., Z.H. and A.X. reviewed and edited the manuscript. All authors have read and agreed to the published version of the manuscript.

Funding

The research was supported by the key research and development projects of Yangling Seed-industry Innovation Center (Ylzy-yc2021-01), the Shaanxi Province “two chain” fusion crop breeding key project (2021LLRH-07), the rapeseed industry innovation project (2021LLRH-07-03), and the collection, mining, creation and utilization of excellent germplasm resources of rapeseed (2021LLRH-07-03-01-01).

Institutional Review Board Statement

Not applicable.

Informed Consent Statement

Not applicable.

Data Availability Statement

The datasets generated during the current study are available in the Sequence Read Archive (SRA) database of National Center for Biotechnology Information (NCBI) under accession PRJNA1044267.

Conflicts of Interest

The authors declare no conflict of interest.

References

  1. El-Esawi, M. Taxonomic relationships and biochemical genetic characterization of Brassica resources: Towards a recent platform for germplasm improvement and utilization. Annu. Res. Rev. Biol. 2015, 8, 1–11. [Google Scholar] [CrossRef]
  2. Wang, X.; Long, Y.; Wang, N.; Zou, J.; Ding, G.; Broadley, M.R.; White, P.J.; Yuan, P.; Zhang, Q.; Luo, Z.; et al. Breeding histories and selection criteria for oilseed rape in Europe and China identified by genome wide pedigree dissection. Sci. Rep. 2017, 7, 1916. [Google Scholar] [CrossRef]
  3. Nesi, N.; Delourme, R.; Brégeon, M.; Falentin, C.; Renard, M. Genetic and molecular approaches to improve nutritional value of Brassica napus L. Seed. Comptes Rendus Biol. 2008, 331, 763–771. [Google Scholar] [CrossRef]
  4. Zhang, X.K.; Yang, G.T.; Chen, L.; Yin, J.M.; Tang, Z.L.; Li, J.N. Physiological differences between yellow-seeded and black-seeded rapeseed (Brassica napus L.) with different testa characteristics during artificial ageing. Seed Sci. Technol. 2006, 34, 373–381. [Google Scholar] [CrossRef]
  5. Qu, C.; Zhu, M.; Hu, R.; Niu, Y.; Chen, S.; Zhao, H.; Li, C.; Wang, Z.; Yin, N.; Sun, F.; et al. Comparative genomic analyses reveal the genetic basis of the yellow-seed trait in Brassica napus. Nat. Commun. 2023, 14, 5194. [Google Scholar] [CrossRef]
  6. Rahman, M.H. Production of yellow-seeded Brassica napus through interspecific crosses. Plant Breed 2001, 120, 463–472. [Google Scholar] [CrossRef]
  7. Akhov, L.; Ashe, P.; Tan, Y.; Datla, R.; Selvaraj, G. Proanthocyanidin biosynthesis in the seed coat of yellow-seeded, canola quality Brassica napus YN01-429 is constrained at the committed step catalyzed by dihydroflavonol 4-reductase. Botany 2009, 87, 616–625. [Google Scholar] [CrossRef]
  8. Marles, M.S.; Gruber, M.Y. Histochemical characterisation of unextractable seed coat pigments and quantification of extractable lignin in the Brassicaceae. J. Sci. Food Agric. 2004, 84, 251–262. [Google Scholar] [CrossRef]
  9. Nesi, N.; Debeaujon, I.; Jond, C.; Pelletier, G.; Caboche, M.; Lepiniec, L. The TT8 gene encodes a basic helix-loop-helix domain protein required for expression of DFR and BAN genes in Arabidopsis siliques. Plant Cell 2000, 12, 1863–1878. [Google Scholar] [CrossRef]
  10. Yang, S.C.; Arasu, M.V.; Chun, J.H.; Jang, Y.S.; Lee, Y.H.; Kim, I.H.; Lee, K.T.; Hong, S.T.; Kim, S.J. Identification and determination of phenolic compounds in rapeseed meals (Brassica napus L.). J. Agric. Chem. Environ. 2015, 4, 14–23. [Google Scholar] [CrossRef]
  11. Marles, M.A.S.; Gruber, M.Y.; Scoles, G.J.; Muir, A.D. Pigmentation in the developing seed coat and seedling leaves of Brassica Carinata is controlled at the dihydroflavonol reductase locus. Phytochemistry 2003, 62, 663–672. [Google Scholar] [CrossRef]
  12. Winkel-Shirley, B. Biosynthesis of flavonoids and effects of stress. Curr. Opin. Plant Biolog. 2002, 5, 218–223. [Google Scholar] [CrossRef]
  13. Lepiniec, L.; Debeaujon, I.; Routaboul, J.-M.; Baudry, A.; Pourcel, L.; Nesi, N.; Caboche, M. Genetics and biochemistry of seed flavonoids. Annu. Rev. Plant Biol. 2006, 57, 405–430. [Google Scholar] [CrossRef]
  14. Bradley, J.M.; Davies, K.M.; Deroles, S.C.; Bloor, S.J.; Lewis, D.H. The maize Lc regulatory gene up-regulates the flavonoid biosynthetic pathway of petunia. Plant J. 1998, 13, 381–392. [Google Scholar] [CrossRef]
  15. Saito, K.; Yonekura-Sakakibara, K.; Nakabayashi, R.; Higashi, Y.; Yamazaki, M.; Tohge, T.; Fernie, A.R. The flavonoid biosynthetic pathway in Arabidopsis: Structural and genetic Diversity. Plant Physiol. Biochem. 2013, 72, 21–34. [Google Scholar] [CrossRef]
  16. Glagoleva, A.Y.; Shoeva, O.Y.; Khlestkina, E.K. Melanin pigment in plants: Current knowledge and future perspectives. Front. Plant Sci. 2020, 11, 770. [Google Scholar] [CrossRef]
  17. Badani, A.G.; Snowdon, R.J.; Wittkop, B.; Lipsa, F.D.; Baetzel, R.; Horn, R.; De Haro, A.; Font, R.; Lühs, W.; Friedt, W. Colocalization of a partially dominant gene for yellow seed colour with a major QTL Influencing acid detergent fibre (ADF) content in different crosses of oilseed rape (Brassica napus). Genome 2006, 49, 1499–1509. [Google Scholar] [CrossRef]
  18. Liu, Z.W.; Fu, T.D.; Tu, J.X.; Chen, B.Y. Inheritance of seed colour and identification of RAPD and AFLP markers linked to the seed colour gene in rapeseed (Brassica napus L.). Theor. Appl. Genet. 2005, 110, 303–310. [Google Scholar] [CrossRef]
  19. Zhang, Y.; Li, X.; Chen, W.; Yi, B.; Wen, J.; Shen, J.X.; Ma, C.Z.; Chen, B.Y.; Tu, J.X.; Fu, T.D. Identification of two major QTL for yellow seed color in two crosses of resynthesized Brassica napus line No. 2127-17. Mol. Breeding 2011, 28, 335–342. [Google Scholar] [CrossRef]
  20. Stein, A.; Wittkop, B.; Liu, L.; Obermeier, C.; Friedt, W.; Snowdon, R.J. Dissection of a major QTL for seed colour and fibre content in Brassica napus reveals colocalization with candidate genes for phenylpropanoid biosynthesis and flavonoid deposition. Plant Breed 2013, 132, 382–389. [Google Scholar] [CrossRef]
  21. Chao, H.; Guo, L.; Zhao, W.; Li, H.; Li, M. A Major yellow-seed QTL on chromosome A09 significantly increases the oil content and reduces the fiber content of seed in Brassica napus. Theor. Appl. Genet. 2022, 135, 1293–1305. [Google Scholar] [CrossRef]
  22. Qu, C.; Fu, F.; Lu, K.; Zhang, K.; Wang, R.; Xu, X.; Wang, M.; Lu, J.; Wan, H.; Zhanglin, T.; et al. Differential accumulation of phenolic compounds and expression of related genes in black- and yellow-seeded Brassica napus. J. Exp. Bot. 2013, 64, 2885–2898. [Google Scholar] [CrossRef] [PubMed]
  23. Kang, L.; Qian, L.; Zheng, M.; Chen, L.; Chen, H.; Yang, L.; You, L.; Yang, B.; Yan, M.; Gu, Y.; et al. Genomic insights into the origin, domestication and diversification of Brassica Juncea. Nat. Genet. 2021, 53, 1392–1402. [Google Scholar] [CrossRef] [PubMed]
  24. Huang, Z.; Ban, Y.; Yang, L.; Zhang, Y.; Li, H.; Xiao, E.; Xu, A.; Zhang, D. Fine mapping of the yellow seed locus in Brassica Juncea L. Genome 2012, 55, 8–14. [Google Scholar] [CrossRef] [PubMed]
  25. Li, X.; Chen, L.; Hong, M.; Zhang, Y.; Zu, F.; Wen, J.; Yi, B.; Ma, C.; Shen, J.; Tu, J.; et al. A large insertion in bHLH transcription factor BrTT8 resulting in yellow seed coat in Brassica rapa. PLoS ONE 2012, 7, e44145. [Google Scholar] [CrossRef] [PubMed]
  26. Yang, J.; Wang, J.; Li, Z.; Li, X.; He, Z.; Zhang, L.; Sha, T.; Lyu, X.; Chen, S.; Gu, Y.; et al. Genomic signatures of vegetable and oilseed allopolyploid Brassica Juncea and genetic loci controlling the accumulation of glucosinolates. Plant. Biotech. J. 2021, 19, 2619–2628. [Google Scholar] [CrossRef]
  27. Wen, J.; Zhu, L.; Qi, L.; Ke, H.; Yi, B.; Shen, J.; Tu, J.; Ma, C.; Fu, T. Characterization of interploid hybrids from crosses between Brassica Juncea and B. Oleracea and the production of yellow-seeded B. napus. Theor. Appl. Genet. 2012, 125, 19–32. [Google Scholar] [CrossRef]
  28. Rashid, A.; Rakow, G.; Downey, R.K. Development of yellow seeded Brassica napus through interspecific crosses. Plant Breeding 1994, 112, 127–134. [Google Scholar] [CrossRef]
  29. Flores, P.C.; Yoon, J.S.; Kim, D.Y.; Seo, Y.W. Transcriptome analysis of MYB genes and patterns of anthocyanin accumulation during seed development in wheat. Evol. Bioinform. Online 2022, 18, 117693432210933. [Google Scholar] [CrossRef]
  30. Lu, N.; Jun, J.H.; Li, Y.; Dixon, R.A. An unconventional proanthocyanidin pathway in maize. Nat. Commun. 2023, 14, 4349. [Google Scholar] [CrossRef]
  31. Shen, S.; Tang, Y.; Zhang, C.; Yin, N.; Mao, Y.; Sun, F.; Chen, S.; Hu, R.; Liu, X.; Shang, G.; et al. Metabolite profiling and transcriptome analysis provide insight into seed coat color in Brassica juncea. Int. J. Mol. Sci. 2021, 22, 7215. [Google Scholar] [CrossRef] [PubMed]
  32. Rong, H.; Yang, W.; Xie, T.; Wang, Y.; Wang, X.; Jiang, J.; Wang, Y. Transcriptional profiling between yellow- and black-seeded Brassica napus reveals molecular modulations on flavonoid and fatty acid content. J. Int. Agric. 2022, 21, 2211–2226. [Google Scholar] [CrossRef]
  33. Jiang, J.; Zhu, S.; Yuan, Y.; Wang, Y.; Zeng, L.; Batley, J.; Wang, Y.P. Transcriptomic comparison between developing seeds of yellow- and black-seeded Brassica napus reveals that genes influence seed quality. BMC Plant Biol. 2019, 19, 203. [Google Scholar] [CrossRef] [PubMed]
  34. Fu, F.Y.; Liu, L.Z.; Chai, Y.-R.; Chen, L.; Yang, T.; Jin, M.Y.; Ma, A.F.; Yan, X.Y.; Zhang, Z.S.; Li, J.N. Localization of QTLs for seed color using recombinant inbred lines of Brassica napus in different environments. Genome 2007, 50, 840–854. [Google Scholar] [CrossRef] [PubMed]
  35. Wang, J.; Xian, X.; Xu, X.; Qu, C.; Lu, K.; Li, J.; Liu, L. Genome-wide association mapping of seed coat color in Brassica napus. J. Agric. Food Chem. 2017, 65, 5229–5237. [Google Scholar] [CrossRef]
  36. Wang, F.; He, J.; Shi, J.; Zheng, T.; Xu, F.; Wu, G.; Liu, R.; Liu, S. embryonal control of yellow seed coat locus ECY1 is related to alanine and phenylalanine metabolism in the seed embryo of Brassica napus. G3 Genes Genom. Genet. 2016, 6, 1073–1081. [Google Scholar] [CrossRef]
  37. Lian, J.; Lu, X.; Yin, N.; Ma, L.; Lu, J.; Liu, X.; Li, J.; Lu, J.; Lei, B.; Wang, R.; et al. Silencing of BnTT1 family genes affects seed flavonoid biosynthesis and alters seed fatty acid composition in Brassica napus. Plant Sci. 2017, 254, 32–47. [Google Scholar] [CrossRef]
  38. Li, H.; Yu, K.; Zhang, Z.; Yu, Y.; Wan, J.; He, H.; Fan, C. Targeted mutagenesis of flavonoid biosynthesis pathway genes reveals functional divergence in seed coat colour, oil content and fatty acid composition in Brassica napus L. Plant Biotech. J. 2023, in press. [Google Scholar] [CrossRef]
  39. Zhai, Y.; Yu, K.; Cai, S.; Hu, L.; Amoo, O.; Xu, L.; Yang, Y.; Ma, B.; Jiao, Y.; Zhang, C.; et al. Targeted mutagenesis of BnTT8 homologs controls yellow seed coat development for effective oil production in Brassica napus L. Plant Biotech. J. 2020, 18, 1153–1168. [Google Scholar] [CrossRef]
  40. Chai, Y.R.; Lei, B.; Huang, H.L.; Li, J.N.; Yin, J.M.; Tang, Z.L.; Wang, R.; Chen, L. TRANSPARENT TESTA12 genes from Brassica napus and parental species: Cloning, evolution, and differential involvement in yellow seed Trait. Mol. Genet. Genom. 2009, 281, 109–123. [Google Scholar] [CrossRef]
  41. Huang, Z.; Peng, G.; Liu, X.; Deora, A.; Falk, K.C.; Gossen, B.D.; McDonald, M.R.; Yu, F. Fine mapping of a clubroot resistance gene in Chinese cabbage using SNP markers identified from bulked segregant RNA sequencing. Front. Plant Sci. 2017, 8, 1448. [Google Scholar] [CrossRef] [PubMed]
  42. Song, J.; Li, Z.; Liu, Z.; Guo, Y.; Qiu, L.J. Next-generation sequencing from bulked-segregant analysis accelerates the simultaneous identification of two qualitative genes in soybean. Front. Plant Sci. 2017, 8, 919. [Google Scholar] [CrossRef] [PubMed]
  43. Wang, Y.; Xie, J.; Zhang, H.; Guo, B.; Ning, S.; Chen, Y.; Lu, P.; Wu, Q.; Li, M.; Zhang, D.; et al. Mapping stripe rust resistance gene YrZH22 in Chinese wheat cultivar Zhoumai 22 by bulked segregant RNA-Seq (BSR-Seq) and comparative genomics analyses. Theor. Appl. Genet. 2017, 130, 2191–2201. [Google Scholar] [CrossRef] [PubMed]
  44. Quarrie, S.A.; Lazic-Jancic, V.; Kovacevic, D.; Steed, A.; Pekic, S. Bulk segregant analysis with molecular markers and its use for improving drought resistance in maize. J. Exp. Bot. 1999, 50, 1299–1306. [Google Scholar] [CrossRef]
  45. Huang, J.; Gu, M.; Lai, Z.; Fan, B.; Shi, K.; Zhou, Y.H.; Yu, J.Q.; Chen, Z. Functional analysis of the Arabidopsis PAL gene family in plant growth, development, and response to environmental stress. Plant Physiol. 2010, 153, 1526–1538. [Google Scholar] [CrossRef]
  46. Pirie, A.; Mullins, M.G. Changes in anthocyanin and phenolics content of grapevine leaf and fruit tissues treated with sucrose, nitrate, and abscisic acid. Plant Physiol. 1976, 58, 468–472. [Google Scholar] [CrossRef]
  47. Stavenga, D.G.; Leertouwer, H.L.; Dudek, B.; Van Der Kooi, C.J. Coloration of flowers by flavonoids and consequences of pH dependent absorption. Front. Plant Sci. 2021, 11, 600124. [Google Scholar] [CrossRef]
  48. Mansfeld, B.N.; Grumet, R. QTLseqr: An R package for bulk segregant analysis with next-generation sequencing. Plant Genom. 2018, 11, 180006. [Google Scholar] [CrossRef]
  49. Magwene, P.M.; Willis, J.H.; Kelly, J.K. The statistics of bulk segregant analysis using next generation sequencing. PLoS Comput. Biol. 2011, 7, e1002255. [Google Scholar] [CrossRef]
Figure 1. Seed color changes during seed development. Seed color changes during seed development in yellow-seeded “Wuqi” mustard (A, scale bar = 1 cm) and brown-seeded “Wugong” mustard (B, scale bar = 1 cm).
Ijms 25 01573 g001
Figure 2. Transcriptome analysis of the BB and BY bulks. (A) Principal component analysis (PCA) of transcriptomic data. Different colored dots represent the BB bulks (black) and BY bulks (yellow). (B) The volcano plot compares gene expression between these two bulks. Negative log10 p-values from the differential expression test were plotted against the log2 fold change (BB/BY) for each gene. Each dot represents a gene. (C) Enriched GO terms of DEGs exhibiting higher expression in BB compared to BY. (D) Enriched GO terms of DEGs exhibiting lower expression in BB compared to BY.
Ijms 25 01573 g002
Figure 3. Distribution of SNPs/INDELs on 18 chromosomes. The marker density is indicated by different bar colors, and each bar represents 1 Mb window size.
Ijms 25 01573 g003
Figure 4. Quantitative trait loci (QTL) for yellow seed color identified using QTLseqr. Plots produced by the plotQTLStats function with a 1 Mb sliding window. The tricube-smoothed G’ value for SNP (A), and the tricube-smoothed G’ value for INDEL (B). The genome-wide false discovery rate threshold of 0.05 is indicated by the red line.
Ijms 25 01573 g004
Figure 5. Functional analysis of the candidate genes. (A) GO enrichment of DEGs in the region of qSCA09-3 and qSCA09-7 on chromosome A09. (B) PPI network for the hub genes involved in seed coloration of B. juncea.
Ijms 25 01573 g005
Table 1. Analysis of seed color-related indexes during the development stages of seeds.
Flavonoids (OD Unit 325 nm/g DW)Anthocyanins (OD Unit 530 nm/g DW)Melanin (OD Unit 290 nm/g DW)Total Phenolics (mg/g DW)
Wugong Wuqi DifferenceWugong Wuqi DifferenceWugongWuqiDifferenceWugongWuqi Difference
9 DAP121.47 127.85 −6.38238.20 69.17 169.03 **26.68 17.60 9.07 **230.20 120.60 109.60 **
16 DAP109.51 126.12 −16.61726.75 75.33 651.42 **59.89 48.22 11.66 **319.30180.90 138.40 **
23 DAP523.20 337.39 185.81 **2217.00 182.802034.20 **109.66 87.50 22.15 **793.30 255.60 537.70 **
30 DAP887.38 770.32 117.07 **2337.33 247.832089.50 **224.68 136.51 88.16 **1070.40 544.00 526.40 **
38 DAP1926.05 1400.00 526.05 **1256.34 305.43 950.91 **397.66 195.95 201.71 **1157.40 655.50 501.90 **
45 DAP2035.07 1778.57 256.50 **1195.00 300.08894.92 **698.76 203.55 495.21 **1229.70 868.00 601.70 **
** indicates significance at the level of 1% determined with t-test.
Table 2. Location of the candidate DEGs in the QTLs.
QTLChromStart EndFPKM in BBFPKM in BYGene IDAt_ID
qSCA09-3A098,929,4038,931,985914.09 33.40 BjuOA09G16530AT1G62750
qSCA09-3A099,495,1919,500,36414.39 1.43 BjuOA09G17120AT1G62120
qSCA09-3A0911,771,00311,772,142 182.41 19.20 BjuOA09G20180AT2G03750
qSCA09-3A0911,913,89411,916,103224.83 36.06 BjuOA09G20410AT5G42370
qSCA09-3A0913,787,17313,788,14854.53 125.96 BjuOA09G22750AT1G26470
qSCA09-3A0914,094,58314,098,36951.18 7.05 BjuOA09G23160AT5G46690
qSCA09-3A0914,113,82914,115,475307.67 145.43 BjuOA09G23180AT5G46700
qSCA09-3A0914,279,96914,280,275283.29 103.14 BjuOA09G23340AT5G46871
qSCA09-3A0914,415,61514,416,77298.94 288.38 BjuOA09G23480AT5G47060
qSCA09-3A0914,667,64714,669,80767.84 165.38 BjuOA09G23850AT5G47650
qSCA09-3A0915,097,22815,100,12313.20 0.00 BjuOA09G24380AT1G62200
qSCA09-3A0916,516,24716,518,63928.12 1.67 BjuOA09G26270AT4G04710
qSCA09-3A0916,848,64016,849,09352.31 110.67 BjuOA09G26840AT1G64590
qSCA09-3A0916,951,51616,952,50444.29 108.10 BjuOA09G27000AT4G12580
qSCA09-3A0912,155,59512,157,2885727.33 3.97 BjuOA09G20700AT5G42800
qSCA09-3A0912,694,43912,698,03544.80 1.13 BjuOA09G21470AT1G51540
qSCA09-3A0913,580,38613,583,34536.50 87.50 BjuOA09G22510AT1G52360
qSCA09-7A0938,731,20038,733,688158.05 0.26 BjuOA09G35390At1G32150
qSCA09-7A0938,797,90338,800,21042.41 10.28 BjuOA09G35460AT1G32080
qSCA09-7A0938,972,65538,973,25240.24 90.11 BjuOA09G35740AT2G37420
qSCA09-7A0939,070,81639,072,8131244.90 551.60 BjuOA09G35800AT1G31830
qSCA09-7A0939,216,20839,218,45254.76 117.49 BjuOA09G35960AT1G31660
qSCA09-7A0940,466,89140,467,85614.78 51.11 BjuOA09G37390AT5G26770
qSCA09-7A0940,486,13640,487,62758.47 139.95 BjuOA09G37430AT1G73490
qSCA09-7A0940,724,95340,725,51133.64 82.22 BjuOA09G37660AT1G33390
qSCA09-7A0942,041,44142,044,53960.86 0.00 BjuOA09G39430AT1G28020
qSCA09-7A0942,288,65242,290,85718.15 0.00 BjuOA09G39810AT1G27500
qSCA09-7A0942,429,48042,430,62110.62 50.20 BjuOA09G40150AT1G63660
qSCA09-7A0942,537,81442,540,00927.12 93.94 BjuOA09G40310AT5G18880
qSCA09-7A0942,765,02842,767,784249.60 74.33 BjuOA09G40600AT1G25390
qSCA09-7A0942,796,08542,797,33852.17 2.46 BjuOA09G40630AT3G20620
qSCA09-7A0942,873,46742,875,00029.26 1.41 BjuOA09G40750AT1G14800
qSCA09-7A0942,894,66242,895,07818.93 0.85 BjuOA09G40790AT1G21380
qSCA09-7A0942,895,12642,896,19812.29 0.28 BjuOA09G40800AT1G14800
qSCA09-7A0942,915,56842,917,54078.09 32.19 BjuOA09G40860AT1G25520
qSCA09-7A0943,276,36443,278,60434.41 3.97 BjuOA09G41440AT1G26680
qSCA09-7A0943,368,60643,369,23526.12 1.14 BjuOA09G41640AT5G13930
qSCA09-7A0943,401,37643,402,16069.82 12.92 BjuOA09G41660AT1G26920
qSCA09-7A0944,111,93244,114,261184.46 646.93 BjuOA09G42790AT1G23200
qSCA09-7A0944,403,01844,404,80016.43 0.86 BjuOA09G43350AT1G22620
qSCA09-7A0944,436,05144,436,73229.02 69.92 BjuOA09G43370AT1G22590
qSCA09-7A0944,589,63144,591,50381.63 18.31 BjuOA09G43580AT1G22280
qSCA09-7A0945,670,07145,671,8072727.30 475.40 BjuOA09G45170AT3G51240
qSCA09-7A0945,707,27445,708,740520.50 1235.15 BjuOA09G45260AT3G51300
qSCA09-7A0946,016,67446,017,16220.52 1.07 BjuOA09G45830AT1G79990
qSCA09-7A0946,019,20746,019,883200.76 46.18 BjuOA09G45840AT5G38980
qSCA09-7A0946,109,84946,111,12438.86 7.12 BjuOA09G45990AT3G51930
qSCA09-7A0946,507,64946,510,72824.76 65.24 BjuOA09G46830AT1G72880
qSCA09-7A0946,669,63646,671,87790.67 193.86 BjuOA09G47060AT2G23790
qSCA09-7A0946,798,48146,801,4602511.67 870.15 BjuOA09G47290AT3G53260
qSCA09-7A0947,714,12347,726,74737.96 0.28 BjuOA09G49050AT3G55120
Table 3. Comparison of SNPs in BY and BB and SNPs in “AU213” and “T84-66” (V2).
SNP between BB and BB BulksSNP between “AU213” and “T84-66” (V2)
CHROMPositionRefAltAnnotationAU213
Position
Base in AU213Base in T84-66Gene ID
A0946,798,684TC3_prime_UTR_variant46,798,684TCBjuOA09G47290
A0946,799,098GAsynonymous_variant46,799,098GABjuOA09G47290
A0946,799,171TCmissense_variant46,799,171TCBjuOA09G47290
A0946,799,228GCmissense_variant46,799,228GCBjuOA09G47290
A0946,799,260GAsynonymous_variant46,799,260GABjuOA09G47290
A0946,799,300TCmissense_variant46,799,300TCBjuOA09G47290
A0946,799,477ATmissense_variant46,799,477ATBjuOA09G47290
A0946,799,528ACmissense_variant---BjuOA09G47290
A0946,799,543AGmissense_variant---BjuOA09G47290
A0946,799,606AGmissense_variant46,799,606AGBjuOA09G47290
A0946,799,690GCmissense_variant46,799,690GCBjuOA09G47290
A0946,799,861TCmissense_variant46,799,861TCBjuOA09G47290
A0946,799,897CTmissense_variant46,799,897CTBjuOA09G47290
A0946,799,987CAmissense_variant46,799,987CABjuOA09G47290
A0946,800,041GTmissense_variant---BjuOA09G47290
A0946,800,056CTstop_gained---BjuOA09G47290
A0946,800,095GCmissense_variant46,800,095GCBjuOA09G47290
A0946,800,143CTmissense_variant46,800,143CTBjuOA09G47290
A0946,800,194TCmissense_variant---BjuOA09G47290
A0946,800,197CTmissense_variant---BjuOA09G47290
A0946,800,242TCmissense_variant46,800,242TCBjuOA09G47290
A09----46,800,326TCBjuOA09G47290
A0946,800,374AGmissense_variant46,800,374AGBjuOA09G47290
A0946,800,401GAmissense_variant46,800,401GABjuOA09G47290
A09----46,800,511AGBjuOA09G47290
A09----46,800,762CGBjuOA09G47290
A0946,801,226AGsynonymous_variant46,801,226AGBjuOA09G47290
A0946,801,270CTmissense_variant---BjuOA09G47290
A0946,801,286GA5_prime_UTR_variant---BjuOA09G47290
A0946,801,307GA5_prime_UTR_variant---BjuOA09G47290
A0946,801,337AT5_prime_UTR_variant---BjuOA09G47290
A0946,801,386GA5_prime_UTR_variant46,801,386GABjuOA09G47290
A0946,801,436AG5_prime_UTR_variant46,801,436AGBjuOA09G47290
A0945,670,196CGsynonymous_var---BjuOA09G45170
A09----45,670,220AGBjuOA09G45170
A0945,670,292TCsynonymous_var---BjuOA09G45170
A0945,670,968AGsynonymous_varian---BjuOA09G45170
A0945,671,218TGmissense_variant---BjuOA09G45170
A0945,671,381GTsynonymous---BjuOA09G45170
A0945,671,597GCsynonymous_var---BjuOA09G45170
Disclaimer/Publisher’s Note: The statements, opinions and data contained in all publications are solely those of the individual author(s) and contributor(s) and not of MDPI and/or the editor(s). MDPI and/or the editor(s) disclaim responsibility for any injury to people or property resulting from any ideas, methods, instructions or products referred to in the content.

