Article

Methoxyquinolone–Benzothiazole Hybrids as New Aggregation-Induced Emission Luminogens and Efficient Fluorescent Chemosensors for Cyanide Ions

1
Grupo de Investigación en Compuestos Heterocíclicos, Universidad del Atlántico, Puerto Colombia 081007, Colombia
2
Grupo de Investigación en Química de Productos Naturales, Departamento de Química, Facultad de Ciencias Naturales, Exactas y de la Educación, Universidad del Cauca, Calle 5 # 4–70, Popayán 190003, Colombia
3
Cristalografía y Química de Materiales, CrisQuimMat, Facultad de Ciencias, Departamento de Química, Universidad de los Andes, Cra. 1 #18a-12, Bogotá 111711, Colombia
4
Grupo de Investigación de Compuestos Heterocíclicos, Departamento de Química, Universidad del Valle, Calle 13 # 100–00, Cali 760032, Colombia
5
Grupo de Investigación en Química y Biotecnología, Facultad de Ciencias Básicas, Universidad Santiago de Cali, Calle 5 # 62-00, Cali 760035, Colombia
6
Departamento de Química y Biología, División de Ciencias Básicas, Universidad del Norte, Km 5 vía Puerto Colombia, Barranquilla 081007, Colombia
*
Author to whom correspondence should be addressed.
Int. J. Mol. Sci. 2024, 25(23), 12896; https://doi.org/10.3390/ijms252312896
Submission received: 1 November 2024 / Revised: 26 November 2024 / Accepted: 28 November 2024 / Published: 30 November 2024

Abstract

This work describes the synthesis and characterization of new quinolone–benzothiazole hybrids, the study of their aggregation-induced emission (AIE) properties, and the use of these systems as efficient fluorescent probes for cyanide ions. These conjugated derivatives are linked through a double bond favoring electronic communication, and together with their planar geometry, can strongly aggregate under solvophobic environments, leading to aggregation and exhibiting significant AIE behavior. The double bond between electroactive units is prone to nucleophilic addition reactions by cyanide ions, selectively, conducive to turning off the fluorescence properties, making this hybrid system an efficient probe for cyanide ions. These studies were theoretically explained using DFT and TD-DFT calculations.

1. Introduction

Quinolone derivatives belong to a special class of heterocyclic compounds exhibiting remarkable pharmacological activities, especially as anticancer, antibacterial, antifungal, antioxidant, and anti-inflammatory agents [1,2,3,4,5,6]. The synthetic versatility of quinolones from a chemical point of view has led to access to a broad variety of derivatives based on this scaffold with several applications in different fields. Among those, quinolone derivatives have shown interesting fluorescent properties that have been used for bio-imaging, molecular probing, and chemosensory purposes with promising results [7,8,9,10].
Another interesting class of heterocyclic compounds, benzothiazole derivatives, have recently attracted considerable attention in the scientific community due to their application as promising pharmacophore platforms, exhibiting striking activities as potent anticancer, antibiotic, antimicrobial, and antituberculosis agents [11,12,13]. Benzothiazole derivatives have also been used as sensors, leading to the detection of certain biological species or ions [14,15,16,17,18]. Photophysical mechanisms like excited-state intramolecular photon transfer (ESIPT), photoinduced electron transfer (PET), intramolecular charge transfer (ICT), and aggregation-induced emission (AIE), along with benzothiazole-based fluorescent probes, can selectively interact with a broad range of analytes leading to a change in their emission properties that enables the efficient detection of the analyte. Moreover, benzothiazole moiety has also been used for the design of fluorescent probes for bioimaging applications [19,20].
Among all the previously mentioned photophysical mechanisms, AIE has attracted a huge interest as this property emerges from aggregated materials [21,22,23]. The AIE mechanism was first described by Tang et al. and is related to a process called restricted intramolecular motions (RIM), which can be favored by self-aggregation, solid state, solvophobic interactions, and excimer formations [23,24]. AIE has found applications in bioimaging and theragnostics due to the notable photostability of such aggregates exhibiting high fluorescent quantum yields. Moreover, AIE phenomena have also been used for sensing, nanomedicine, and organic solar cells [25,26,27,28,29,30,31].
Now, sensing certain anions from fluorescent probes is highly desirable for a broad range of applications [32,33,34]. It is well known that anions play key roles in chemical and biological processes and have been well-studied in several areas such as life sciences, chemistry, medicine, catalysis, and environmental sciences [1,35,36,37]. Some of them come mainly from industrial sources, and sometimes interrupt the proper balance in nature and thus generate undesired consequences for ecosystems. In this sense, the recognition of specific anions, mainly those considered dangerous, has become an essential issue among researchers. In particular, the recognition of cyanide (CN), is quite important since an undesired discharge of this anion in nature can result not only in significant environmental risk, but also it is considered very harmful to humans even at a dosage of only 0.5 mg per kilogram of body weight [38,39]. Thus, being able to detect cyanide anions through efficient sensors is highly desirable. In this regard, florescent chemosensors are becoming more attractive due to their remarkable selectivity, versatility, low cost, less complex sample preparation, and quick reaction times, which enable real-time detection. All these features make them good candidates as an alternative to other analytical techniques used for detecting cyanide ions, such as electrochemistry, polarography, and gas chromatography [40,41,42,43].
In this work, we describe the design and synthesis of quinolone–benzothiazole hybrids as notable AIE luminogens, and we study their use as efficient cyanide ion chemosensors. Both electroactive units are linked through a double bond favoring electronic communication. The planar geometry of these molecules together in solvophobic environments leads to their strong aggregation, exhibiting significant AIE behavior. The double bond between electroactive units is prone to nucleophilic addition reactions, which hinders the intramolecular charge transfer (ICT) processes and, thus, the turning off of fluorescence properties, leading to an efficient probe for cyanide ions.

2. Results

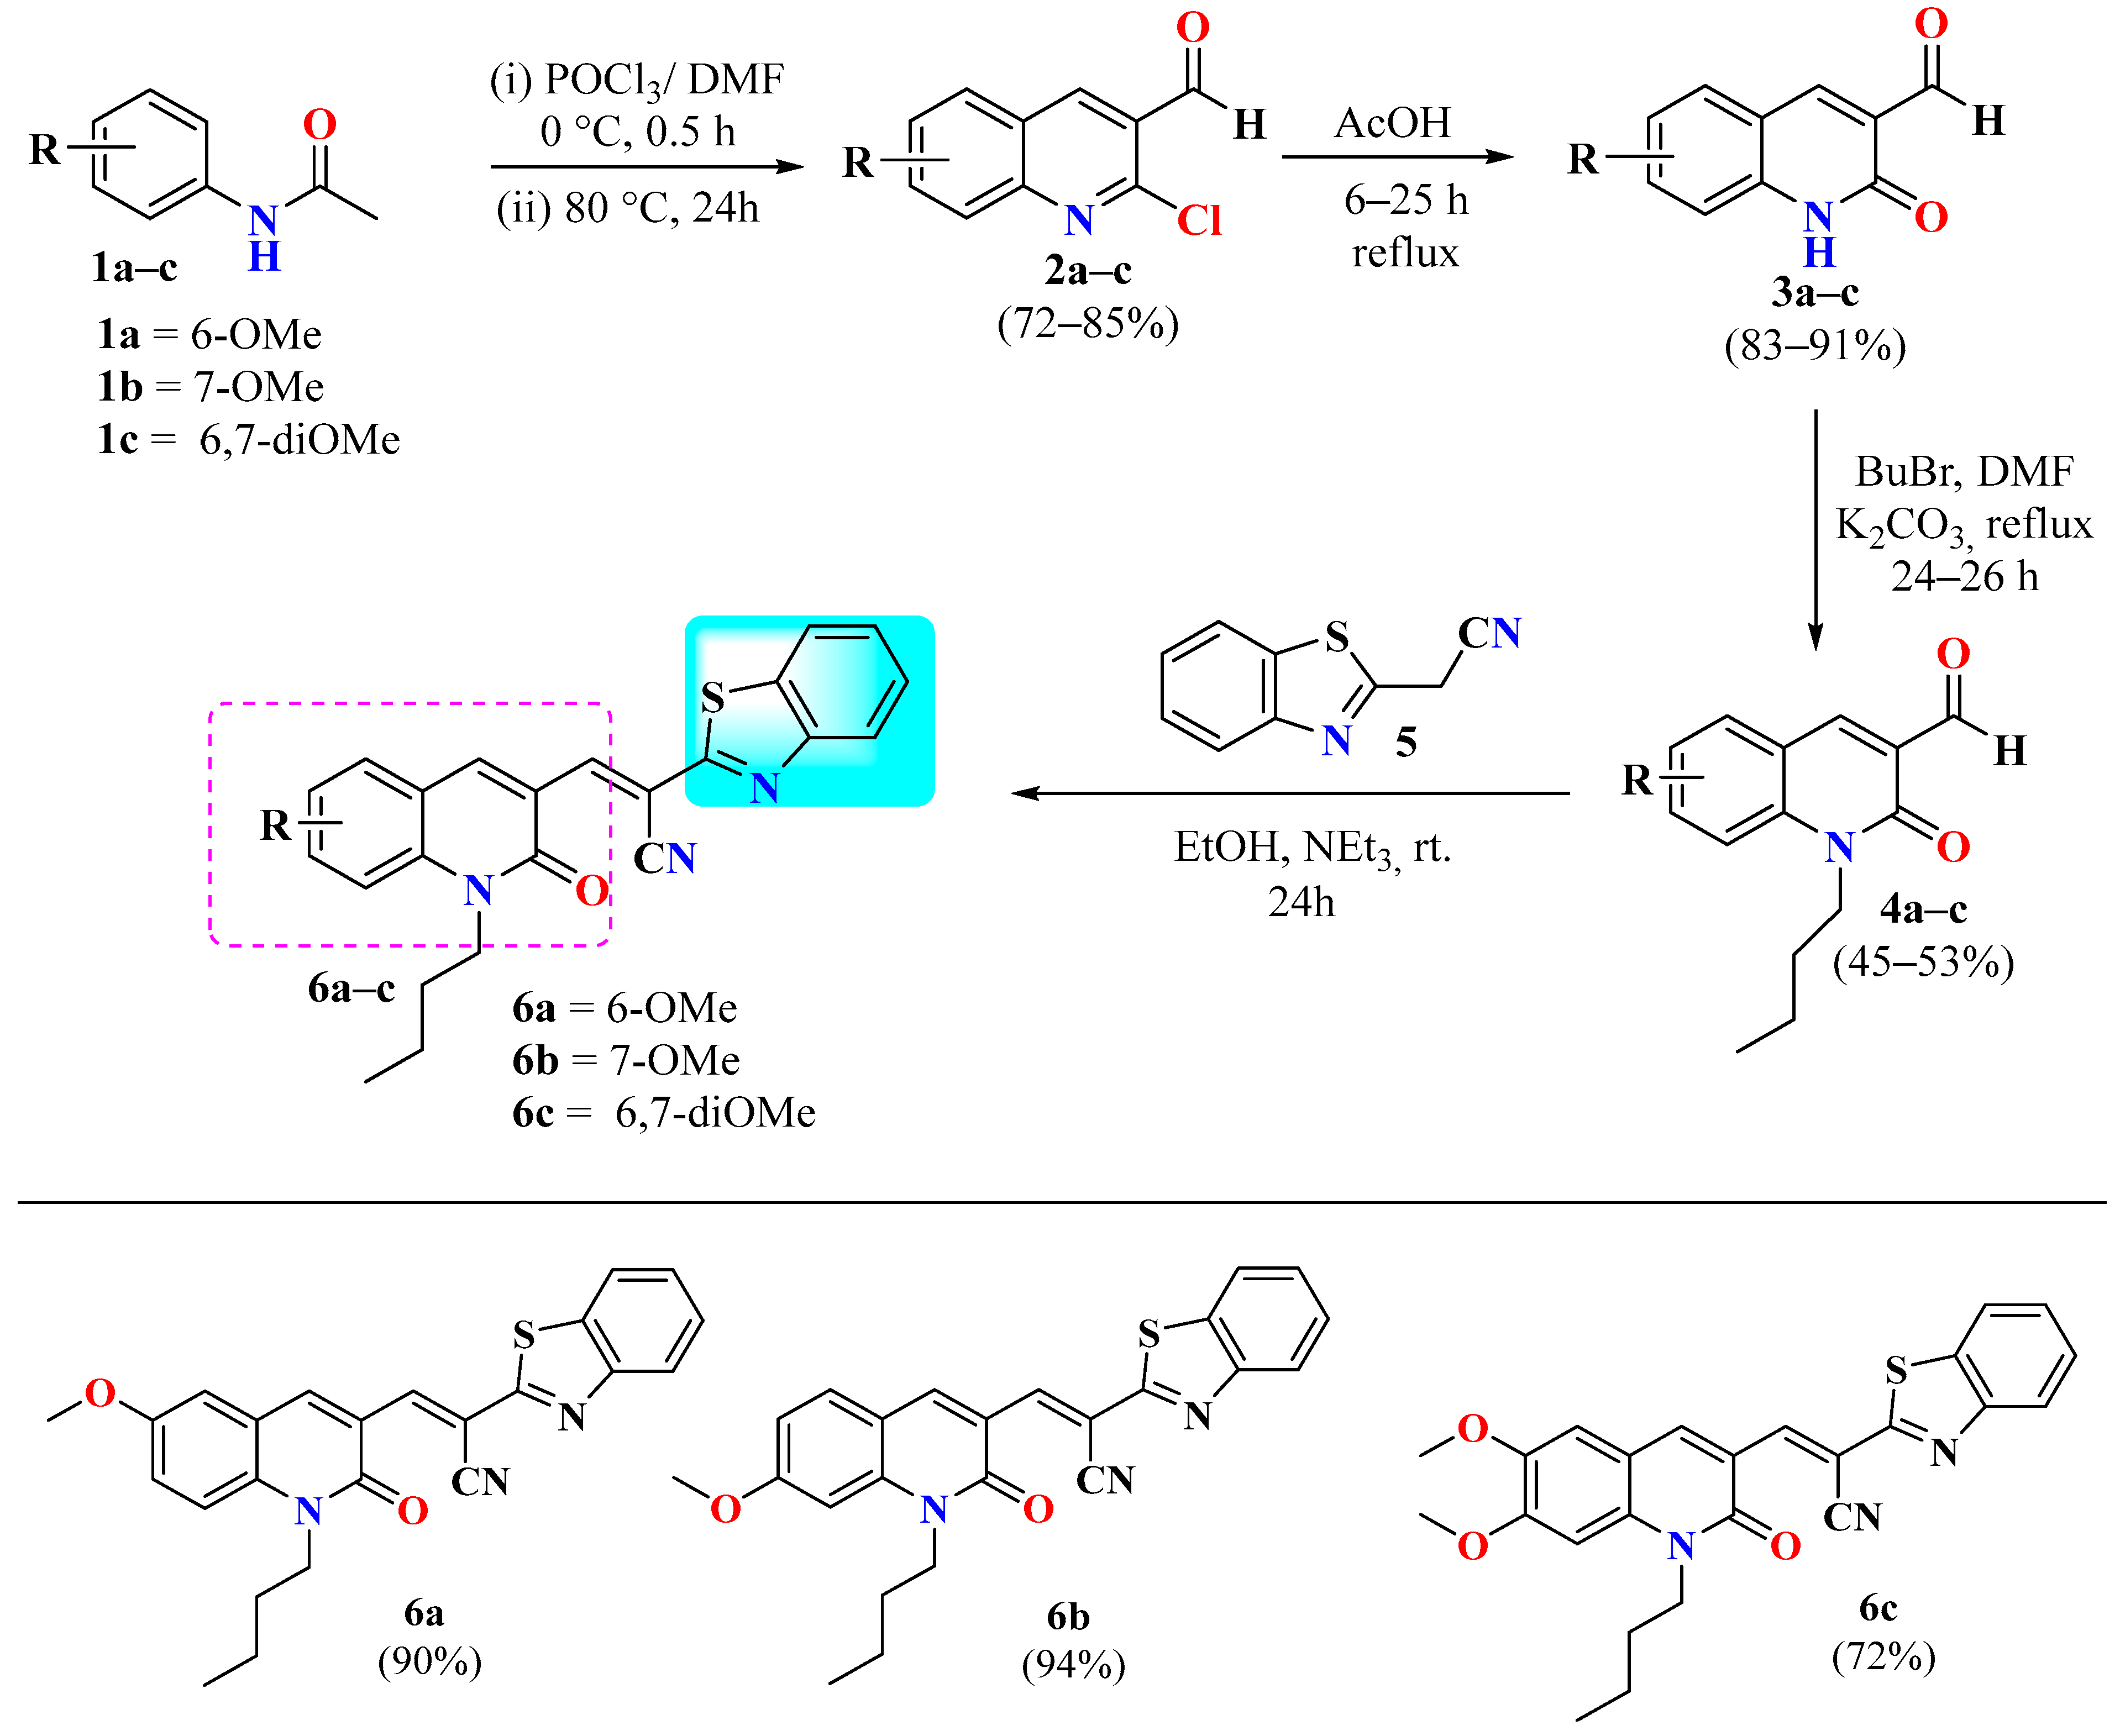
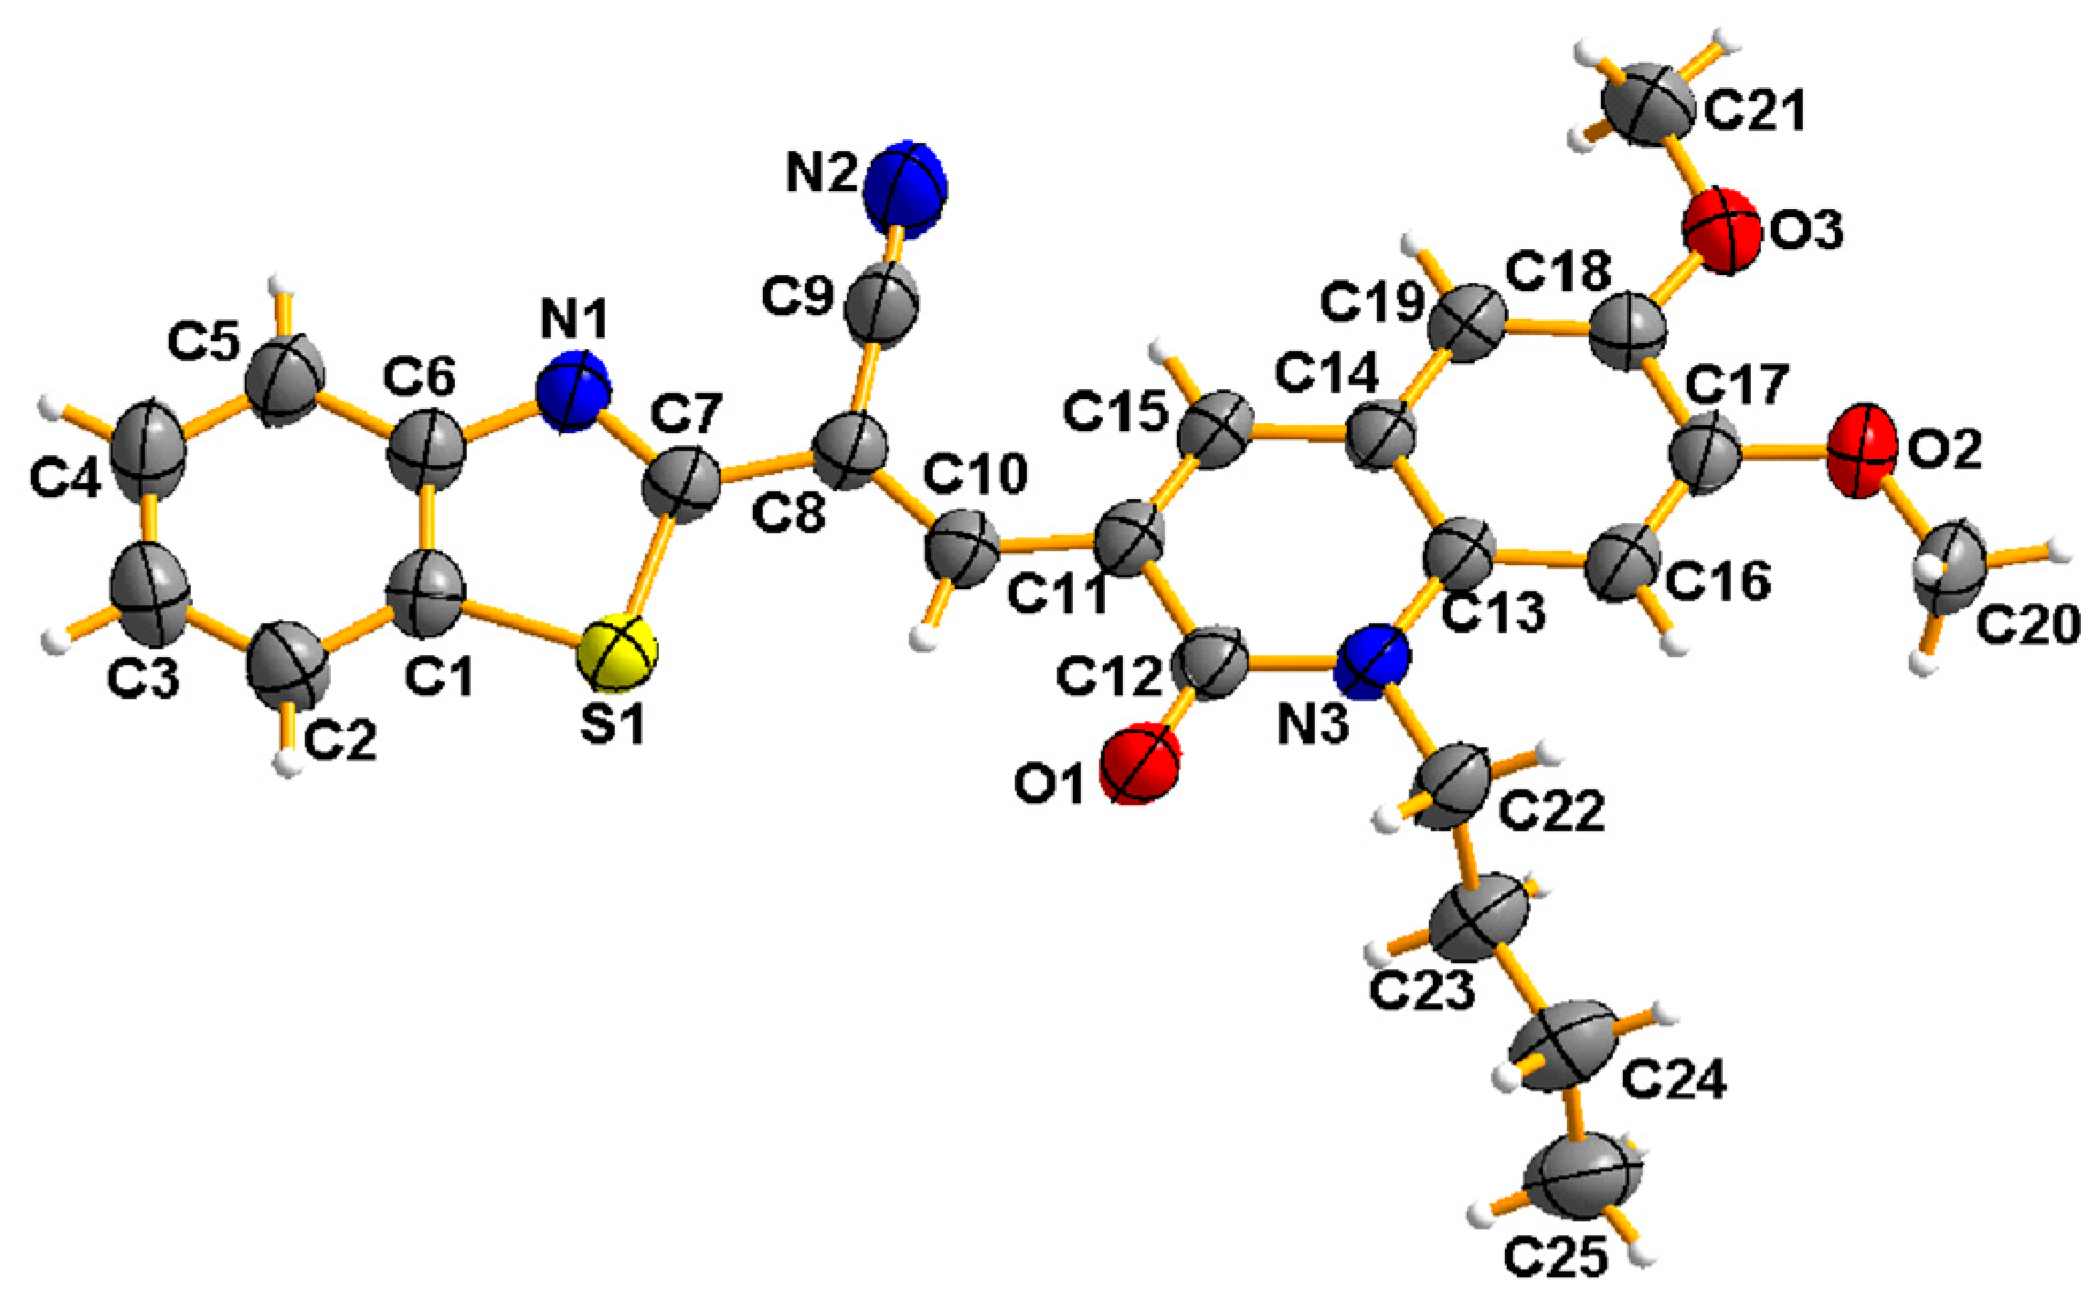
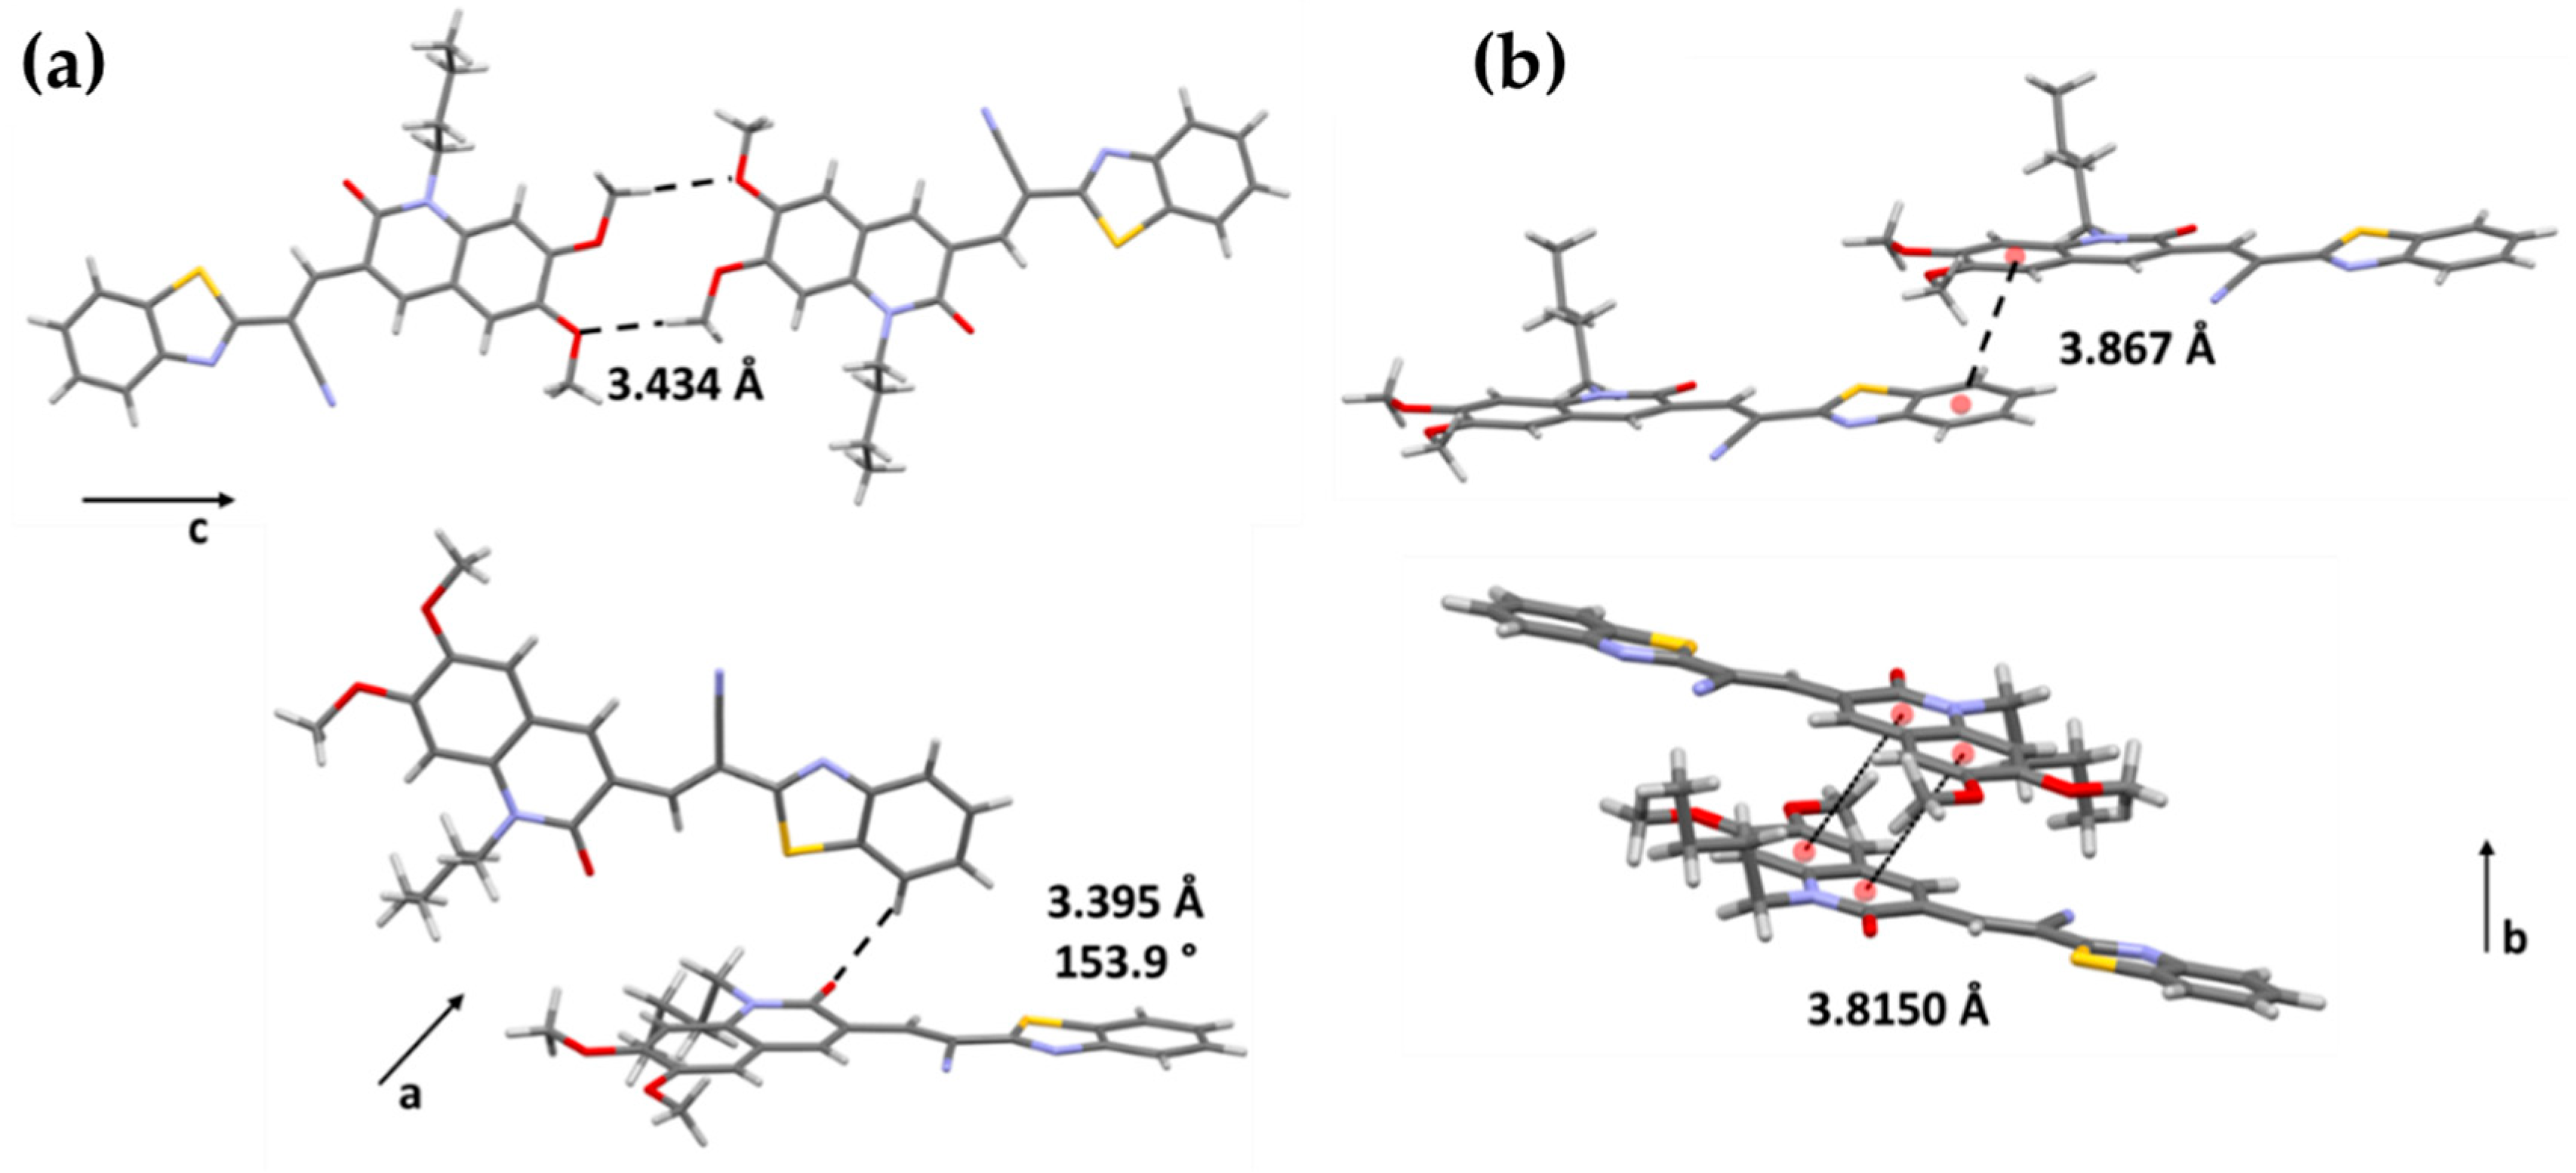
2.1. Molecular Design, Synthesis, and Structural Characterization

The synthesized fluorescent hybrids are based on quinolones and benzothiazole moieties linked through a vinyl group (Scheme 1). A CN group attached to the vinyl fragment as part of a conjugated electron donor–acceptor system (6a–c) makes the system more prone to nucleophilic addition reactions of CN ions to the hybrid system, creating an efficient sensor towards CN ions. The β-carbon of the vinyl group is electron deficient, making this carbon susceptible to the cyanide attack, triggering a cut in the electronic communication of the hybrid system and, thus, generating remarkable optical and electronic changes used to detect the presence of this ion. Compounds (E)-2-(benzo[d]thiazol-2-yl)-3-(2-oxo-1,2-dihydroquinolin)acrylonitriles 6a–c are shown in Scheme 1. These compounds were synthesized through a classic Knoevenagel condensation [44,45], from stirring equimolar amounts of compounds 4a–c, benzothiazole 5 and three drops of NEt3 in 25 mL of EtOH at room temperature for 48 h. The reaction was controlled by TLC using dichloromethane as eluent, and, once it finished, it was filtered and washed with EtOH thoroughly, giving rise to the respective compounds 6a–c with yields between 60% and 71%. The structures of these new fluorescent hybrids were confirmed by 1H-NMR, 13C-NMR, mass spectrometry, and FTIR, and are shown in the experimental section.
In addition to the aforementioned spectroscopic experiments, and to conclusively establish the formation of target compounds, single crystals of compound 6c were obtained by slow evaporation in DMF at room temperature. The structural representation, crystal data, and structure refinement for compound 6c are presented in Figure 1 and the Supporting Information. Based on the results, there is unequivocal evidence that the compound obtained corresponds to product 6c.
Compound 6c was obtained as a red crystalline solid. This compound crystallizes in a monoclinic P21/c space group, with one molecule of 6c by asymmetric unit. Benzothiazole and quinolone residues present a small planarity deviation with a torsion angle between them of 8.27(9) Å. The crystal packing of this compound is mainly formed by C-H∙∙∙O and slipped π∙∙∙π stacking interactions (Figure 2). Each molecule forms a R22(12) heterosynthon between methoxy groups through C-H∙∙∙O interactions oriented along the [001] direction, with C∙∙∙O distances of 3.434(3) Å (symmetry code: −x, 1−y, 2−z). The dimeric formation is stacked along [010] direction by slipped π∙∙∙π stacking interactions with intercentroid distances of 3.8671(12) and 3.8150(11) Å (symmetry codes: x, y, 1+z and −x, 1−y, 1−z) (Table S1). Also, it is possible to observe C-H∙∙∙O interactions along the [100] direction with a C∙∙∙O distance of 3.395(3) Å (symmetry code: x, 3/2−y, −1/2+z) (Figure 2).

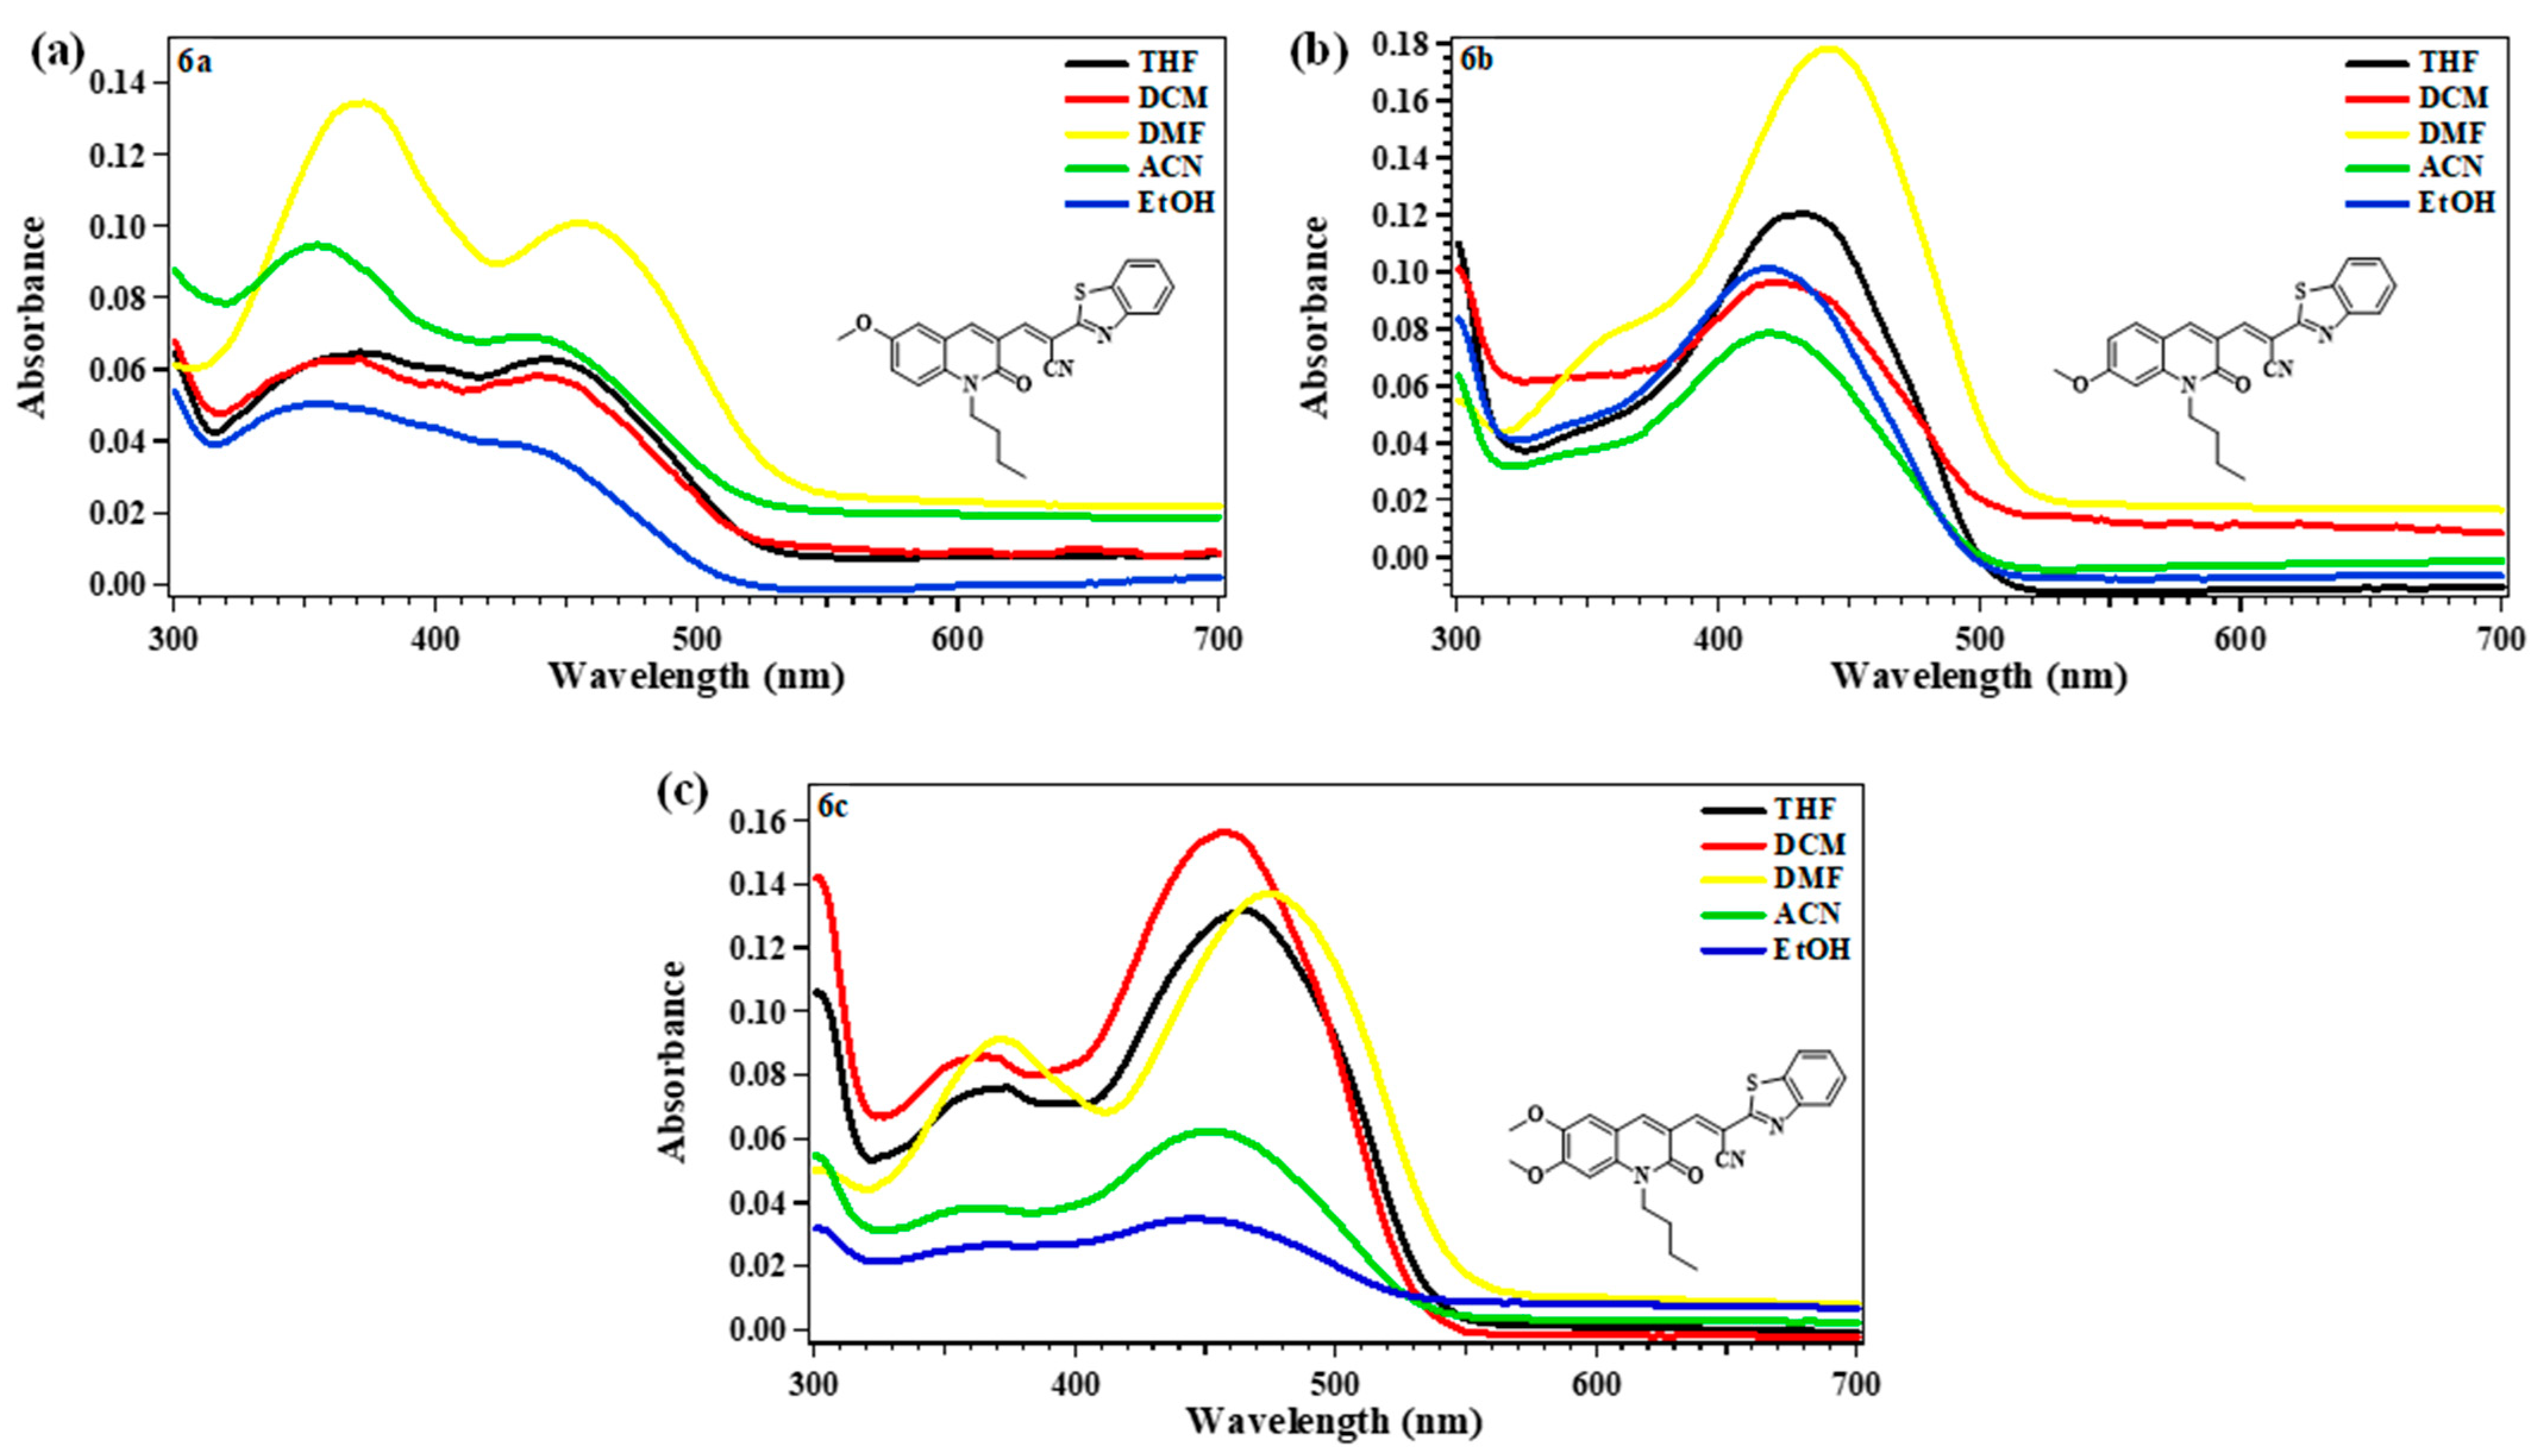
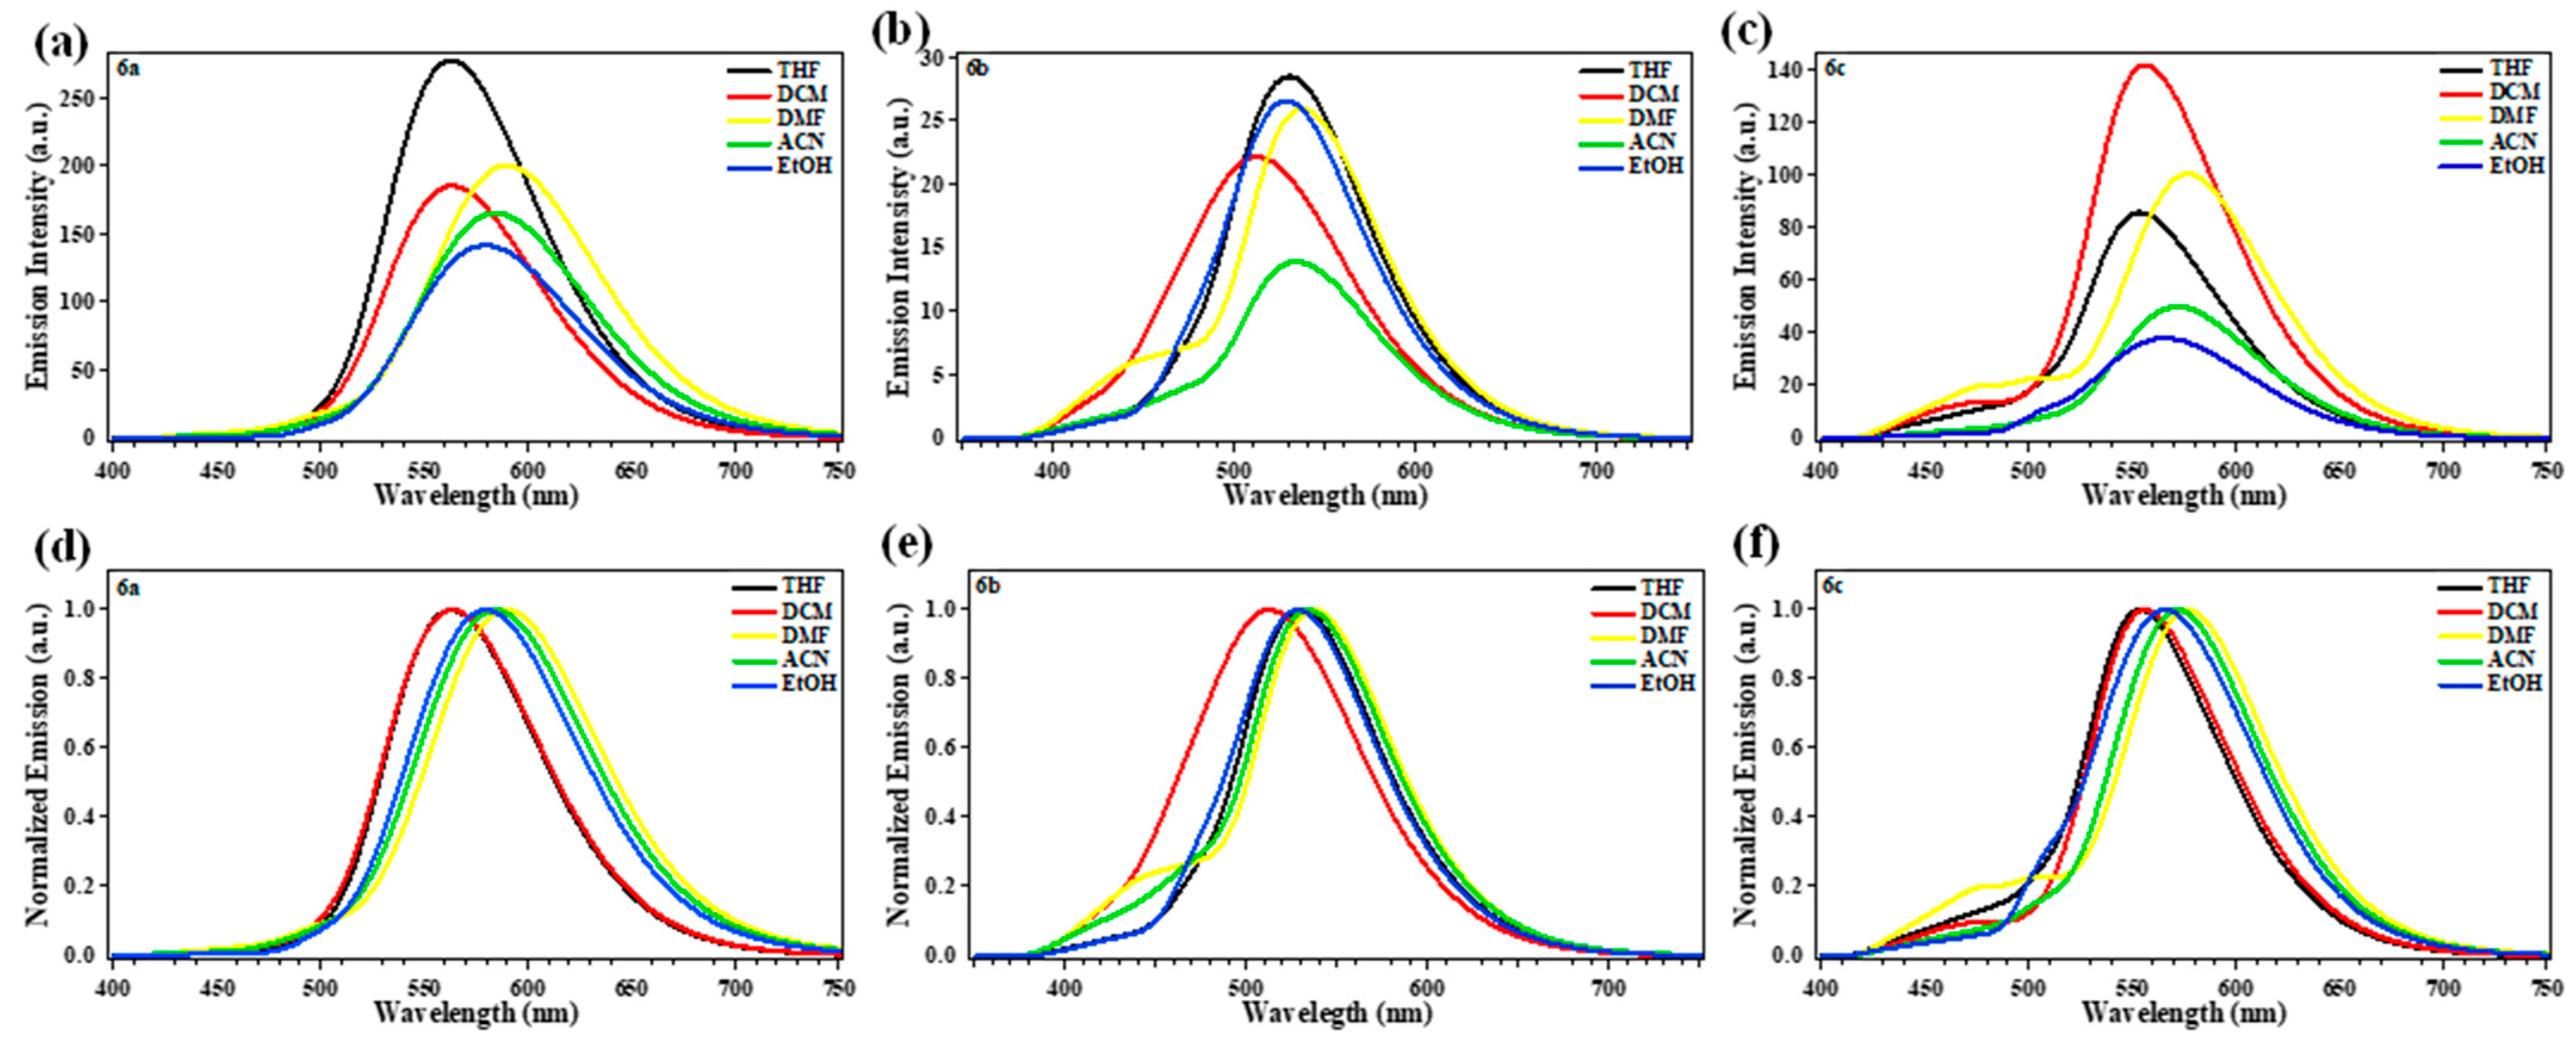
2.2. Photophysical Properties

The photophysical properties of compounds 6a–c were evaluated by recording the absorption and emission spectra in five different solvents (THF, DCM, DMF, ACN, and EtOH) at a concentration of 5μM, as summarized in Table 1. The UV-Vis absorption spectra of compounds 6a–c (Figure 3) showed two leading bands; the first band, centered around 360 nm, can be assigned to π – π* transitions, while the second band, centered in the region of 431–473 nm, can feasibly be attributed to intramolecular charge transfer (ICT) processes [46,47]. Theoretical calculations were carried out using time-dependent uwb97xd/6-311++g (d,p) level in THF to find out the nature of the electronic transitions responsible for the observed experimental absorption bands. The intense absorption band experimentally registered around 431–473 nm corresponds to the transition of the lowest-lying singlet excited state S1 predicted with a considerable oscillator strength (f = 0.7026, 1.1883, and 1.0113 for 6a, 6b, and 6c, respectively). The transition displayed by the HOMO→LUMO mono-excitation is present in all the dyes.
The fluorescence emission spectra of compounds 6a–c (Figure 4) showed maximum emission bands between 512 and 590 nm. All the compounds exhibited broad Stokes shifts (6a 4913–5971, 6b 3932–5069, and 6c 3468–4789 cm−1) in different solvents, indicating a fast relaxation from the excited state to lower energy vibrational states, which can avoid the interference caused by the excitation light and scattered light, as well as the fluorescence intensity that is diminished by self-absorption, as a result improving the response sensitivity of fluorescent molecules [48]. As the polarity solvents change from THF to EtOH, the emission peaks of 6a, 6b, and 6c showed a bathochromic behavior from 563 to 578, 529 to 528, and 553 to 565 nm, respectively. However, all the chromophores presented a hypsochromic effect in solvents such as DMF, ACN, and EtOH (Figure 4). These findings suggest that the bathochromic effect is due to the ICT state being significantly more polar than the ground state, leading to stronger interactions with polar solvents in the ICT state (Figure S2). On the other hand, the hypsochromic effect is attributed to the difference in solvation since EtOH is an HBD solvent that can stabilize the ground state through H-bonding formation with the methoxy and carbonyl groups of the chromophores [49]. Solvatochromic behavior was studied through solvent polarity plots such as Lippert–Mataga and McRae plots (Figure S1) [50,51]. Lippert–Mataga and McRae show similar trends with a moderate linear relationship for compounds 6a and 6b, while compound 6b exhibits a poor linear tendency. This behavior may be attributed to specific solvent effects, such as preferential solvation, hydrogen bonding, and charge–transfer interactions, which are influenced by one or a few neighboring molecules and governed by the diverse chemical properties of the fluorophore and solvent. Additionally, the optical band gap (E0-0) was determined by the interception of the absorption and emission bands for all the compounds, yielding values of 2.41, 2.58, and 2.40 eV for 6a, 6b, and 6c, respectively, exhibiting the same trend as the calculated energy gap in THF.

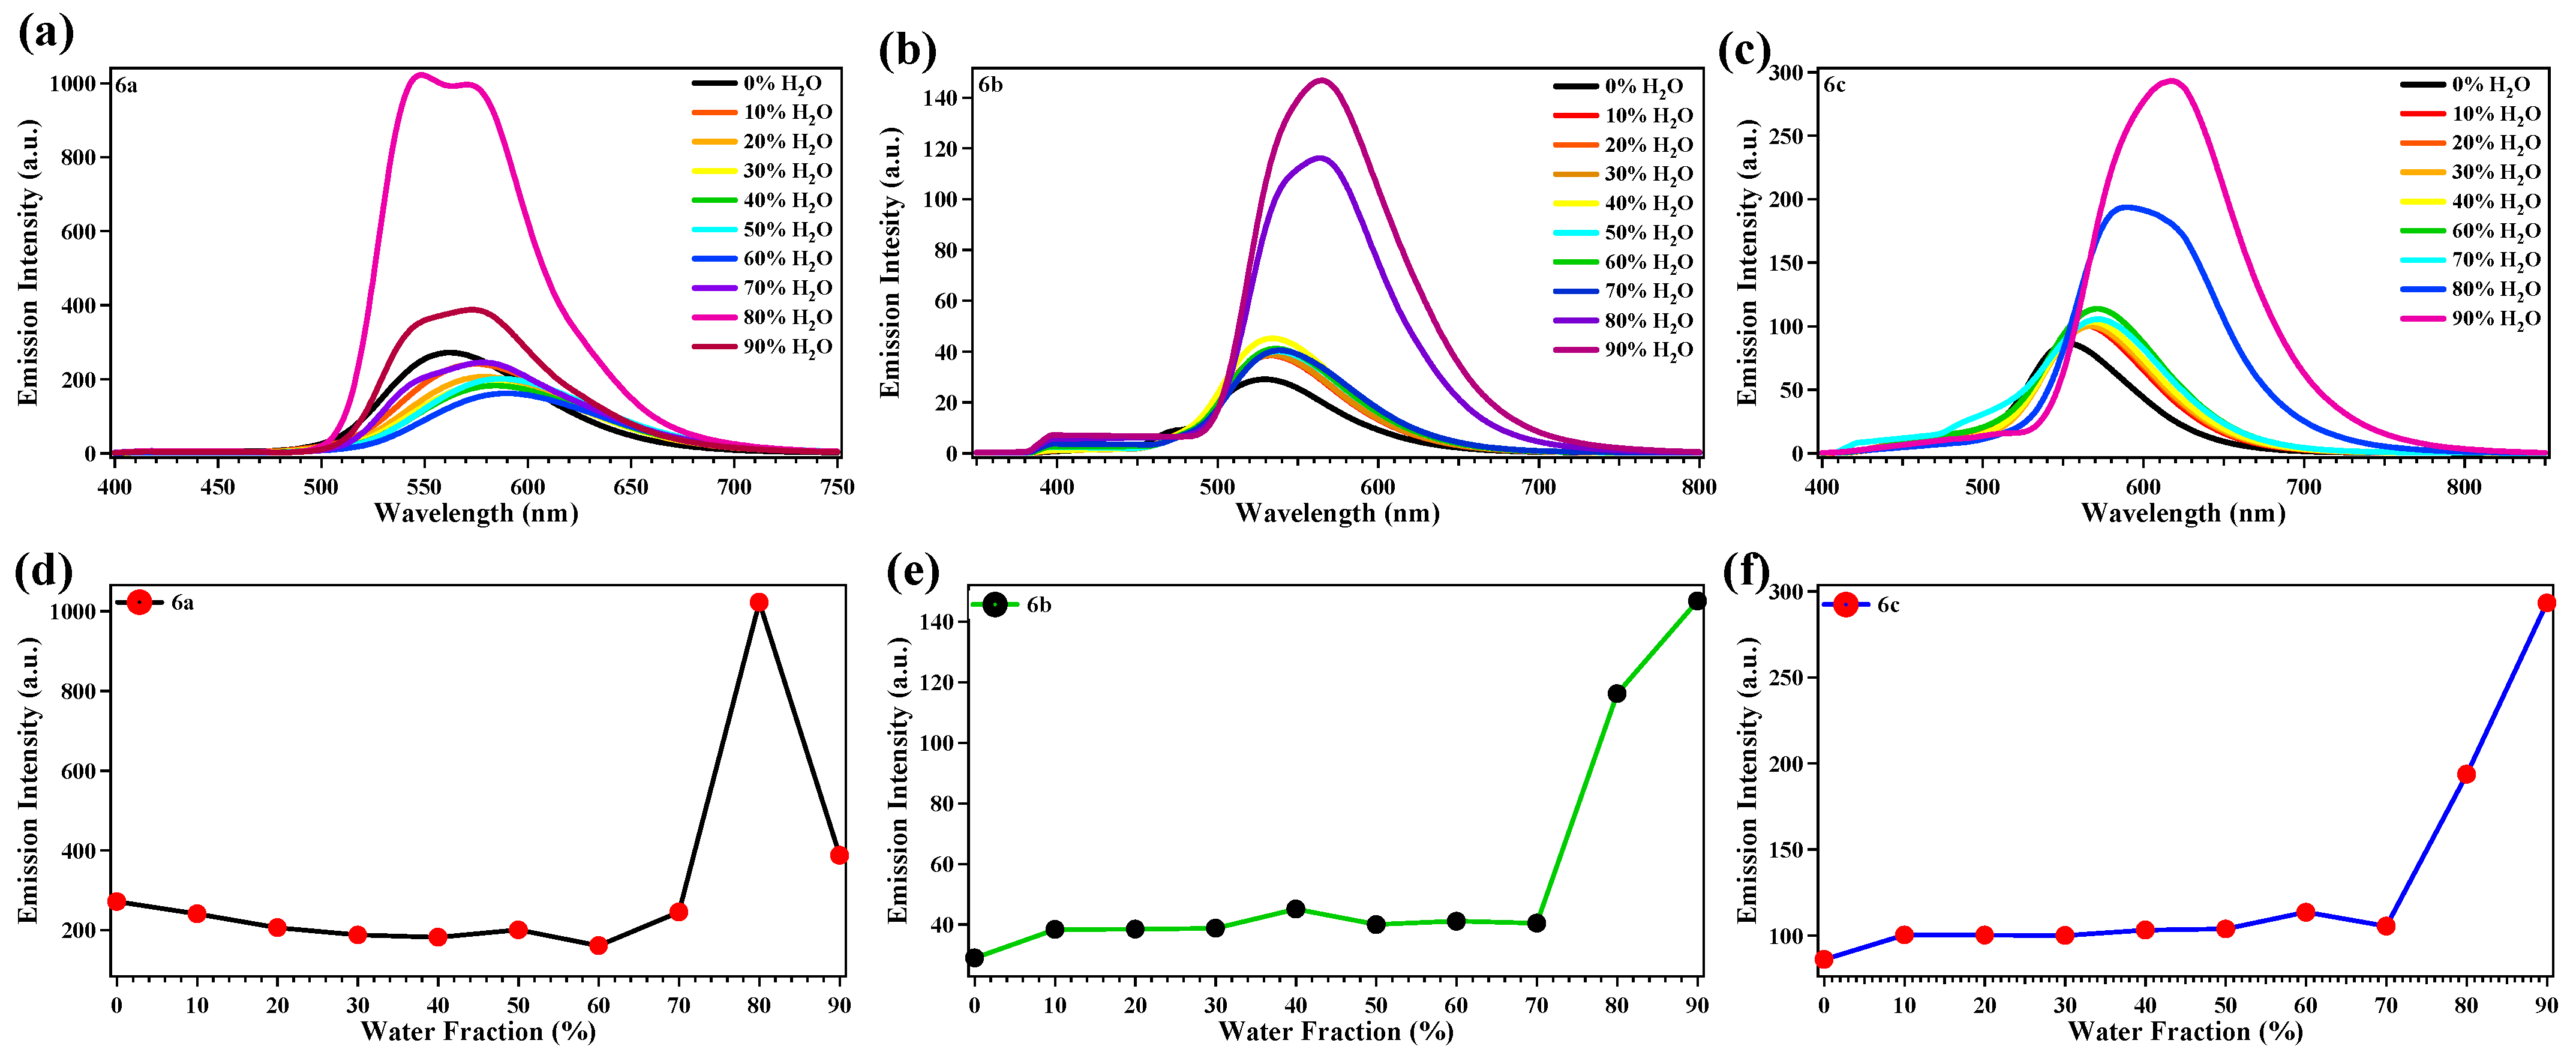
2.3. Aggregation-Induced Emission

To investigate the effects of aggregation on the luminescence behavior of the synthesized compounds, emission spectra of 6a–c were registered in different THF–water mixtures (fw = 0 to 90%) (Figure 5). Compound 6a showed a fluorescence quenching with a red shift upon increasing amounts of water (fw) until 60% was reached, attributed to the influence of the TICT effect [52,53]. Furthermore, it is acknowledged that when dyes aggregate, they can create π-π stacked structures of chromophores. Ultimately, this leads to a reduction in the band gap and a movement towards longer wavelengths in the emission peaks [54]. Upon increasing the water fraction from 70 to 80%, the compound exhibits a striking fluorescence enhancement with a blue shift. This could be attributed to the formation of aggregates due to the reduced ability of the aqueous mixture to dissolve substances. Above 90% water fraction, the fluorescence emission rapidly diminished.
On the other hand, for compounds 6b and 6c, a similar trend was observed. The fluorescence was quenched in both compounds with a bathochromic effect when the water fraction increased up to 70%. After increasing the amount of water from 70 to 90%, the compounds displayed an enhancement in emissions with a red-shift, probably because of the aggregation of dyes leading to the formation of π-π stacked structures of the fluorophores, resulting in a reduced band gap [54]. It is important to note that when large aggregates form at higher fw, the twisting motion of the molecular subunits becomes restricted, thus interrupting the TICT process.

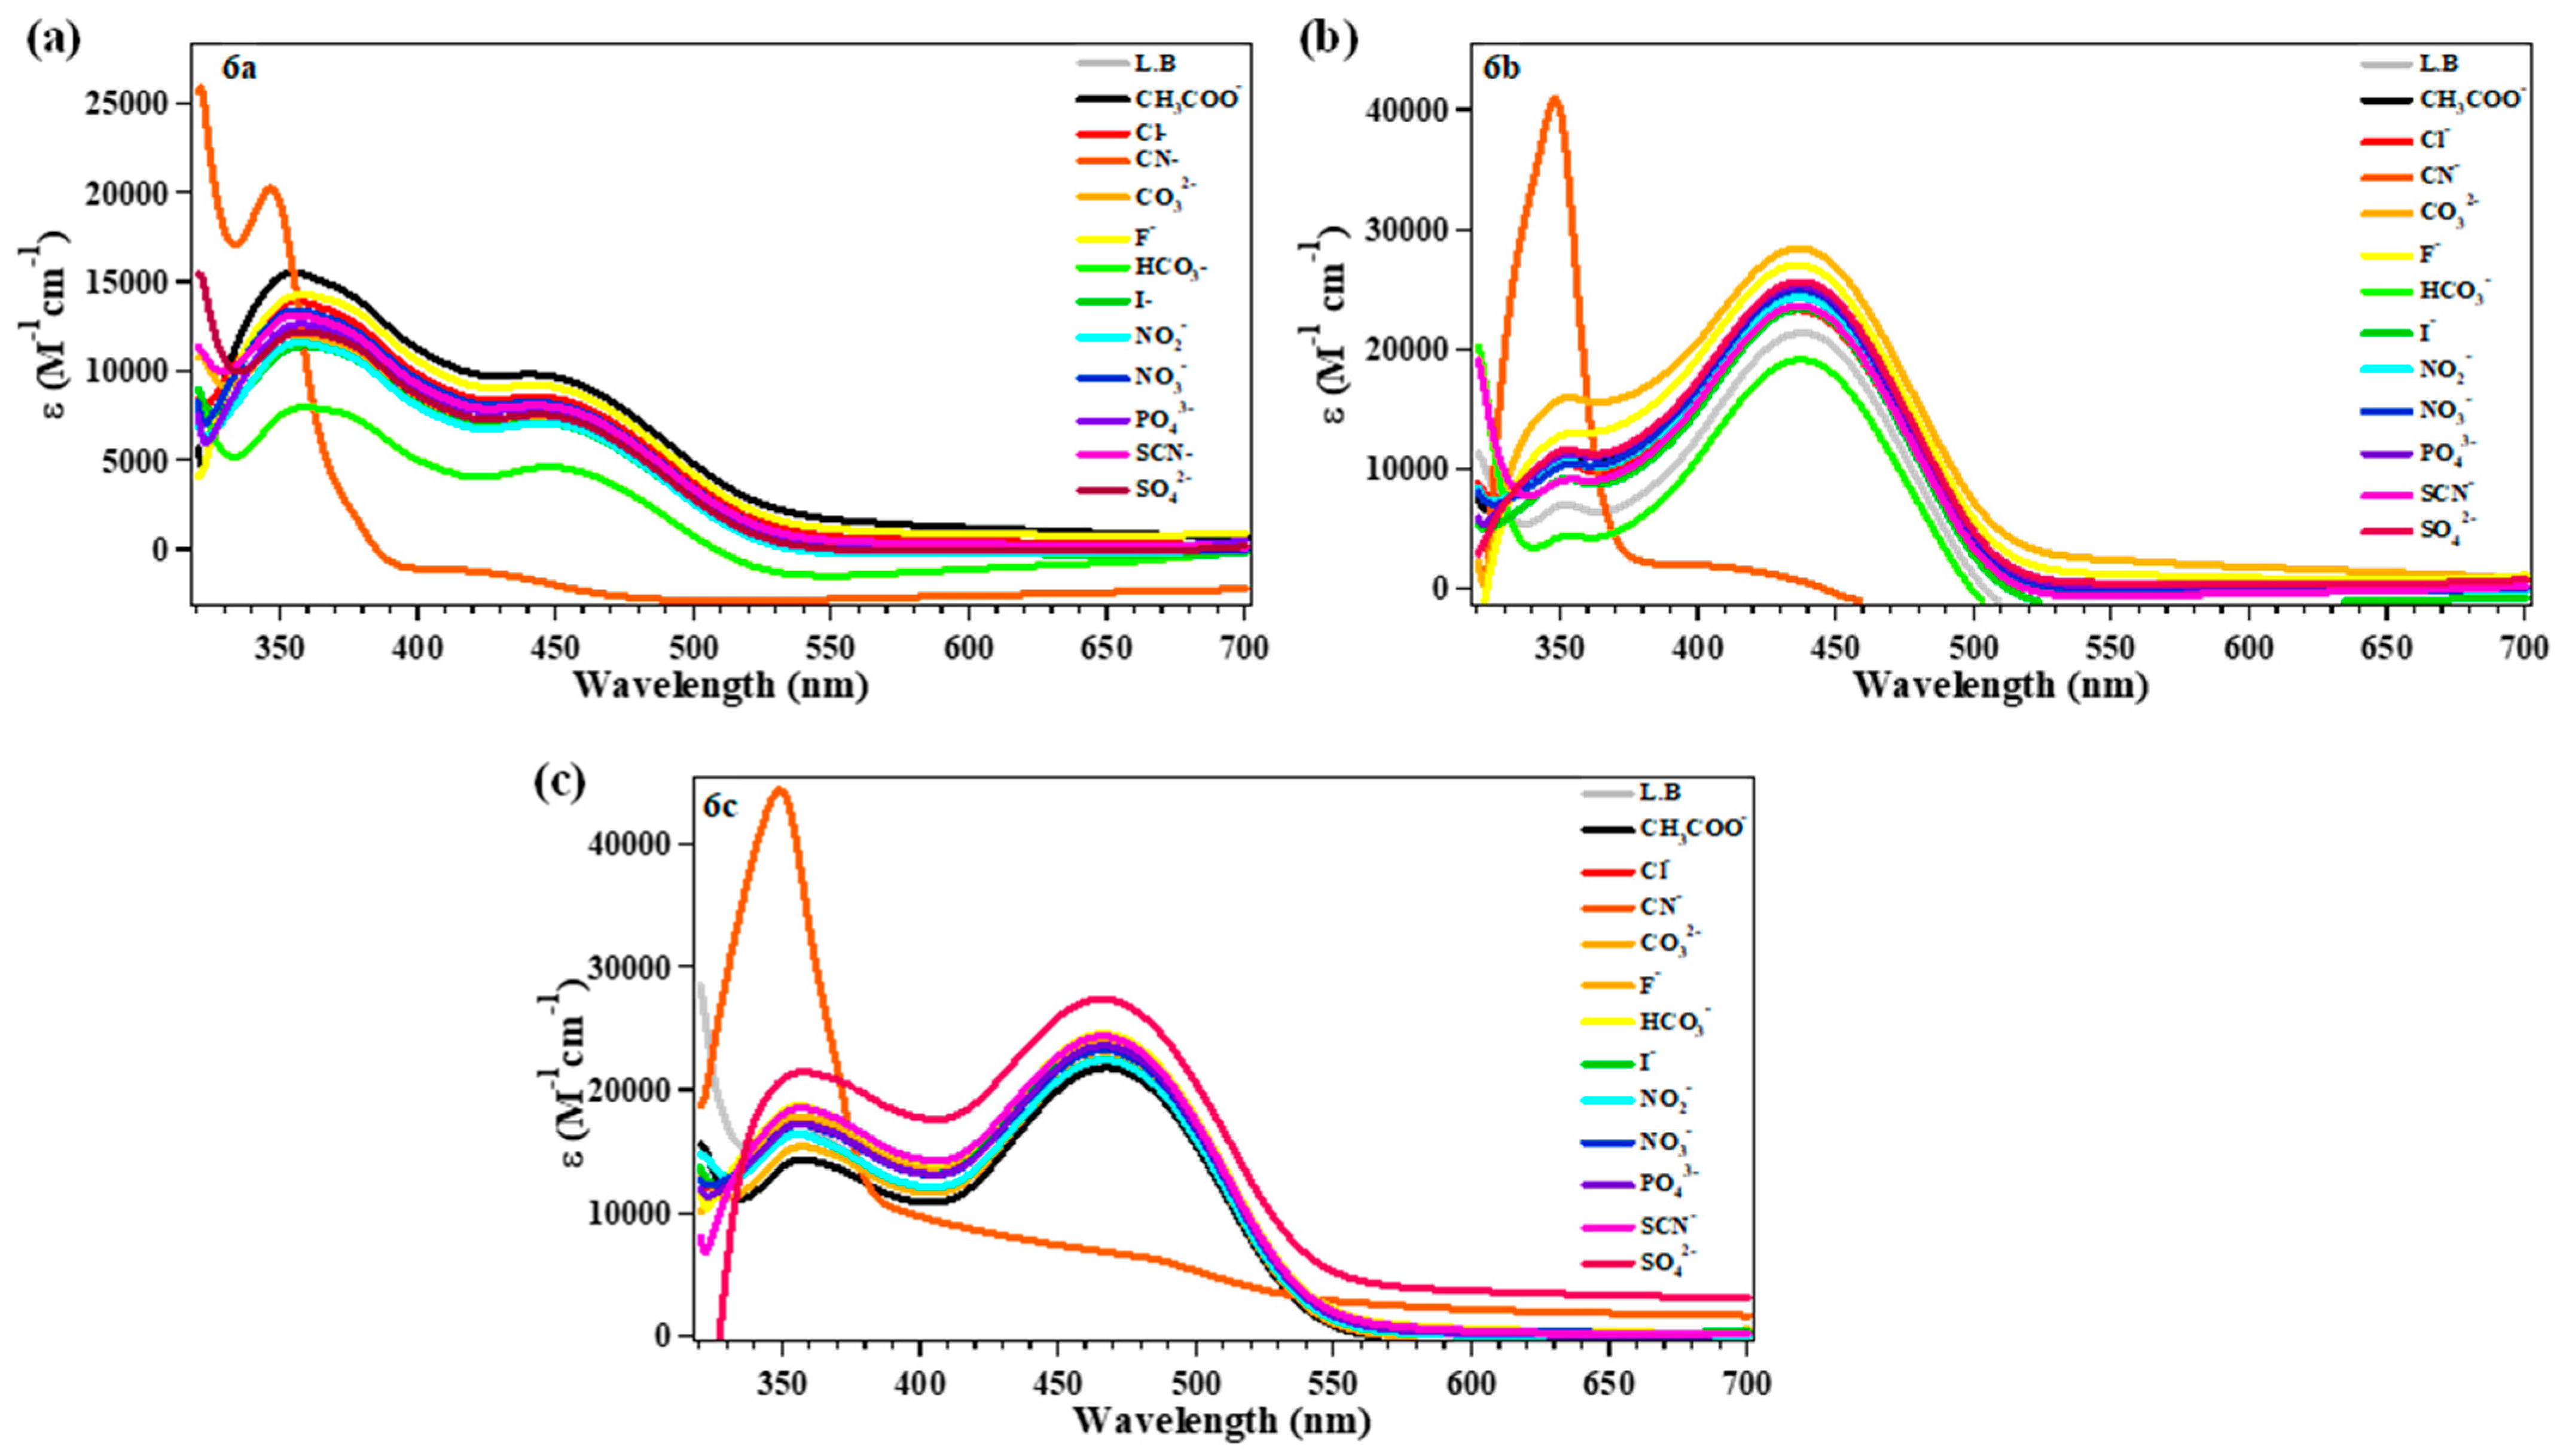
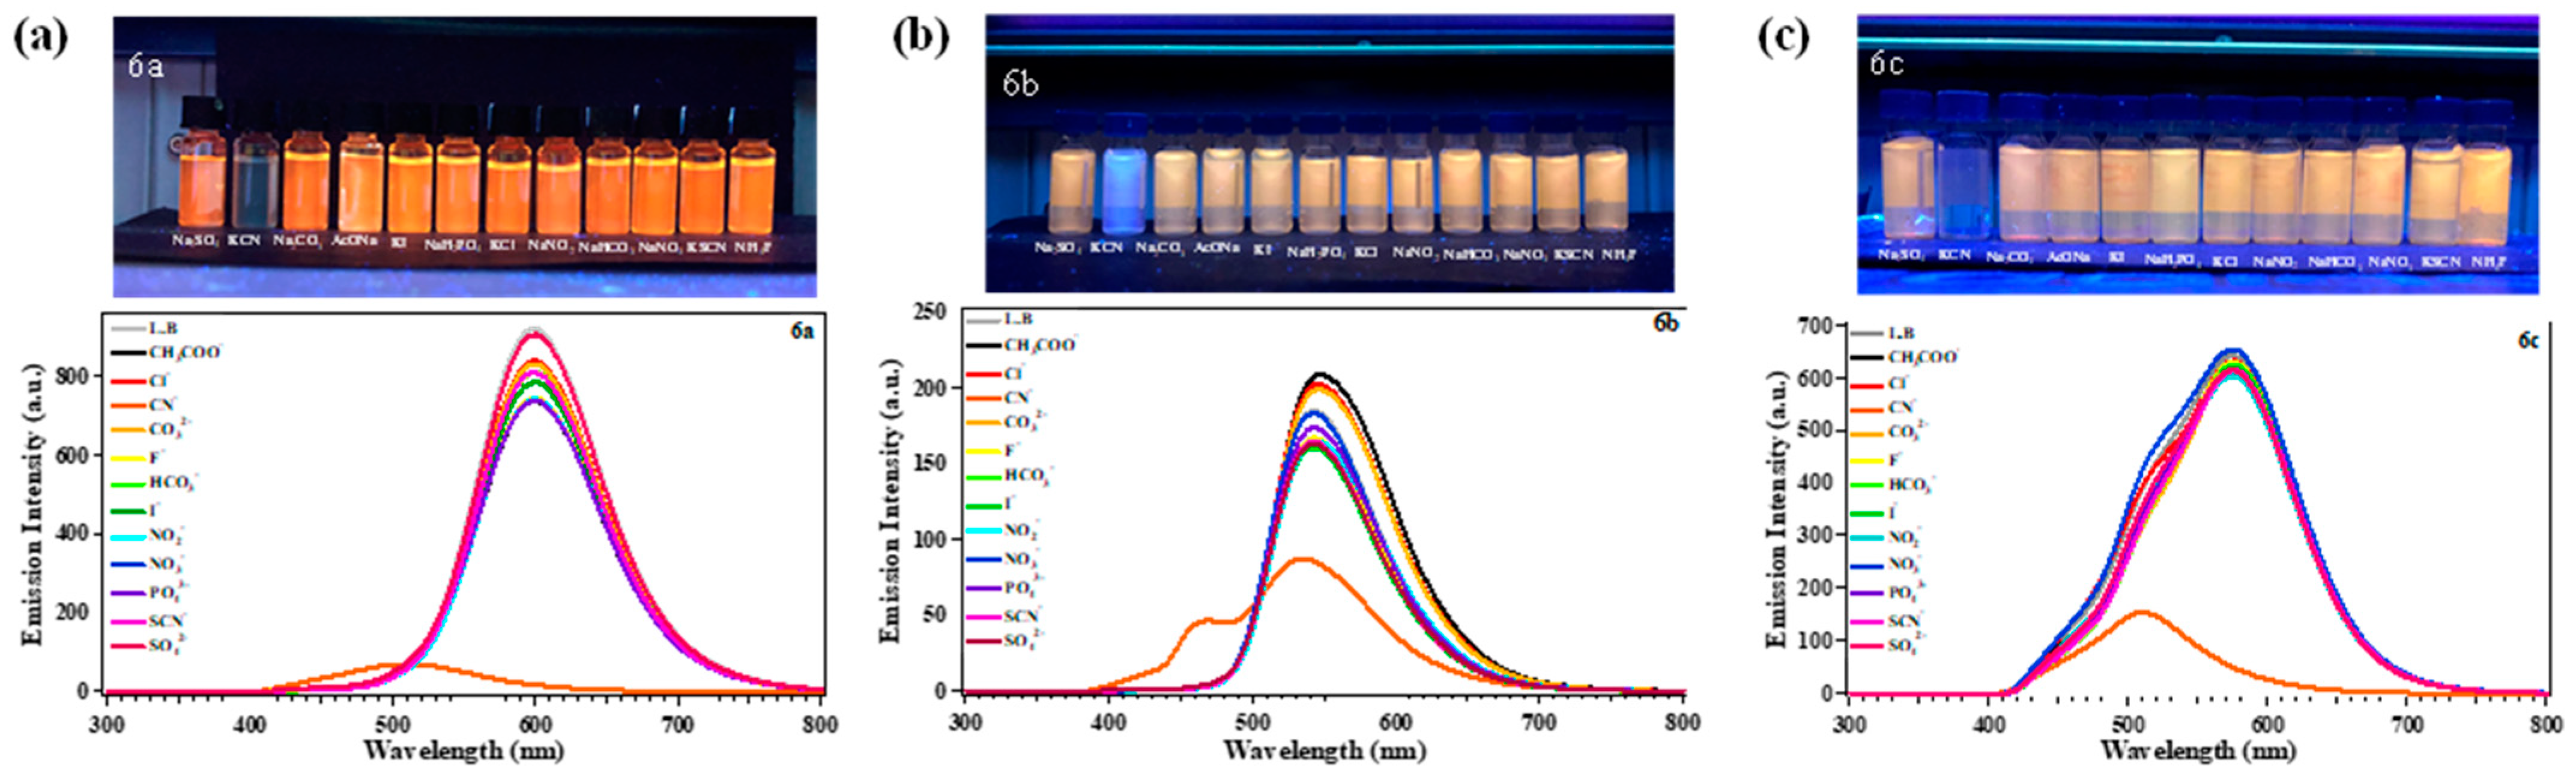
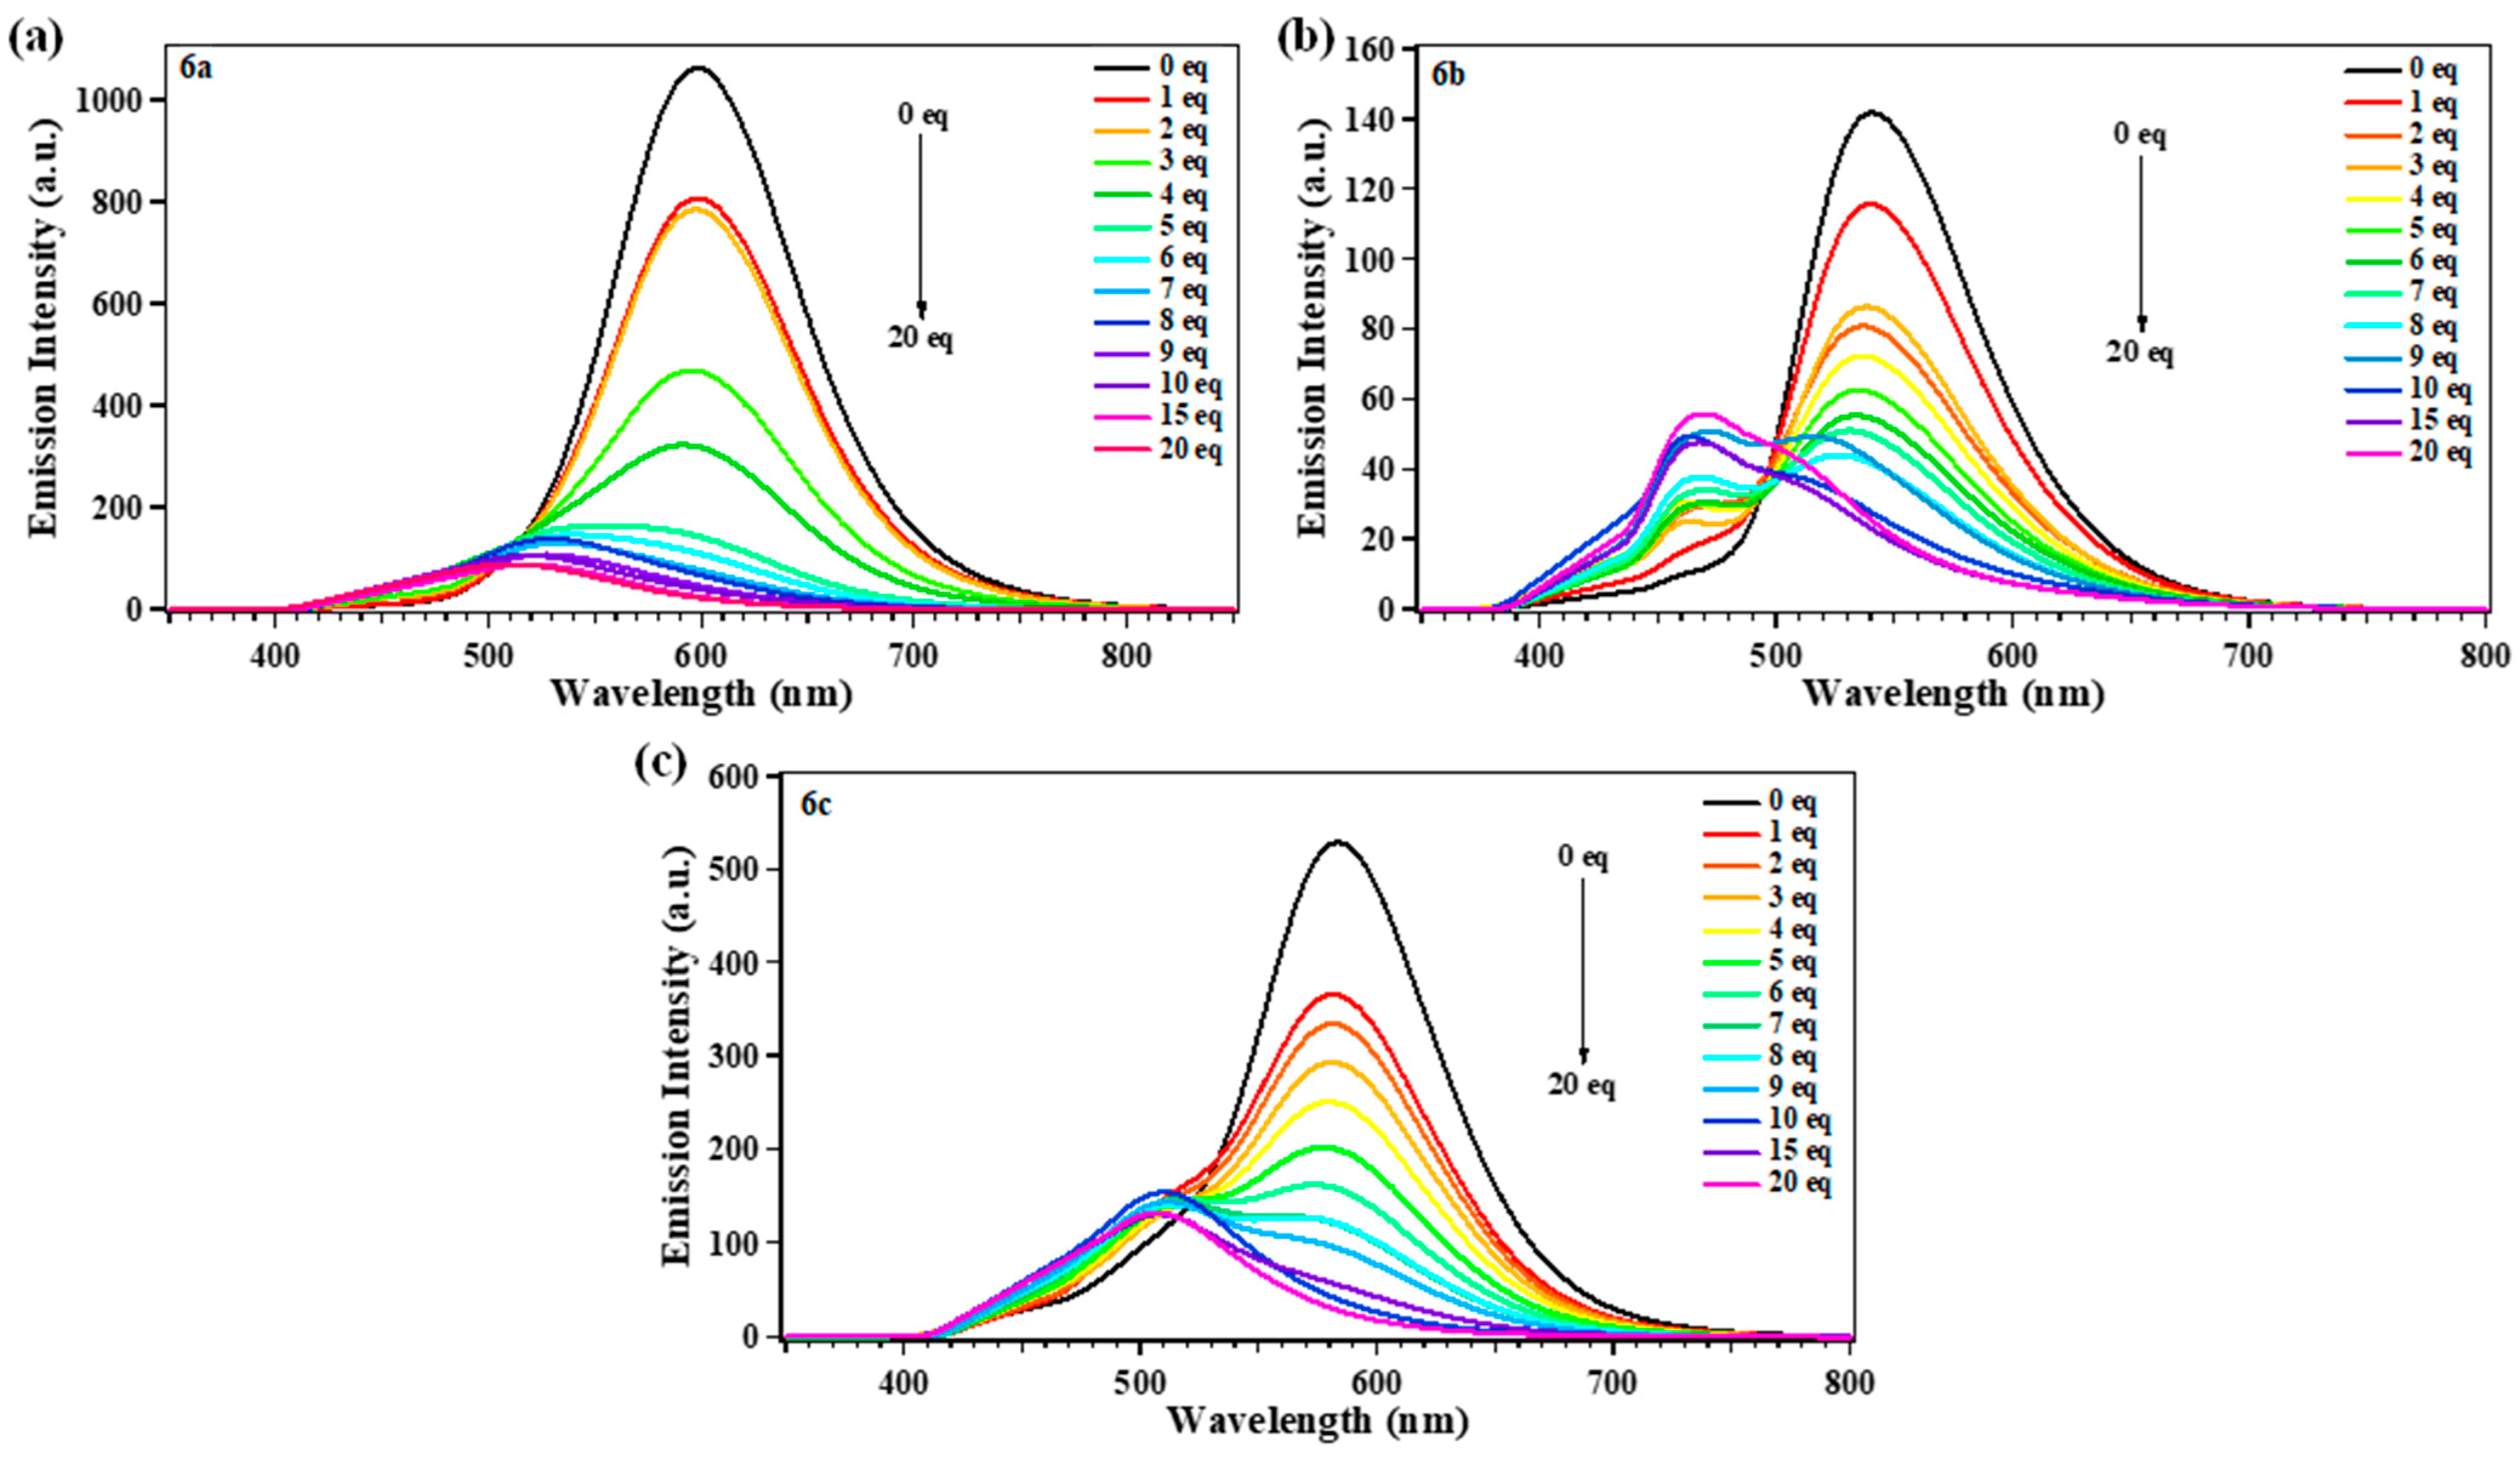
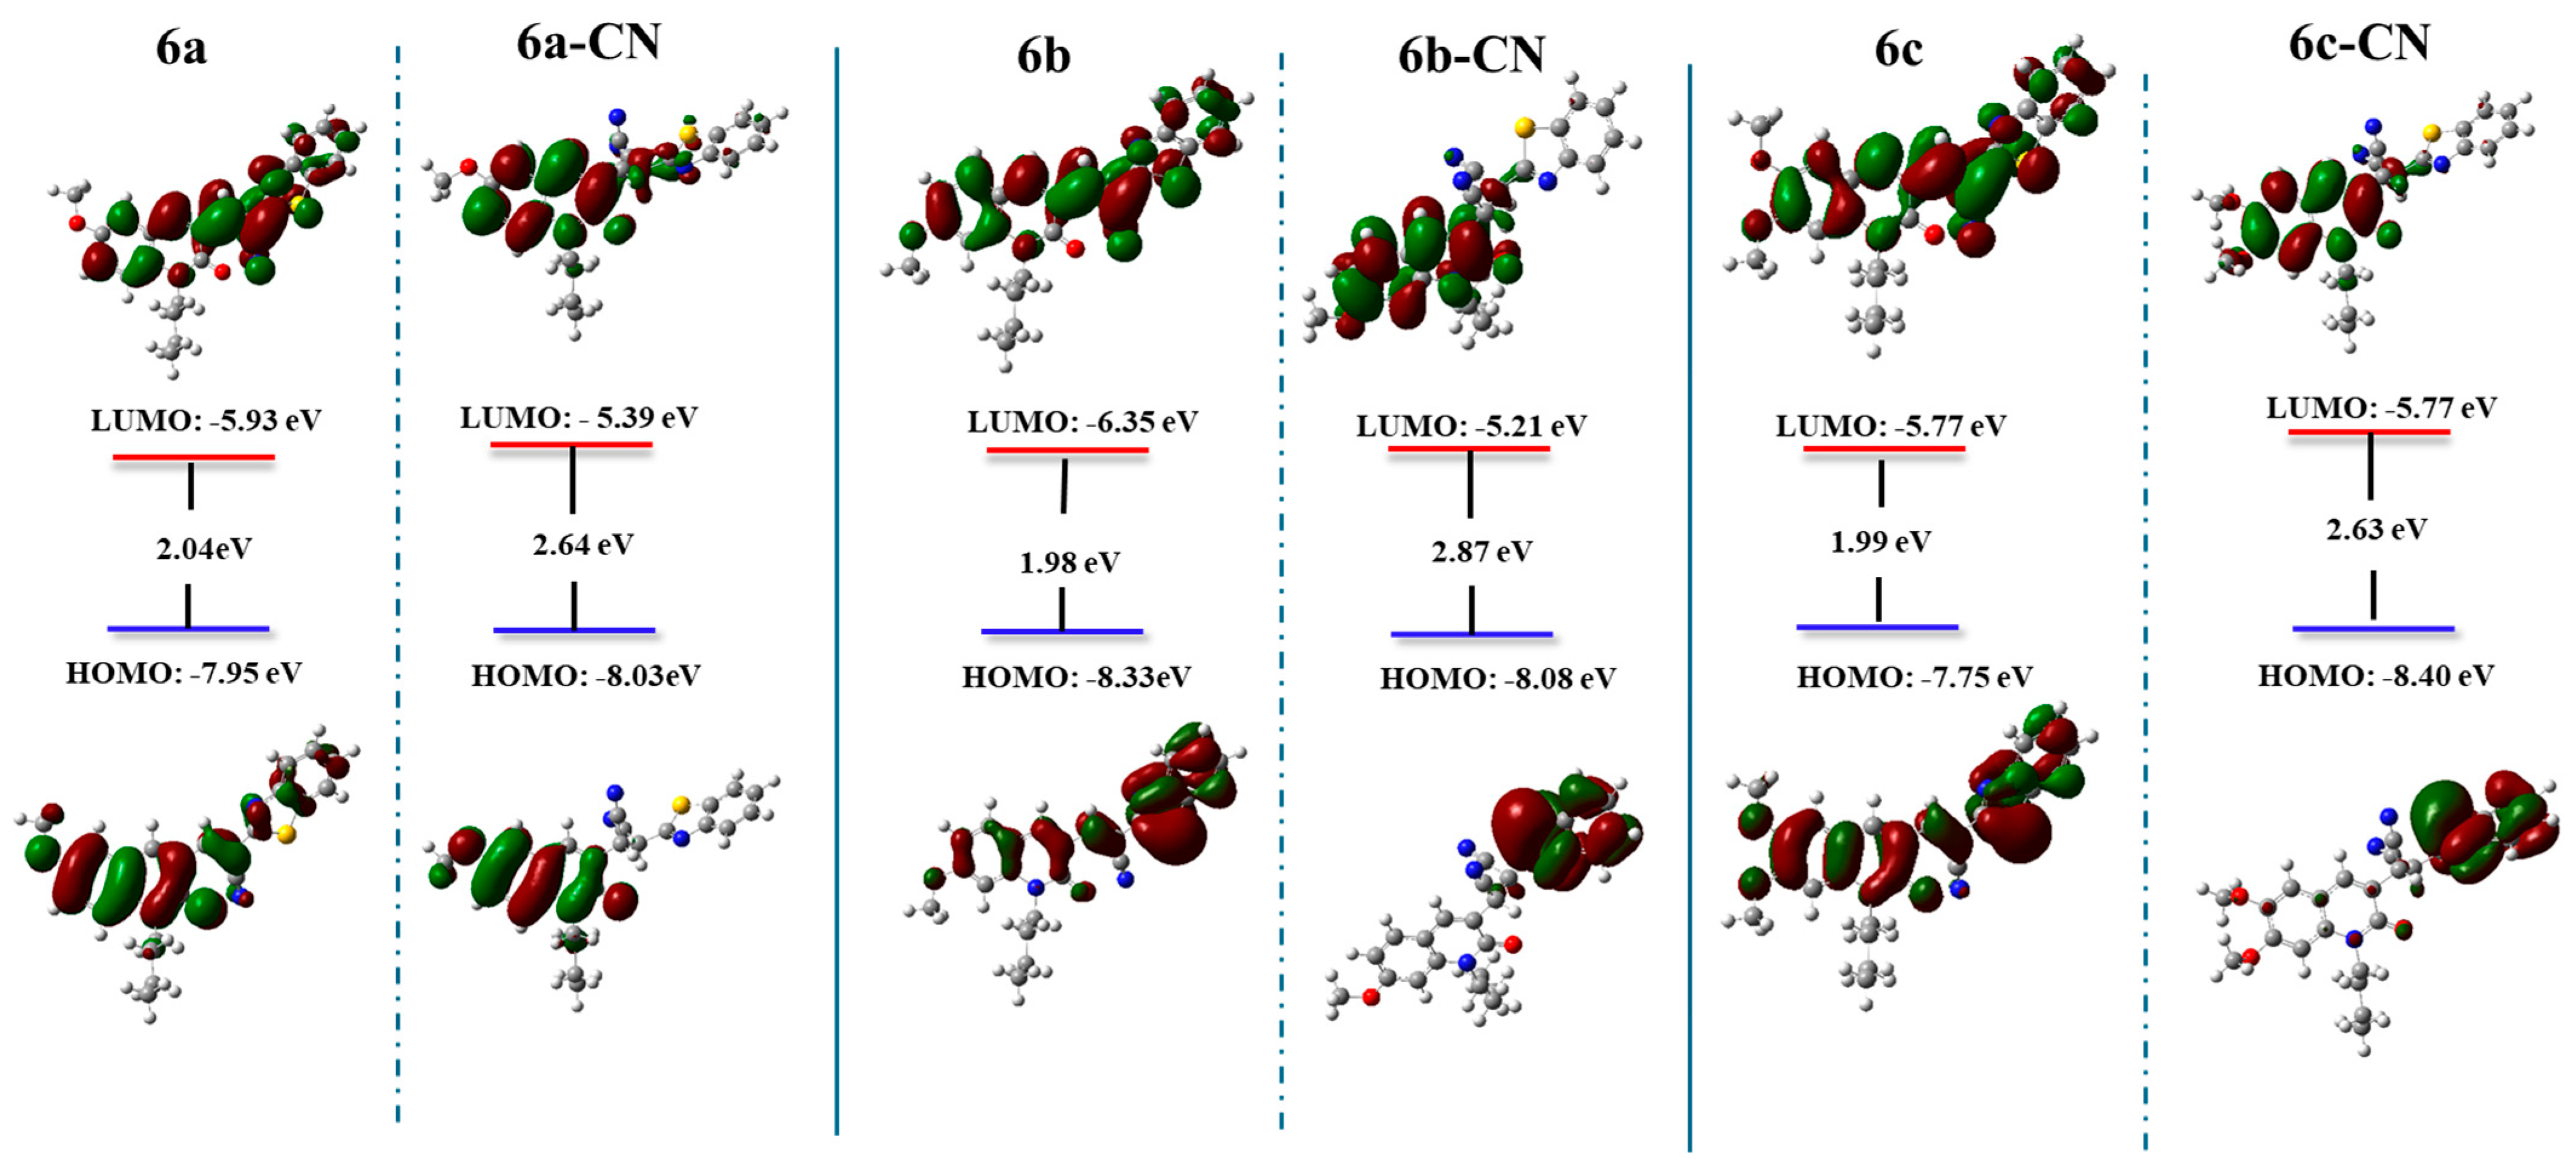
2.4. Sensing Response of 6a–c to Several Anions

The sensing response of quinolone–benzothiazole derivatives toward different anions (CH3CO2, Cl, CN, CO32−, PO43−, I, F, NO2, NO3, HCO3, SCN and SO42−) was studied, employing UV-Vis absorption and fluorescence emission measurements in mixtures of DMSO:water (8:2) at a concentration of 50 µM, with 10 equivalents of each anion in a buffer solution at pH 7. Compounds 6a–c in DMSO/water solution (Figure 6) exhibited two absorption bands around 350 nm and 450 nm, which could be assigned to π-π transitions and the ICT process, respectively. After the addition of 10 equivalents of each of the analytes mentioned above to 6a–c solutions, no appreciable changes were observed; nevertheless, the addition of CN anions caused a considerable fall in the absorption intensity at around 450 nm, and the increase in the absorption intensity of the band centered at 350 nm. All these variations can be noted by a change in the color of the solution of compounds 6a–c once CN was added, passing from orange to transparent.
Fluorescence spectra of compounds 6a–c (Figure 7) show the response against different anions. No anion evidence had a substantial effect on the fluorescence intensity of the compounds 6a–c, except for the CN anion, which led to a quenching of the emission peak at 600 nm, 555 nm, and 575 nm for 6a, 6b, and 6c, respectively, with the increase in intensity of peak around 500 nm for 6a and 6c. The case of 6b exhibited two new emission peaks centered at 455 nm and 555 nm. The decrease in emission intensity is probably due to the nucleophilic addition of the cyanide ion in the unsaturation that binds quinolone and benzothiazole units in compounds 6a–c, inhibiting intramolecular charge transfer, thus quenching fluorescence [55] (Figure 8). The sensing performances of 6a–c to different amounts of CN in DMSO/water (8:2) solutions was studied by fluorescence emission spectroscopy. As seen in Figure 9, with the addition of CN, the peaks at 563 nm, 529 nm, and 553 nm for 6a, 6b, and 6c, respectively, gradually decreased because the nucleophilic attack of CN interrupted the conjugation of the chemosensors, interrupting the ICT process. It is worth highlighting that the gradual increase in the CN concentration showed an excellent linear relationship (6a R2: 0.951, 6b R2: 0.962, and 6c R2: 0.902). However, when the concentration of CN is above 300 µM, the fluorescence intensity remains almost constant, meaning the solution is saturated with CN ions. According to the equations LOD = 3σ/S and LOQ = 10σ/S, the limit of detection (LOD) and limit of quantification (LOQ) were determined for all the chemosensors (Figure S3). Estimated LOD and LOQ values were, respectively, 3.0 × 10⁻⁷ M and 9.2 × 10⁻⁷ M for 6a, 2.9 × 10⁻⁷ M and 8.8 × 10⁻⁷ M for 6b, and 4.4 × 10⁻⁷ M and 1.3 × 10⁻⁶ M for 6c, which are lower than the allowed amount of CN in drinking water (1.9 µM) according to the WHO [56].

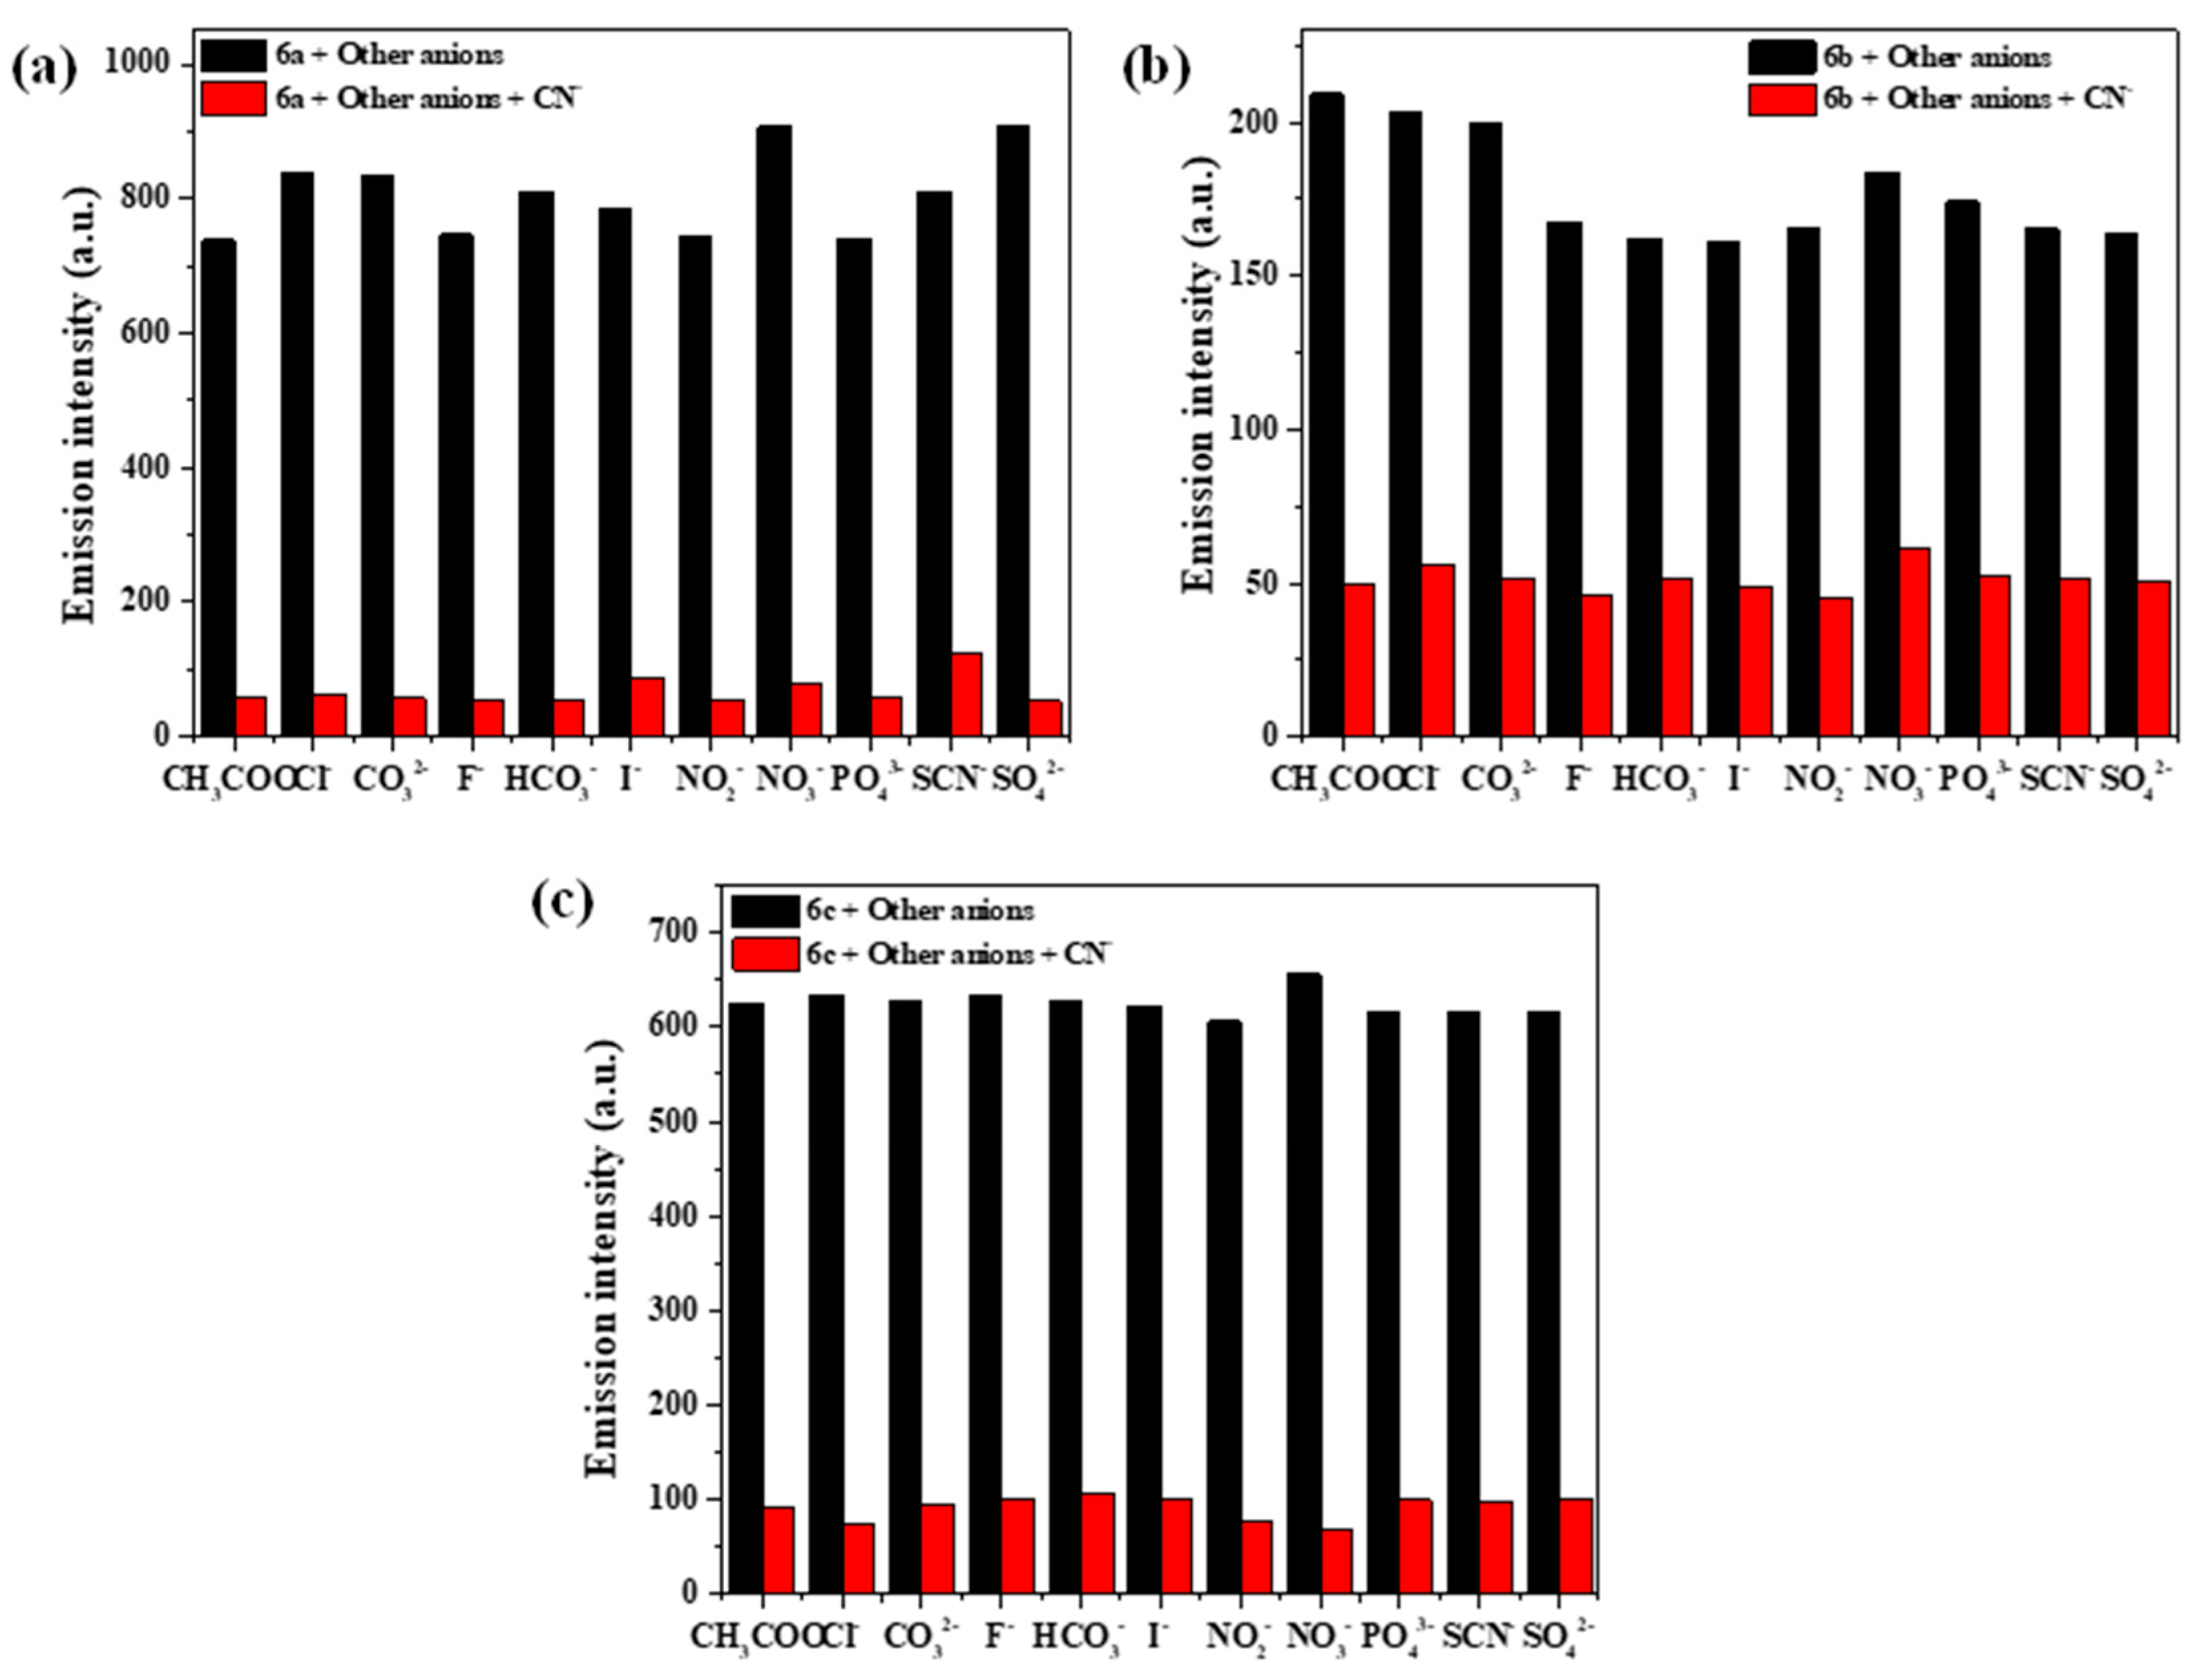
2.5. Selectivity and Competition Experiments for CN

To further explore the utility of 6a, 6b, and 6c as an ion-selective fluorescent sensor for CN, competitive studies were carried out with 10 equivalents of CH3CO2−, Cl, CO32−, PO43−, I, F, NO2−, NO3−, HCO3−, SCN, and SO42− anions in DMSO/water mixture (8:2). As shown in Figure 10, the introduction of interfering anions to 6a, 6b, and 6c solutions with CN did not cause significant effects on the fluorescence response. Compounds 6a and 6c show better results, indicating that they could be used as a fluorescence sensor for CN detection with outstanding selectivity and anti-interference.
As shown in Figure 7, the decrease in fluorescence intensity is maximal for CN ions. In this sense, to have more insight into this fact, a Density Functional Theory (DFT) study was carried out using the combination of the correlation-exchange functional wB97XD, the 6-31G (++dp) basis set, and the frontier orbitals. On the other hand, the solvent effect was studied using the conductor-like polarizable continuum model (CPCM). The application of CPCM extends to the computation of aqueous solvation-free energies for various organic molecules and the elucidation of fluorescence phenomena exhibited by certain dyes. Therefore, the combination of DFT jointly with CPCM could allow us to obtain a better understanding of the fluorescence behavior.
Figure 11 shows that, as expected, molecules 6a, 6b, and 6c have both HOMO and LUMO spread almost throughout the molecules, which explains the electronic delocalization around the entire structures, and therefore the respective ICT processes take place in all molecules [57]. Interestingly, for 6a–c + CN systems (Figure 11—right), both HOMO and LUMO electronic densities are mainly located only on one side of the molecules; for example, for compound 6a, the HOMO and LUMO are localized over the quinolone moiety, whereas 6b–CN and 6c–CN have the HOMO on the benzothiazole moiety and the LUMO over the quinoline moiety. These results strongly suggest that the electronic communication between the quinolone and benzothiazole moieties has been disrupted by the binding of the CN group to the molecule, thus hindering the ICT processes in the molecule; therefore, the fluorescence emission is decreased.

3. Materials and Methods

3.1. Materials and Instrumentation

All organic chemicals and solvents were purchased from Sigma-Aldrich, Fluka, and Merck (analytical grade reagents) and used without further purification. IR spectra were recorded on a Shimadzu FTIR 8400 ATR spectrophotometer. Melting points were measured using a Stuart SMP3 melting point apparatus and were uncorrected. 1H and 13C NMR spectra were recorded on a Bruker Advance 400 spectrophotometer (Bremen, Germany) operating at 400 MHz and 100 MHz, respectively, using DMSO-d6 and CDCl3 as solvents and tetramethylsilane as internal standard. 1H and 13C NMR spectra of all compounds can be found in the supporting information (Figures S4–S6). Mass spectra were run on a SHIMADZU-GCMS 2010-DI-2010 spectrometer (Kyoto, Japan) (equipped with a direct inlet probe) operating at 70 eV. TLC analyses were performed on silica gel aluminum plates (Merck 60 F254), and spots were visualized with ultra-violet irradiation. Single crystal X-ray diffraction data were collected at 298 K on an Agilent SuperNova, Dual, Cu at Zero, Atlas four-circle diffractometer equipped with a CCD plate detector using CuKα radiation (λ = 1.54184 Å). Data integration, Lorentz polarization effects, and absorption corrections were performed using the CrysAlis PRO software package [58]. The structure was solved by using an iterative algorithm and then refined by SHELXL-2015 [59], included in Olex2 [60]. Non-hydrogen atoms of the molecules were resolved, and their full-matrix least-squares refinement with anisotropic thermal parameters was conducted. Aromatic and aliphatic hydrogen atoms were stereochemically positioned and refined with the riding model (with Uiso(H) = 1.2 Ueq for CH, CH2 and CH3). The anisotropic displacement ellipsoid plots and artwork were built with Diamond [61] and Mercury [62] software packages. The CIF file of compound 6c was deposited in the Cambridge Structural Data Base under the code CCDC 2341851. Copies of the data can be obtained, free of charge, via www.ccdc.cam.ac.uk (accessed on 27 June of 2024). Density Functional Theory (DFT) calculations for pristine 6a–c compounds and 6a–c + CN⁻ systems were performed using the B3LYP/6-31G(d) level of theory. These calculations were carried out with the Gaussian 09 (G09) software package, specifically the Linux version. The computational work was executed on a workstation equipped with 64 cores and 125 GB of RAM.

3.2. General Procedure for the Synthesis of 2a–c and 3a–c

N,N-dimethylformamide (9.1 g, 9.6 mL, 0.125 mol) was cooled to 0 °C and phosphoryl chloride (53.7 g, 32.2 mL, 0.35 mol) was added dropwise, while stirring, for 30 min. The corresponding acetanilide 1a–c (0.05 mol) was added to this solution and the temperature was raised to 80 °C for 24 h. The cooled reaction mixture was poured into ice water (300 mL) and stirred at 0–10 °C for 1 h. The resulting precipitate was filtered, washed with water (100 mL), dried, and recrystallized from ethyl acetate to give products 2a–c. Subsequently, to obtain intermediates 3a–c, aldehydes 2a–c (1 mmol) were refluxed in 10 mL of 70% aqueous acetic acid for 6–25 h. After cooling, the resulting solid precipitate was collected by filtration, washed with water, dried, and purified by recrystallization from N,N-dimethylformamide (DMF).

3.3. General Procedure for the Synthesis of 5a–c

1-Bromobutane (1.3 mmol) and potassium carbonate (1.5 mmol) were added to a solution of quinolones 3a–c (1.0 mmol) in DMF (4 mL). The reaction mixture was stirred at room temperature for 24–26 h. After completion (checked by TLC), the reaction mixture was poured into ice water (25 mL) and the solid product which was formed was filtered, washed well with water, dried, and purified by column chromatography using dichloromethane.

3.4. General Procedure for the Synthesis of Hybrids 6a–c

Compounds 4a–c (1.00 mmol) were dissolved in 25 mL of EtOH in a round-bottom flask; compound 5 (1.19 mmol) was then added to the solution, followed by the addition of three drops of tri-ethylamine (NEt3). The mixture was stirred for 24 h at room temperature. The reaction was controlled by TLC, and once the reagents were consumed, the mixture was filtered and was washed several times with ethanol. No further purification was required.
(E)-2-(Benzo[d]thiazol-2-yl)-3-(1-butyl-6-methoxy-2-oxo-1,2-dihydroquinolin-3-yl)acrylonitrile (6a). Yield 90%. Orange solid, m.p. 225–227 °C, FTIR (ATR) υ = [2225] (C≡N), [1637] (C=O) cm−1, 1H NMR (400 MHz, CDCl3) δ (ppm): 8.91 (s, 1H), 8.67 (s, 1H), 8.14 (d, J = 8.1 Hz, 1H), 7.92 (d, J = 8.0 Hz, 1H), 7.55 (t, J = 8.2 Hz, 1H), 7.46 (t, J = 7.6 Hz, 1H), 7.37–7.25 (m, 2H), 7.17 (d, J = 2.4 Hz, 1H), 4.48–4.26 (m, 2H), 3.93 (s, 3H), 1.86–1.72 (m, 2H), 1.66–1.45 (m, 2H), 1.05 (t, J = 7.3 Hz, 3H). 13C NMR (101 MHz, CDCl3) δ (ppm): 163.1, 160.1, 155.1, 153.7, 141.6, 138.8, 134.9, 134.8, 126.9, 126.3, 124.4, 124.1, 123.1, 121.6, 120.7, 116.0, 115.8, 111.0, 107.6, 55.9, 43.3, 29.7, 20.3, 13.8. EI MS (70 eV): m/z 415 (63.6%), 342 (14), 313 (34), 239 (35), 236 (60), 133 (78), 83 (100). HRMS (ESI) m/z: [M + H]+ calc. for C24H22N3O2S 416.1427; found 416.1421.
(E)-2-(Benzo[d]thiazol-2-yl)-3-(1-butyl-7-methoxy-2-oxo-1,2-dihydroquinolin-3-yl)acrylonitrile (6b), Yield 94%. Orange solid, m.p. 240–241 °C FTIR (ATR) υ = [2218] (C≡N), [1651] (C=O) cm−1, 1H NMR (400 MHz, CDCl3) δ (ppm): 8.92 (s, 1H), 8.65 (s, 1H), 8.13 (d, J = 8.0 Hz, 1H), 7.91 (d, J = 7.7 Hz, 1H), 7.70 (d, J = 8.8 Hz, 1H), 7.54 (t, J = 7.7 Hz, 1H), 7.45 (t, J = 8.1 Hz, 1H), 6.92 (dd, J = 8.7, 2.1 Hz, 1H), 6.82 (d, J = 1.8 Hz, 1H), 4.38–4.23 (m, 2H), 3.98 (s, 3H), 1.88–1.73 (m, 2H), 1.67–1.42 (m, 2H), 1.06 (t, J = 7.4 Hz, 3H). 13C NMR (101 MHz, CDCl3) δ (ppm): 164.0, 163.0, 161.0, 153.7, 142.1, 141.8, 139.3, 134.8, 132.9, 126.8, 126.1, 123.9, 121.6, 120.8, 116.3, 114.5, 110.7, 106.0, 99.0, 55.8, 43.2, 29.2, 20.3, 13.9. EI MS (70 eV): m/z 414.90 (100%), 384 (23), 373 (21), 358 (34), 342 (53); HRMS (ESI) m/z: [M + H]+ calc. for C24H22N3O2S 416.1427; found 416.1413.
(E)-2-(Benzo[d]thiazol-2-yl)-3-(1-butyl-6,7-dimethoxy-2-oxo-1,2-dihydroquinolin-3-yl)acrylonitrile (6c), Yield 72%. Orange solid, m.p. 243–244 °C FTIR (ATR) υ = [2217] (C≡N), [1630] (C=O) cm−1, 1H NMR (400 MHz, CDCl3) δ (ppm): 8.93 (s, 1H), 8.67 (s, 1H), 8.14 (d, J = 8.1 Hz, 1H), 7.92 (d, J = 7.9 Hz, 1H), 7.54 (t, J = 7.6 Hz, 1H), 7.45 (t, J = 7.5 Hz, 1H), 7.13 (s, 1H), 6.80 (s, 1H), 4.47–4.32 (m, 2H), 4.06 (s, 3H), 4.01 (s, 3H), 1.88–1.78 (m, 2H), 1.64–1.44 (m, 2H), 1.08 (t, J = 7.4 Hz, 3H). 13C NMR (101 MHz, CDCl3) δ (ppm): 163.6, 160.6, 154.7, 153.7, 145.9, 141.9, 138.6, 136.8, 134.8, 126.8, 126.1, 123.9, 121.6, 121.1, 116.4, 113.7, 110.6, 105.7, 97.0, 56.3, 43.3, 29.4, 20.4, 13.9. EI MS (70 eV): m/z 445 (100%), 428 (26), 414 (24), 388 (36), 372 (54); HRMS (ESI) m/z: [M + H]+ calc. for C25H24N3O3S 446.1538; found 446.1538.

4. Conclusions

Three novel aggregation-induced emission (AIE) luminogens based on methoxiquinolone–benzothiazole hybrids were successfully synthesized and characterized. These compounds exhibit a significant increase in emission, accompanied by a red-shifting when the mixture of THF–water contains over 70% water, demonstrating their efficiency as AIE systems. Additionally, these hybrids serve as highly selective and efficient cyanide chemosensors with limits of detection (LOD) and quantifications (LOQ) of 3.0 × 10⁻⁷ M and 9.2 × 10⁻⁷ M for compound 6a, 2.9 × 10⁻⁷ M and 8.8 × 10⁻⁷ M for compound 6b, and 4.4 × 10⁻⁷ M and 1.3 × 10⁻⁶ M for compound 6c. Moreover, the study of frontier molecular orbitals (FMOs) showed that in the absence of cyanide ions (CN), the HOMO and LUMO of compounds 6a–c are delocalized across the entire molecular structures, facilitating intramolecular charge transfer processes. However, upon the addition of CN, the electronic densities of both HOMO and LUMO become localized on one side of the molecules, indicating a substantial change in electronic distribution and potentially influencing their photophysical behavior. This work paves the way for the design of new AIEgens and efficient cyanide chemosensors based on heterocyclic quinolones and benzothiazole moieties.

Supplementary Materials

The following supporting information can be downloaded at https://www.mdpi.com/article/10.3390/ijms252312896/s1.

Author Contributions

M.M.-A. and D.I., investigation, data curation, formal analysis, writing—original draft preparation; R.D. and M.A.M., methodology, writing—review and editing; A.I., R.A., J.Q. and L.A.I., data curation, writing—review and editing; J.T., E.M. and D.I., conceptualization, visualization, supervision, project administration, funding acquisition. All authors have read and agreed to the published version of the manuscript.

Funding

This Research was funded by the Vicerrectoría de Investigación, Creación e Innovación of the Universidad del Norte and Dirección General de Investigaciones of Universidad Santiago de Cali under call No. DGI-01-2024.

Institutional Review Board Statement

Not applicable.

Informed Consent Statement

Not applicable.

Data Availability Statement

Data are contained within the article.

Acknowledgments

A.I., R.A. and J.Q. acknowledge the Universidad del Valle for financial support. R.D. acknowledges the Departamento de Química, Universidad del Cauca. M.M. is grateful for the support from the Facultad de Ciencias and Departamento de Química at Universidad de los Andes, Bogotá, Colombia. L.A.I. acknowledges Dirección General de Investigaciones of Universidad Santiago de Cali (convocatoria DGI No. 11-2021, 939-621121-3307) and call No. DGI-01-2024 for financial support. D.I. and E.M. acknowledge Universidad del Norte for financial support.

Conflicts of Interest

The authors declare no conflicts of interest.

References

  1. Dine, I.; Mulugeta, E.; Melaku, Y.; Belete, M. Recent Advances in the Synthesis of Pharmaceutically Active 4-Quinolone and Its Analogues: A Review. RSC Adv. 2023, 13, 8657–8682. [Google Scholar] [CrossRef] [PubMed]
  2. Bhatt, S.; Chatterjee, S. Fluoroquinolone Antibiotics: Occurrence, Mode of Action, Resistance, Environmental Detection, and Remediation—A Comprehensive Review. Environ. Pollut. 2022, 315, 120440. [Google Scholar] [CrossRef] [PubMed]
  3. Kloskowski, T.; Frąckowiak, S.; Adamowicz, J.; Szeliski, K.; Rasmus, M.; Drewa, T.; Pokrywczyńska, M. Quinolones as a Potential Drug in Genitourinary Cancer Treatment—A Literature Review. Front. Oncol. 2022, 12, 890337. [Google Scholar] [CrossRef] [PubMed]
  4. Bush, N.G.; Diez-Santos, I.; Abbott, L.R.; Maxwell, A. Quinolones: Mechanism, Lethality and Their Contributions to Antibiotic Resistance. Molecules 2020, 25, 5662. [Google Scholar] [CrossRef]
  5. Dhiman, P.; Arora, N.; Thanikachalam, P.V.; Monga, V. Recent Advances in the Synthetic and Medicinal Perspective of Quinolones: A Review. Bioorg. Chem. 2019, 92, 103291. [Google Scholar] [CrossRef]
  6. Naeem, A.; Badshah, S.; Muska, M.; Ahmad, N.; Khan, K. The Current Case of Quinolones: Synthetic Approaches and Antibacterial Activity. Molecules 2016, 21, 268. [Google Scholar] [CrossRef]
  7. Stone, M.R.L.; Masi, M.; Phetsang, W.; Pagès, J.-M.; Cooper, M.A.; Blaskovich, M.A.T. Fluoroquinolone-Derived Fluorescent Probes for Studies of Bacterial Penetration and Efflux. Medchemcomm 2019, 10, 901–906. [Google Scholar] [CrossRef]
  8. Pal, T.; Mathai, T.; Mukherji, S. Colorimetric Chemosensor for Rapid Detection of Fluoroquinolone Load in Environmental Water Bodies, Urine, and Counterfeit Drug Testing. Biosens. Bioelectron. X 2023, 14, 100384. [Google Scholar] [CrossRef]
  9. Patil, S.R.; Nandre, J.P.; Patil, P.A.; Bothra, S.; Sahoo, S.K.; Klasek, A.; Rodríguez-López, J.; Mahulikar, P.P.; Patil, U.D. Quinolone Based Chemosensor for the Naked-Eye and Spectrophotometric Detection of Cu2+ in Aqueous Media. Inorg. Chem. Commun. 2014, 49, 59–62. [Google Scholar] [CrossRef]
  10. Fu, Y.-L.; Chen, X.-G.; Li, H.; Feng, W.; Song, Q.-H. Quinolone-Based Fluorescent Probes for Distinguished Detection of Cys and GSH through Different Fluorescence Channels. New J. Chem. 2020, 44, 13781–13787. [Google Scholar] [CrossRef]
  11. Pathak, N.; Rathi, E.; Kumar, N.; Kini, S.G.; Rao, C.M. A Review on Anticancer Potentials of Benzothiazole Derivatives. Mini-Rev. Med. Chem. 2020, 20, 12–23. [Google Scholar] [CrossRef] [PubMed]
  12. Yadav, K.P.; Rahman, M.A.; Nishad, S.; Maurya, S.K.; Anas, M.; Mujahid, M. Synthesis and Biological Activities of Benzothiazole Derivatives: A review. Intell. Pharm. 2023, 1, 122–132. [Google Scholar] [CrossRef]
  13. Yadav, R.; Meena, D.; Singh, K.; Tyagi, R.; Yadav, Y.; Sagar, R. Recent Advances in the Synthesis of New Benzothiazole Based Anti-Tubercular Compounds. RSC Adv. 2023, 13, 21890–21925. [Google Scholar] [CrossRef] [PubMed]
  14. Rybczyński, P.; Bousquet, M.H.E.; Kaczmarek-Kędziera, A.; Jędrzejewska, B.; Jacquemin, D.; Ośmiałowski, B. Controlling the Fluorescence Quantum Yields of Benzothiazole-Difluoroborates by Optimal Substitution. Chem. Sci. 2022, 13, 13347–13360. [Google Scholar] [CrossRef] [PubMed]
  15. Das, S.; Indurthi, H.K.; Asati, P.; Saha, P.; Sharma, D.K. Benzothiazole Based Fluorescent Probes for the Detection of Biomolecules, Physiological Conditions, and Ions Responsible for Diseases. Dye. Pigment. 2022, 199, 110074. [Google Scholar] [CrossRef]
  16. Tang, L.; Zou, Y.; Zhong, K.; Bian, Y. A Novel Benzothiazole-Based Enaminone as a Fluorescent Probe for Highly Selective and Sensitive Detection of CN. RSC Adv. 2016, 6, 48351–48356. [Google Scholar] [CrossRef]
  17. Mallesh, R.; Khan, J.; Pradhan, K.; Roy, R.; Jana, N.R.; Jaisankar, P.; Ghosh, S. Design and Development of Benzothiazole-Based Fluorescent Probes for Selective Detection of Aβ Aggregates in Alzheimer’s Disease. ACS Chem. Neurosci. 2022, 13, 2503–2516. [Google Scholar] [CrossRef]
  18. Maiti, A.; Manna, S.K.; Halder, S.; Mandal, M.; Karak, A.; Banik, D.; Jana, K.; Mahapatra, A.K. A Benzothiazole-Based Dual Reaction Site Fluorescent Probe for the Selective Detection of Hydrazine in Water and Live Cells. Org. Biomol. Chem. 2022, 20, 4949–4963. [Google Scholar] [CrossRef]
  19. Kong, Y.; Wu, R.; Wang, X.; Qin, G.; Wu, F.; Wang, C.; Chen, M.; Wang, N.; Wang, Q.; Cao, D. Highly Sensitive Benzothiazole-Based Chemosensors for Detection and Bioimaging of Peroxynitrite in Living Cells. RSC Adv. 2022, 12, 27933–27939. [Google Scholar] [CrossRef]
  20. Hong, K.-I.; Kim, Y.; Lee, J.H.; Chu, K.H.; Jang, W.-D. Benzothiazole-Based Fluorescent Probe as a Simple and Effective Platform for Functional Mitochondria Imaging. Chem. Biomed. Imaging 2023, 1, 395–402. [Google Scholar] [CrossRef]
  21. Xia, Q.; Zhang, Y.; Li, Y.; Li, Y.; Li, Y.; Feng, Z.; Fan, X.; Qian, J.; Lin, H. A Historical Review of Aggregation-induced Emission from 2001 to 2020: A Bibliometric Analysis. Aggregate 2022, 3, e152. [Google Scholar] [CrossRef]
  22. Suman, G.R.; Pandey, M.; Chakravarthy, A.S.J. Review on New Horizons of Aggregation Induced Emission: From Design to Development. Mater. Chem. Front. 2021, 5, 1541–1584. [Google Scholar] [CrossRef]
  23. Mei, J.; Leung, N.L.C.; Kwok, R.T.K.; Lam, J.W.Y.; Tang, B.Z. Aggregation-Induced Emission: Together We Shine, United We Soar! Chem. Rev. 2015, 115, 11718–11940. [Google Scholar] [CrossRef] [PubMed]
  24. Hong, Y.; Lam, J.W.Y.; Tang, B.Z. Aggregation-Induced Emission. Chem. Soc. Rev. 2011, 40, 5361. [Google Scholar] [CrossRef]
  25. Naskar, B.; Dhara, A.; Maiti, D.K.; Kukułka, M.; Mitoraj, M.P.; Srebro-Hooper, M.; Prodhan, C.; Chaudhuri, K.; Goswami, S. Aggregation-Induced Emission-Based Sensing Platform for Selective Detection of Zn2+: Experimental and Theoretical Investigations. ChemPhysChem 2019, 20, 1630–1639. [Google Scholar] [CrossRef]
  26. Li, Z.; Chen, S.; Binder, W.H.; Zhu, J. Hydrogen-Bonded Polymer Nanomedicine with AIE Characteristic for Intelligent Cancer Therapy. ACS Macro. Lett. 2023, 12, 1384–1388. [Google Scholar] [CrossRef]
  27. Zeng, L.; Zhang, L.; Mao, L.; Hu, X.; Wei, Y.; Tan, L.; Chen, Y. AIE Molecules UV-Filtering Effect Improves the Photostability of Organic Solar Cells. Adv. Opt. Mater. 2022, 10, 2200968. [Google Scholar] [CrossRef]
  28. Balachandran, Y.L.; Jiang, X. Aggregation-Induced Fluorogens in Bio-Detection, Tumor Imaging, and Therapy: A Review. CCS Chem. 2022, 4, 420–436. [Google Scholar] [CrossRef]
  29. Rao Cheekatla, S.; Murale, D.P.; Gopala, L.; Lee, J. Sensing and Imaging Agents for Cyclooxygenase Enzyme. ChemMedChem 2024, e202400636. [Google Scholar] [CrossRef] [PubMed]
  30. Li, Y.; Zhong, H.; Huang, Y.; Zhao, R. Recent Advances in AIEgens for Metal Ion Biosensing and Bioimaging. Molecules 2019, 24, 4593. [Google Scholar] [CrossRef]
  31. Chakravarty, S.; Roy Chowdhury, S.; Mukherjee, S. AIE Materials for Cancer Cell Detection, Bioimaging and Theranostics. Prog. Mol. Biol. Transl. Sci. 2021, 185, 19–44. [Google Scholar] [PubMed]
  32. Goshisht, M.K.; Tripathi, N. Fluorescence-Based Sensors as an Emerging Tool for Anion Detection: Mechanism, Sensory Materials and Applications. J. Mater. Chem. C. Mater. 2021, 9, 9820–9850. [Google Scholar] [CrossRef]
  33. Xiao, H.; Zhang, W.; Li, P.; Zhang, W.; Wang, X.; Tang, B. Versatile Fluorescent Probes for Imaging the Superoxide Anion in Living Cells and in Vivo. Angew. Chem. Int. Ed. 2020, 59, 4216–4230. [Google Scholar] [CrossRef]
  34. Zhang, F.; Zhao, Y.; Chi, Y.; Ma, Y.; Jiang, T.; Wei, X.; Zhao, Q.; Shi, Z.; Shi, J. Novel Fluorescent Probes for the Fluoride Anion Based on Hydroxy-Substituted Perylene Tetra-(Alkoxycarbonyl) Derivatives. RSC Adv. 2018, 8, 14084–14091. [Google Scholar] [CrossRef] [PubMed]
  35. Gale, P.A.; Davis, J.T.; Quesada, R. Anion Transport and Supramolecular Medicinal Chemistry. Chem. Soc. Rev. 2017, 46, 2497–2519. [Google Scholar] [CrossRef] [PubMed]
  36. Liu, S.; Yang, D.; Liu, Y.; Pan, H.; Chen, H.; Qu, X.; Li, H. A Dual-Channel and Fast-Response Fluorescent Probe for Selective Detection of HClO and Its Applications in Live Cells. Sens. Actuators. B. Chem. 2019, 299, 126937. [Google Scholar] [CrossRef]
  37. Duke, R.M.; Veale, E.B.; Pfeffer, F.M.; Kruger, P.E.; Gunnlaugsson, T. Colorimetric and Fluorescent Anion Sensors: An Overview of Recent Developments in the Use of 1,8-Naphthalimide-Based Chemosensors. Chem. Soc. Rev. 2010, 39, 3936. [Google Scholar] [CrossRef]
  38. Wang, F.; Wang, L.; Chen, X.; Yoon, J. Recent Progress in the Development of Fluorometric and Colorimetric Chemosensors for Detection of Cyanide Ions. Chem. Soc. Rev. 2014, 43, 4312. [Google Scholar] [CrossRef]
  39. Peng, T.; Li, S.; Zhou, Y.; Liu, R.; Qu, J. Two Cyanoethylene-Based Fluorescence Probes for Highly Efficient Cyanide Detection and Practical Applications in Drinking Water and Living Cells. Talanta 2021, 234, 122615. [Google Scholar] [CrossRef]
  40. Yan, K.-C.; Steinbrueck, A.; Sedgwick, A.C.; James, T.D. Fluorescent Chemosensors for Ion and Molecule Recognition: The Next Chapter. Front. Sens. 2021, 2, 731928. [Google Scholar] [CrossRef]
  41. Wu, D.; Sedgwick, A.C.; Gunnlaugsson, T.; Akkaya, E.U.; Yoon, J.; James, T.D. Fluorescent Chemosensors: The Past, Present and Future. Chem. Soc. Rev. 2017, 46, 7105–7123. [Google Scholar] [CrossRef] [PubMed]
  42. Kumar, V.; Kim, H.; Pandey, B.; James, T.D.; Yoon, J.; Anslyn, E.V. Recent Advances in Fluorescent and Colorimetric Chemosensors for the Detection of Chemical Warfare Agents: A Legacy of the 21st Century. Chem. Soc. Rev. 2023, 52, 663–704. [Google Scholar] [CrossRef] [PubMed]
  43. Muhammad, M.; Khan, S.; Shehzadi, S.A.; Gul, Z.; Al-Saidi, H.M.; Waheed Kamran, A.; Alhumaydhi, F.A. Recent Advances in Colorimetric and Fluorescent Chemosensors Based on Thiourea Derivatives for Metallic Cations: A Review. Dye. Pigment. 2022, 205, 110477. [Google Scholar] [CrossRef]
  44. Torre, P.; Saavedra, L.; Caballero, J.; Quiroga, J.; Alzate-Morales, J.; Cabrera, M.; Trilleras, J. A Novel Class of Selective Acetylcholinesterase Inhibitors: Synthesis and Evaluation of (E)-2-(Benzo[d]Thiazol-2-Yl)-3-Heteroarylacrylonitriles. Molecules 2012, 17, 12072–12085. [Google Scholar] [CrossRef] [PubMed]
  45. De-la-Torre, P.; Osorio, E.; Alzate-Morales, J.H.; Caballero, J.; Trilleras, J.; Astudillo-Saavedra, L.; Brito, I.; Cárdenas, A.; Quiroga, J.; Gutiérrez, M. Ultrasound-Assisted Phase-Transfer Catalysis Method in an Aqueous Medium to Promote the Knoevenagel Reaction: Advantages over the Conventional and Microwave-Assisted Solvent-Free/Catalyst-Free Method. Ultrason. Sonochem. 2014, 21, 1666–1674. [Google Scholar] [CrossRef]
  46. Paramaguru, G.; Solomon, R.V.; Jagadeeswari, S.; Venuvanalingam, P.; Renganathan, R. Tuning the Photophysical Properties of 2-Quinolinone-Based Donor–Acceptor Molecules through N- versus O-Alkylation: Insights from Experimental and Theoretical Investigations. Eur. J. Org. Chem. 2014, 2014, 753–766. [Google Scholar] [CrossRef]
  47. Ganesan, P.; Chandiran, A.; Gao, P.; Rajalingam, R.; Grätzel, M.; Nazeeruddin, M.K. Molecular Engineering of 2-Quinolinone Based Anchoring Groups for Dye-Sensitized Solar Cells. J. Phys. Chem. C. 2014, 118, 16896–16903. [Google Scholar] [CrossRef]
  48. Lakowicz, J.R. Introduction to Fluorescence. In Principles of Fluorescence Spectroscopy; Lakowicz, J.R., Ed.; Springer US: Boston, MA, USA, 2006; pp. 1–26. ISBN 978-0-387-46312-4. [Google Scholar]
  49. Lakowicz, J.R. Solvent and Environmental Effects BT—Principles of Fluorescence Spectroscopy; Lakowicz, J.R., Ed.; Springer US: Boston, MA, USA, 2006. [Google Scholar]
  50. Mohd, Y.C.N.N.; Idris, A.; Zainal, A.Z.H.; Tajuddin, H.A.; Abdullah, Z. Intramolecular charge transfer-induced solvatochromism and large Stokes shifts of furocoumarins. Mater. Chem. Phys. 2022, 276, 125406. [Google Scholar] [CrossRef]
  51. Bakalska, R.; Todorova, M.; Sbirkova, H.; Shivachev, B.; Kolev, T. Comparing of the crystal structure and spectroscopic properties of some stilbazolium dyes with enlarged π-conjugated system I. Chromophores with p-dimethylamino group. Dye. Pigment. 2017, 136, 919–929. [Google Scholar] [CrossRef]
  52. Sachdeva, T.; Milton, M.D. AIEE Active Novel Red-Emitting D-π-A Phenothiazine Chalcones Displaying Large Stokes Shift, Solvatochromism and “Turn-on” Reversible Mechanofluorochromism. Dye. Pigment. 2020, 181, 108539. [Google Scholar] [CrossRef]
  53. Enbanathan, S.; Munusamy, S.; Ponnan, S.; Jothi, D.; Manoj Kumar, S.; Sathiyanarayanan, K.I. AIE Active Luminous Dye with a Triphenylamine Attached Benzothiazole Core as a Portable Polymer Film for Sensitively Detecting CN Ions in Food Samples. Talanta 2023, 264, 124726. [Google Scholar] [CrossRef] [PubMed]
  54. Das, P.; Kumar, A.; Chowdhury, A.; Mukherjee, P.S. Aggregation-Induced Emission and White Luminescence from a Combination of π-Conjugated Donor–Acceptor Organic Luminogens. ACS Omega 2018, 3, 13757–13771. [Google Scholar] [CrossRef] [PubMed]
  55. Bouali, W.; Yaman, M.; Seferoğlu, N.; Seferoğlu, Z. Colorimetric and Fluorimetric Detection of CN– Ion Using a Highly Selective and Sensitive Chemosensor Derived from Coumarin-Hydrazone. J Photochem. Photobiol. A Chem. 2024, 448, 115227. [Google Scholar] [CrossRef]
  56. WHO. Guidelines for Drinking-Water Quality Third Edition Incorporating The First And Second Addenda Volume 1 Recommendations Geneva 2008 WHO Library Cataloguing-in-Publication Data; WHO: Geneva, Switzerland, 2008; ISBN 9789241547611. [Google Scholar]
  57. Siddiqui, S.A.; Abdullah, M.M. Molecular Modeling and Simulation of Some Efficient Charge Transfer Materials Using Density Functional Theory. Mater Today Commun 2020, 22, 100788. [Google Scholar] [CrossRef]
  58. Palatinus, L.; Chapuis, G. SUPERFLIP—A Computer Program for the Solution of Crystal Structures by Charge Flipping in Arbitrary Dimensions. J. Appl. Crystallogr. 2007, 40, 786–790. [Google Scholar] [CrossRef]
  59. Sheldrick, G.M. SHELXT—Integrated Space-Group and Crystal-Structure Determination. Acta Crystallogr. A. Found Adv. 2015, 71, 3–8. [Google Scholar] [CrossRef]
  60. Dolomanov, O.V.; Bourhis, L.J.; Gildea, R.J.; Howard, J.A.K.; Puschmann, H. OLEX2: A Complete Structure Solution, Refinement and Analysis Program. J. Appl. Crystallogr. 2009, 42, 339–341. [Google Scholar] [CrossRef]
  61. Brandenburg, K.; Putz, H. Diamond-Crystal and Molecular Structure Visualization; Crystal Impact: Bonn, Germany, 2006. [Google Scholar]
  62. Macrae, C.F.; Bruno, I.J.; Chisholm, J.A.; Edgington, P.R.; McCabe, P.; Pidcock, E.; Rodriguez-Monge, L.; Taylor, R.; van de Streek, J.; Wood, P.A. Mercury CSD 2.0—New Features for the Visualization and Investigation of Crystal Structures. J. Appl. Crystallogr. 2008, 41, 466–470. [Google Scholar] [CrossRef]
Scheme 1. Synthesis and structures of compounds 6a–c.
Ijms 25 12896 sch001
Figure 1. Ellipsoid diagram representation with 50% displacement probability for compound 6c.
Ijms 25 12896 g001
Figure 2. Supramolecular (a) C-H∙∙∙O and (b) π∙∙∙π interactions presented in the crystal packing of compound 6c. The C∙∙∙O and π∙∙∙π distances are shown.
Ijms 25 12896 g002
Figure 3. Absorption spectra of (a) 6a, (b) 6b, and (c) 6c in different solvents (THF, DCM, DMF, ACN and EtOH).
Ijms 25 12896 g003
Figure 4. Emission (ac) and normalized emission spectra (df) of compounds 6a–c.
Ijms 25 12896 g004
Figure 5. Emission spectra of compounds (a) 6a, (b) 6b, and (c) 6c, and plots of emission intensity vs. water fraction (fw%), (d) 6a, (e) 6b, and (f) 6c, in THF/H2O mixtures from 0 up to 90% of water.
Ijms 25 12896 g005
Figure 6. Absorption spectra of (a) 6a, (b) 6b, and (c) 6c in a mixture of DMSO/water of 8:2 at 50 µM with 10 eq of ions CH3CO2, Cl, CN, CO32−, PO43−, I, F, NO2, NO3, HCO3, SCN, and SO42− in a pH 7 buffer solution.
Ijms 25 12896 g006
Figure 7. Emission spectra of (a) 6a, (b) 6b, and (c) 6c in a mixture of DMSO/water 8:2 at 50 µM with 10 eq of ions CH3CO2, Cl, CN, CO32−, PO43−, I, F, NO2, NO3, HCO3, SCN y SO42− in a pH 7 buffer solution.
Ijms 25 12896 g007
Figure 8. Nucleophilic addition reaction of compound 6b in presence of cyanide ion.
Ijms 25 12896 g008
Figure 9. Fluorescence titration spectra of (a) 6a, (b) 6b, and (c) 6c upon the increasing amounts of CN (0–20 equiv.).
Ijms 25 12896 g009
Figure 10. Selectivity test of probes (a) 6a, (b) 6b, and (c) 6c in a DMSO:water mixture 8:2 at 50 µM with 10 eq of ions CH3CO2−, Cl, CO32−, PO43−, I, F, NO2, NO3, HCO3, SCN, and SO42− black bar and with CN ion red bar, in buffer solutions, at pH 7.
Ijms 25 12896 g010
Figure 11. Optimal structures and electronic densities of HOMO and LUMO for compounds 6a–c (left) and the 6a–c + CN system (right).
Ijms 25 12896 g011
Table 1. Spectroscopic properties of compounds 6a, 6b, and 6c at 5 µM in different solvents.
Comp.6a6b6c
Solvents Abs, nm
(ε/M−1cm−1)
Em, nmStokes Shift nm
(cm−1)
Abs, nm
(ε/M−1cm−1)
Em, nmStokes Shift nm (cm−1)Abs, nm
(ε/M−1cm−1)
Em, nmStokes Shift nm
(cm−1)
THF441
(12,600)
563122
(4913)
431
(24,140)
52998
(4298)
464 (26,380)55389
(3468)
DCM438
(11,700)
563125
(5069)
422
(19,360)
51290
(4165)
456 (31,340)556100
(3944)
DMF454
(20,240)
590136
(5077)
442
(35,720)
53593
(3932)
473 (27,480)576103
(3780)
ACN433
(13,880)
584151
(5971)
419
(15,760)
532113
(5069)
449 (12,500)572123
(4789)
EtOH438
(7620)
578140
(5530)
418
(15,760)
528110
(4984)
445
(7040)
565120
(4772)
Disclaimer/Publisher’s Note: The statements, opinions and data contained in all publications are solely those of the individual author(s) and contributor(s) and not of MDPI and/or the editor(s). MDPI and/or the editor(s) disclaim responsibility for any injury to people or property resulting from any ideas, methods, instructions or products referred to in the content.

