Abstract
The accurate determination of acid/base constants (proton dissociation constants—pKa, or equivalently protonation constants—logK) is essential for the physicochemical characterization of new molecules, especially in drug design and development, as these parameters thoroughly influence the pharmacokinetics and pharmacodynamics of drug action. While pH/potentiometric titration remains the gold standard method for determining acid/base constants, spectroscopic techniques—particularly nuclear magnetic resonance spectroscopy (as NMR/pH titrations)—have emerged as powerful alternatives for specific challenges in analytical chemistry, providing also information on the structure and site of protonation. In this study, we performed a comprehensive meta-analysis of protonation constants reported in the literature, measured using both potentiometry and NMR titrations. Our analysis compiled the available literature data and assessed the agreement between the two methods, taking into consideration various experimental conditions, such as temperature and ionic strength. The results provide insights into the reliability and applicability of NMR titrations compared with potentiometry, offering guidance for selecting appropriate methodologies in drug design.
1. Introduction
The acid dissociation constant, Ka, and its negative logarithm, pKa, are among the most frequently determined physicochemical parameters. Concerning its several applications, it is crucial in the pharmacokinetic properties of a drug, affecting the absorption and thus bioavailability. The definitions related to acid/base processes and pH [1] can be derived from the equilibrium dissociation of a proton (H+) from any species, characterized by the acid dissociation constant (Ka):
where the square brackets denote molar concentration, ‘A’ is the species undergoing proton dissociation with charge q. Acid/base constants can be determined by several methods, including pH/potentiometry, which is considered to be the standard one. Other pH titrations combined with a spectrometric (e.g., UV, CD, IR, or NMR) or a separation technique (e.g., HPLC, electrophoresis, or CE), or electrochemical methods (e.g., conductometry or voltammetry), can also be used [2]. Potentiometry is based on the measurement of the activity of the hydrogen ions (protons) in a solution of known acid/base ratio of the compounds, and the pH is usually monitored by a combined glass electrode [3]. Potentiometry is useful for pKa determination (usually in the 2–12 pH range) in aqueous media if the compound is soluble and stable; note that in this work we focus only on aqueous media; methods using cosolvents are not discussed. If solubility/sample purity does not allow for potentiometry, pH titration with spectrometric methods that are more sensitive/afford selective signals on the ionizable group may be preferential [4].
NMR/pH titrations for the determination of acid/base constants have the benefit (compared with most spectroscopy titrations) of high selectivity in the spectrum; i.e., with sufficient measurement time and resolution, the signals of the compound of interest can be observed even if impurities are present in the sample, as long as at least one reporter signal of the analyte can be observed throughout the titration. The high resolution in NMR potentially also affords atom-specific information on the degree of perturbation caused by ionization, or even protonation-induced conformational changes can also be inferred [5]. The obvious drawback of NMR-based titrations is the expensive instrumentation that is required, compared with the fast, inexpensive, and automated methods of potentiometry and even UV spectroscopy-based titrations. A comparison of practical aspects of pH/potentiometry and NMR/pH titrations is presented in Table 1 [6]. For many cases, it has been reported that there is excellent agreement between NMR- and potentiometry-based values [7]; however, in this work we aim to extend the systematic literature review of available acid dissociation constants and perform a statistically sound analysis of agreement between the two analytical methods.

Table 1.
Comparison of potentiometry and NMR spectroscopy-based determination of acid/base constants in aqueous solutions.
2. Materials and Methods
2.1. Data Collection
Data for this study were systematically collected from existing literature using a comprehensive search strategy. We utilized multiple academic databases, e.g., Reaxys and PubChem (including the database of Critical Stability Constants [9,10]), to identify relevant peer-reviewed articles, conference papers, and reviews. Inclusion criteria were established to select studies that provided quantitative data with acceptable quality pertinent to our research questions. Inclusion criteria were the appropriate description of experimental design and method from which the exact method of determination could be inferred. Unfortunately, many instances of literature papers do not report the uncertainty of determination (standard error or standard deviation); however, in the mixed-effects model, the standard error of the values was not incorporated directly in the model, since it is apparent from the distribution standard errors that an appropriate variance weight function can be used, i.e., a lack of standard error was not considered as an exclusion criterion. The collected data were screened independently by two researchers to confirm eligibility. The variables recorded from the literature were the name of the compound, the value of the acid/base constant, the standard error of measurement (where available), and two experimental conditions: temperature and ionic strength. All values used pertain to aqueous (or, in the case of NMR measurements, 5–10% D2O) solutions.
2.2. Statistical Analysis and Mathematical Calculations
The data analysis was conducted using the R programming language (R version 4.0.5 (R Foundation for Statistical Computing, Vienna, Austria) [11] and the R Studio integrated development environment (Posit, Boston, MA, USA). Visualization of the results was performed using R Studio software (version 30.4.0). Bland–Altman analysis was performed based on the original publication [12]. The mixed-effects model was built using the ‘nlme’ package [13], while cheminformatics data were manipulated using the ‘ChemmineR’ package [14]. See the R script in the Supporting Information for all packages and functions used.
3. Results
The observed variables and the full dataset can be found in the Supporting Information section. The compiled data table contains 417 records of 112 compounds coming from 43 studies [7,15,16,17,18,19,20,21,22,23,24,25,26,27,28,29,30,31,32,33,34,35,36,37,38,39,40,41,42,43,44,45,46,47,48,49,50,51,52,53,54,55,56]; 125 records had standard error values missing, while 74% of measurements were conducted at 25 °C and 0.15 mol/L ionic strength (which is considered the standard condition for potentiometric titrations). Potentiometric titrations were difference titrations (carried out in the absence and presence of the analyte), while NMR titrations utilized 1H reporter signals. A sample section of the data table can be found in Table 2 with the example of oxidized glutathione (glutathione disulfide, GSSG).
Table 2.
Example from the compiled data table (restructured to wide arrangement) of acid/base constants determined with both pH/potentiometry and NMR/pH titration.
The pairs plot of selected variables is shown in Figure 1, revealing relationships or lack thereof between some variables. Notably, there seems to be considerable difference neither in location nor in scale between pKa values and their standard errors among the two methods (see plots in column 4, rows 2 and 3).
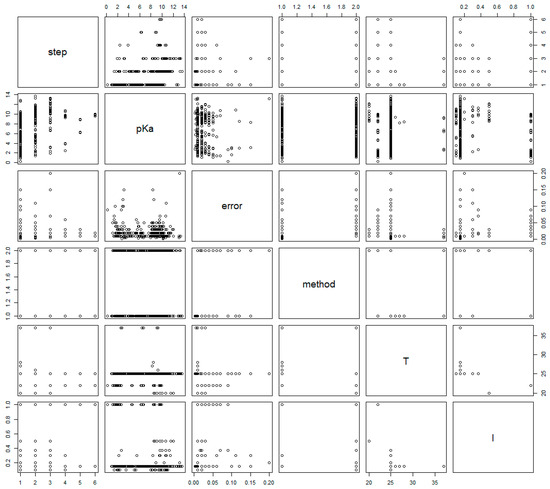
Figure 1.
Pairs plot of selected variables. Note that methods ‘1’ and ‘2’ are used to denote ‘NMR’ and ‘Pot,’ respectively.
The observed values of pKa are depicted in a histogram in Figure 2 to reveal the distribution of acid dissociation constants that are present in the dataset. The standard errors of the acid dissociation constants reported in the literature are also shown on a histogram to reveal an exponential distribution. Note that the practical lower limit of pKa determination is on the order of 0.01 (the most common value in the dataset) due to the capability of the combined glass electrode [55].

Figure 2.
Left: the smoothed frequency histogram of pKa values depicted for the acid/base/amphoteric moieties, with a multimodal empirical distribution. Right: the density histogram of the standard error of pKa values is an exponential empirical distribution; the exponential theoretical distribution calculated from the mean (red line) and standard deviation (green line) of the error values, respectively, are also shown.
The Bland–Altman plot of pKa values is shown in Figure 3 to reveal the difference between the two methods of determination. The differences between NMR-determined values and potentiometry-determined values are shown for each pKa on the y-axis, and the mean of the determined values by the two methods is shown on the x-axis. Note that the difference (NMR−Pot) is merely performed in alphabetical order and is not meant to represent NMR being the reference method from which the deviance of potentiometry is observed, i.e., in this model both methods are treated as being estimates of the same true value. Were the opposite differences (i.e., Pot−NMR) calculated, the Bland–Altman plot would be the same only inverted on the x-axis. The solid red line is the mean of all differences, which should lie on the 0 horizontal line (dashed grey line) if the methods are in complete agreement. However, a deviation of the mean difference (towards the positive in this case) shows signs of bias, which in this case translated to NMR-determined pKa values tending to be on average somewhat greater (by 0.056 log units) than the potentiometry-determined values of the same proton association step. Dashed red lines show the 95% limits of agreement of the difference values, calculated from the variance of the data points. Two methods are considered to be in agreement (i.e., can be used interchangeably) if the limits of agreement fall within scientifically relevant/important bounds of equivalence. This bound is determined a priori; for acid/base titrations with conventional methods, a scientifically accepted value is 0.2 log units [57] and is shown with solid blue lines for reference on the Bland–Altman plot (Figure 3). Bias is indicative of systematic error, while variance is characteristic of random error. The Bland–Altman plot also reveals some serious outliers, typically when extreme pKa values were measured; therefore, this analysis was repeated after these outliers were trimmed from the data. It is also noteworthy that the most commonly used method for measuring method agreement, correlation of the measured value with the two methods, is not recommended by statisticians, since it can be misleading and measures the degree of association, not agreement.

Figure 3.
The Bland–Altman plot of pKa values determined with the two methods: potentiometry and NMR; on the y-axis, the difference: NMR-determined values minus potentiometry-determined values. The outlier pKa values are identified with text labels (compound and protonation step). The 95% limits of agreement are at dashed lines, while the 95% confidence interval of the bias is depicted with shaded areas. Bounds of scientifically important differences are shown with solid blue lines.
After removing the outlier data points as shown in Figure 3, an updated Bland–Altman plot is achieved in Figure 4 with somewhat lower bias (0.042 log units) and standard deviation of difference values. In the updated Bland–Altman plot, three variants are shown. In the first case we also sought to depict pKa values that stem from overlapping dissociation steps with red circles, while non-overlapping pKa values (or monoprotic values) are with black circles, in order to assess whether overlapping proton dissociation causes any bias between the two methods. On visual inspection, there seems to be no greater bias on the pKa values of overlapping proton dissociation. However, a slight trend is observed with greater positive bias associated with higher pKa values, and vice versa, more negative bias is associated with lower pKa values. A simple linear regression performed on the trimmed Bland–Altman data reveals a slope significantly different from 0 (p-value: < 0.0001), albeit with a rather weak degree of association (slope: 0.019, std. error: 0.004, adj. R2: 0.101). In the second variant, the data points are colored depending on whether the moiety in question has acidic or basic character (i.e., upon dissociation, the charge of the moiety changes from neutral to negative—acidic moiety—or from positive to neutral—basic moiety). Amphoteric character is assigned to pKa values where overlapping dissociation of two moieties with opposite acid/base character occurs (e.g., in morphine); note that these values could only be unequivocally assigned to a single moiety if the values were microscopic constants. It can be seen that mostly the different acid/base characters cluster on the two ends of the pKa scale, and basic moieties have a much wider scattering. It is also noteworthy that the biases of acidic and basic moieties are close to the 0 horizontal line (positioned on the opposite sides), and thus it is the bias attributed to mixed moieties (and the fact that there are more acidic moieties in the dataset) that causes the overall bias towards NMR. On the other hand, the scattering of mixed moieties is the smallest. In the third variant of the Bland–Altman plot, data points are colored according to the method of pH determination during NMR/pH titrations (as this was different among the literature). The highly accurate in situ pH indicators are considered to be reliable even at extreme pH values, while sometimes the conventional combined glass electrode is used for pH measurement before the NMR spectrum recording. It is apparent from this figure that most of the variance with indicator pH measurement occurs at the two ends of the pKa scale (below 2.5 and above 8.5). On both sides of the pKa scale, this variance is directed upwards from the 0 horizontal line, resulting in a larger bias towards NMR compared with the overall dataset. The bias of electrode pH determination is very close to zero (as would be expected, since both methods now use the same principle for pH determination); however, the linear trend of differences vs. the expected value of pKa is now more pronounced (slope: 0.027, std. error: 0.008, adj. R2: 0.13).

Figure 4.
The Bland–Altman plot of pKa values with outliers removed. On the top, values from overlapping protonation are shown with red circles; two successive protonation steps were considered overlapping if their difference was below 2 pKa units. The bias and 95% limits of agreement of the entire dataset are shown in red for reference, together with the bounds of scientifically important differences with solid blue lines. On the bottom left, values from the acidic/basic/amphoteric moieties are shown in color together with their bias and 95% limits of agreement. On the bottom right, values of the two pH measurement techniques during NMR titrations are shown in color together with their bias and 95% limits of agreement. The bias and 95% limits of agreement of the entire dataset are shown in red for reference.
In order to examine whether the difference between the two methods follows a normal distribution, the histogram and Q-Q plot of difference values are depicted in Figure 5. Both plots show a somewhat left-skewed distribution; however, the histogram appears symmetrically positioned at zero value, with lower extreme values being somewhat more frequent than extreme larger values.
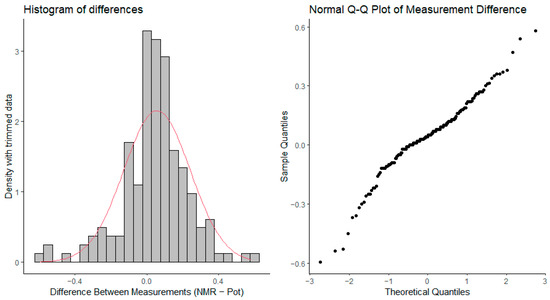
Figure 5.
Left: the density histogram of pKa difference values from the trimmed data of Figure 4, together with the theoretical normal distribution of the same mean and variance in red. Right: the Q-Q plot of pKa difference values from the trimmed data.
In order to quantify the effect of the determination method, taking into account the correlating nature of pKa values within the same compound, a mixed-effects model was fitted to the entire dataset (without trimming) with the following formula:
The above (original) mixed-effects model assumes a correlation structure between the acid/base constants within the same compound in a random intercept setting: pKa,ij is the determined value of compound i at step j; β0 is the mean value of NMR derived values; u0 is the mean deviation of the NMR derived values of compound i; β1 is the mean effect of potentiometry; ui is the mean deviation of the effect of potentiometry on compound i; uij is the mean deviation of the effect of potentiometry on protonation step j of compound i; methodij is the indicator variable (0 for potentiometry and 1 for NMR, i.e., potentiometry is considered as the reference level to be congruent with the director of differences used in the Bland–Altman analysis); ϵij is the random error term. The matrix u = (u0, ui, uij)T is assumed to have a multivariate normal distribution with a mean vector of (0, 0, 0)T and covariance matrix G and is independent from ϵij, which is assumed to have a normal distribution with a mean value of 0 and variance σ2. This original model affords a 0.062 coefficient for the difference between potentiometry and NMR methods (close to the 0.056 difference in the Bland–Altman plot for the NMR/potentiometry method difference), and this difference is significant at the 5% level (p-value: 0.0044). The above mixed-effects model was then extended to model the variance structure, i.e., taking into account that the standard error of pKa values depends on the pKa value itself (hence the outliers observed in Figure 3), an observation that can also be made in the pairs plot of Figure 1: column 2, row 3, the plot shows an increasing standard error for extremely low and extremely high pKa values, which is characteristic of combined glass electrode measurement error. In the extended model, therefore, an exponential variance weight function was applied. The output of the above two models is presented in Table 3. The extended model affords a 0.041 coefficient for the difference between potentiometry and NMR methods (in agreement with the 0.042 difference in the Bland–Altman plot, Figure 4), and this difference is now barely significant at the 5% level (p-value: 0.0512). The diagnostic figures of the two models are shown in Figure 6, revealing a slight improvement in variance homogeneity in the extended model. The likelihood-ratio ANOVA test between the two models shows a significant difference (likelihood-ratio test: 7.1636, p-value: 0.0074).
Table 3.
The output of the original and extended mixed-effects models.
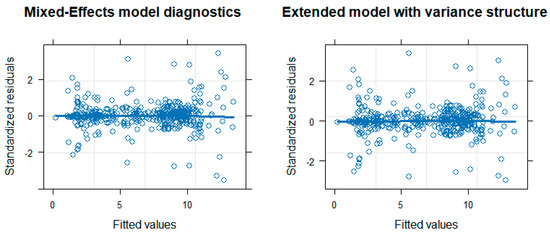
Figure 6.
Diagnostic figure of the original mixed-effects model (left) and the extended mixed-effects model (right).
In order to gauge the effect of measurement parameters (ionic strength, temperature), the above mixed-effects models were extended in their fixed effects by these variables in interaction with the titration method. No significant effects were observed for any interaction terms, and then, based on standard model selection procedures, the non-significant interaction terms followed by the main effect terms were removed until no significant effects remained from ionic strength and temperature. Furthermore, in the Bland–Altman plot of the trimmed data, it was examined whether data points were affected by a differing temperature or ionic strength condition when determined with the two different titration methods; however, the number of such data was small, and there was no observable trend with respect to this comparison. These results can be reproduced using the R code in the Supporting Information.
In order to assess the heterogeneity of the molecular structures in the dataset, the occurrence of functional groups (listed in Table 4) and atom frequency (Figure 7) were quantified. The structural compound descriptors were then clustered based on their pairwise distances. This results in a multi-dimensional scaling plot similar to hierarchical clustering visualized in Figure 7. The distribution of acidic/basic/mixed moieties was 76, 42, and 46 (46%, 26%, and 28%). The Tanimoto coefficient of the dataset was measured against the FDA-approved drugs, which afforded 18%.
Table 4.
The occurrence (in percentage) of functional groups and rings in the compounds of the dataset.

Figure 7.
On the left: the atom frequency in the compounds of the dataset. On the right: the multi-dimensional scaling plot of the compounds after clustering using the Tanimoto distances.
4. Discussion
The comparison of protonation, or equivalently, acid dissociation constants (pKa values) obtained by pH/potentiometry and NMR/pH has revealed important insights into the performance and bias of each method. The analysis of 425 records from 114 compounds demonstrated that these methods provide comparable results; some systematic and random errors, however, persist, particularly for compounds of extreme pKa values.
4.1. Agreement Between Methods
The Bland–Altman analysis (Figure 3) revealed a small but systematic bias, with NMR-determined pKa values tending to be higher than those obtained via potentiometry, with an average difference of 0.056 log units. This bias implies that NMR may slightly overestimate or potentiometry may underestimate acid/base constants. Importantly, the standard deviation of differences also indicated a degree of random error between the methods, which was more pronounced in certain cases, such as the catecholamines, where outlier behavior was observed.
Upon removal of outliers (Figure 4), the bias was reduced to 0.042 log units, and the variance of differences also decreased, confirming that extreme pKa values—particularly those associated with certain chemical classes—had a significant impact on the observed differences between the two methods. One class of chemical moieties that suffers from measurement error during potentiometry is the phenolic hydroxyl group in catecholamines, as they are very sensitive to both oxidation and alkaline pH. While the decomposition or chemical transformation of sensitive compounds hinders potentiometric titrations, NMR measurements remain unaffected as long as the reported signals of the analyte can be monitored. A weak but statistically significant linear trend found after outlier removal suggests that larger pKa values tend to show more positive bias, while smaller pKa values exhibit a negative bias; this trend is more pronounced if the pH was measured during NMR titrations with a combined glass electrode (the same as in pH/potentiometric titrations). This indicates that the magnitude of pKa might influence the direction of bias between NMR and potentiometry if the method of pH determination is identical. When in situ pH indicators are used, this trend becomes less apparent; however, the large scattering of method differences at the pKa extremes still remains. One source of the apparent trend in the differences could be the clustering of acidic moieties on the lower pKa range, while basic moieties lie on the higher end of the pKa scale. Another obvious source of method disagreement is the acidic/alkaline error of glass electrodes. Due to the many factors affecting the accuracy of pH readings with glass electrodes, it is apparent that a controlled environment (e.g., temperature control and inert atmosphere) is crucial for pH/potentiometric titrations in order to show good agreement with other methods, such as NMR/pH titrations with in situ indicators, where the temperature-controlled environment in the NMR probe is a given. One other source of the trend in method differences vs. pKa values could be a statistical artifact. When a simulation is performed to model the measurement uncertainties inherent to the two methods in question, it is clear that when fitting a non-linear curve to a titration dataset in which the ends of the pH scale are burdened with greater uncertainty compared with the intermediate pH range, the estimates of the regression will overestimate low pKa values and underestimate high pKa values. In the simulation, the uncertainty pertaining to chemical shift readings and volume differences in NMR and potentiometry titrations, respectively, was modeled by adding noise sampled from normal distributions of different variances. The results of the simulation are presented in Figure 8; the R code of the simulation can be found in the Supporting Information.

Figure 8.
On the left, three representative NMR titration curves with simulated low, medium, and high pKa values; the simulated value is depicted as the ’real’ value, and after modeling the measurement uncertainties inherent to both methods, the fitted values and their difference are also depicted. On the right, a simulation of 300 pKa values from a uniform distribution afforded a Bland–Altman plot, in which the bias trend vs. pKa can be observed.
4.2. Error Distribution and Methodological Differences
Histograms and Q-Q plots of the difference values (Figure 5) showed a left-skewed distribution, although the differences appeared symmetrically centered around zero. This observation, combined with the Bland–Altman plots, indicates that while the methods are generally in agreement, NMR may introduce slightly larger errors, especially at the extremes of the pKa range. The skewed nature of the distribution could be attributed to measurement noise or instrument limitations, particularly in potentiometry, where combined glass electrode accuracy may degrade at very low or high pKa values.
Moreover, the exponential distribution of the standard errors (Figure 2) aligns with the expectation that measurement errors increase at extreme pKa values. This was supported by the pairs plot (Figure 1), where the increase in standard error at both ends of the pKa scale was evident. Such behavior is characteristic of potentiometric measurements due to electrode limitations, suggesting that at very low or high pKa values, NMR may outperform potentiometry in precision, despite the observed bias. Upon inspection of the pKa errors reported, grouped by acid/base moieties, no considerable differences were observed (see Supporting Information).
4.3. Mixed-Effects Models
The mixed-effects models provided a more robust framework for assessing the impact of method choice on pKa determination while accounting for the inherent correlation between multiple proton dissociation steps within the same compound. The original model estimated a significant (albeit scientifically unimportant) difference between the two methods (0.062 log units, p-value: 0.0044), consistent with the findings of the Bland–Altman plot. However, after adjusting for variance heterogeneity (which was particularly evident in compounds with extreme pKa values), the extended mixed-effects model yielded a smaller and non-significant difference (0.041 log units, p-value: 0.0512). This suggests that much of the bias can be attributed to variance-related issues in the data, particularly those arising from potentiometric measurement errors at extreme pKa values.
4.4. Implications and Limitations
While both NMR and potentiometry are widely accepted methods to determine acid/base constants, this study highlights subtle differences in their performance, particularly when analyzing compounds with very high or low pKa values. This comparison extends the work conducted by Bezençon et al. [7], where these two methods were compared by regression and correlation analysis only; the conclusions remain the same; however, as good agreement is found between the two methods. The overestimation of pKa by NMR could be due to method-specific factors such as its sensitivity to overlapping proton dissociation steps, as suggested by the visual inspection of the Bland–Altman plots (Figure 4). However, no significant bias was observed for overlapping proton dissociation steps when these were isolated in the trimmed dataset.
Additionally, no significant interaction effects were observed between the method and measurement parameters such as temperature or ionic strength, suggesting that the bias between methods is relatively stable across different experimental conditions. Nonetheless, the weak correlation between bias and pKa values suggests that further refinement in measurement techniques could help minimize these discrepancies. Finally, while outliers were identified and removed in the Bland–Altman analysis, the presence of such extreme values—particularly in catecholamines—indicates that careful attention should be paid to certain chemical classes that may introduce greater variability in pKa determination. For instance, the outliers observable in Figure 3 reveal that extremely basic moieties like the fully deprotonated catechol ring are prone not only to the alkaline error but are also exposed to oxidation by air; therefore, potentiometric titration is a suboptimal choice. Other groups that are easily oxidized (e.g., selenols and thiols in selenocysteine or cysteine) are also sensitive to air, and therefore NMR is more suitable to track the reporter protons of the analyte, excluding therefore the perturbing effects of the oxidation product. Other characteristic extreme pKa values pertaining to strong carboxylic acids or strong basic moieties (e.g., the guanidino group in arginine or amino groups in polyamines) require careful consideration of the method chosen for pKa determination. Future studies could benefit from exploring the molecular properties that contribute to such outliers and developing method-specific correction factors or adjustments.
5. Conclusions
NMR and potentiometry generally provide consistent acid/base constant measurements; the systematic slight overestimation of NMR-derived pKa values compared with pH/potentiometry is not scientifically relevant; however, the large variance between the two methods results in limits of agreement exceeding the bounds of what would be methodologically acceptable (these limits of agreement come close to the acceptable bounds when only NMR titrations with in situ pH indicators are considered). This bias is further diminished when accounting for variance structures, particularly in compounds with extreme pKa values. No significant effects of experimental conditions (temperature, ionic strength) were observed, suggesting that these methods are sufficiently robust across a range of experimental setups. Future work should focus on reducing measurement errors, particularly for compounds with extreme pKa values, to further harmonize results between these two methods. With these insights in mind, NMR remains a powerful tool for determining acid dissociation/protonation constants, even when high-accuracy data are required. In fact, outside the pKa range of 2–10, the use of NMR titration with in situ pH indicators is preferable. In the intermediate pKa range, the two methods can be used interchangeably.
Supplementary Materials
The following supporting information can be downloaded at: https://www.mdpi.com/article/10.3390/ijms252312727/s1.
Author Contributions
Conceptualization, T.P. and A.M.; Methodology, K.M. and A.M.; Software, A.M.; Formal Analysis, T.P., D.M.A. and A.M.; Data Curation, D.M.A. and A.M.; Writing—Original Draft Preparation, T.P., D.M.A. and A.M.; Writing—Review and Editing, K.M., G.T.B. and B.N.; Visualization, A.M.; Project Administration, G.T.B., B.N. and A.M.; Funding Acquisition, T.P., G.T.B., B.N. and A.M. All authors have read and agreed to the published version of the manuscript.
Funding
The grant of the Higher Education Institutional Excellence Programme within the Framework of the Molecular Biology Thematic Programme of Semmelweis University (TKP2021-EGA-24) and the ÚNKP-23-5-SE-1 New National Excellence Program of the Ministry for Culture and Innovation from the source of the National Research, Development and Innovation Fund, and the János Bolyai Research Scholarship of the Hungarian Academy of Sciences is appreciated by A. Mirzahosseini. The authors are supported by the EKÖP-2024-61 New National Excellence Program of the Ministry for Culture and Innovation from the source of the National Research, Development and Innovation Fund.
Conflicts of Interest
The authors declare no conflicts of interest.
References
- Bates, R.G.; Popovych, O. The Modern Meaning of pH; Taylor & Francis: London, UK, 1981. [Google Scholar]
- Han, G.E.; Priefer, R. A systematic review of various pKa determination techniques. Int. J. Pharm. 2023, 635, 122783. [Google Scholar] [CrossRef] [PubMed]
- Subirats, X.; Fuguet, E.; Rosés, M.; Bosch, E.; Ràfols, C. Methods for pKa Determination (I): Potentiometry, spectrophotometry, and capillary electrophoresis. In Reference Module in Chemistry, Molecular Sciences and Chemical Engineering; Elsevier: Waltham, MA, USA, 2015; pp. 1–10. [Google Scholar]
- Cookson, R. Determination of acidity constants. Chem. Rev. 1974, 74, 5–28. [Google Scholar] [CrossRef]
- Gift, A.D.; Stewart, S.M.; Bokashanga, P.K. Experimental determination of p K a values by use of NMR chemical shifts, revisited. J. Chem. Educ. 2012, 89, 1458–1460. [Google Scholar] [CrossRef]
- Reijenga, J.; Van Hoof, A.; Van Loon, A.; Teunissen, B. Development of methods for the determination of pKa values. Anal. Chem. Insights 2013, 8, ACI-S12304. [Google Scholar] [CrossRef] [PubMed]
- Bezençon, J.; Wittwer, M.B.; Cutting, B.; Smieško, M.; Wagner, B.; Kansy, M.; Ernst, B. pKa determination by 1H NMR spectroscopy–An old methodology revisited. J. Pharm. Biomed. Anal. 2014, 93, 147–155. [Google Scholar] [CrossRef]
- Orgován, G.; Noszál, B. Electrodeless, accurate pH determination in highly basic media using a new set of 1H NMR pH indicators. J. Pharm. Biomed. Anal. 2011, 54, 958–964. [Google Scholar] [CrossRef]
- Martell, A. Critical Stability Constants: Volume 2: Amines; Springer Science & Business Media: Berlin/Heidelberg, Germany, 2012. [Google Scholar]
- Smith, R.M.; Martell, A.E. Critical Stability Constants: Volume 2: Amines; Springer: Berlin/Heidelberg, Germany, 1975. [Google Scholar]
- R Core Team. R: A Language and Environment for Statistical Computing; R Foundation for Statistical Computing: Vienna, Austria, 2021. [Google Scholar]
- Bland, J.M.; Altman, D.G. Statistical methods for assessing agreement between two methods of clinical measurement. Int. J. Nurs. Stud. 2010, 47, 931–936. [Google Scholar] [CrossRef]
- Pinheiro, J.C.; Bates, D.M. Mixed-Effects Models in S and S-PLUS. doi:10.1007/b98882; Springer Science & Business Media: New York, NY, USA, 2000. [Google Scholar]
- Cao, Y.; Charisi, A.; Cheng, L.-C.; Jiang, T.; Girke, T. ChemmineR: A compound mining framework for R. Bioinformatics 2008, 24, 1733–1734. [Google Scholar] [CrossRef]
- Altun, Y. Study of solvent composition effects on the protonation equilibria of various anilines by multiple linear regression and factor analysis applied to the correlation between protonation constants and solvatochromic parameters in ethanol–water mixed solvents. J. Solut. Chem. 2004, 33, 479–497. [Google Scholar] [CrossRef]
- Arash, M.; Tamás, P.; Gábor, O.; Gergő, T.; Béla, N. Dopamine: Acid-base properties and membrane penetration capacity. J. Pharm. Biomed. Anal. 2018, 158, 346–350. [Google Scholar]
- Arnold, A.P.; Canty, A.J. Methylmercury (II) sulfhydryl interactions. Potentiometric determination of the formation constants for complexation of methylmercury (II) by sulfhydryl containing amino acids and related molecules, including glutathione. Can. J. Chem. 1983, 61, 1428–1434. [Google Scholar] [CrossRef]
- Arnold, A.P.; Tan, K.S.; Rabenstein, D.L. Nuclear magnetic resonance studies of the solution chemistry of metal complexes. 23. Complexation of methylmercury by selenohydryl-containing amino acids and related molecules. Inorg. Chem. 1986, 25, 2433–2437. [Google Scholar] [CrossRef]
- Boros, M.; Kökösi, J.; Vámos, J.; Noszál, B. Complete resolution of the microscopic protonation equilibria of N-methyl-d-aspartic acid and related compounds. J. Pharm. Biomed. Anal. 2007, 43, 1306–1314. [Google Scholar] [CrossRef] [PubMed]
- Brandt, W.W.; Gullstrom, D.K. Studies on Some Ferrous Complexes of Substituted 1, 10-Phenanthrolines1. J. Am. Chem. Soc. 1952, 74, 3532–3535. [Google Scholar] [CrossRef]
- Bruice, T.C.; Schmir, G.L. Imidazole catalysis. II. The reaction of substituted imidazoles with phenyl acetates in aqueous solution. J. Am. Chem. Soc. 1958, 80, 148–156. [Google Scholar] [CrossRef]
- Dawson, R.M.C.; Elliott, D.C.; Elliott, W.H.; Jones, K.M. Data for Biochemical Research; Clarendon Press: Oxford, UK, 1959; Volume 13. [Google Scholar]
- Grgas-Kužnar, B.; Simeon, V.; Weber, O. Complexes of adrenaline and related compounds with Ni2+, Cu2+, Zn2+, Cd2+ and Pb2+. J. Inorg. Nucl. Chem. 1974, 36, 2151–2154. [Google Scholar] [CrossRef]
- Hounslow, A.M.; Carran, J.; Brown, R.J.; Rejman, D.; Blackburn, G.M.; Watts, D.J. Determination of the microscopic equilibrium dissociation constants for risedronate and its analogues reveals two distinct roles for the nitrogen atom in nitrogen-containing bisphosphonate drugs. J. Med. Chem. 2008, 51, 4170–4178. [Google Scholar] [CrossRef]
- Huber, R.; Criddle, R. Comparison of the chemical properties of selenocysteine and selenocystine with their sulfur analogs. Arch. Biochem. Biophys. 1967, 122, 164–173. [Google Scholar] [CrossRef]
- Kiss, T.; Gergely, A. Complexes of 3, 4-dhydroxyphnyl derivatives, III. Equilibrium study of parent and some mixed ligand complexes of dopamine, alanine and pyrocatechol with nickel (II), copper (II) and zinc (II) ions. Inorganica Chim. Acta 1979, 36, 31–36. [Google Scholar] [CrossRef]
- Kóczián, K.; Szakács, Z.; Kökösi, J.; Noszál, B. Site-specific protonation microequilibria of penicillin and cephalosporin beta-lactam core molecules. Eur. J. Pharm. Sci. 2007, 32, 1–7. [Google Scholar] [CrossRef]
- Köteles, I.; Mazák, K.; Tóth, G.; Tűz, B.; Hosztafi, S. Synthesis of Potential Haptens with Morphine Skeleton and Determination of Protonation Constants. Molecules 2020, 25, 4009. [Google Scholar] [CrossRef] [PubMed]
- Köteles, I.; Mazák, K.; Tóth, G.; Horváth, P.; Kiss, E.; Tűz, B.; Hosztafi, S. Synthesis of 3-O-Carboxyalkyl Morphine Derivatives and Characterization of Their Acid-Base Properties. Chem. Biodivers. 2021, 18, e2100135. [Google Scholar] [CrossRef] [PubMed]
- Mazák, K.; Dóczy, V.; Kökösi, J.; Noszál, B. Proton speciation and microspeciation of serotonin and 5-hydroxytryptophan. Chem. Biodivers. 2009, 6, 578–590. [Google Scholar] [CrossRef] [PubMed]
- Mazák, K.; Noszál, B.; Hosztafi, S. Advances in the physicochemical profiling of opioid compounds of therapeutic interest. ChemistryOpen 2019, 8, 879–887. [Google Scholar] [CrossRef] [PubMed]
- Mirzahosseini, A.; Molaei, M.; Mazák, K.; Pálla, T.; Köteles, I.; Varró, N.; Mándity, I.; Noszál, B. Species-specific acid-base characterization of carnosine and homocarnosine using nuclear magnetic resonance. Chem. Phys. Lett. 2022, 808, 140128. [Google Scholar] [CrossRef]
- Mirzahosseini, A.; Noszál, B. The species-and site-specific acid–base properties of biological thiols and their homodisulfides. J. Pharm. Biomed. Anal. 2014, 95, 184–192. [Google Scholar] [CrossRef]
- Mirzahosseini, A.; Pálla, T.; Orgován, G.; Tóth, G.; Noszál, B. Characterization of the species-specific acid-base equilibria of adrenaline and noradrenaline. J. Pharm. Biomed. Anal. 2019, 170, 215–219. [Google Scholar] [CrossRef]
- Mirzahosseini, A.; Somlyay, M.; Noszál, B. The comprehensive acid–base characterization of glutathione. Chem. Phys. Lett. 2015, 622, 50–56. [Google Scholar] [CrossRef]
- Nagy, P.I.; Takács-Novák, K. Tautomeric and conformational equilibria of biologically important (hydroxyphenyl) alkylamines in the gas phase and in aqueous solution. Phys. Chem. Chem. Phys. 2004, 6, 2838–2848. [Google Scholar] [CrossRef]
- Noszál, B.; Szakács, Z. Microscopic protonation equilibria of oxidized glutathione. J. Phys. Chem. B 2003, 107, 5074–5080. [Google Scholar] [CrossRef]
- Odani, A.; Yamauchi, O. Preferential formation of ternary copper (II) complexes involving substituted ethylenediamines and amino acids with an aromatic side chain. Inorganica Chim. Acta 1984, 93, 13–18. [Google Scholar] [CrossRef]
- Pálla, T.; Kolompár, Z.; Mazák, K.; Mirzahosseini, A.; Noszál, B. Estimating the Bias of Model Compounds for the Determination of Species-Specific Protonation Constants. ACS Omega 2023, 9, 896–902. [Google Scholar] [CrossRef] [PubMed]
- Pálla, T.; Mirzahosseini, A.; Noszál, B. The species-specific acid-base and multinuclear magnetic resonance properties of selenocysteamine, selenocysteine, and their homodiselenides. Chem. Phys. Lett. 2020, 741, 137076. [Google Scholar] [CrossRef]
- Pillai, L.; Boss, R.D.; Greenberg, M.S. On the role of solvent in complexation equilibiria. II. The acid-base chemistry of some sulfhydryl and ammonium-containing amino acids in water—Acetonitrile mixed solvents. J. Solut. Chem. 1979, 8, 635–646. [Google Scholar] [CrossRef]
- Ramırez-Silva, M.T.; Gómez-Hernández, M.; de Lourdes Pacheco-Hernández, M.; Rojas-Hernández, A.; Galicia, L. Spectroscopy study of 5-amino-1, 10-phenanthroline. Spectrochim. Acta Part A Mol. Biomol. Spectrosc. 2004, 60, 781–789. [Google Scholar] [CrossRef]
- Rusu, A.; Tóth, G.; Szőcs, L.; Kökösi, J.; Kraszni, M.; Gyéresi, Á.; Noszál, B. Triprotic site-specific acid–base equilibria and related properties of fluoroquinolone antibacterials. J. Pharm. Biomed. Anal. 2012, 66, 50–57. [Google Scholar] [CrossRef]
- Szakács, Z.; Béni, S.; Noszál, B. Resolution of carboxylate protonation microequilibria of NTA, EDTA and related complexones. Talanta 2008, 74, 666–674. [Google Scholar] [CrossRef]
- Szakács, Z.; Hägele, G. Accurate determination of low pK values by 1H NMR titration. Talanta 2004, 62, 819–825. [Google Scholar] [CrossRef]
- Szakács, Z.; Noszál, B. Determination of dissociation constants of folic acid, methotrexate, and other photolabile pteridines by pressure-assisted capillary electrophoresis. Electrophoresis 2006, 27, 3399–3409. [Google Scholar] [CrossRef]
- Takacs-Novak, K.; Deak, K.; Beni, S.; Volgyi, G. Physico-chemical Profiling of the ACE-inhibitor Lisinopril: Acid-base Properties. ADMET DMPK 2013, 1, 6–16. [Google Scholar] [CrossRef][Green Version]
- Tan, K.-S.; Arnold, A.P.; Rabenstein, D.L. Selenium-77 nuclear magnetic resonance studies of selenols, diselenides, and selenenyl sulfides. Can. J. Chem. 1988, 66, 54–60. [Google Scholar] [CrossRef]
- Tanaka, H.; Sakurai, H.; Yokoyama, A. Acid Dissociation of Selenocysteamine (2-Aminoethaneselenol). Chem. Pharm. Bull. 1970, 18, 1015–1020. [Google Scholar] [CrossRef][Green Version]
- Tóth, G.; Jánoska, Á.; Szabó, Z.I.; Völgyi, G.; Orgován, G.; Szente, L.; Noszál, B. Physicochemical characterisation and cyclodextrin complexation of erlotinib. Supramol. Chem. 2016, 28, 656–664. [Google Scholar] [CrossRef]
- Tűz, B.; Noszál, B.; Hosztafi, S.; Mazák, K. β-cyclodextrin complex formation and protonation equilibria of morphine and other opioid compounds of therapeutic interest. Eur. J. Pharm. Sci. 2022, 171, 106120. [Google Scholar] [CrossRef] [PubMed]
- Völgyi, G.; Vizserálek, G.; Takács-Novák, K.; Avdeef, A.; Tam, K.Y. Predicting the exposure and antibacterial activity of fluoroquinolones based on physicochemical properties. Eur. J. Pharm. Sci. 2012, 47, 21–27. [Google Scholar] [CrossRef]
- Weber, O.; Simeon, V. Tryptamine, 5-hydroxytryptamine and 5-hydroxytryptophan complexes of proton and some divalent metal ions. J. Inorg. Nucl. Chem. 1971, 33, 2097–2101. [Google Scholar] [CrossRef]
- Yasuda, M.; Sone, K.; Yamasaki, K. Stability of zinc and cadmium complexes with some methyl derivatives of 1, 10-phenanthroline and 2, 2′-bipyridine. J. Phys. Chem. 1956, 60, 1667–1668. [Google Scholar] [CrossRef]
- Avdeef, A. Absorption and Drug Development: Solubility, Permeability, and Charge State; John Wiley & Sons: Hoboken, NJ, USA, 2012. [Google Scholar]
- Malik, A.; Hosztafi, S.; Vincze, A.; Marton, A.; Kraszni, M.; Balogh, G.T.; Noszál, B.; Mazák, K. Characterization of Opioid Agonist Morphine Derivatives with Emphasis on Medicinal Chemistry. ChemMedChem. 2024, e202400654. [Google Scholar] [CrossRef]
- Narasimham, L.; Barhate, V.D. Physico-chemical characterization of some beta blockers and anti-diabetic drugs-potentiometric and spectrophotometric pKa determination in different co-solvents. Eur. J. Chem. 2011, 2, 36–46. [Google Scholar] [CrossRef][Green Version]
Disclaimer/Publisher’s Note: The statements, opinions and data contained in all publications are solely those of the individual author(s) and contributor(s) and not of MDPI and/or the editor(s). MDPI and/or the editor(s) disclaim responsibility for any injury to people or property resulting from any ideas, methods, instructions or products referred to in the content. |
© 2024 by the authors. Licensee MDPI, Basel, Switzerland. This article is an open access article distributed under the terms and conditions of the Creative Commons Attribution (CC BY) license (https://creativecommons.org/licenses/by/4.0/).