
Comparative Structure-Based Virtual Screening Utilizing Optimized AlphaFold Model Identifies Selective HDAC11 Inhibitor

 , , ,
, , , 
Abstract
1. Introduction
2. Results and Discussion
2.1. Dataset Selection and Curation
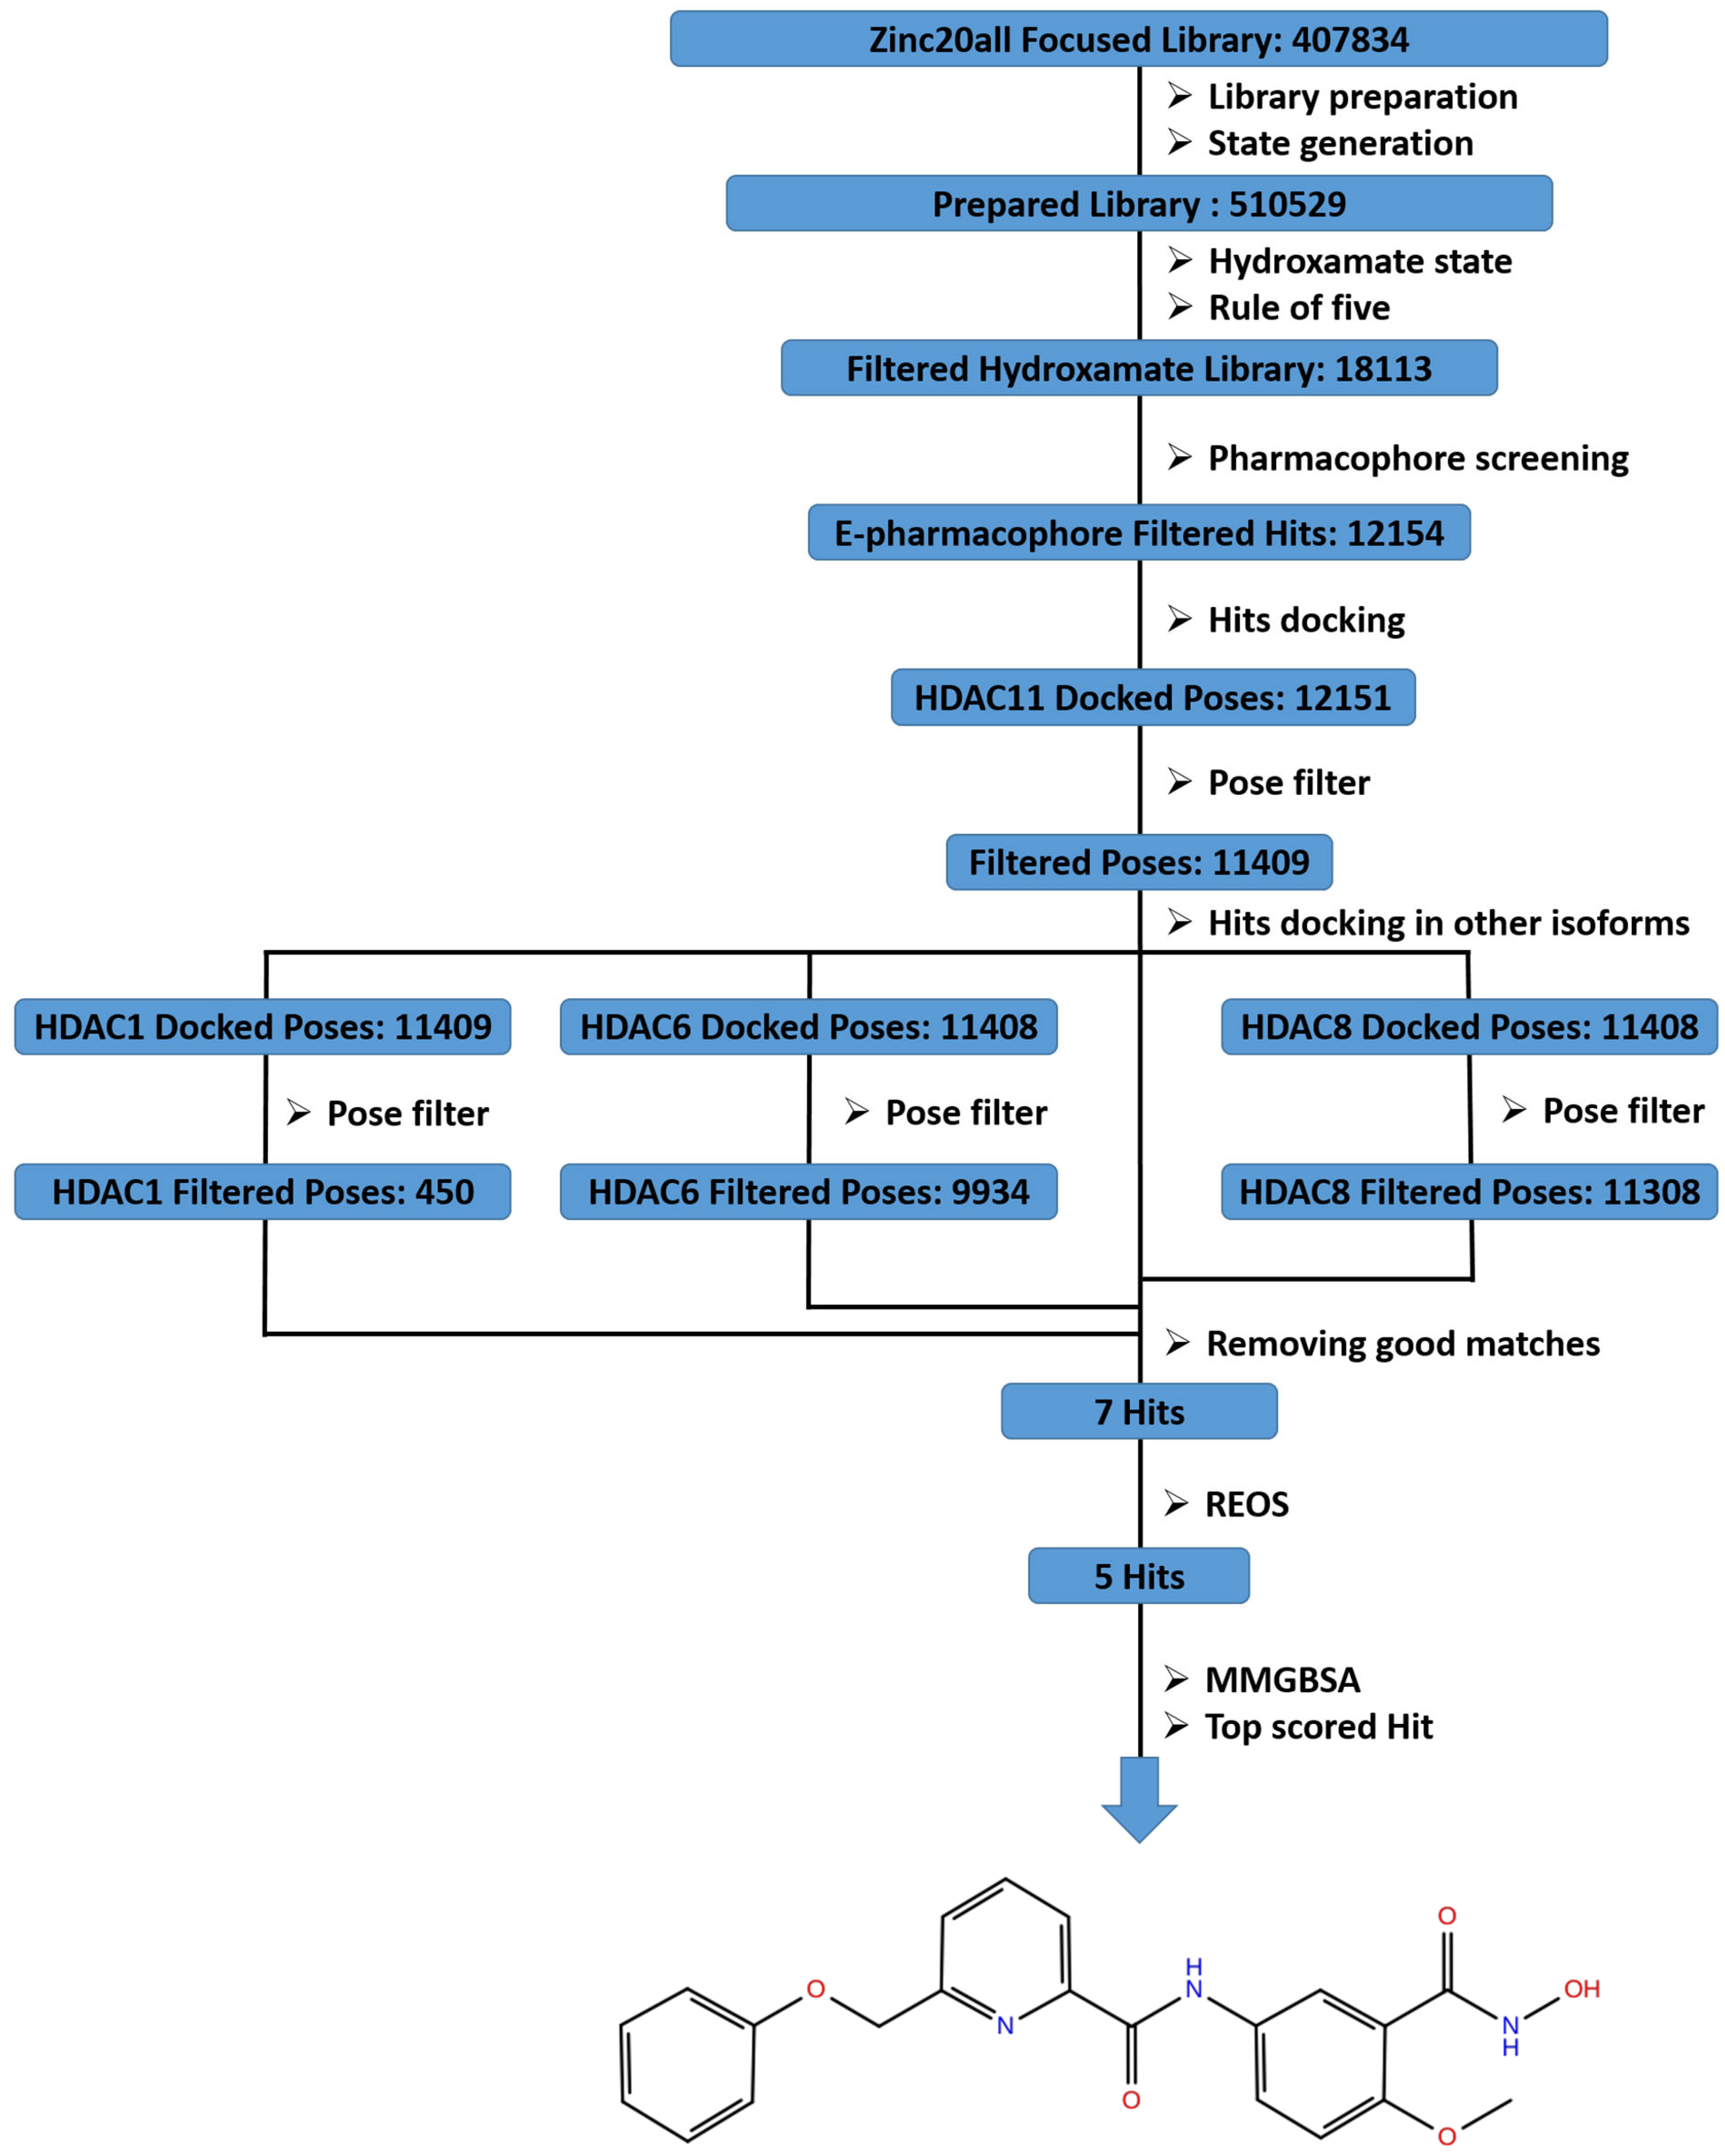
2.2. Virtual Screening
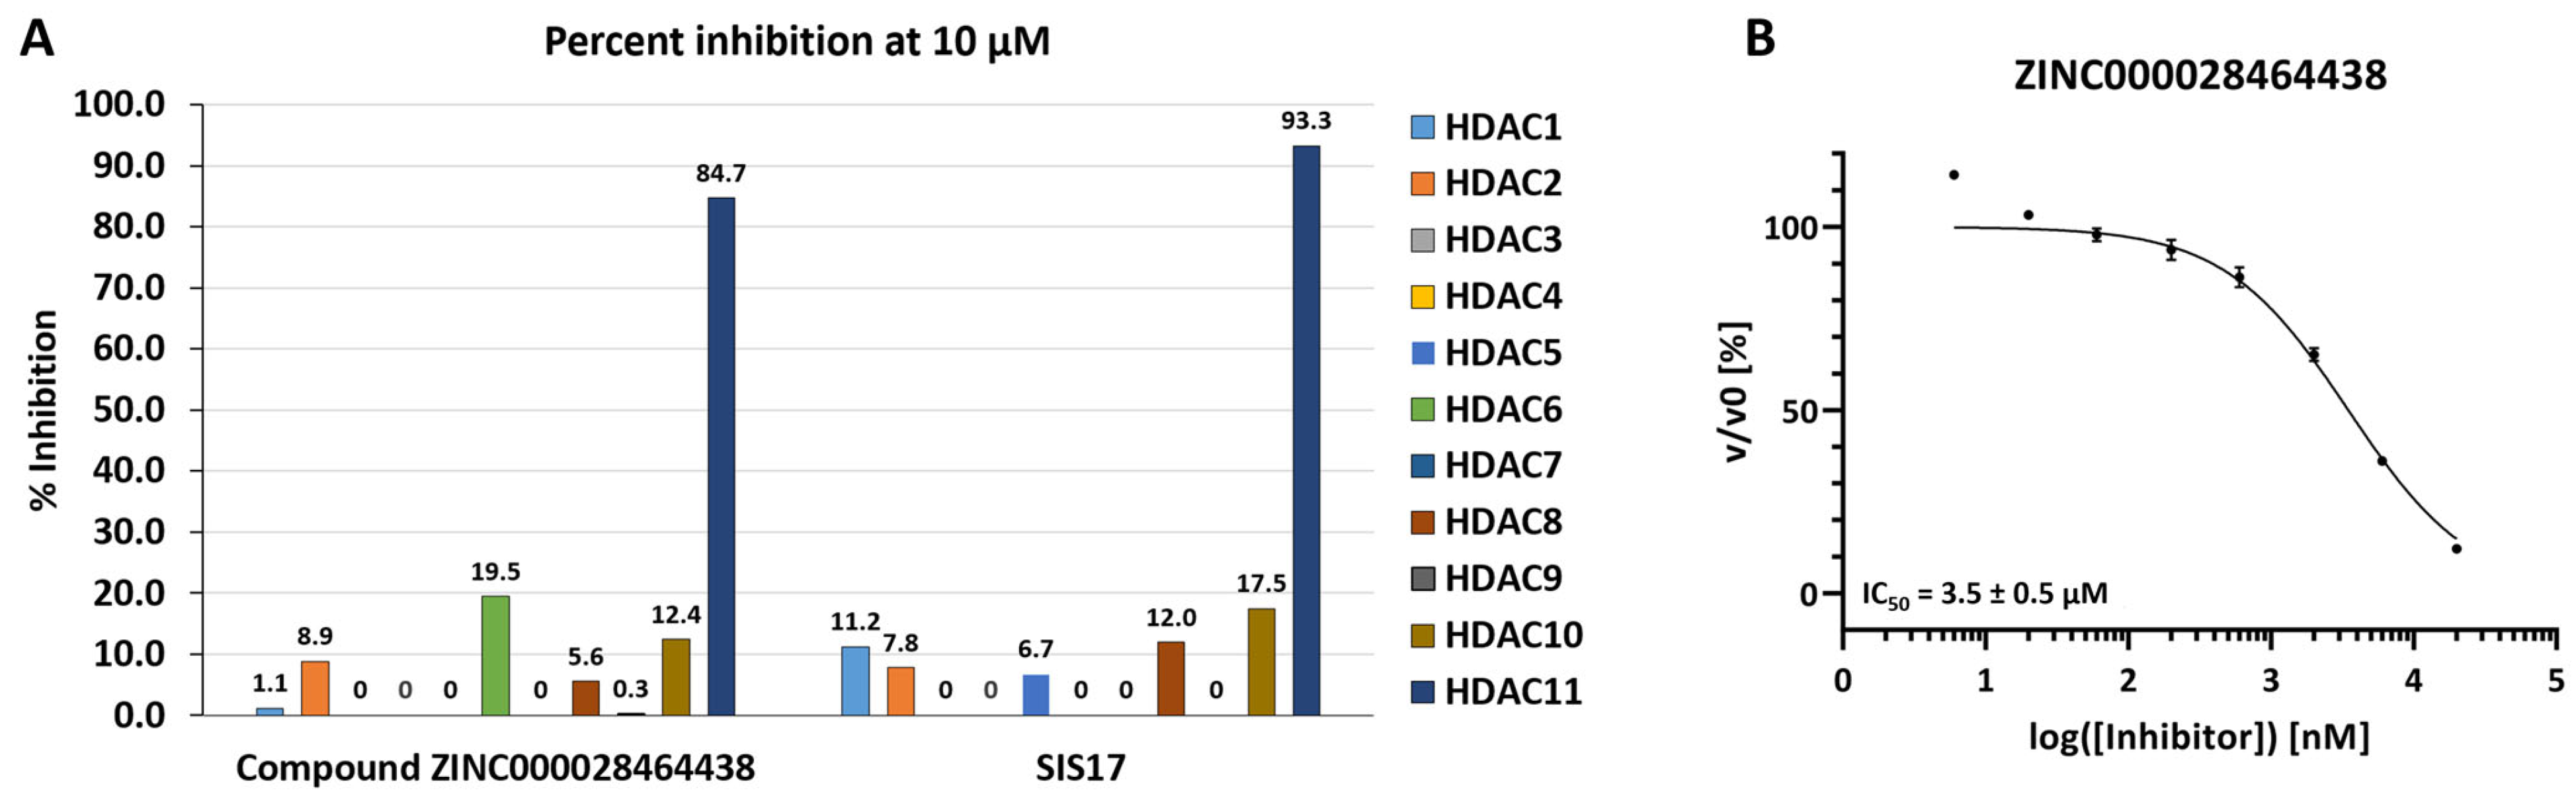
2.3. In Vitro Enzymatic Evaluation
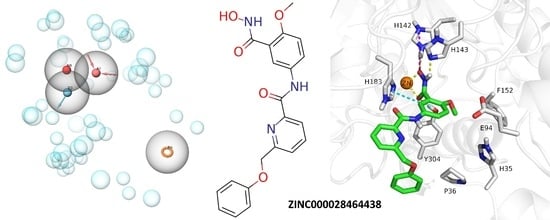
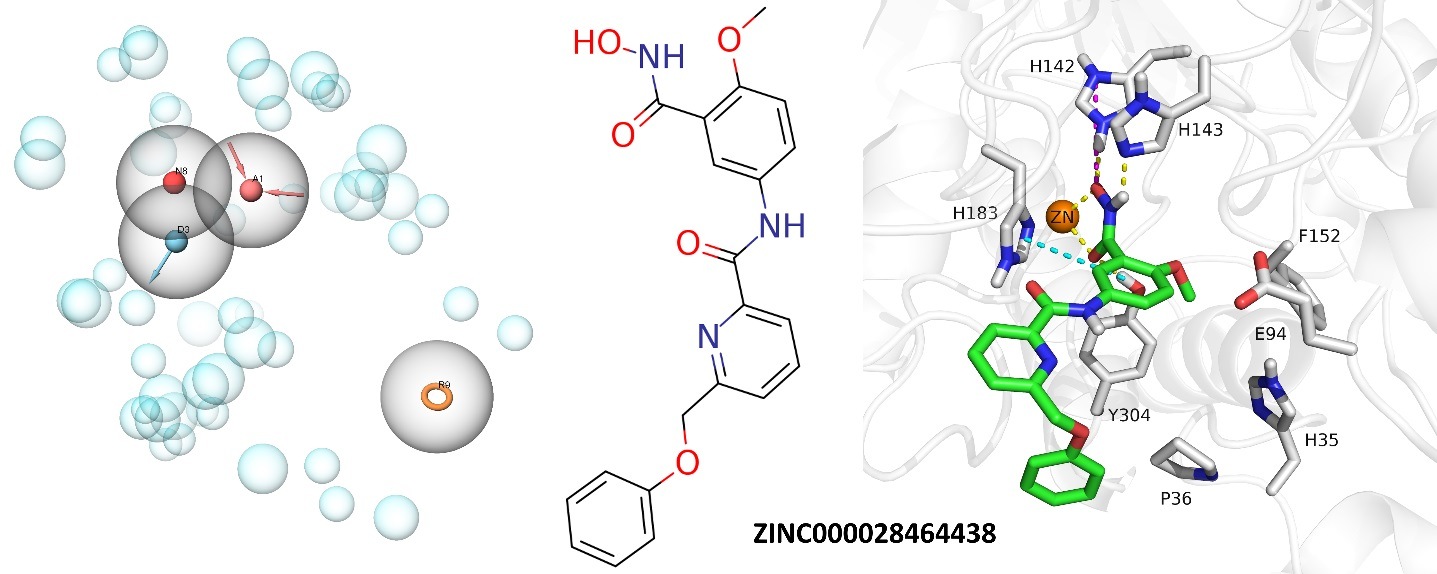
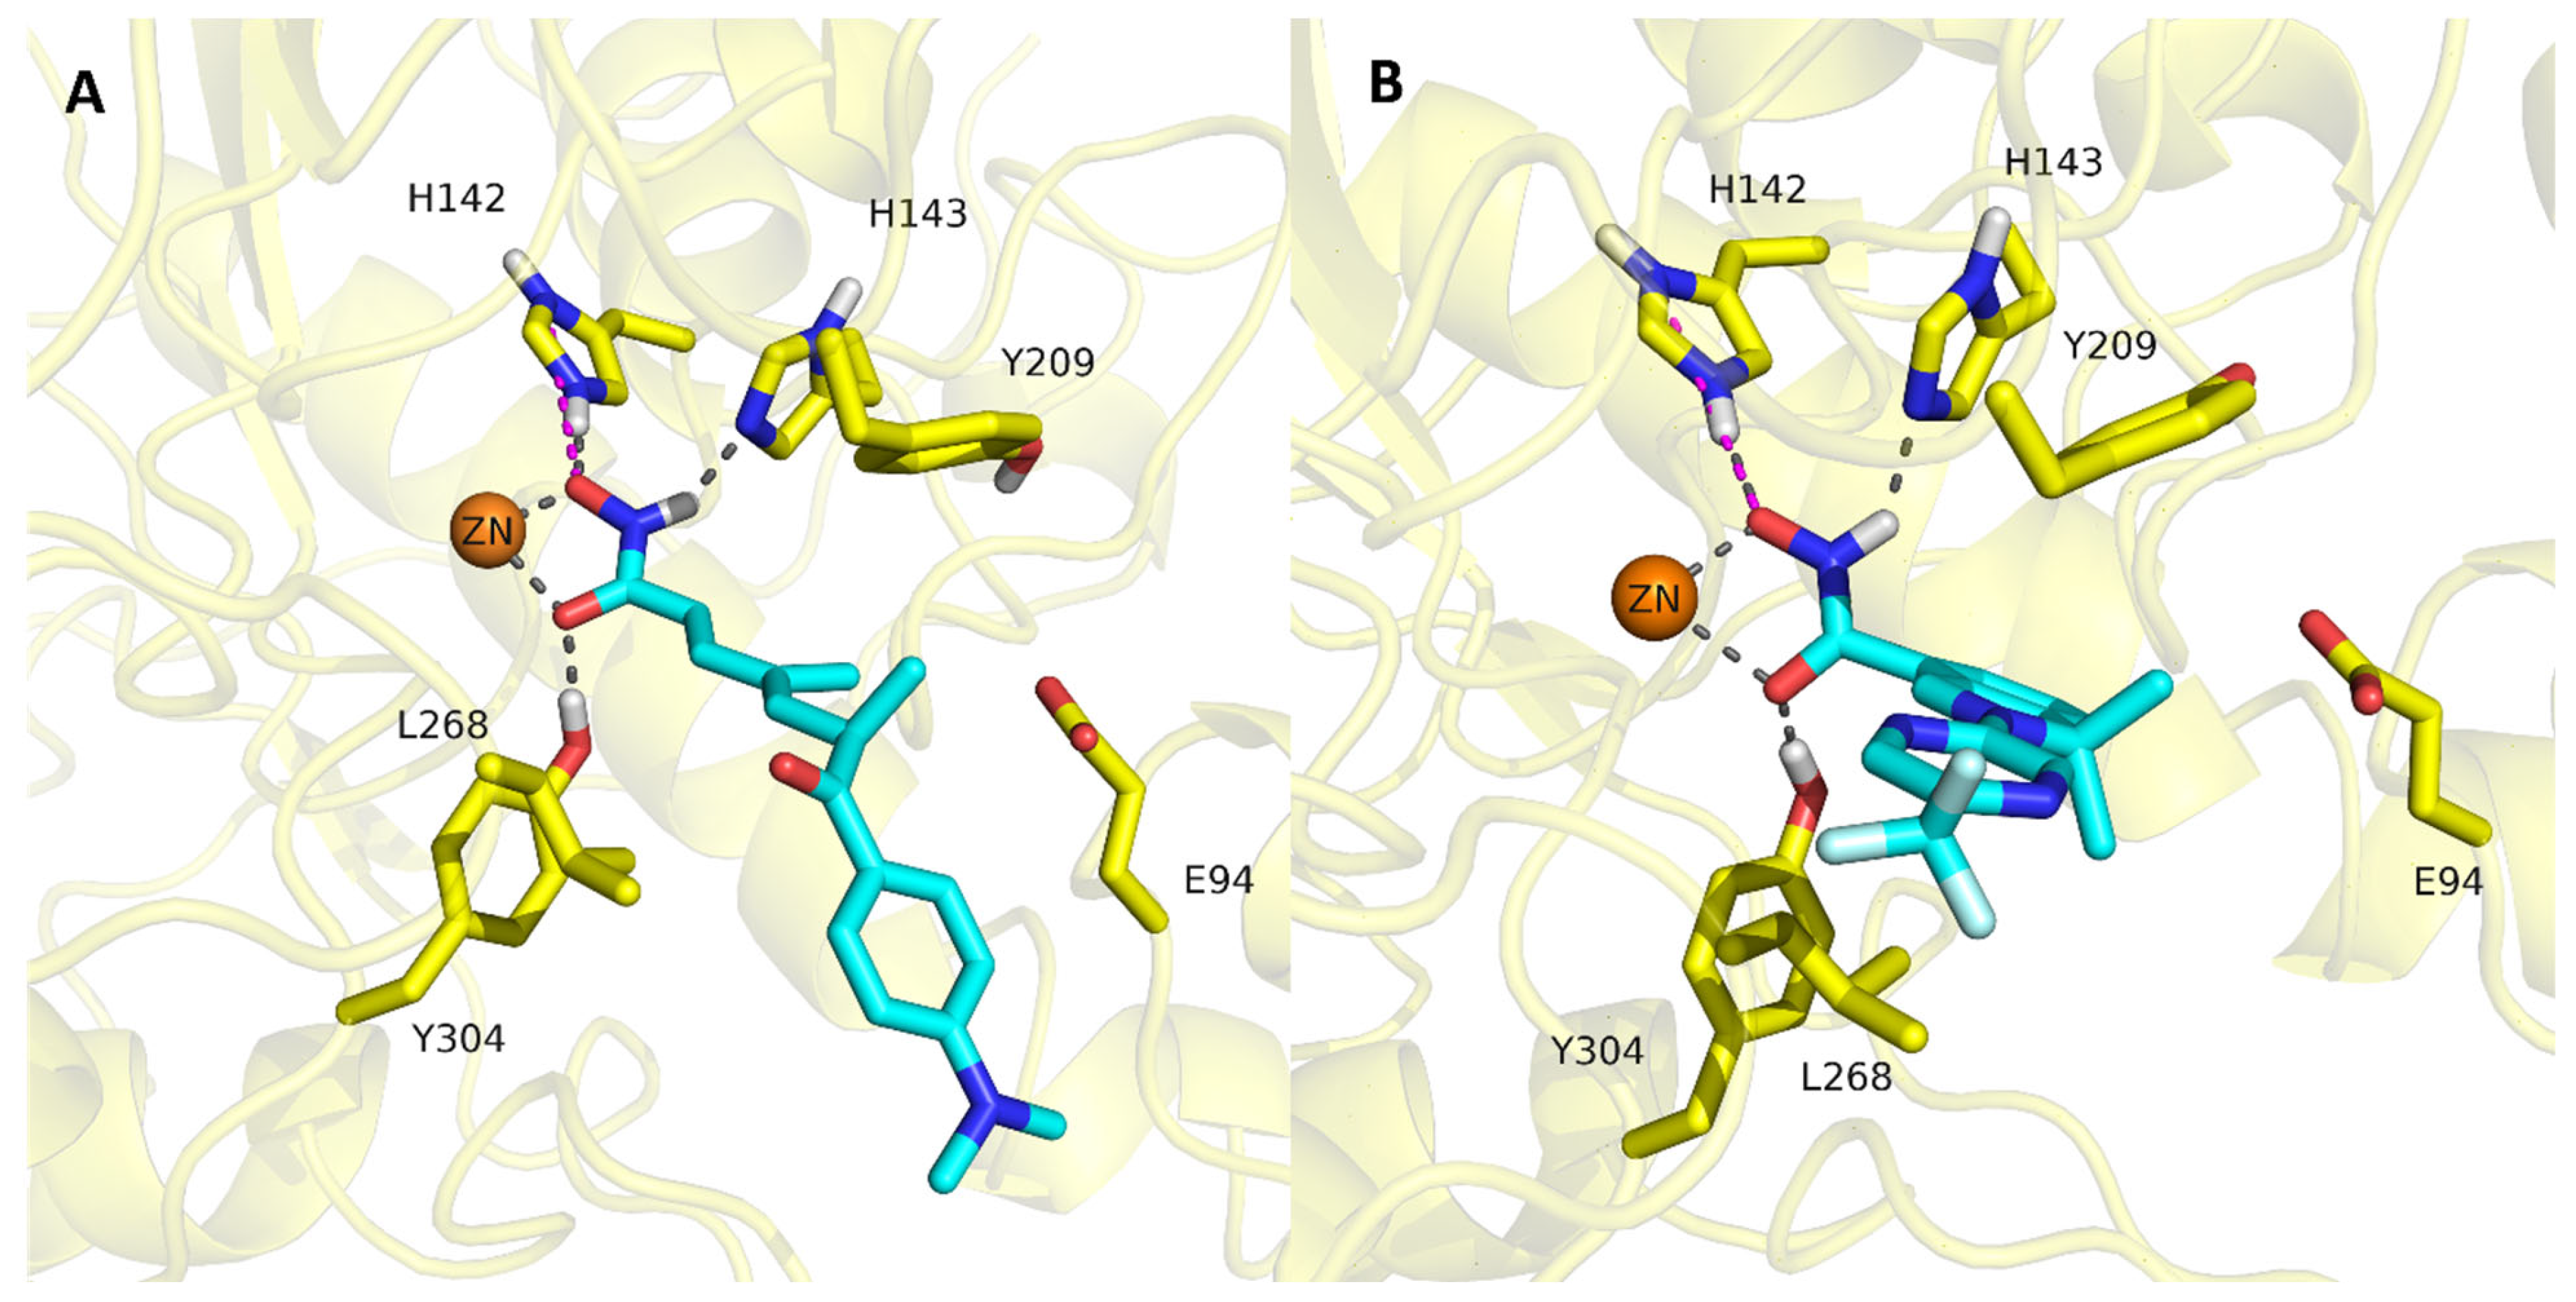
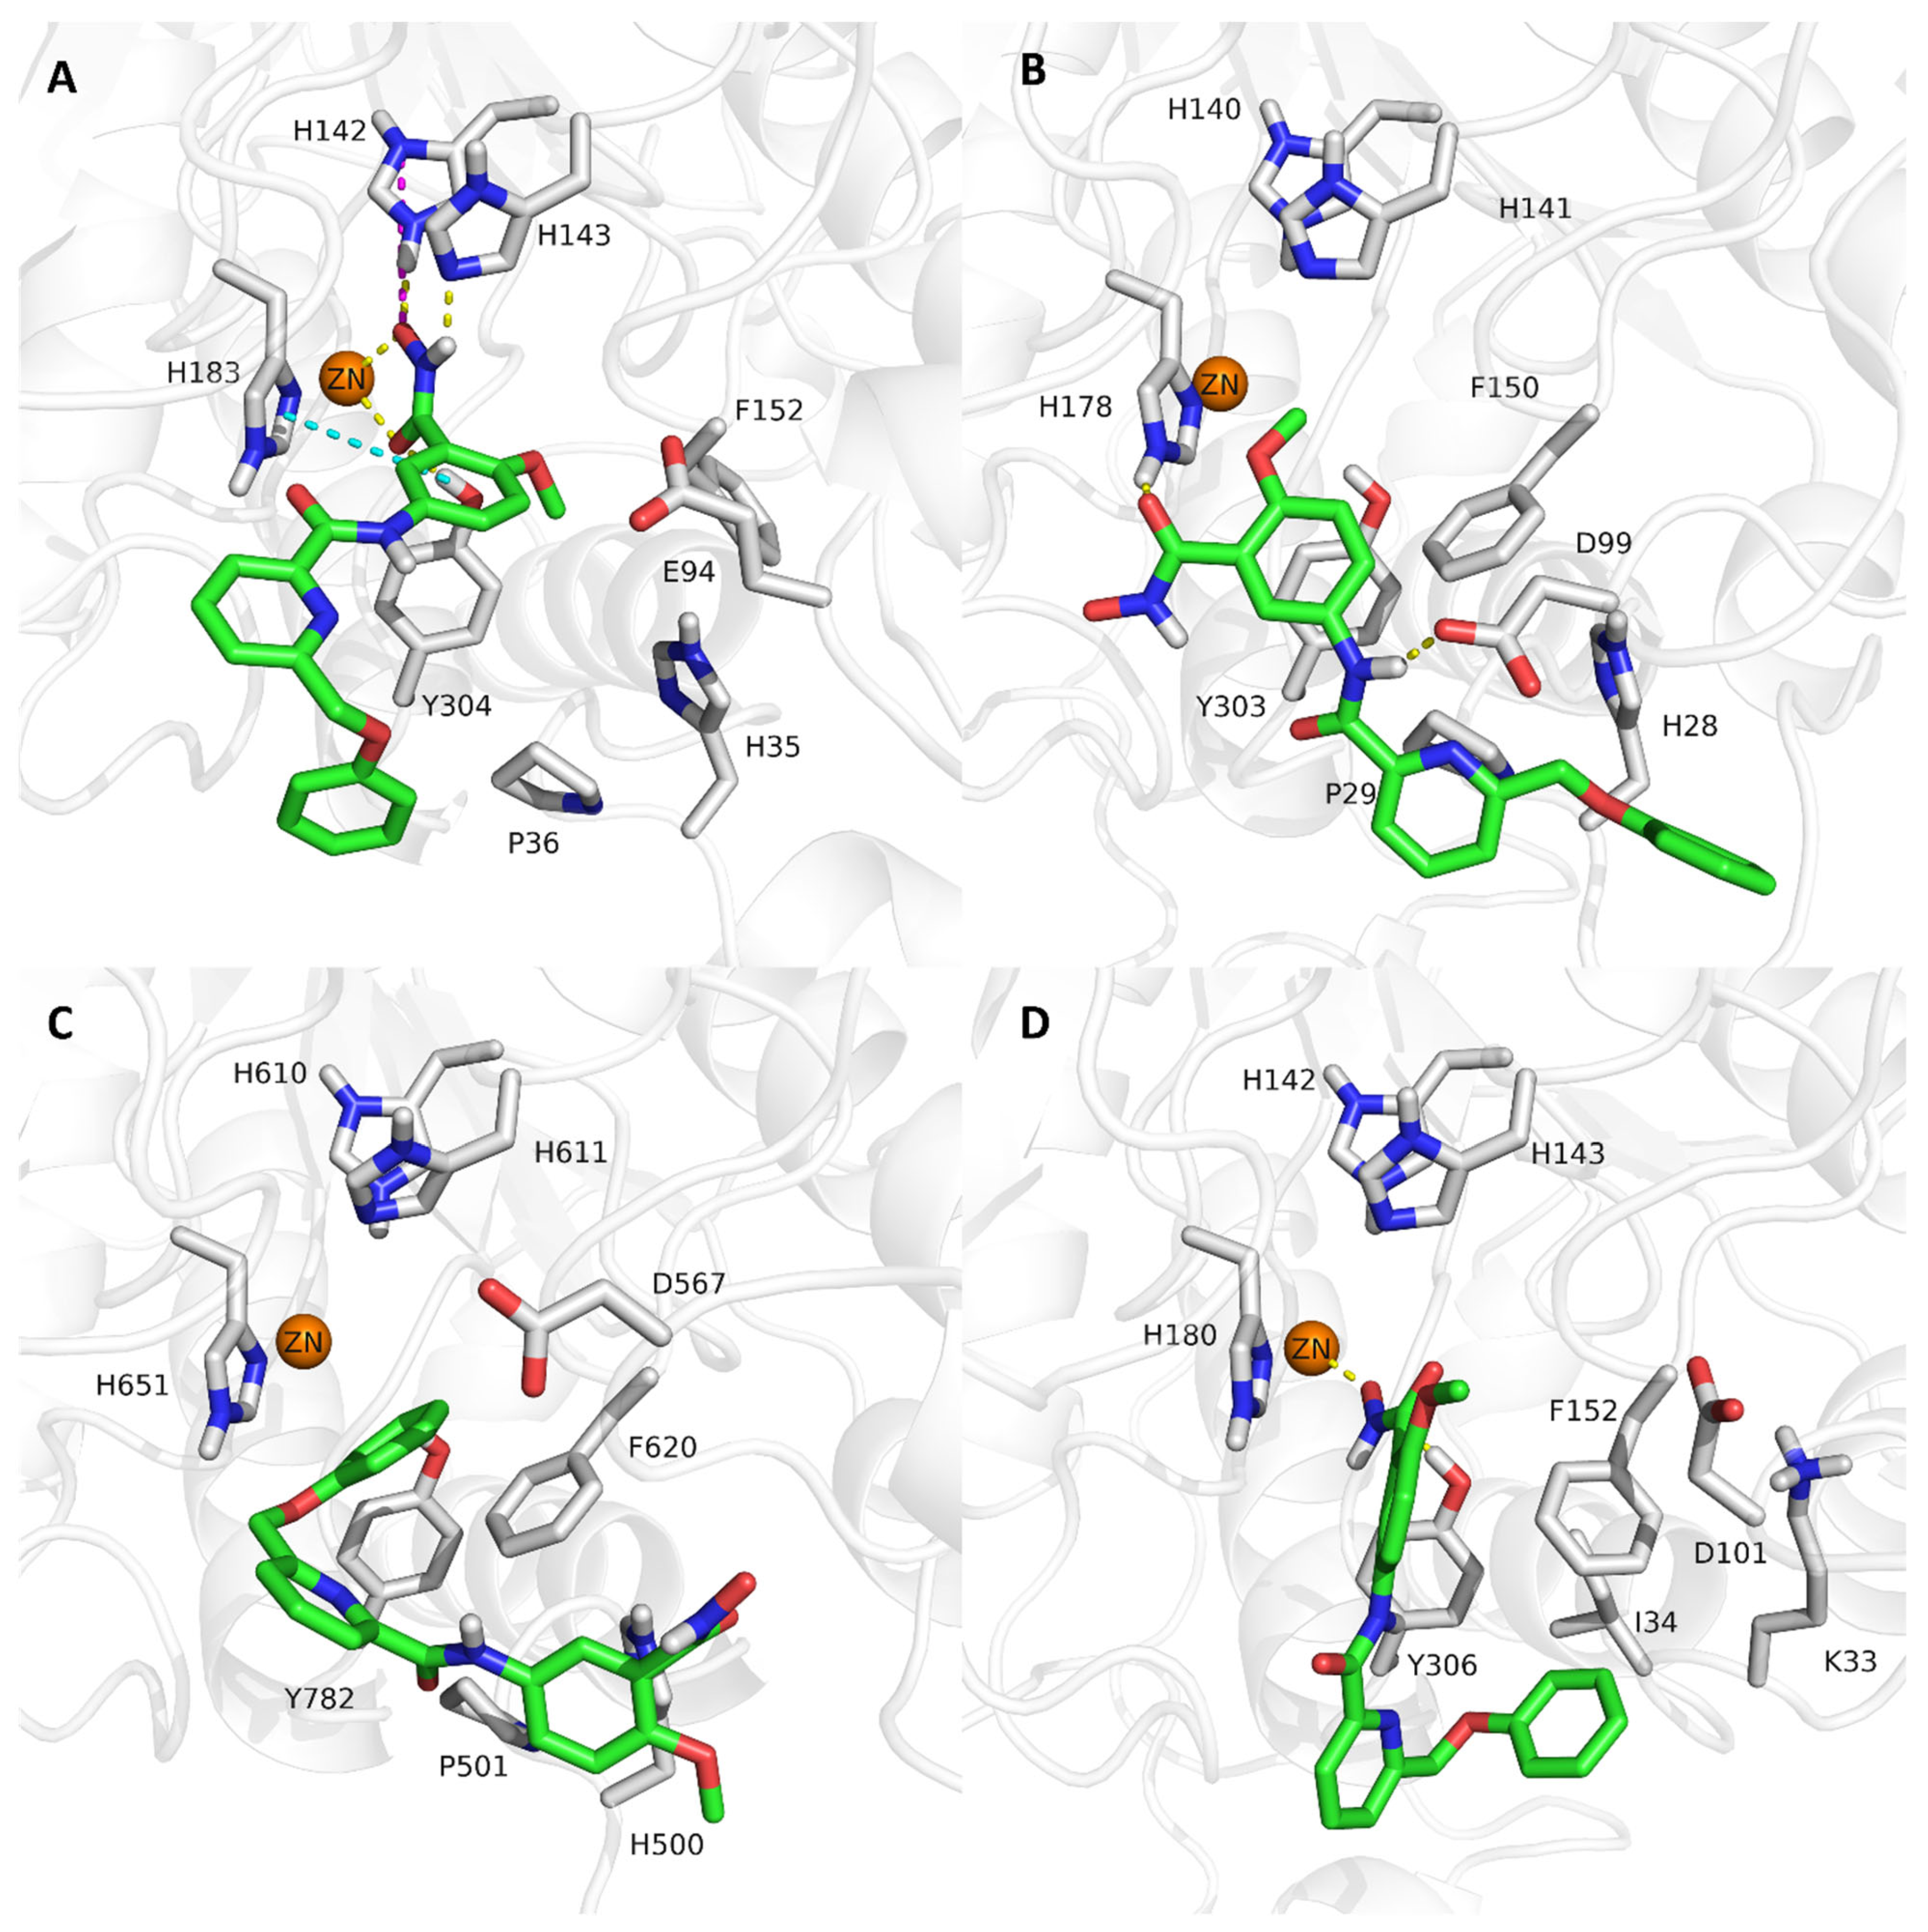
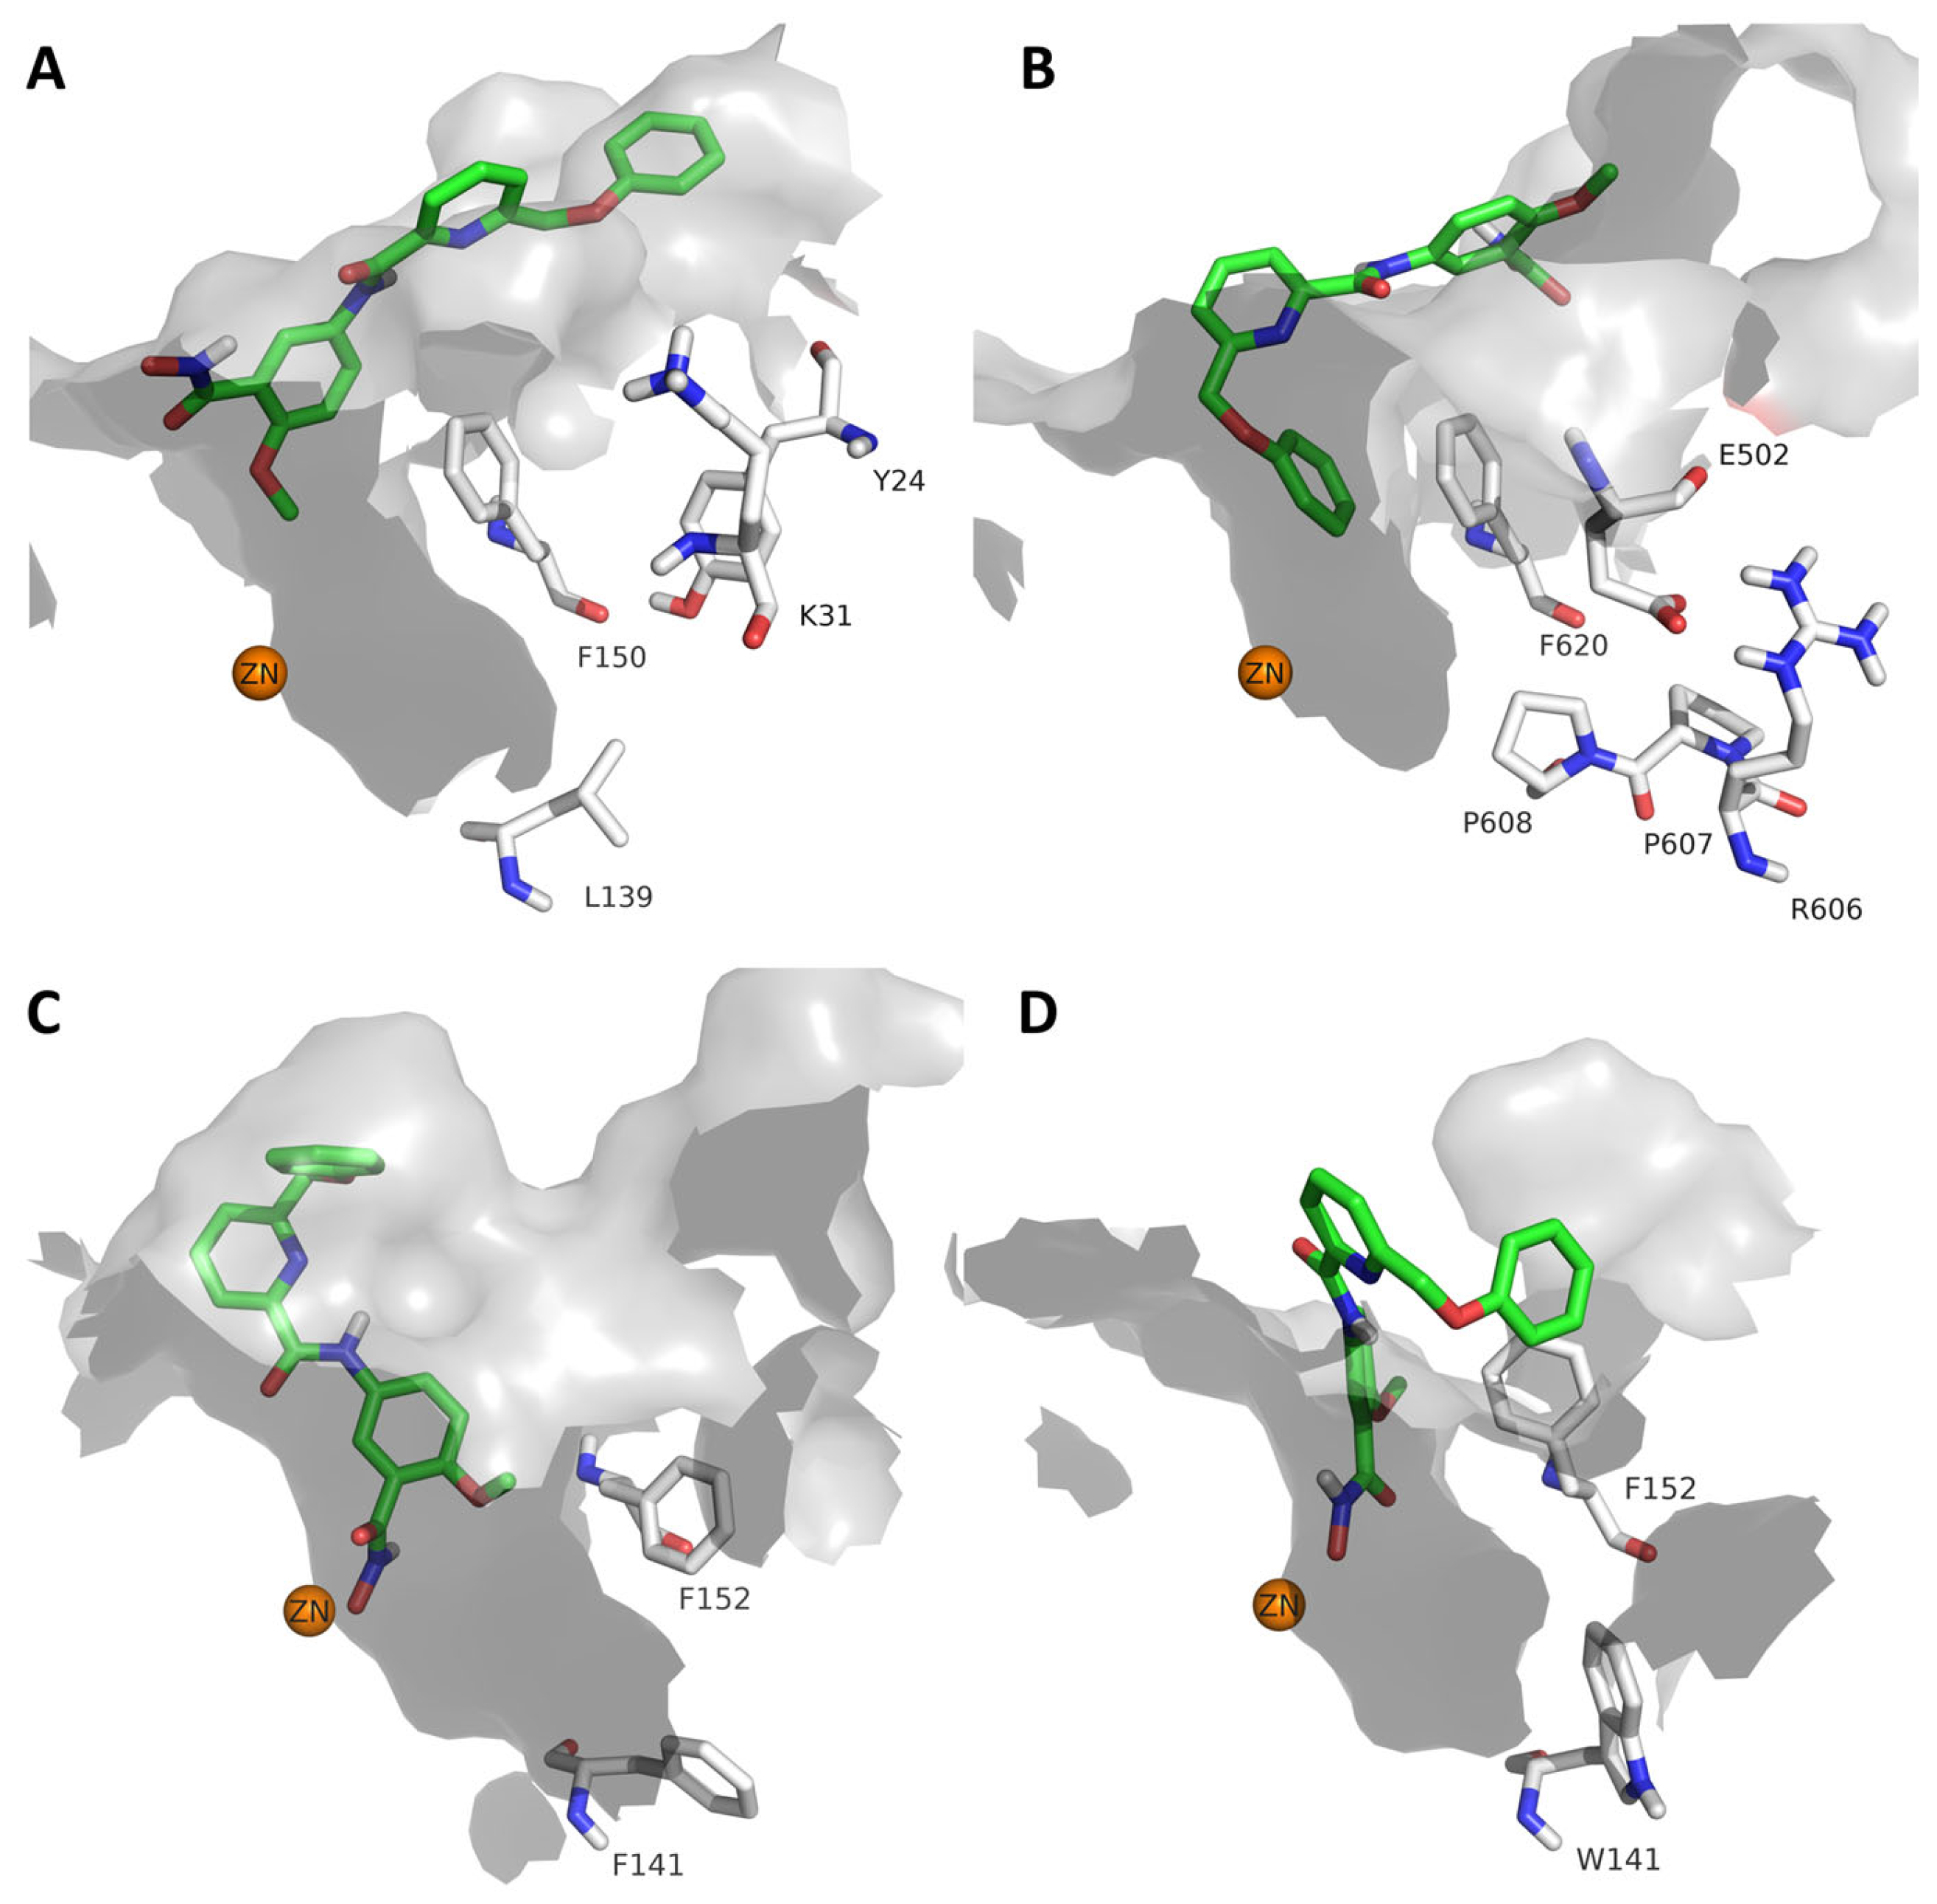
2.4. Analysis of the Docked Poses
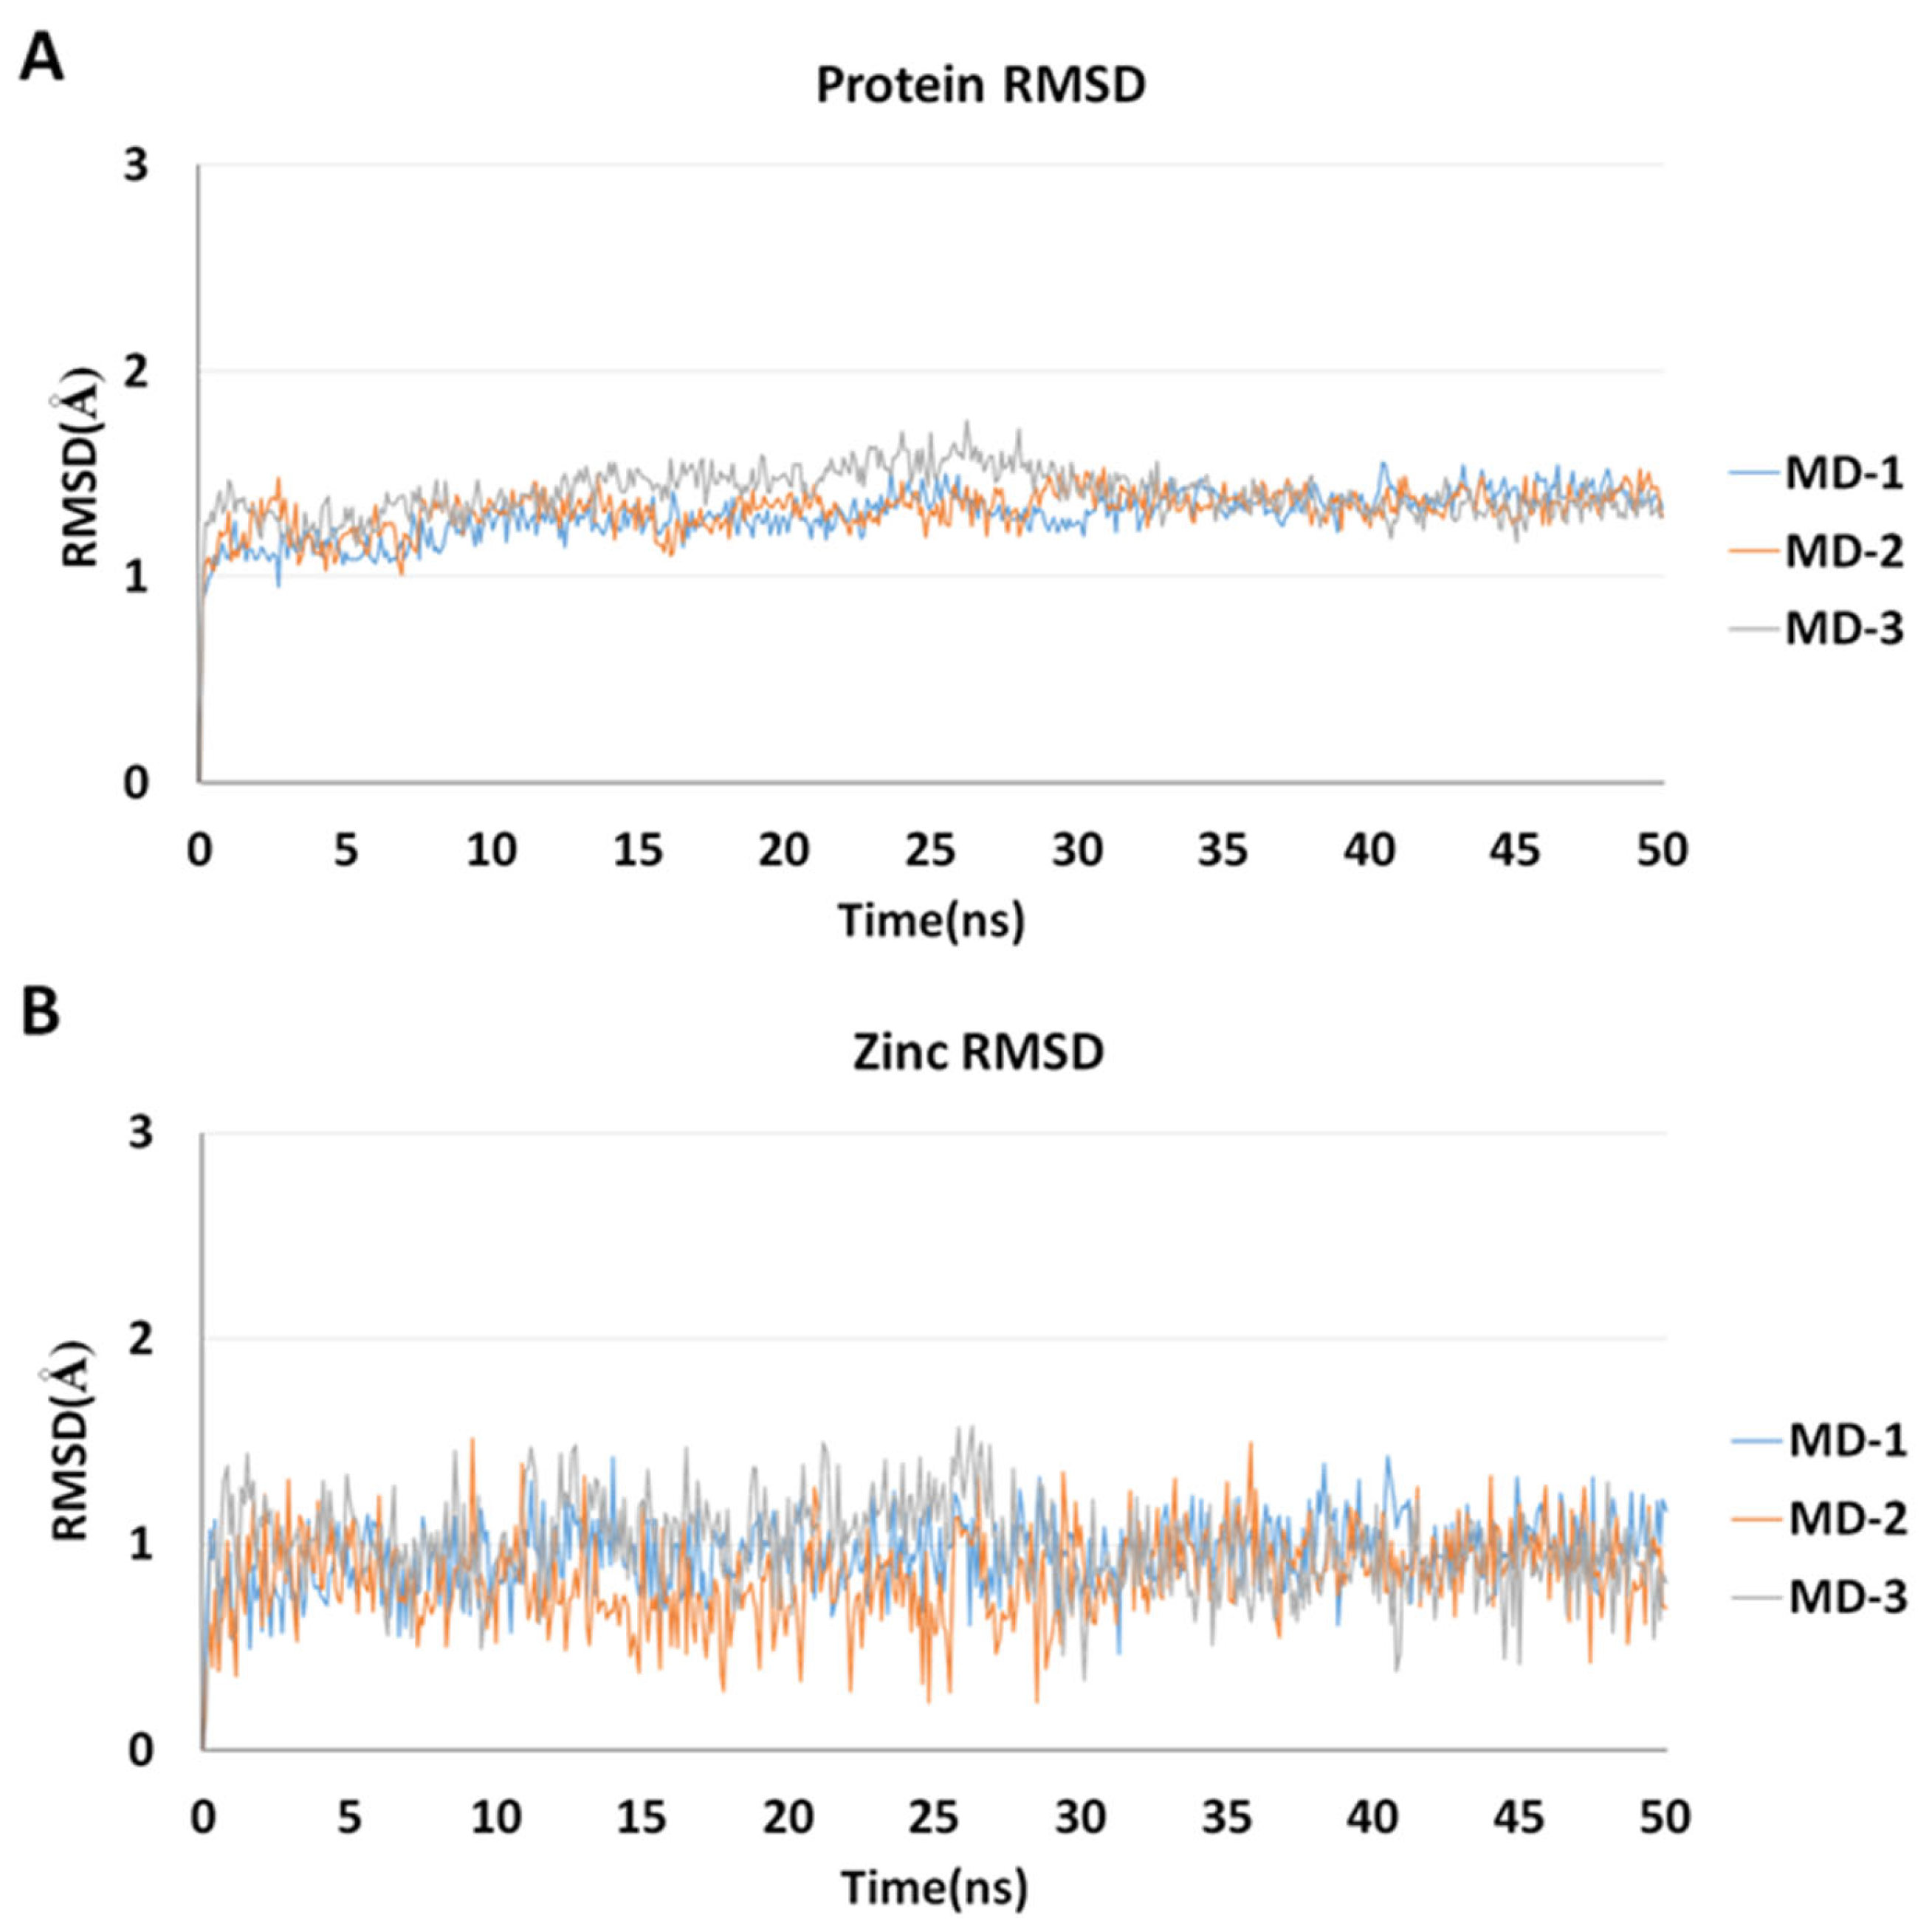
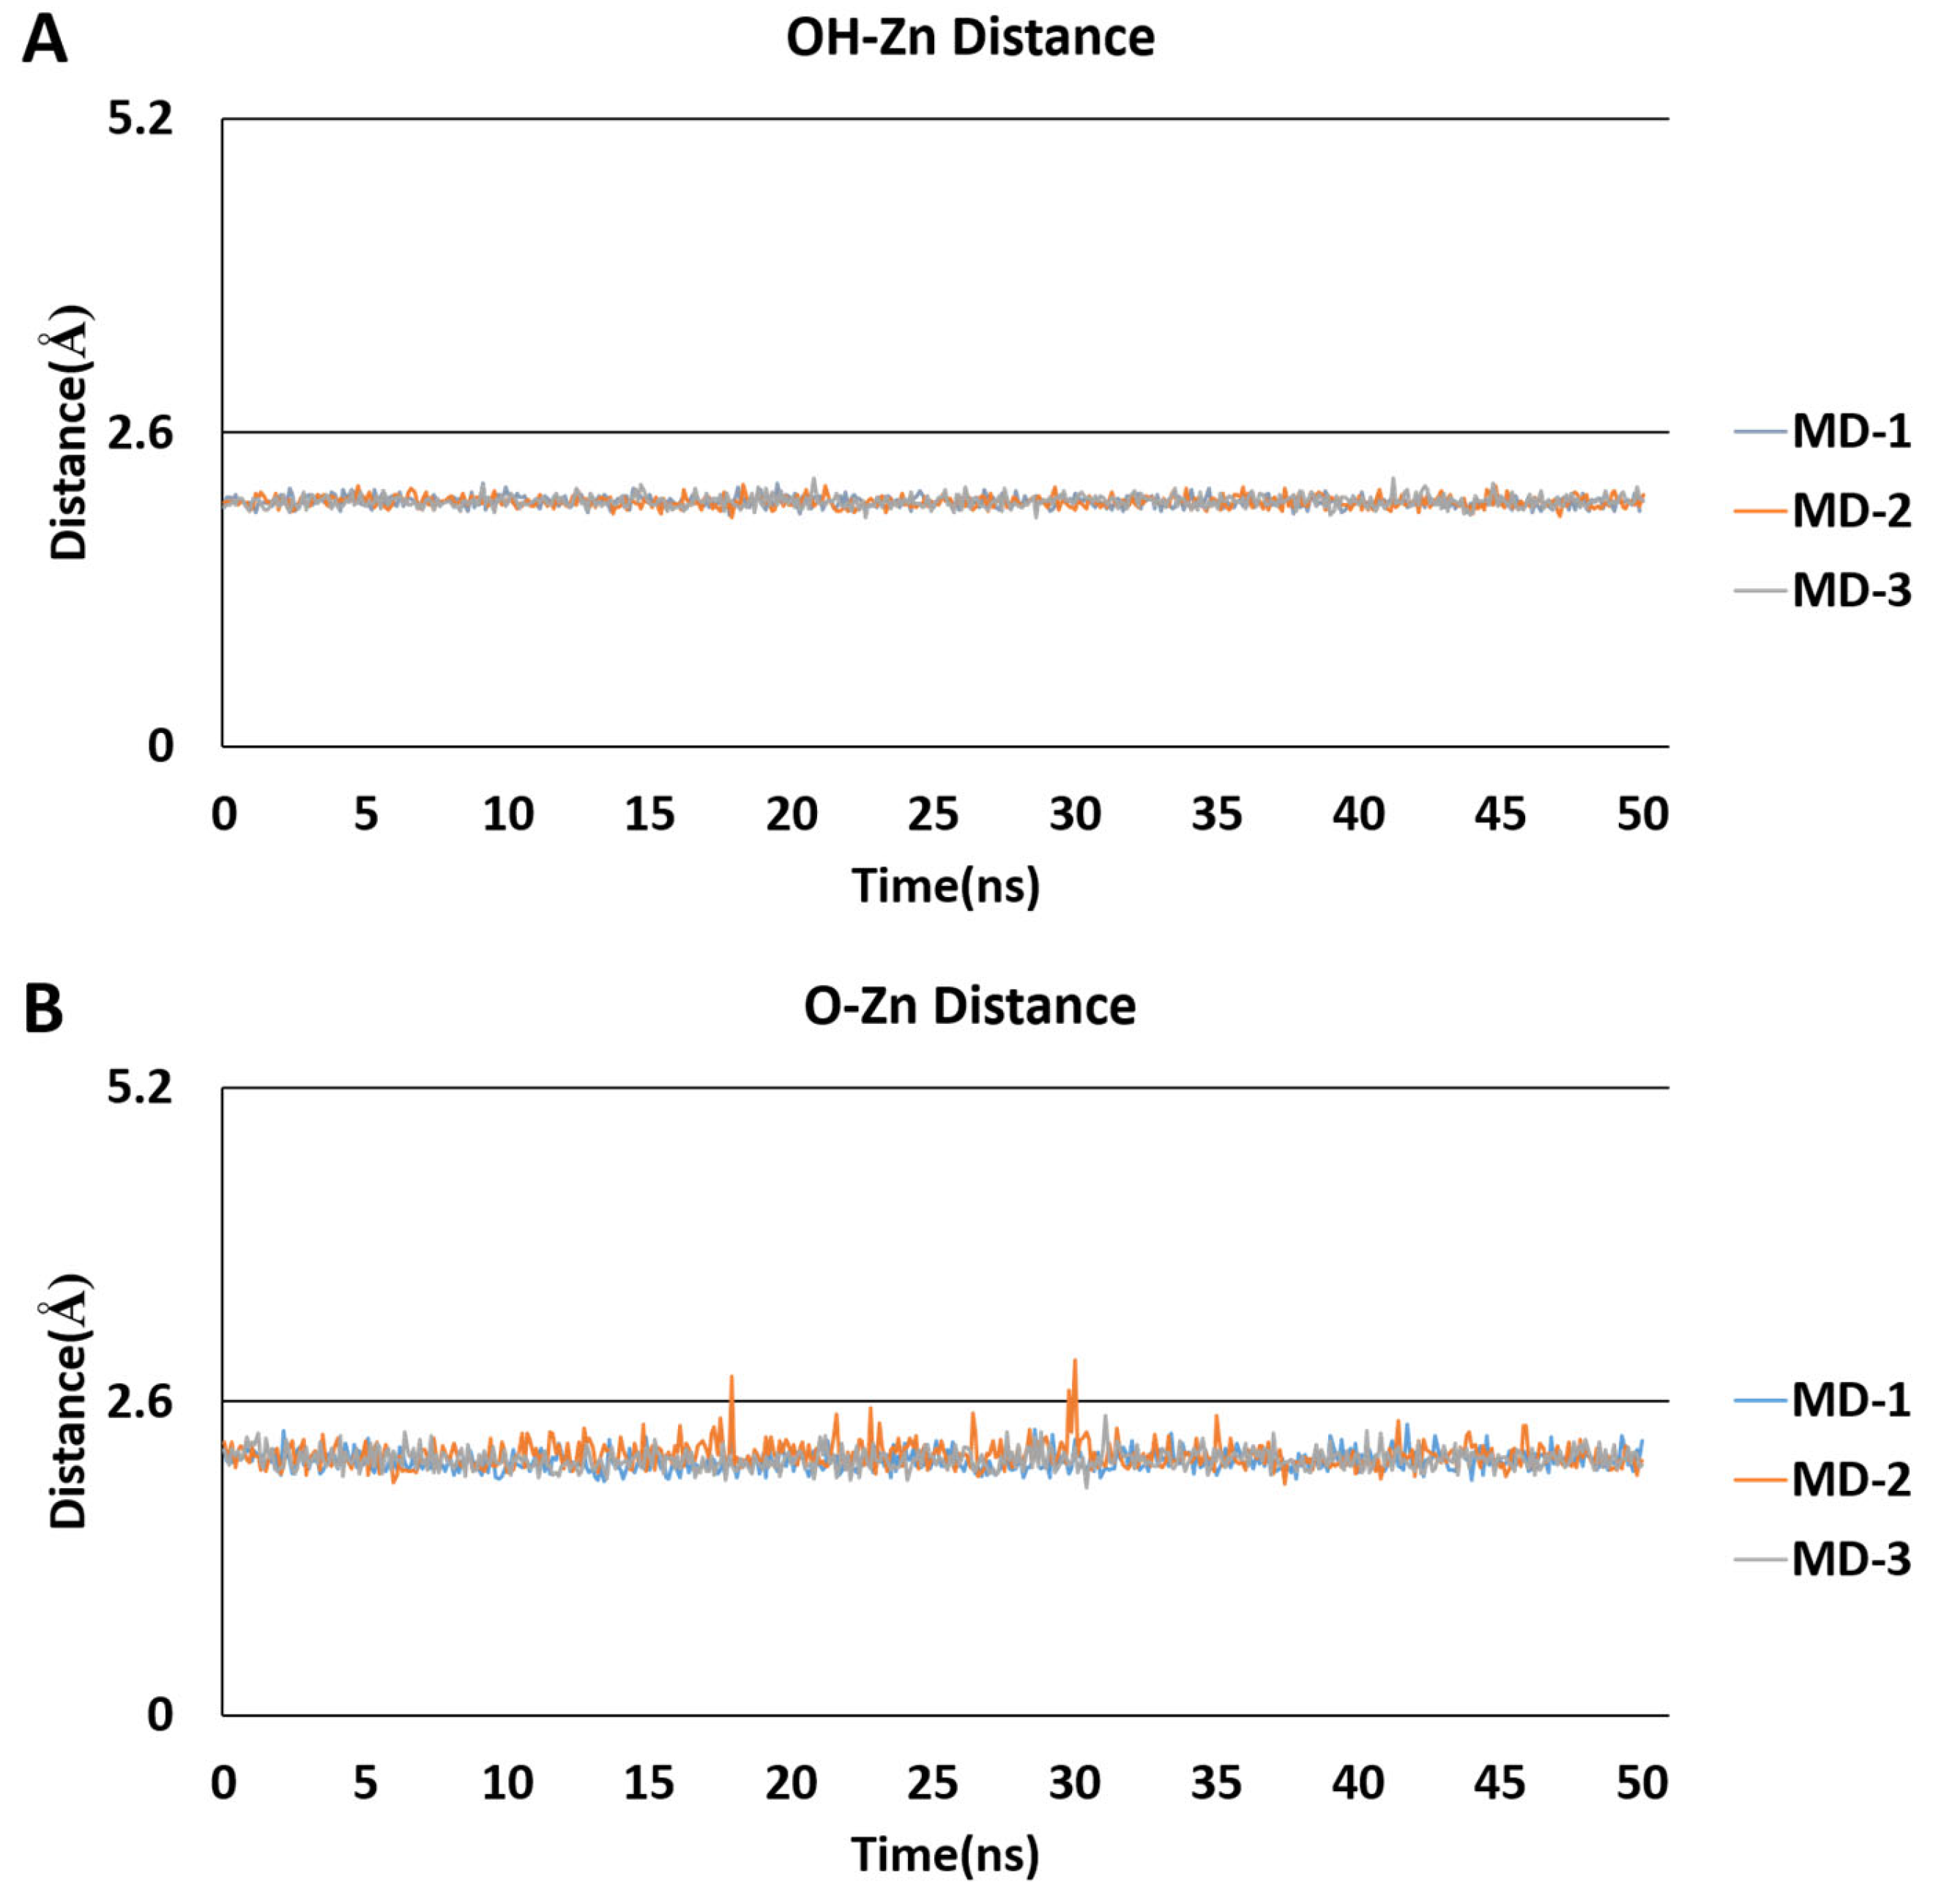
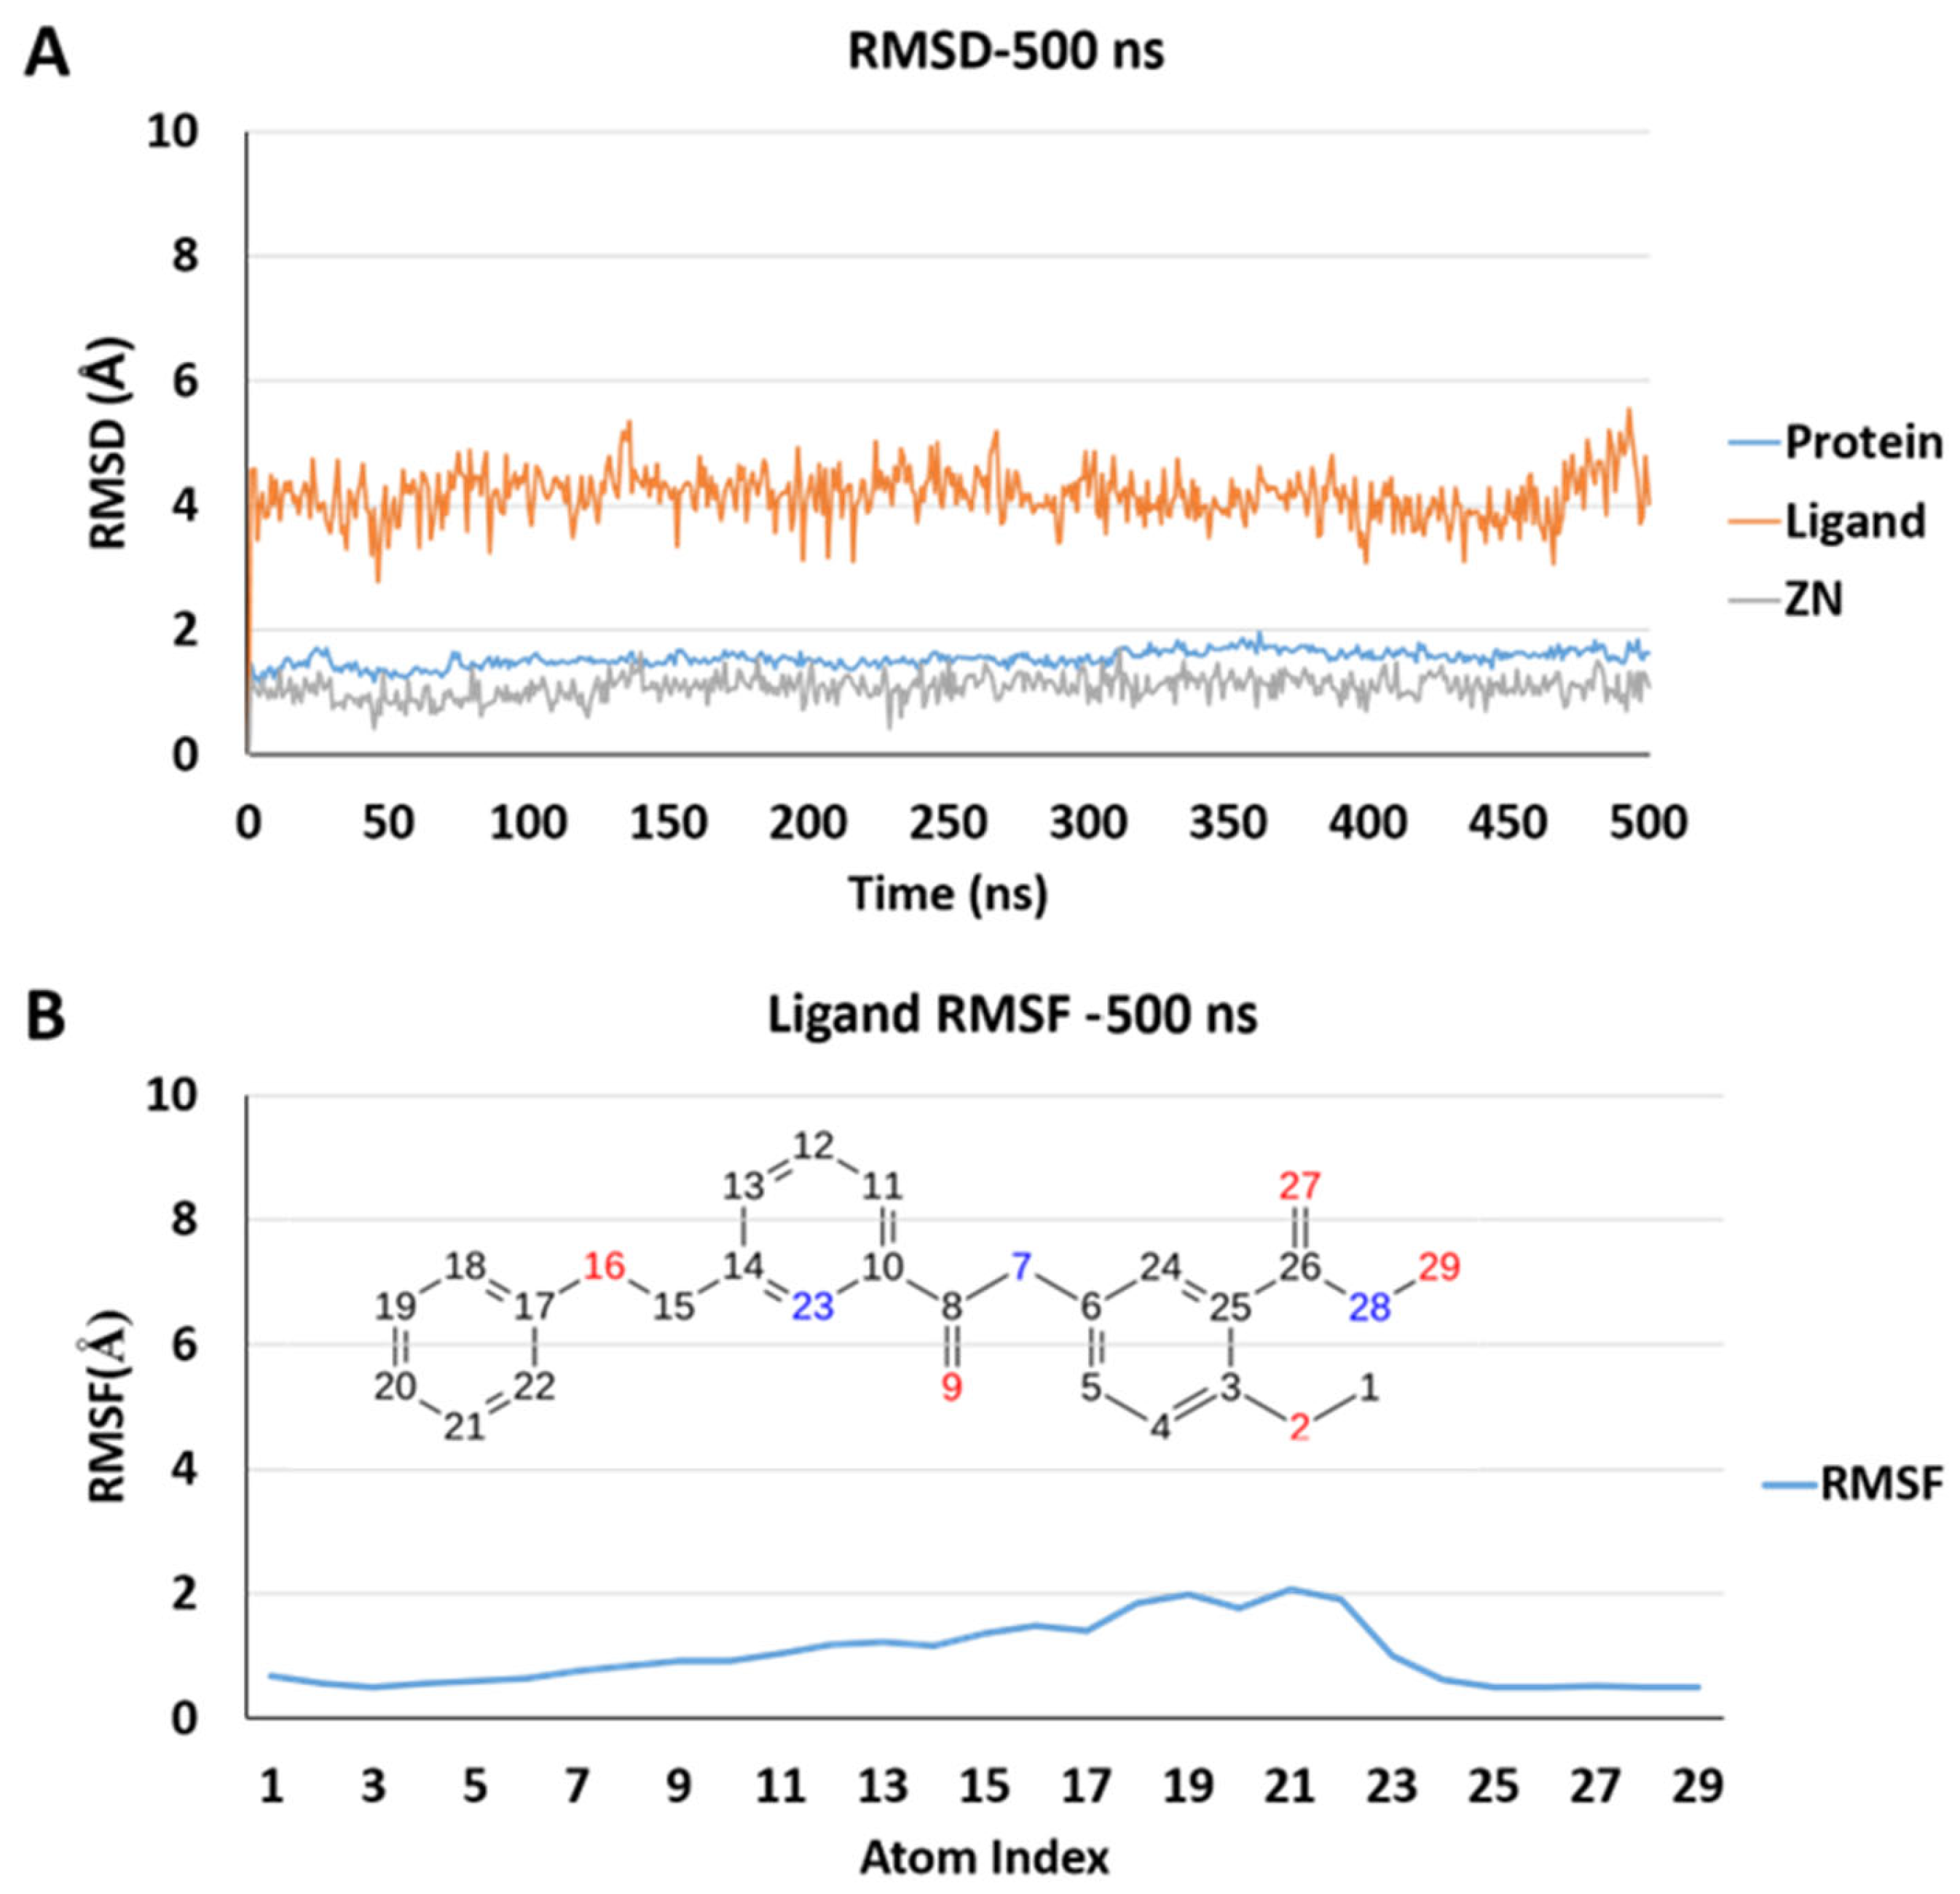
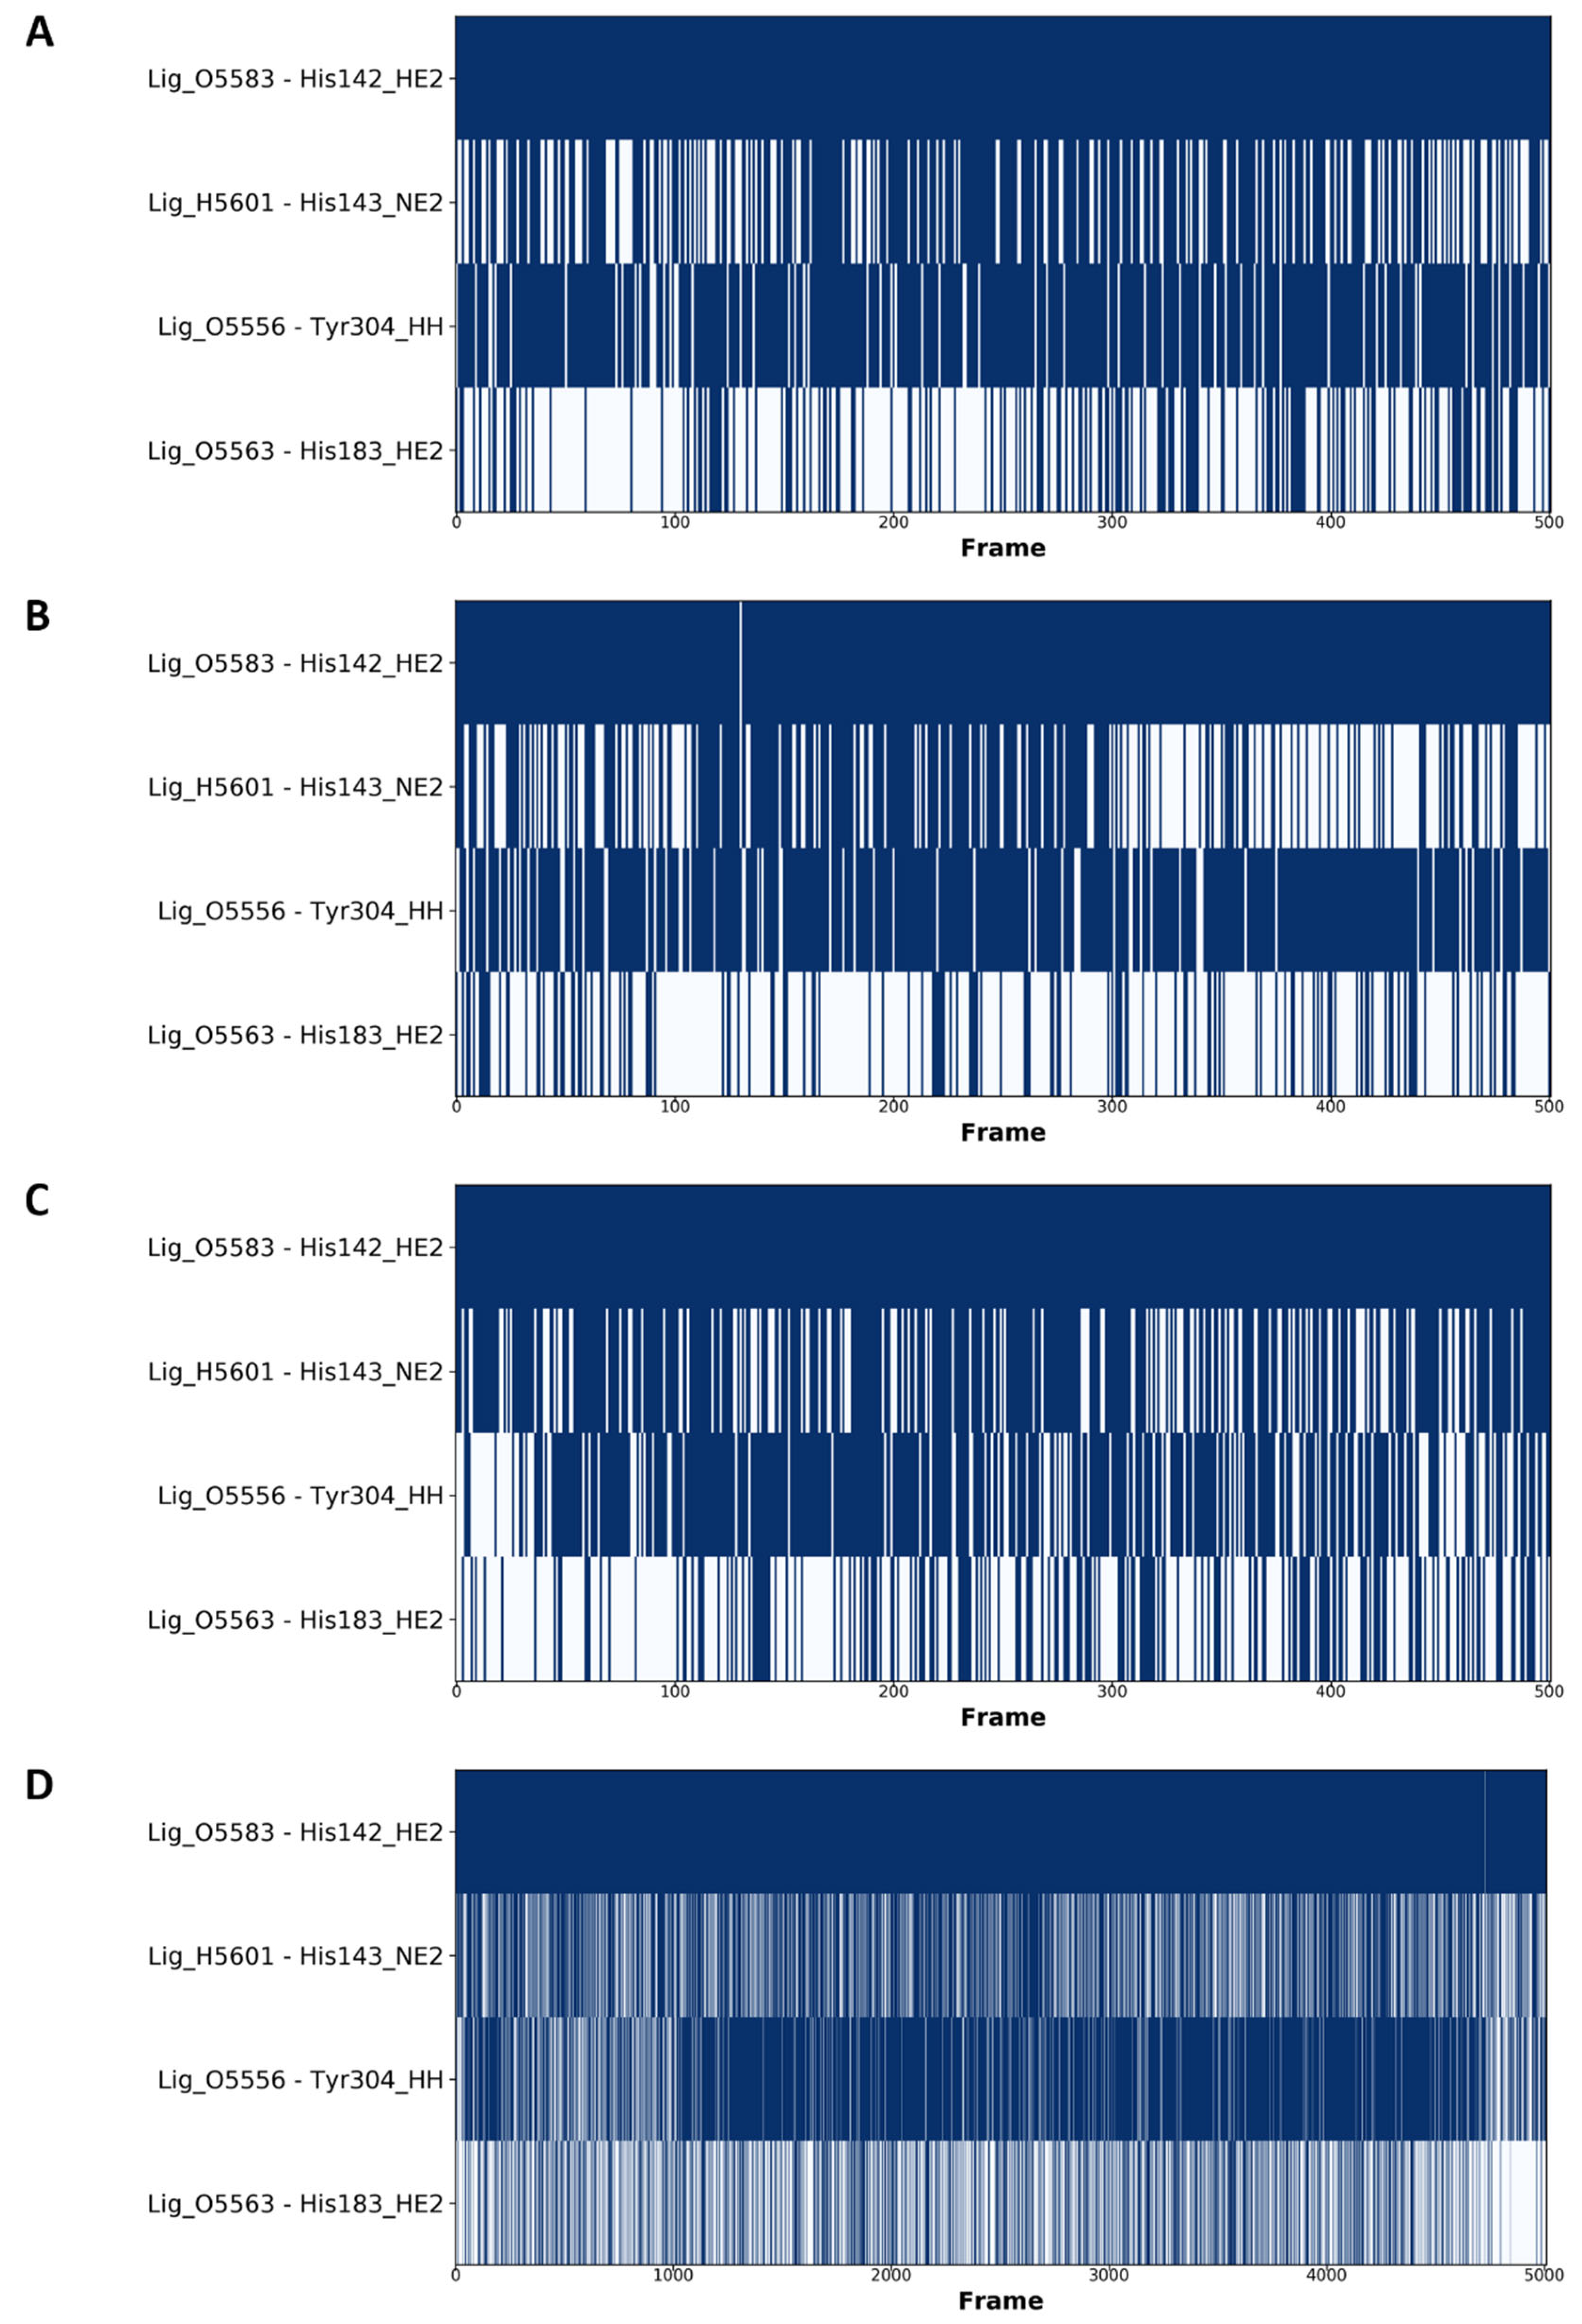
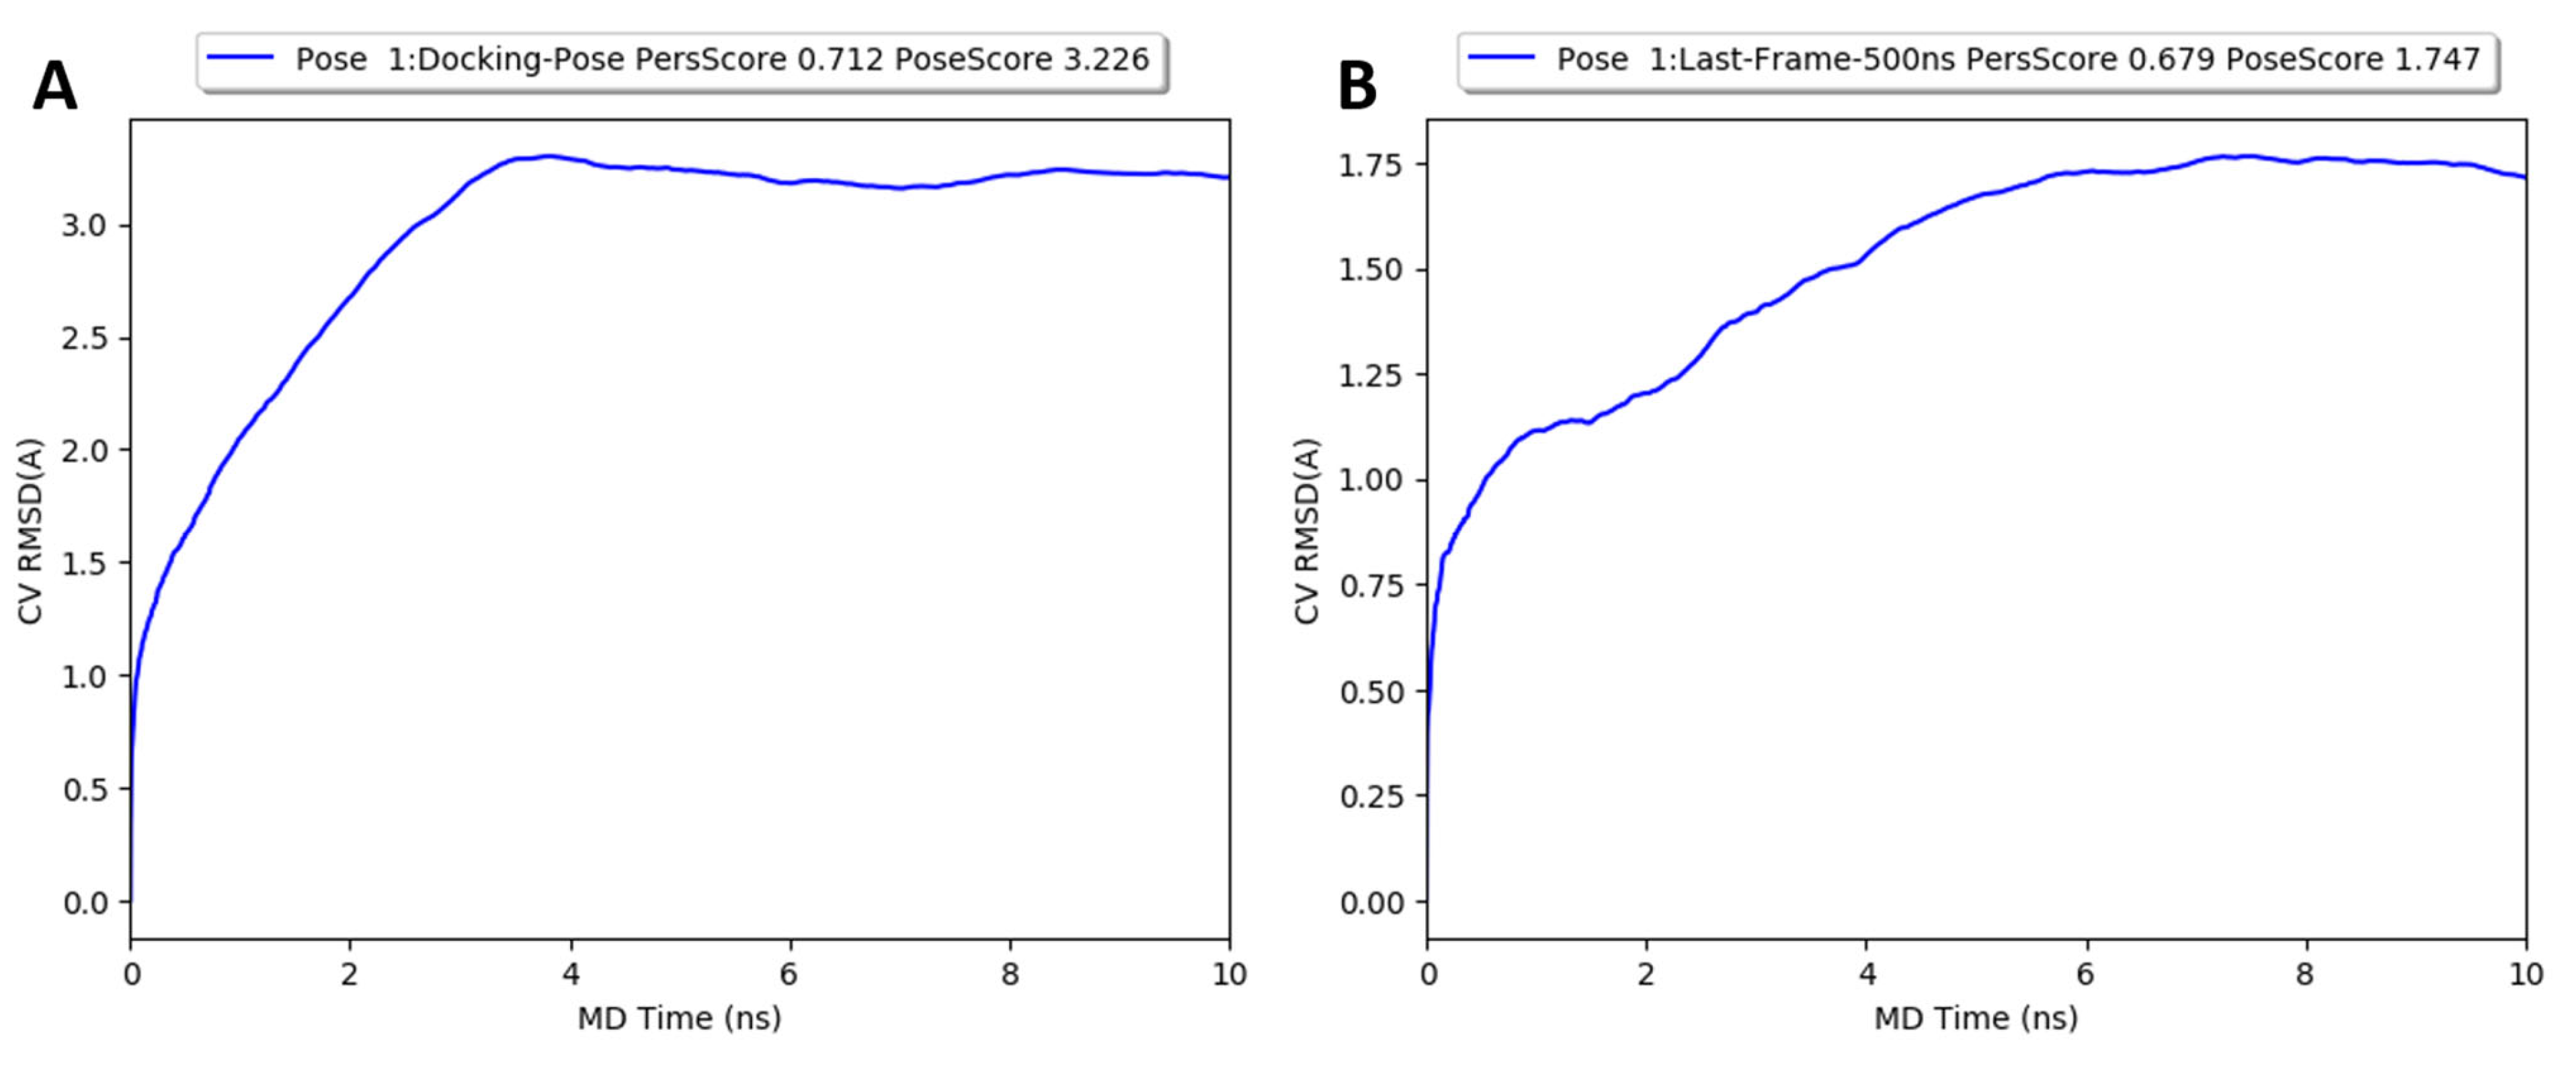
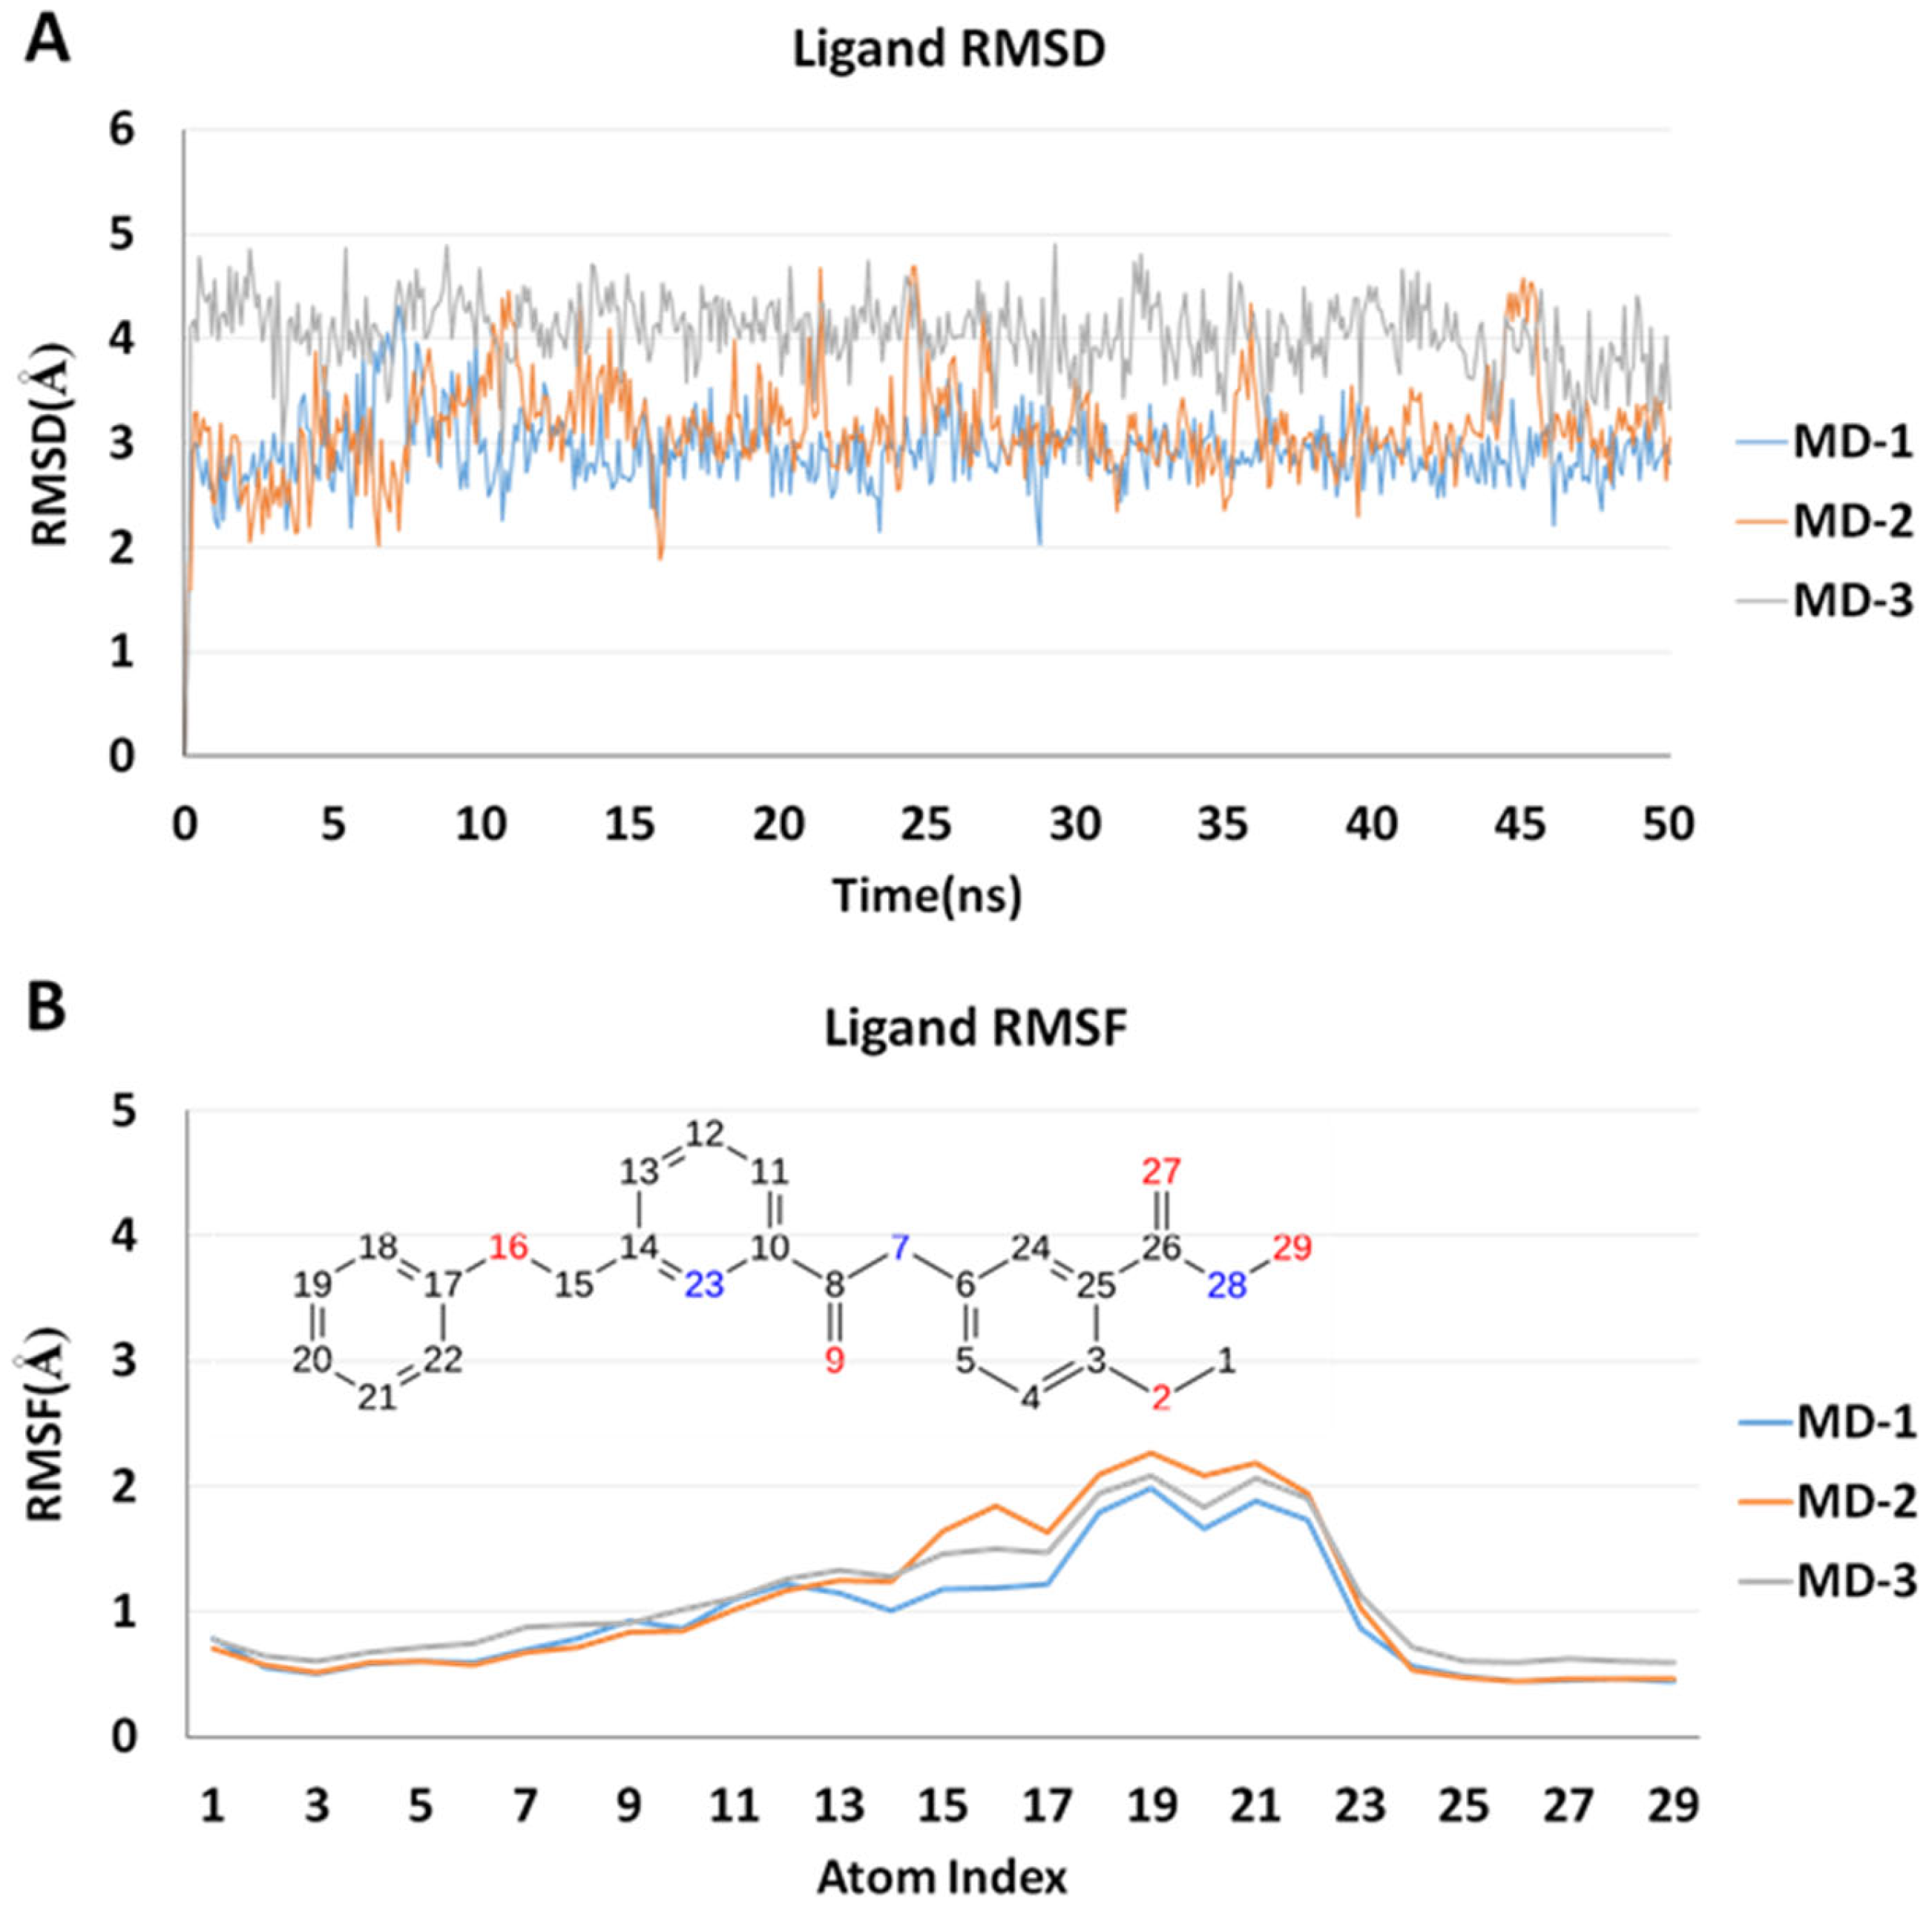
2.5. Molecular Dynamics Simulations
3. Materials and Methods
3.1. Protein Preparation
3.2. Grid Generation
3.3. Ligand Preparation
3.4. Database Acquiring and Curation
3.4.1. Acquiring Ligand Database
3.4.2. Ligand Preparation
3.4.3. Property Calculation
3.4.4. Database Filtering
3.5. Virtual Screening
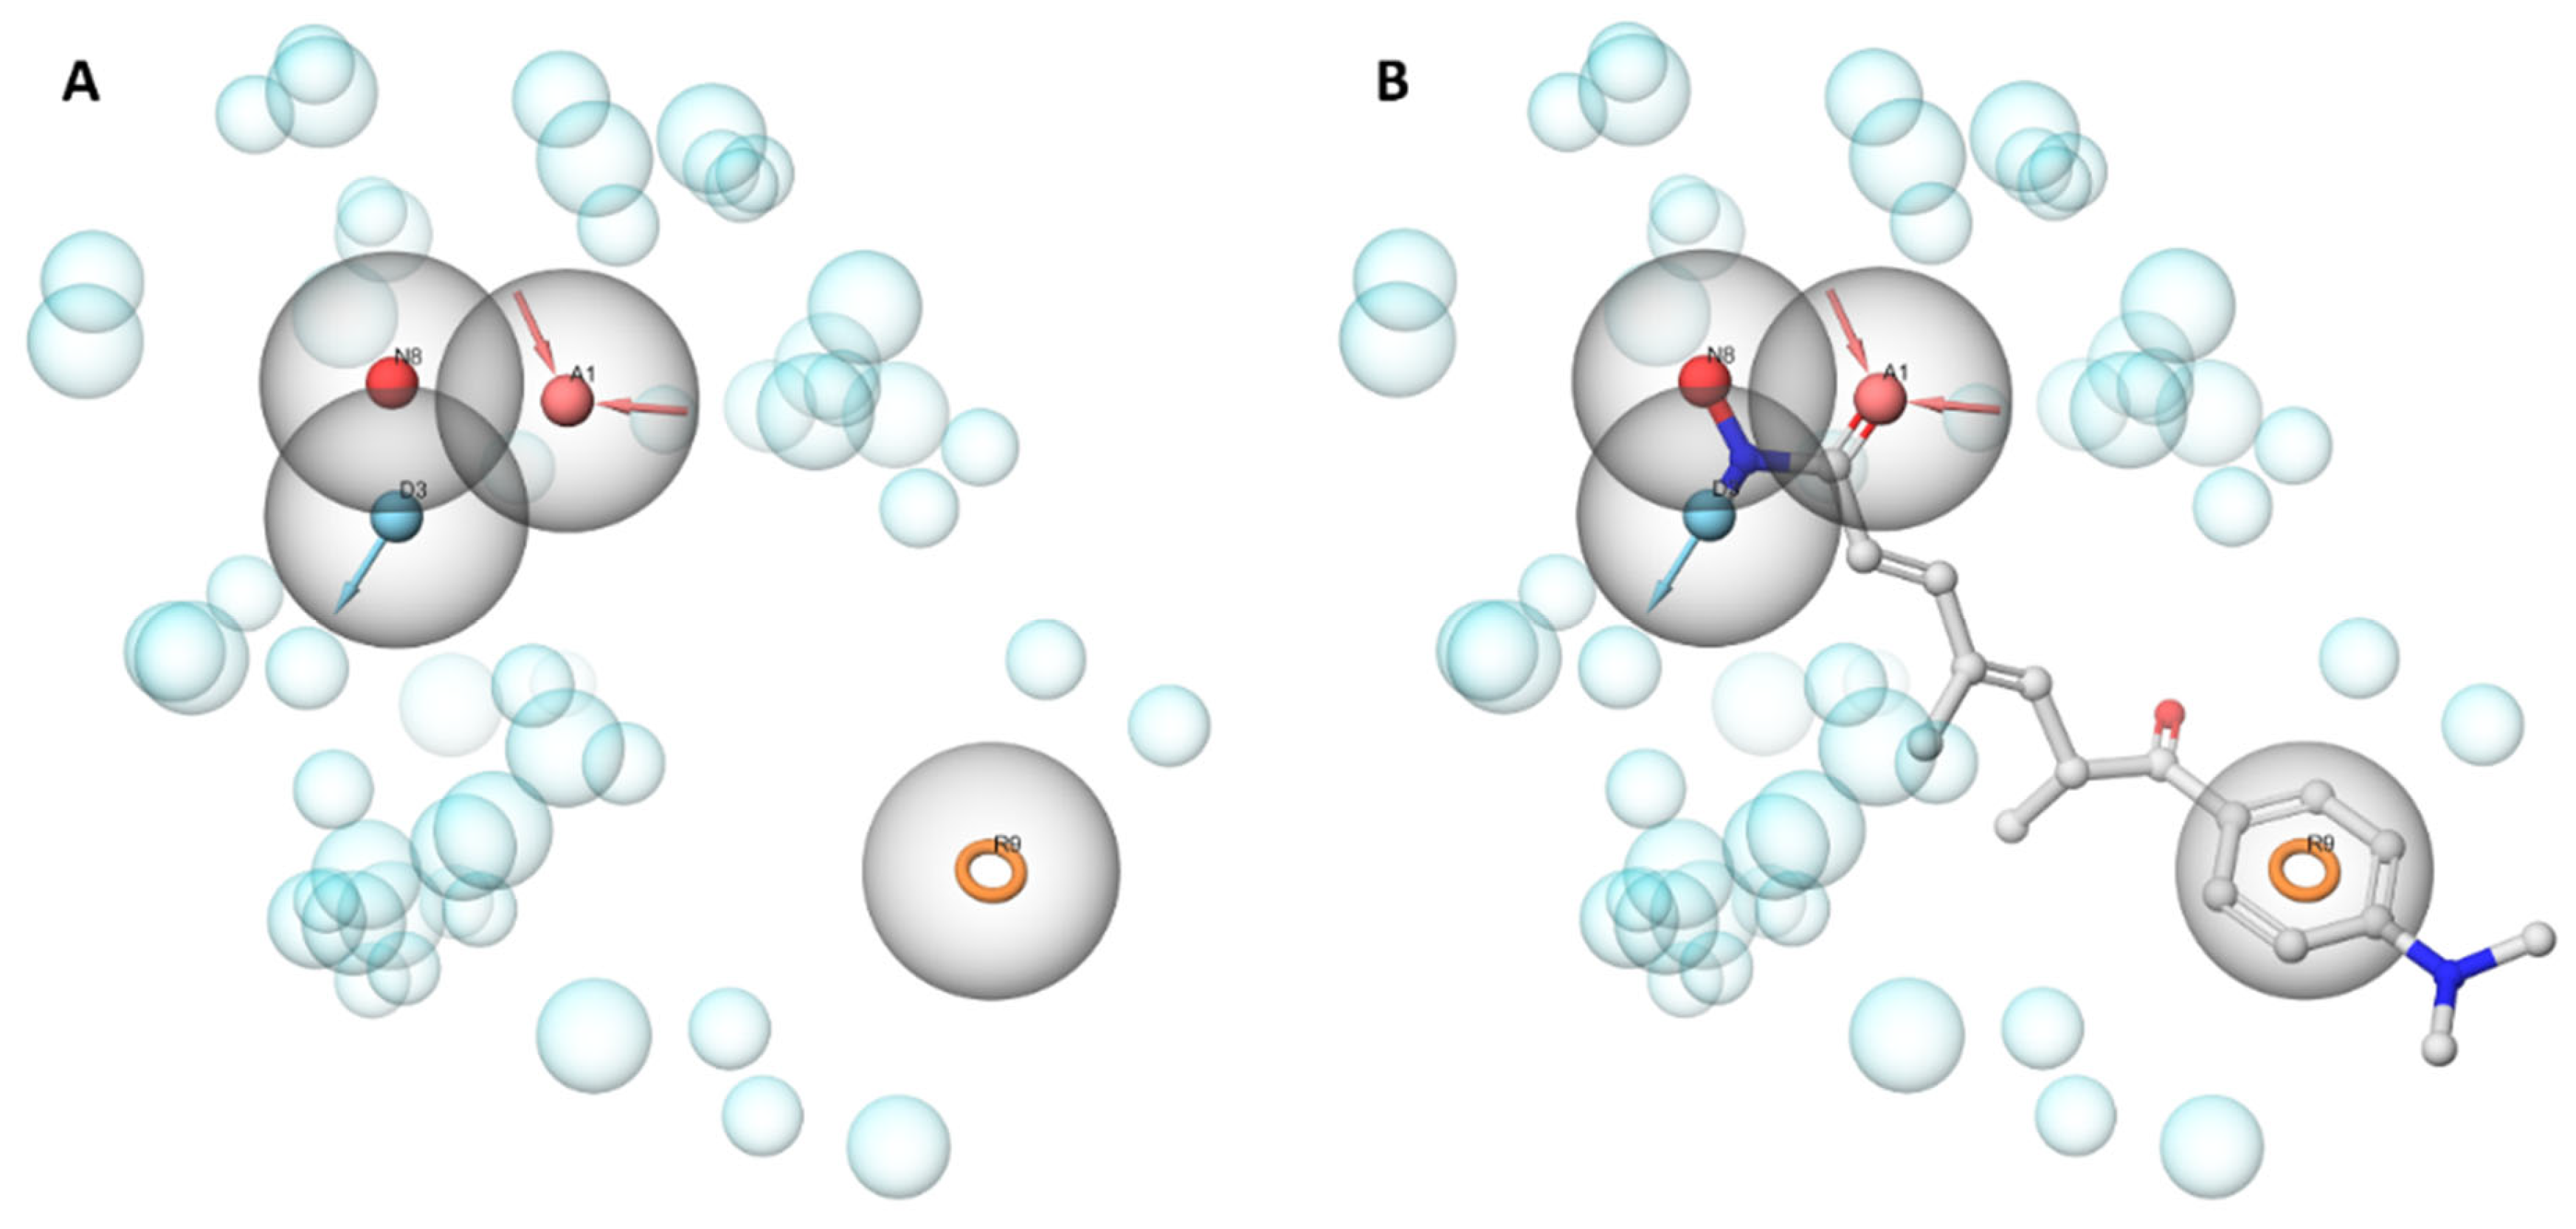
3.5.1. Structure-Based Pharmacophore Modeling
Pharmacophore Generation
Pharmacophore Screening
3.5.2. Docking into HDAC11 AlphaFold Model
3.5.3. Pose Filtering
3.5.4. Docking and Pose Filtering in Other HDACs’ Isoforms
| Isoform | PDB ID | Resolution | Organism | Bound Inhibitor |
| HDAC1 | 5ICN | 3.30 Å | Homo sapiens | Hydroxamic acid inhibitor |
| HDAC6 | 5EDU | 2.79 Å | Homo sapiens CD2 | Hydroxamic acid inhibitor |
| HDAC8 | 5FCW | 1.98 Å | Homo sapiens | Hydroxamic acid inhibitor |
Validation by Redocking of the Native Ligand
Docking and Pose Filtering
3.6. REOS Filtering and MM-GBSA Calculations
3.7. Molecular Dynamics Simulation
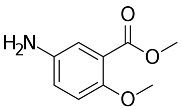
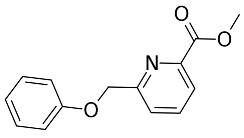
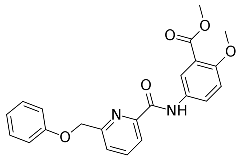
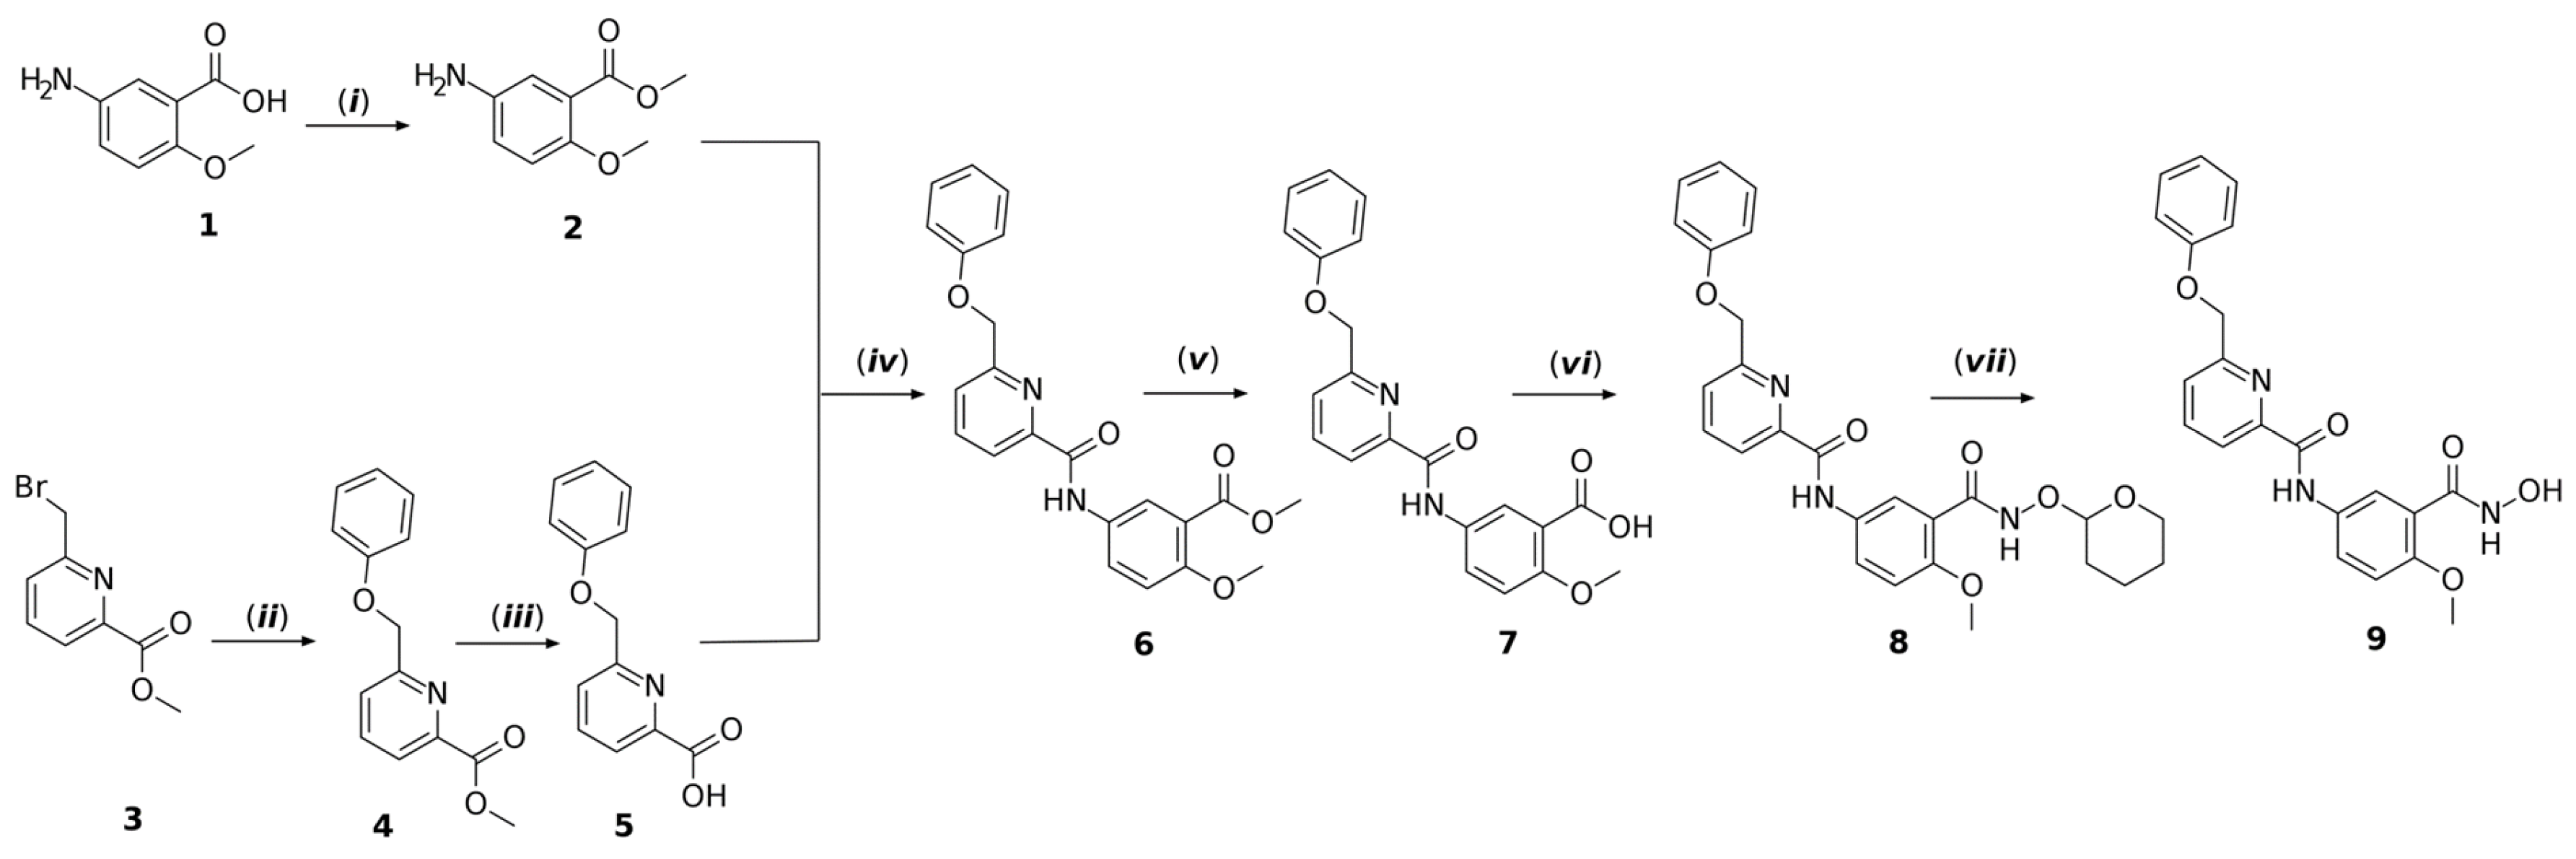
3.8. Chemistry
3.8.1. General
3.8.2. Synthesis Procedure


3.9. In Vitro Enzymatic Inhibition Evaluation
4. Conclusions
Supplementary Materials
Author Contributions
Funding
Institutional Review Board Statement
Informed Consent Statement
Data Availability Statement
Conflicts of Interest
References
- Lombardi, P.M.; Cole, K.E.; Dowling, D.P.; Christianson, D.W. Structure, mechanism, and inhibition of histone deacetylases and related metalloenzymes. Curr. Opin. Struct. Biol. 2011, 21, 735–743. [Google Scholar] [CrossRef]
- Marek, M.; Shaik, T.B.; Romier, C. Structural Biology of Epigenetic Targets: Exploiting Complexity. In Epigenetic Drug Discovery; Methods and Principles in Medicinal Chemistry; VCH-Wiley: Weinheim, Germany, 2019; pp. 11–44. [Google Scholar]
- Liu, S.-S.; Wu, F.; Jin, Y.-M.; Chang, W.-Q.; Xu, T.-M. HDAC11: A rising star in epigenetics. Biomed. Pharmacother. 2020, 131, 110607. [Google Scholar] [CrossRef]
- Gao, L.; Cueto, M.A.; Asselbergs, F.; Atadja, P. Cloning and functional characterization of HDAC11, a novel member of the human histone deacetylase family. J. Biol. Chem. 2002, 277, 25748–25755. [Google Scholar] [CrossRef]
- Boltz, T.A.; Khuri, S.; Wuchty, S. Promoter conservation in HDACs points to functional implications. BMC Genom. 2019, 20, 613. [Google Scholar] [CrossRef]
- Yanginlar, C.; Logie, C. HDAC11 is a regulator of diverse immune functions. Biochim. Biophys. Acta (BBA)-Gene Regul. Mech. 2018, 1861, 54–59. [Google Scholar] [CrossRef]
- Villagra, A.; Cheng, F.; Wang, H.W.; Suarez, I.; Glozak, M.; Maurin, M.; Nguyen, D.; Wright, K.L.; Atadja, P.W.; Bhalla, K.; et al. The histone deacetylase HDAC11 regulates the expression of interleukin 10 and immune tolerance. Nat. Immunol. 2009, 10, 92–100. [Google Scholar] [CrossRef]
- Glozak, M.A.; Seto, E. Acetylation/deacetylation modulates the stability of DNA replication licensing factor Cdt1. J. Biol. Chem. 2009, 284, 11446–11453. [Google Scholar] [CrossRef]
- Cao, J.; Sun, L.; Aramsangtienchai, P.; Spiegelman, N.A.; Zhang, X.; Huang, W.; Seto, E.; Lin, H. HDAC11 regulates type I interferon signaling through defatty-acylation of SHMT2. Proc. Natl. Acad. Sci. USA 2019, 116, 5487–5492. [Google Scholar] [CrossRef]
- Bagchi, R.A.; Ferguson, B.S.; Stratton, M.S.; Hu, T.; Cavasin, M.A.; Sun, L.; Lin, Y.H.; Liu, D.; Londono, P.; Song, K.; et al. HDAC11 suppresses the thermogenic program of adipose tissue via BRD2. JCI Insight 2018, 3, e120159. [Google Scholar] [CrossRef]
- Sun, L.; Marin de Evsikova, C.; Bian, K.; Achille, A.; Telles, E.; Pei, H.; Seto, E. Programming and Regulation of Metabolic Homeostasis by HDAC11. eBioMedicine 2018, 33, 157–168. [Google Scholar] [CrossRef] [PubMed]
- Fei, Q.; Song, F.; Jiang, X.; Hong, H.; Xu, X.; Jin, Z.; Zhu, X.; Dai, B.; Yang, J.; Sui, C.; et al. LncRNA ST8SIA6-AS1 promotes hepatocellular carcinoma cell proliferation and resistance to apoptosis by targeting miR-4656/HDAC11 axis. Cancer Cell Int. 2020, 20, 232. [Google Scholar] [CrossRef]
- Freese, K.; Seitz, T.; Dietrich, P.; Lee, S.M.L.; Thasler, W.E.; Bosserhoff, A.; Hellerbrand, C. Histone Deacetylase Expressions in Hepatocellular Carcinoma and Functional Effects of Histone Deacetylase Inhibitors on Liver Cancer Cells In Vitro. Cancers 2019, 11, 1587. [Google Scholar] [CrossRef]
- Gong, D.; Zeng, Z.; Yi, F.; Wu, J. Inhibition of histone deacetylase 11 promotes human liver cancer cell apoptosis. Am. J. Transl. Res. 2019, 11, 983–990. [Google Scholar]
- Huo, W.; Qi, F.; Wang, K. Long non-coding RNA BCYRN1 promotes prostate cancer progression via elevation of HDAC11. Oncol. Rep. 2020, 44, 1233–1245. [Google Scholar] [CrossRef]
- Wang, W.; Ding, B.; Lou, W.; Lin, S. Promoter Hypomethylation and miR-145-5p Downregulation-Mediated HDAC11 Overexpression Promotes Sorafenib Resistance and Metastasis of Hepatocellular Carcinoma Cells. Front. Cell Dev. Biol. 2020, 8, 724. [Google Scholar] [CrossRef]
- Wang, W.; Fu, L.; Li, S.; Xu, Z.; Li, X. Histone deacetylase 11 suppresses p53 expression in pituitary tumor cells. Cell Biol. Int. 2017, 41, 1290–1295. [Google Scholar] [CrossRef] [PubMed]
- Mithraprabhu, S.; Kalff, A.; Chow, A.; Khong, T.; Spencer, A. Dysregulated Class I histone deacetylases are indicators of poor prognosis in multiple myeloma. Epigenetics 2014, 9, 1511–1520. [Google Scholar] [CrossRef] [PubMed]
- Yue, L.; Sharma, V.; Horvat, N.P.; Akuffo, A.A.; Beatty, M.S.; Murdun, C.; Colin, C.; Billington, J.M.R.; Goodheart, W.E.; Sahakian, E.; et al. HDAC11 deficiency disrupts oncogene-induced hematopoiesis in myeloproliferative neoplasms. Blood 2020, 135, 191–207. [Google Scholar] [CrossRef] [PubMed]
- Thole, T.M.; Lodrini, M.; Fabian, J.; Wuenschel, J.; Pfeil, S.; Hielscher, T.; Kopp-Schneider, A.; Heinicke, U.; Fulda, S.; Witt, O.; et al. Neuroblastoma cells depend on HDAC11 for mitotic cell cycle progression and survival. Cell Death Dis. 2017, 8, e2635. [Google Scholar] [CrossRef]
- Kutil, Z.; Mikešová, J.; Zessin, M.; Meleshin, M.; Nováková, Z.; Alquicer, G.; Kozikowski, A.; Sippl, W.; Bařinka, C.; Schutkowski, M. Continuous Activity Assay for HDAC11 Enabling Reevaluation of HDAC Inhibitors. ACS Omega 2019, 4, 19895–19904. [Google Scholar] [CrossRef]
- Kutil, Z.; Novakova, Z.; Meleshin, M.; Mikesova, J.; Schutkowski, M.; Barinka, C. Histone Deacetylase 11 Is a Fatty-Acid Deacylase. ACS Chem. Biol. 2018, 13, 685–693. [Google Scholar] [CrossRef]
- Moreno-Yruela, C.; Galleano, I.; Madsen, A.S.; Olsen, C.A. Histone Deacetylase 11 Is an ε-N-Myristoyllysine Hydrolase. Cell Chem. Biol. 2018, 25, 849–856.e8. [Google Scholar] [CrossRef]
- Martin, M.W.; Lee, J.Y.; Lancia, D.R.; Ng, P.Y.; Han, B.; Thomason, J.R.; Lynes, M.S.; Marshall, C.G.; Conti, C.; Collis, A.; et al. Discovery of novel N-hydroxy-2-arylisoindoline-4-carboxamides as potent and selective inhibitors of HDAC11. Bioorg. Med. Chem. Lett. 2018, 28, 2143–2147. [Google Scholar] [CrossRef]
- Dallavalle, S.; Musso, L.; Cincinelli, R.; Darwiche, N.; Gervasoni, S.; Vistoli, G.; Guglielmi, M.B.; La Porta, I.; Pizzulo, M.; Modica, E.; et al. Antitumor activity of novel POLA1-HDAC11 dual inhibitors. Eur. J. Med. Chem. 2022, 228, 113971. [Google Scholar] [CrossRef]
- Bai, P.; Liu, Y.; Yang, L.; Ding, W.; Mondal, P.; Sang, N.; Liu, G.; Lu, X.; Ho, T.T.; Zhou, Y.; et al. Development and Pharmacochemical Characterization Discover a Novel Brain-Permeable HDAC11-Selective Inhibitor with Therapeutic Potential by Regulating Neuroinflammation in Mice. J. Med. Chem. 2023, 66, 16075–16090. [Google Scholar] [CrossRef]
- Bora-Singhal, N.; Mohankumar, D.; Saha, B.; Colin, C.M.; Lee, J.Y.; Martin, M.W.; Zheng, X.; Coppola, D.; Chellappan, S. Novel HDAC11 inhibitors suppress lung adenocarcinoma stem cell self-renewal and overcome drug resistance by suppressing Sox2. Sci. Rep. 2020, 10, 4722. [Google Scholar] [CrossRef]
- Son, S.I.; Cao, J.; Zhu, C.L.; Miller, S.P.; Lin, H. Activity-Guided Design of HDAC11-Specific Inhibitors. ACS Chem. Biol. 2019, 14, 1393–1397. [Google Scholar] [CrossRef]
- Sun, P.; Wang, J.; Khan, K.S.; Yang, W.; Ng, B.W.; Ilment, N.; Zessin, M.; Bülbül, E.F.; Robaa, D.; Erdmann, F.; et al. Development of Alkylated Hydrazides as Highly Potent and Selective Class I Histone Deacetylase Inhibitors with T cell Modulatory Properties. J. Med. Chem. 2022, 65, 16313–16337. [Google Scholar] [CrossRef]
- Pulya, S.; Himaja, A.; Paul, M.; Adhikari, N.; Banerjee, S.; Routholla, G.; Biswas, S.; Jha, T.; Ghosh, B. Selective HDAC3 Inhibitors with Potent In Vivo Antitumor Efficacy against Triple-Negative Breast Cancer. J. Med. Chem. 2023, 66, 12033–12058. [Google Scholar] [CrossRef] [PubMed]
- Ho, T.T.; Peng, C.; Seto, E.; Lin, H. Trapoxin A Analogue as a Selective Nanomolar Inhibitor of HDAC11. ACS Chem. Biol. 2023, 18, 803–809. [Google Scholar] [CrossRef] [PubMed]
- Baselious, F.; Robaa, D.; Sippl, W. Utilization of AlphaFold models for drug discovery: Feasibility and challenges. Histone deacetylase 11 as a case study. Comput. Biol. Med. 2023, 167, 107700. [Google Scholar] [CrossRef]
- Jumper, J.; Evans, R.; Pritzel, A.; Green, T.; Figurnov, M.; Ronneberger, O.; Tunyasuvunakool, K.; Bates, R.; Žídek, A.; Potapenko, A.; et al. Highly accurate protein structure prediction with AlphaFold. Nature 2021, 596, 583–589. [Google Scholar] [CrossRef]
- David, A.; Islam, S.; Tankhilevich, E.; Sternberg, M.J.E. The AlphaFold Database of Protein Structures: A Biologist’s Guide. J. Mol. Biol. 2022, 434, 167336. [Google Scholar] [CrossRef]
- Ren, F.; Ding, X.; Zheng, M.; Korzinkin, M.; Cai, X.; Zhu, W.; Mantsyzov, A.; Aliper, A.; Aladinskiy, V.; Cao, Z.; et al. AlphaFold accelerates artificial intelligence powered drug discovery: Efficient discovery of a novel CDK20 small molecule inhibitor. Chem. Sci. 2023, 14, 1443–1452. [Google Scholar] [CrossRef]
- Zhu, W.; Liu, X.; Li, Q.; Gao, F.; Liu, T.; Chen, X.; Zhang, M.; Aliper, A.; Ren, F.; Ding, X.; et al. Discovery of novel and selective SIK2 inhibitors by the application of AlphaFold structures and generative models. Bioorg. Med. Chem. 2023, 91, 117414. [Google Scholar] [CrossRef]
- Holcomb, M.; Chang, Y.T.; Goodsell, D.S.; Forli, S. Evaluation of AlphaFold2 structures as docking targets. Protein Sci. 2023, 32, e4530. [Google Scholar] [CrossRef]
- He, X.-H.; You, C.-Z.; Jiang, H.-L.; Jiang, Y.; Xu, H.E.; Cheng, X. AlphaFold2 versus experimental structures: Evaluation on G protein-coupled receptors. Acta Pharmacol. Sin. 2023, 44, 1–7. [Google Scholar] [CrossRef]
- Lee, S.; Kim, S.; Lee, G.R.; Kwon, S.; Woo, H.; Seok, C.; Park, H. Evaluating GPCR modeling and docking strategies in the era of deep learning-based protein structure prediction. Comput. Struct. Biotechnol. J. 2023, 21, 158–167. [Google Scholar] [CrossRef]
- Heo, L.; Feig, M. Multi-state modeling of G-protein coupled receptors at experimental accuracy. Proteins 2022, 90, 1873–1885. [Google Scholar] [CrossRef] [PubMed]
- Karelina, M.; Noh, J.J.; Dror, R.O. How accurately can one predict drug binding modes using AlphaFold models? eLife 2023, 12, RP89386. [Google Scholar] [CrossRef] [PubMed]
- Díaz-Rovira, A.M.; Martín, H.; Beuming, T.; Díaz, L.; Guallar, V.; Ray, S.S. Are Deep Learning Structural Models Sufficiently Accurate for Virtual Screening? Application of Docking Algorithms to AlphaFold2 Predicted Structures. J. Chem. Inf. Model. 2023, 63, 1668–1674. [Google Scholar] [CrossRef]
- Scardino, V.; Di Filippo, J.I.; Cavasotto, C.N. How good are AlphaFold models for docking-based virtual screening? iScience 2023, 26, 105920. [Google Scholar] [CrossRef]
- Zhang, Y.; Vass, M.; Shi, D.; Abualrous, E.; Chambers, J.M.; Chopra, N.; Higgs, C.; Kasavajhala, K.; Li, H.; Nandekar, P.; et al. Benchmarking Refined and Unrefined AlphaFold2 Structures for Hit Discovery. J. Chem. Inf. Model. 2023, 63, 1656–1667. [Google Scholar] [CrossRef]
- Melesina, J.; Simoben, C.V.; Praetorius, L.; Bülbül, E.F.; Robaa, D.; Sippl, W. Strategies To Design Selective Histone Deacetylase Inhibitors. ChemMedChem 2021, 16, 1336–1359. [Google Scholar] [CrossRef]
- Zhang, L.; Zhang, J.; Jiang, Q.; Zhang, L.; Song, W. Zinc binding groups for histone deacetylase inhibitors. J. Enzym. Inhib. Med. Chem. 2018, 33, 714–721. [Google Scholar] [CrossRef]
- De Vreese, R.; D’Hooghe, M. Synthesis and applications of benzohydroxamic acid-based histone deacetylase inhibitors. Eur. J. Med. Chem. 2017, 135, 174–195. [Google Scholar] [CrossRef]
- Hu, Z.; Wei, F.; Su, Y.; Wang, Y.; Shen, Y.; Fang, Y.; Ding, J.; Chen, Y. Histone deacetylase inhibitors promote breast cancer metastasis by elevating NEDD9 expression. Signal Transduct. Target. Ther. 2023, 8, 11. [Google Scholar] [CrossRef]
- Irwin, J.J.; Tang, K.G.; Young, J.; Dandarchuluun, C.; Wong, B.R.; Khurelbaatar, M.; Moroz, Y.S.; Mayfield, J.; Sayle, R.A. ZINC20—A Free Ultralarge-Scale Chemical Database for Ligand Discovery. J. Chem. Inf. Model. 2020, 60, 6065–6073. [Google Scholar] [CrossRef] [PubMed]
- Lipinski, C.A.; Lombardo, F.; Dominy, B.W.; Feeney, P.J. Experimental and computational approaches to estimate solubility and permeability in drug discovery and development settings. Adv. Drug Deliv. Rev. 2001, 46, 3–26. [Google Scholar] [CrossRef] [PubMed]
- Kumari, S.; Chakraborty, S.; Ahmad, M.; Kumar, V.; Tailor, P.B.; Biswal, B.K. Identification of probable inhibitors for the DNA polymerase of the Monkeypox virus through the virtual screening approach. Int. J. Biol. Macromol. 2023, 229, 515–528. [Google Scholar] [CrossRef] [PubMed]
- Walters, W.P.; Stahl, M.T.; Murcko, M.A. Virtual screening—An overview. Drug Discov. Today 1998, 3, 160–178. [Google Scholar] [CrossRef]
- Walters, W.P.; Namchuk, M. Designing screens: How to make your hits a hit. Nat. Rev. Drug Discov. 2003, 2, 259–266. [Google Scholar] [CrossRef]
- Dan, A.; Shiyama, T.; Yamazaki, K.; Kusunose, N.; Fujita, K.; Sato, H.; Matsui, K.; Kitano, M. Discovery of hydroxamic acid analogs as dual inhibitors of phosphodiesterase-1 and -5. Bioorg. Med. Chem. Lett. 2005, 15, 4085–4090. [Google Scholar] [CrossRef]
- Heimburg, T.; Kolbinger, F.R.; Zeyen, P.; Ghazy, E.; Herp, D.; Schmidtkunz, K.; Melesina, J.; Shaik, T.B.; Erdmann, F.; Schmidt, M.; et al. Structure-Based Design and Biological Characterization of Selective Histone Deacetylase 8 (HDAC8) Inhibitors with Anti-Neuroblastoma Activity. J. Med. Chem. 2017, 60, 10188–10204. [Google Scholar] [CrossRef]
- Marek, M.; Ramos-Morales, E.; Picchi-Constante, G.F.A.; Bayer, T.; Norström, C.; Herp, D.; Sales-Junior, P.A.; Guerra-Slompo, E.P.; Hausmann, K.; Chakrabarti, A.; et al. Species-selective targeting of pathogens revealed by the atypical structure and active site of Trypanosoma cruzi histone deacetylase DAC2. Cell Rep. 2021, 37, 110129. [Google Scholar] [CrossRef]
- Barducci, A.; Bonomi, M.; Parrinello, M. Metadynamics. WIREs Comput. Mol. Sci. 2011, 1, 826–843. [Google Scholar] [CrossRef]
- Fusani, L.; Palmer, D.S.; Somers, D.O.; Wall, I.D. Exploring Ligand Stability in Protein Crystal Structures Using Binding Pose Metadynamics. J. Chem. Inf. Model. 2020, 60, 1528–1539. [Google Scholar] [CrossRef]
- Clark, A.J.; Tiwary, P.; Borrelli, K.; Feng, S.; Miller, E.B.; Abel, R.; Friesner, R.A.; Berne, B.J. Prediction of Protein–Ligand Binding Poses via a Combination of Induced Fit Docking and Metadynamics Simulations. J. Chem. Theory Comput. 2016, 12, 2990–2998. [Google Scholar] [CrossRef]
- Maestro Schrödinger Release 2019-1; Schrödinger, LLC: New York, NY, USA, 2019.
- Sastry, G.M.; Adzhigirey, M.; Day, T.; Annabhimoju, R.; Sherman, W. Protein and ligand preparation: Parameters, protocols, and influence on virtual screening enrichments. J. Comput. Aided Mol. Des. 2013, 27, 221–234. [Google Scholar] [CrossRef]
- Protein Preparation Wizard Schrödinger Release 2019-1; Schrödinger, LLC: New York, NY, USA, 2019.
- Jacobson, M.P.; Pincus, D.L.; Rapp, C.S.; Day, T.J.; Honig, B.; Shaw, D.E.; Friesner, R.A. A hierarchical approach to all-atom protein loop prediction. Proteins 2004, 55, 351–367. [Google Scholar] [CrossRef]
- Jacobson, M.P.; Friesner, R.A.; Xiang, Z.; Honig, B. On the role of the crystal environment in determining protein side-chain conformations. J. Mol. Biol. 2002, 320, 597–608. [Google Scholar] [CrossRef] [PubMed]
- Prime Schrödinger Release 2019-1; Prime, Schrödinger, LLC: New York, NY, USA, 2019.
- Greenwood, J.R.; Calkins, D.; Sullivan, A.P.; Shelley, J.C. Towards the comprehensive, rapid, and accurate prediction of the favorable tautomeric states of drug-like molecules in aqueous solution. J. Comput. Aided Mol. Des. 2010, 24, 591–604. [Google Scholar] [CrossRef] [PubMed]
- Shelley, J.C.; Cholleti, A.; Frye, L.L.; Greenwood, J.R.; Timlin, M.R.; Uchimaya, M. Epik: A software program for pK(a) prediction and protonation state generation for drug-like molecules. J. Comput. Aided Mol. Des. 2007, 21, 681–691. [Google Scholar] [CrossRef] [PubMed]
- Epik Schrödinger Release 2019-1; Schrödinger, LLC: New York, NY, USA, 2019.
- Ghazy, E.; Heimburg, T.; Lancelot, J.; Zeyen, P.; Schmidtkunz, K.; Truhn, A.; Darwish, S.; Simoben, C.V.; Shaik, T.B.; Erdmann, F.; et al. Synthesis, structure-activity relationships, cocrystallization and cellular characterization of novel smHDAC8 inhibitors for the treatment of schistosomiasis. Eur. J. Med. Chem. 2021, 225, 113745. [Google Scholar] [CrossRef] [PubMed]
- Ghazy, E.; Zeyen, P.; Herp, D.; Hügle, M.; Schmidtkunz, K.; Erdmann, F.; Robaa, D.; Schmidt, M.; Morales, E.R.; Romier, C.; et al. Design, synthesis, and biological evaluation of dual targeting inhibitors of histone deacetylase 6/8 and bromodomain BRPF1. Eur. J. Med. Chem. 2020, 200, 112338. [Google Scholar] [CrossRef]
- Marek, M.; Shaik, T.B.; Heimburg, T.; Chakrabarti, A.; Lancelot, J.; Ramos-Morales, E.; Da Veiga, C.; Kalinin, D.; Melesina, J.; Robaa, D.; et al. Characterization of Histone Deacetylase 8 (HDAC8) Selective Inhibition Reveals Specific Active Site Structural and Functional Determinants. J. Med. Chem. 2018, 61, 10000–10016. [Google Scholar] [CrossRef]
- Vögerl, K.; Ong, N.; Senger, J.; Herp, D.; Schmidtkunz, K.; Marek, M.; Müller, M.; Bartel, K.; Shaik, T.B.; Porter, N.J.; et al. Synthesis and Biological Investigation of Phenothiazine-Based Benzhydroxamic Acids as Selective Histone Deacetylase 6 Inhibitors. J. Med. Chem. 2019, 62, 1138–1166. [Google Scholar] [CrossRef]
- LigPrep Schrödinger Release 2019-1; Schrödinger, LLC: New York, NY, USA, 2019.
- Harder, E.; Damm, W.; Maple, J.; Wu, C.; Reboul, M.; Xiang, J.Y.; Wang, L.; Lupyan, D.; Dahlgren, M.K.; Knight, J.L.; et al. OPLS3: A Force Field Providing Broad Coverage of Drug-like Small Molecules and Proteins. J. Chem. Theory Comput. 2016, 12, 281–296. [Google Scholar] [CrossRef]
- Shivakumar, D.; Williams, J.; Wu, Y.; Damm, W.; Shelley, J.; Sherman, W. Prediction of Absolute Solvation Free Energies using Molecular Dynamics Free Energy Perturbation and the OPLS Force Field. J. Chem. Theory Comput. 2010, 6, 1509–1519. [Google Scholar] [CrossRef]
- Jorgensen, W.L.; Maxwell, D.S.; Tirado-Rives, J. Development and Testing of the OPLS All-Atom Force Field on Conformational Energetics and Properties of Organic Liquids. J. Am. Chem. Soc. 1996, 118, 11225–11236. [Google Scholar] [CrossRef]
- Jorgensen, W.L.; Tirado-Rives, J. The OPLS [optimized potentials for liquid simulations] potential functions for proteins, energy minimizations for crystals of cyclic peptides and crambin. J. Am. Chem. Soc. 1988, 110, 1657–1666. [Google Scholar] [CrossRef] [PubMed]
- QikProp Schrödinger Release 2019-1; Schrödinger, LLC: New York, NY, USA, 2019.
- Salam, N.K.; Nuti, R.; Sherman, W. Novel method for generating structure-based pharmacophores using energetic analysis. J. Chem. Inf. Model. 2009, 49, 2356–2368. [Google Scholar] [CrossRef] [PubMed]
- Loving, K.; Salam, N.K.; Sherman, W. Energetic analysis of fragment docking and application to structure-based pharmacophore hypothesis generation. J. Comput. Aided Mol. Des. 2009, 23, 541–554. [Google Scholar] [CrossRef]
- Dixon, S.L.; Smondyrev, A.M.; Knoll, E.H.; Rao, S.N.; Shaw, D.E.; Friesner, R.A. PHASE: A new engine for pharmacophore perception, 3D QSAR model development, and 3D database screening: 1. Methodology and preliminary results. J. Comput. Aided Mol. Des. 2006, 20, 647–671. [Google Scholar] [CrossRef] [PubMed]
- Dixon, S.L.; Smondyrev, A.M.; Rao, S.N. PHASE: A Novel Approach to Pharmacophore Modeling and 3D Database Searching. Chem. Biol. Drug Des. 2006, 67, 370–372. [Google Scholar] [CrossRef] [PubMed]
- Phase Schrödinger Release 2019-1; Schrödinger, LLC: New York, NY, USA, 2019.
- Friesner, R.A.; Murphy, R.B.; Repasky, M.P.; Frye, L.L.; Greenwood, J.R.; Halgren, T.A.; Sanschagrin, P.C.; Mainz, D.T. Extra precision glide: Docking and scoring incorporating a model of hydrophobic enclosure for protein-ligand complexes. J. Med. Chem. 2006, 49, 6177–6196. [Google Scholar] [CrossRef] [PubMed]
- Friesner, R.A.; Banks, J.L.; Murphy, R.B.; Halgren, T.A.; Klicic, J.J.; Mainz, D.T.; Repasky, M.P.; Knoll, E.H.; Shelley, M.; Perry, J.K.; et al. Glide: A new approach for rapid, accurate docking and scoring. 1. Method and assessment of docking accuracy. J. Med. Chem. 2004, 47, 1739–1749. [Google Scholar] [CrossRef]
- Halgren, T.A.; Murphy, R.B.; Friesner, R.A.; Beard, H.S.; Frye, L.L.; Pollard, W.T.; Banks, J.L. Glide: A New Approach for Rapid, Accurate Docking and Scoring. 2. Enrichment Factors in Database Screening. J. Med. Chem. 2004, 47, 1750–1759. [Google Scholar] [CrossRef]
- Glide Schrödinger Release 2019-1; Schrödinger, LLC: New York, NY, USA, 2019.
- Duan, J.; Dixon, S.L.; Lowrie, J.F.; Sherman, W. Analysis and comparison of 2D fingerprints: Insights into database screening performance using eight fingerprint methods. J. Mol. Graph. Model. 2010, 29, 157–170. [Google Scholar] [CrossRef]
- Sastry, M.; Lowrie, J.F.; Dixon, S.L.; Sherman, W. Large-Scale Systematic Analysis of 2D Fingerprint Methods and Parameters to Improve Virtual Screening Enrichments. J. Chem. Inf. Model. 2010, 50, 771–784. [Google Scholar] [CrossRef]
- Canvas Schrödinger Release 2019-1; Schrödinger, LLC: New York, NY, USA, 2019.
- Bowers, K.J.; Chow, D.E.; Xu, H.; Dror, R.O.; Eastwood, M.P.; Gregersen, B.A.; Klepeis, J.L.; Kolossvary, I.; Moraes, M.A.; Sacerdoti, F.D.; et al. Scalable Algorithms for Molecular Dynamics Simulations on Commodity Clusters. In Proceedings of the SC’06: Proceedings of the 2006 ACM/IEEE Conference on Supercomputing, Tampa, FL, USA, 11–17 November 2006; p. 43. [Google Scholar]
- Desmond Schrödinger Release 2019-1; Schrödinger LLC: New York, NY, USA, 2019.
- Zessin, M.; Kutil, Z.; Meleshin, M.; Nováková, Z.; Ghazy, E.; Kalbas, D.; Marek, M.; Romier, C.; Sippl, W.; Bařinka, C.; et al. One-Atom Substitution Enables Direct and Continuous Monitoring of Histone Deacylase Activity. Biochemistry 2019, 58, 4777–4789. [Google Scholar] [CrossRef] [PubMed]


| Title | Structure | MM-GBSA dG Bind |
|---|---|---|
| ZINC000028464438 (9) |  | −49.76 |
| ZINC000671998736 | 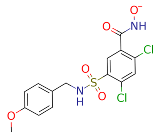 | −39.75 |
| ZINC000742823399 | 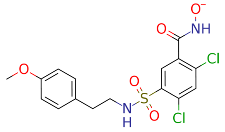 | −48.68 |
| ZINC000916666211 | 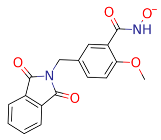 | −48.21 |
| ZINC000916666264 | 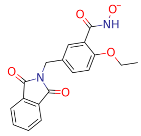 | −41.45 |
Disclaimer/Publisher’s Note: The statements, opinions and data contained in all publications are solely those of the individual author(s) and contributor(s) and not of MDPI and/or the editor(s). MDPI and/or the editor(s) disclaim responsibility for any injury to people or property resulting from any ideas, methods, instructions or products referred to in the content. |
© 2024 by the authors. Licensee MDPI, Basel, Switzerland. This article is an open access article distributed under the terms and conditions of the Creative Commons Attribution (CC BY) license (https://creativecommons.org/licenses/by/4.0/).
Share and Cite
Baselious, F.; Hilscher, S.; Robaa, D.; Barinka, C.; Schutkowski, M.; Sippl, W. Comparative Structure-Based Virtual Screening Utilizing Optimized AlphaFold Model Identifies Selective HDAC11 Inhibitor. Int. J. Mol. Sci. 2024, 25, 1358. https://doi.org/10.3390/ijms25021358
Baselious F, Hilscher S, Robaa D, Barinka C, Schutkowski M, Sippl W. Comparative Structure-Based Virtual Screening Utilizing Optimized AlphaFold Model Identifies Selective HDAC11 Inhibitor. International Journal of Molecular Sciences. 2024; 25(2):1358. https://doi.org/10.3390/ijms25021358
Chicago/Turabian StyleBaselious, Fady, Sebastian Hilscher, Dina Robaa, Cyril Barinka, Mike Schutkowski, and Wolfgang Sippl. 2024. "Comparative Structure-Based Virtual Screening Utilizing Optimized AlphaFold Model Identifies Selective HDAC11 Inhibitor" International Journal of Molecular Sciences 25, no. 2: 1358. https://doi.org/10.3390/ijms25021358
APA StyleBaselious, F., Hilscher, S., Robaa, D., Barinka, C., Schutkowski, M., & Sippl, W. (2024). Comparative Structure-Based Virtual Screening Utilizing Optimized AlphaFold Model Identifies Selective HDAC11 Inhibitor. International Journal of Molecular Sciences, 25(2), 1358. https://doi.org/10.3390/ijms25021358