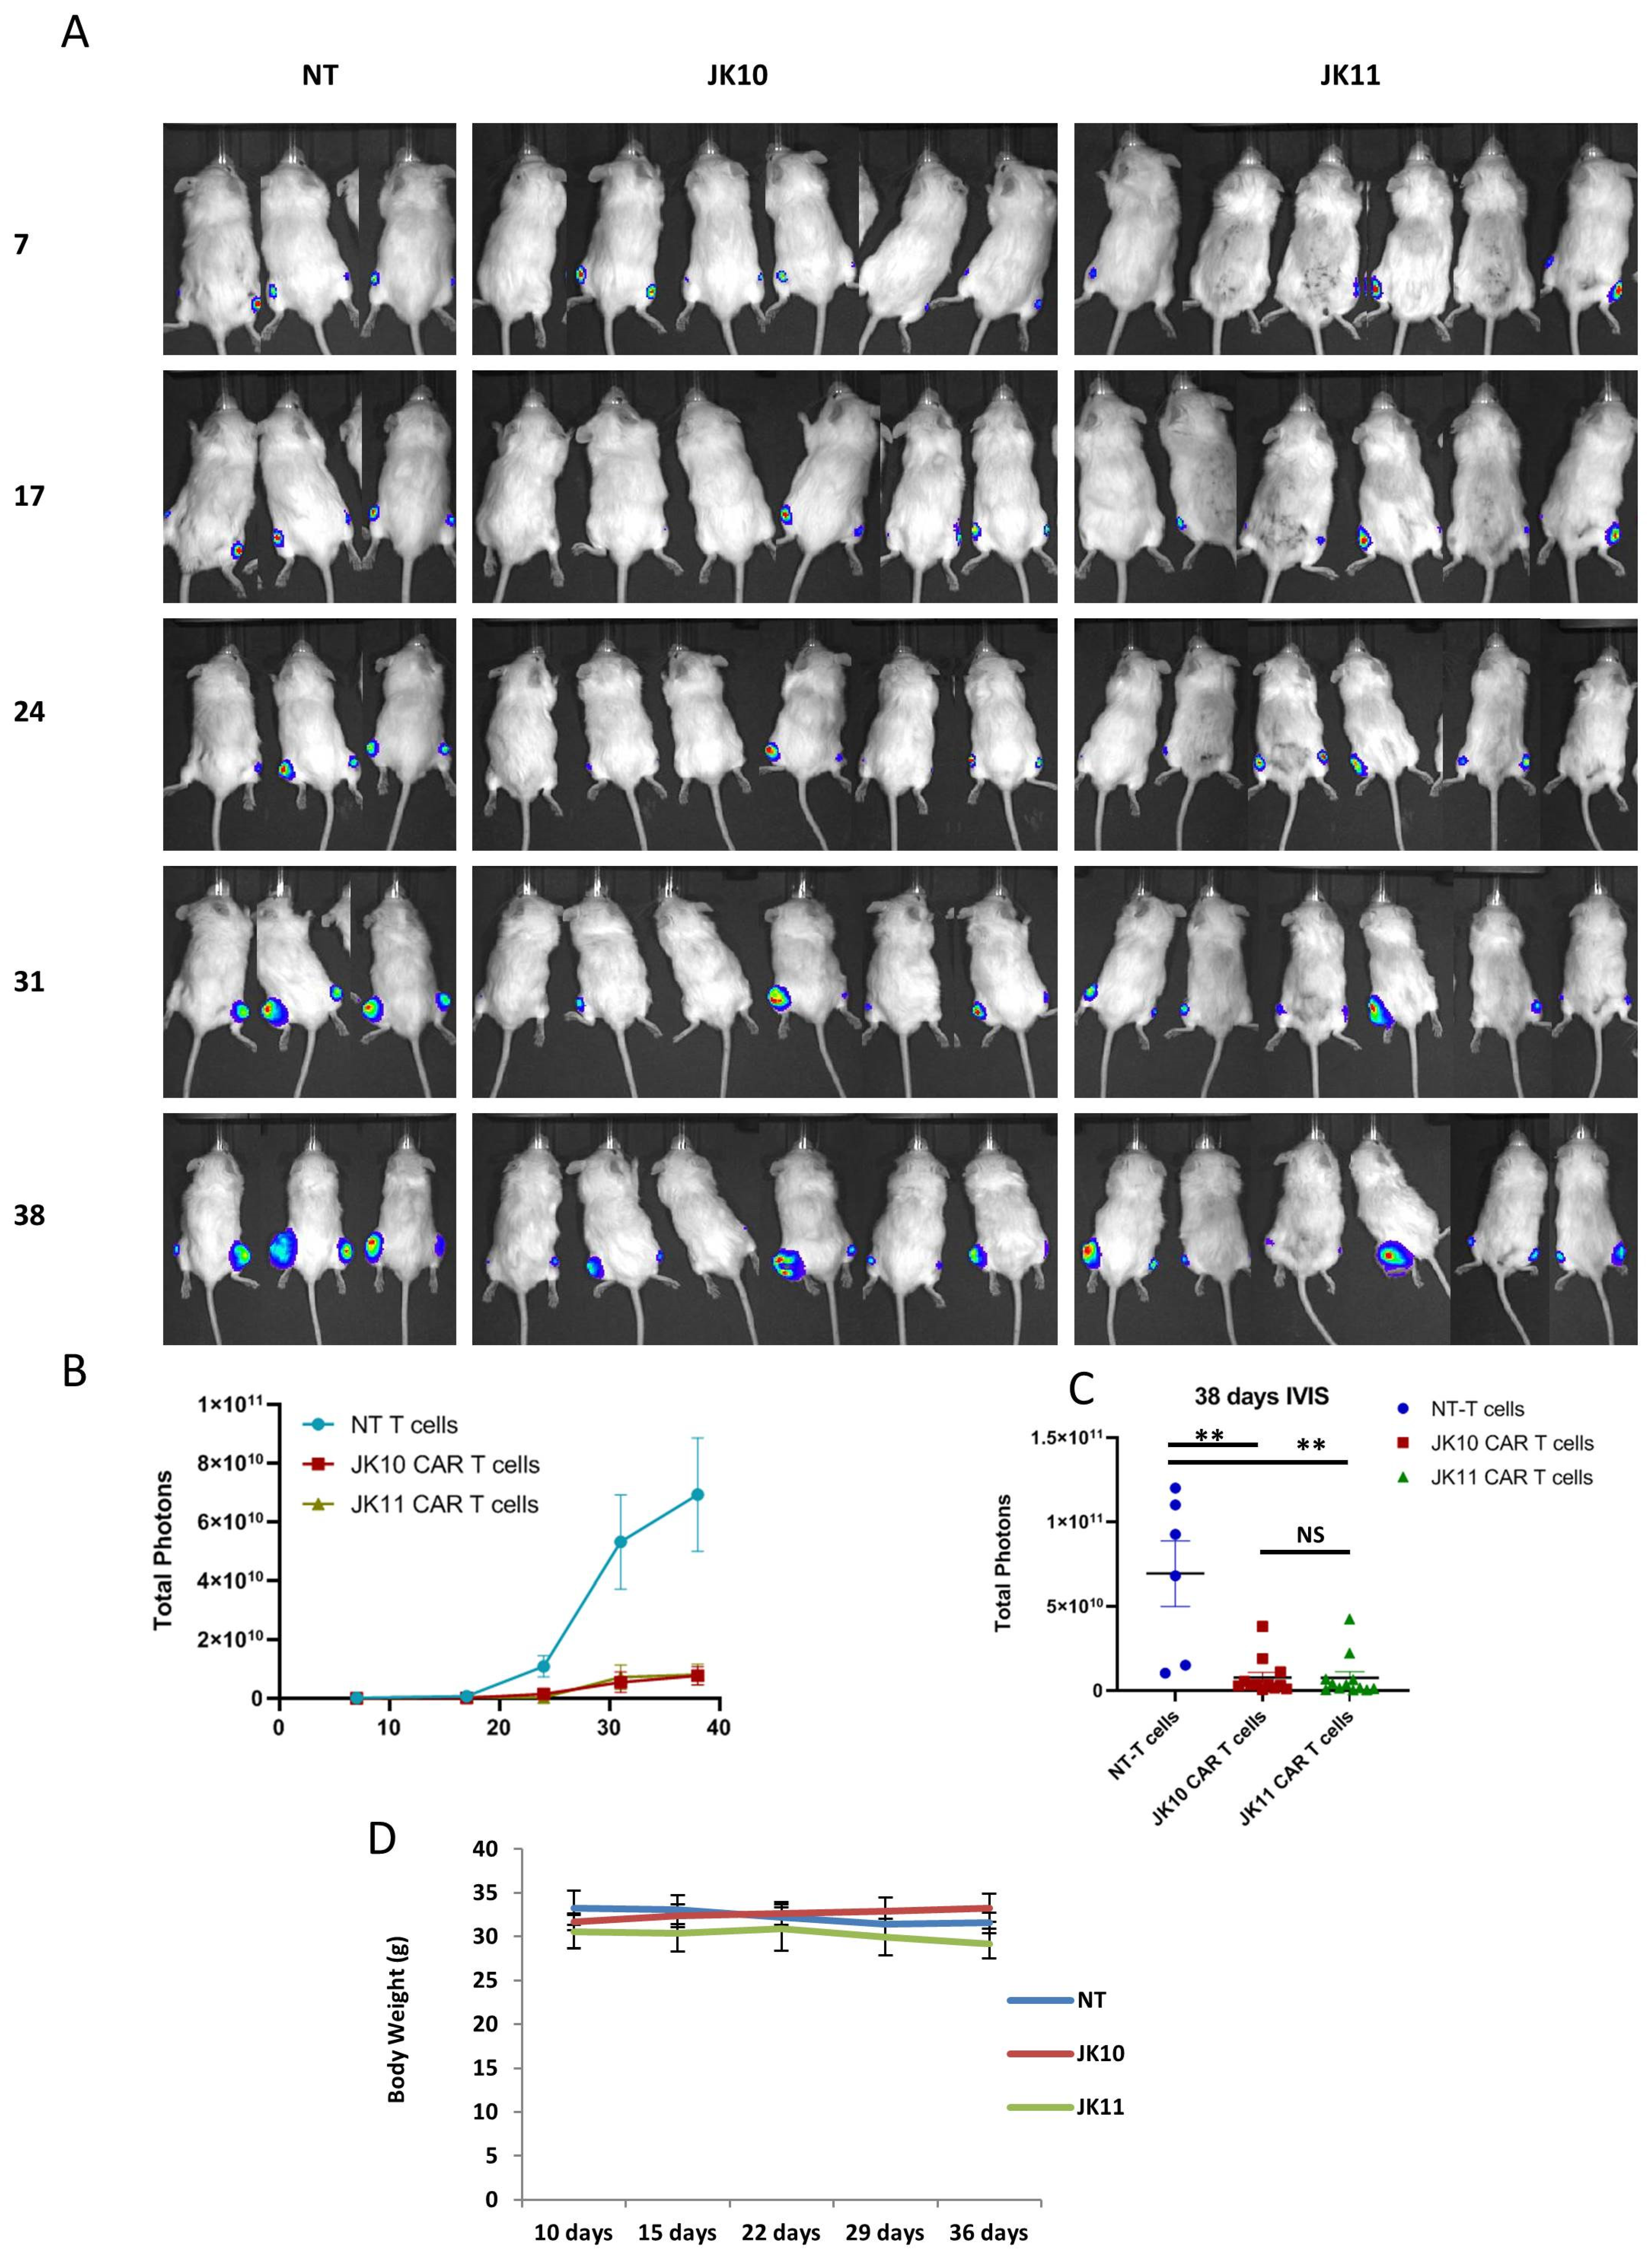
Correction: Jin et al. Comparative Evaluation of STEAP1 Targeting Chimeric Antigen Receptors with Different Costimulatory Domains and Spacers. Int. J. Mol. Sci. 2024, 25, 586
Reference
- Jin, Y.; Dunn, C.; Persiconi, I.; Sike, A.; Skorstad, G.; Beck, C.; Kyte, J.A. Comparative Evaluation of STEAP1 Targeting Chimeric Antigen Receptors with Different Costimulatory Domains and Spacers. Int. J. Mol. Sci. 2024, 25, 586. [Google Scholar] [CrossRef] [PubMed]

Disclaimer/Publisher’s Note: The statements, opinions and data contained in all publications are solely those of the individual author(s) and contributor(s) and not of MDPI and/or the editor(s). MDPI and/or the editor(s) disclaim responsibility for any injury to people or property resulting from any ideas, methods, instructions or products referred to in the content. |
© 2024 by the authors. Licensee MDPI, Basel, Switzerland. This article is an open access article distributed under the terms and conditions of the Creative Commons Attribution (CC BY) license (https://creativecommons.org/licenses/by/4.0/).
Share and Cite
Jin, Y.; Dunn, C.; Persiconi, I.; Sike, A.; Skorstad, G.; Beck, C.; Kyte, J.A. Correction: Jin et al. Comparative Evaluation of STEAP1 Targeting Chimeric Antigen Receptors with Different Costimulatory Domains and Spacers. Int. J. Mol. Sci. 2024, 25, 586. Int. J. Mol. Sci. 2024, 25, 10024. https://doi.org/10.3390/ijms251810024
Jin Y, Dunn C, Persiconi I, Sike A, Skorstad G, Beck C, Kyte JA. Correction: Jin et al. Comparative Evaluation of STEAP1 Targeting Chimeric Antigen Receptors with Different Costimulatory Domains and Spacers. Int. J. Mol. Sci. 2024, 25, 586. International Journal of Molecular Sciences. 2024; 25(18):10024. https://doi.org/10.3390/ijms251810024
Chicago/Turabian StyleJin, Yixin, Claire Dunn, Irene Persiconi, Adam Sike, Gjertrud Skorstad, Carole Beck, and Jon Amund Kyte. 2024. "Correction: Jin et al. Comparative Evaluation of STEAP1 Targeting Chimeric Antigen Receptors with Different Costimulatory Domains and Spacers. Int. J. Mol. Sci. 2024, 25, 586" International Journal of Molecular Sciences 25, no. 18: 10024. https://doi.org/10.3390/ijms251810024
APA StyleJin, Y., Dunn, C., Persiconi, I., Sike, A., Skorstad, G., Beck, C., & Kyte, J. A. (2024). Correction: Jin et al. Comparative Evaluation of STEAP1 Targeting Chimeric Antigen Receptors with Different Costimulatory Domains and Spacers. Int. J. Mol. Sci. 2024, 25, 586. International Journal of Molecular Sciences, 25(18), 10024. https://doi.org/10.3390/ijms251810024


