
Reprogramming of Energy Metabolism in Human PKD1 Polycystic Kidney Disease: A Systems Biology Analysis


Abstract
1. Introduction
2. Results
2.1. Metabolic Pathway Analysis of PKD1 Renal Cysts
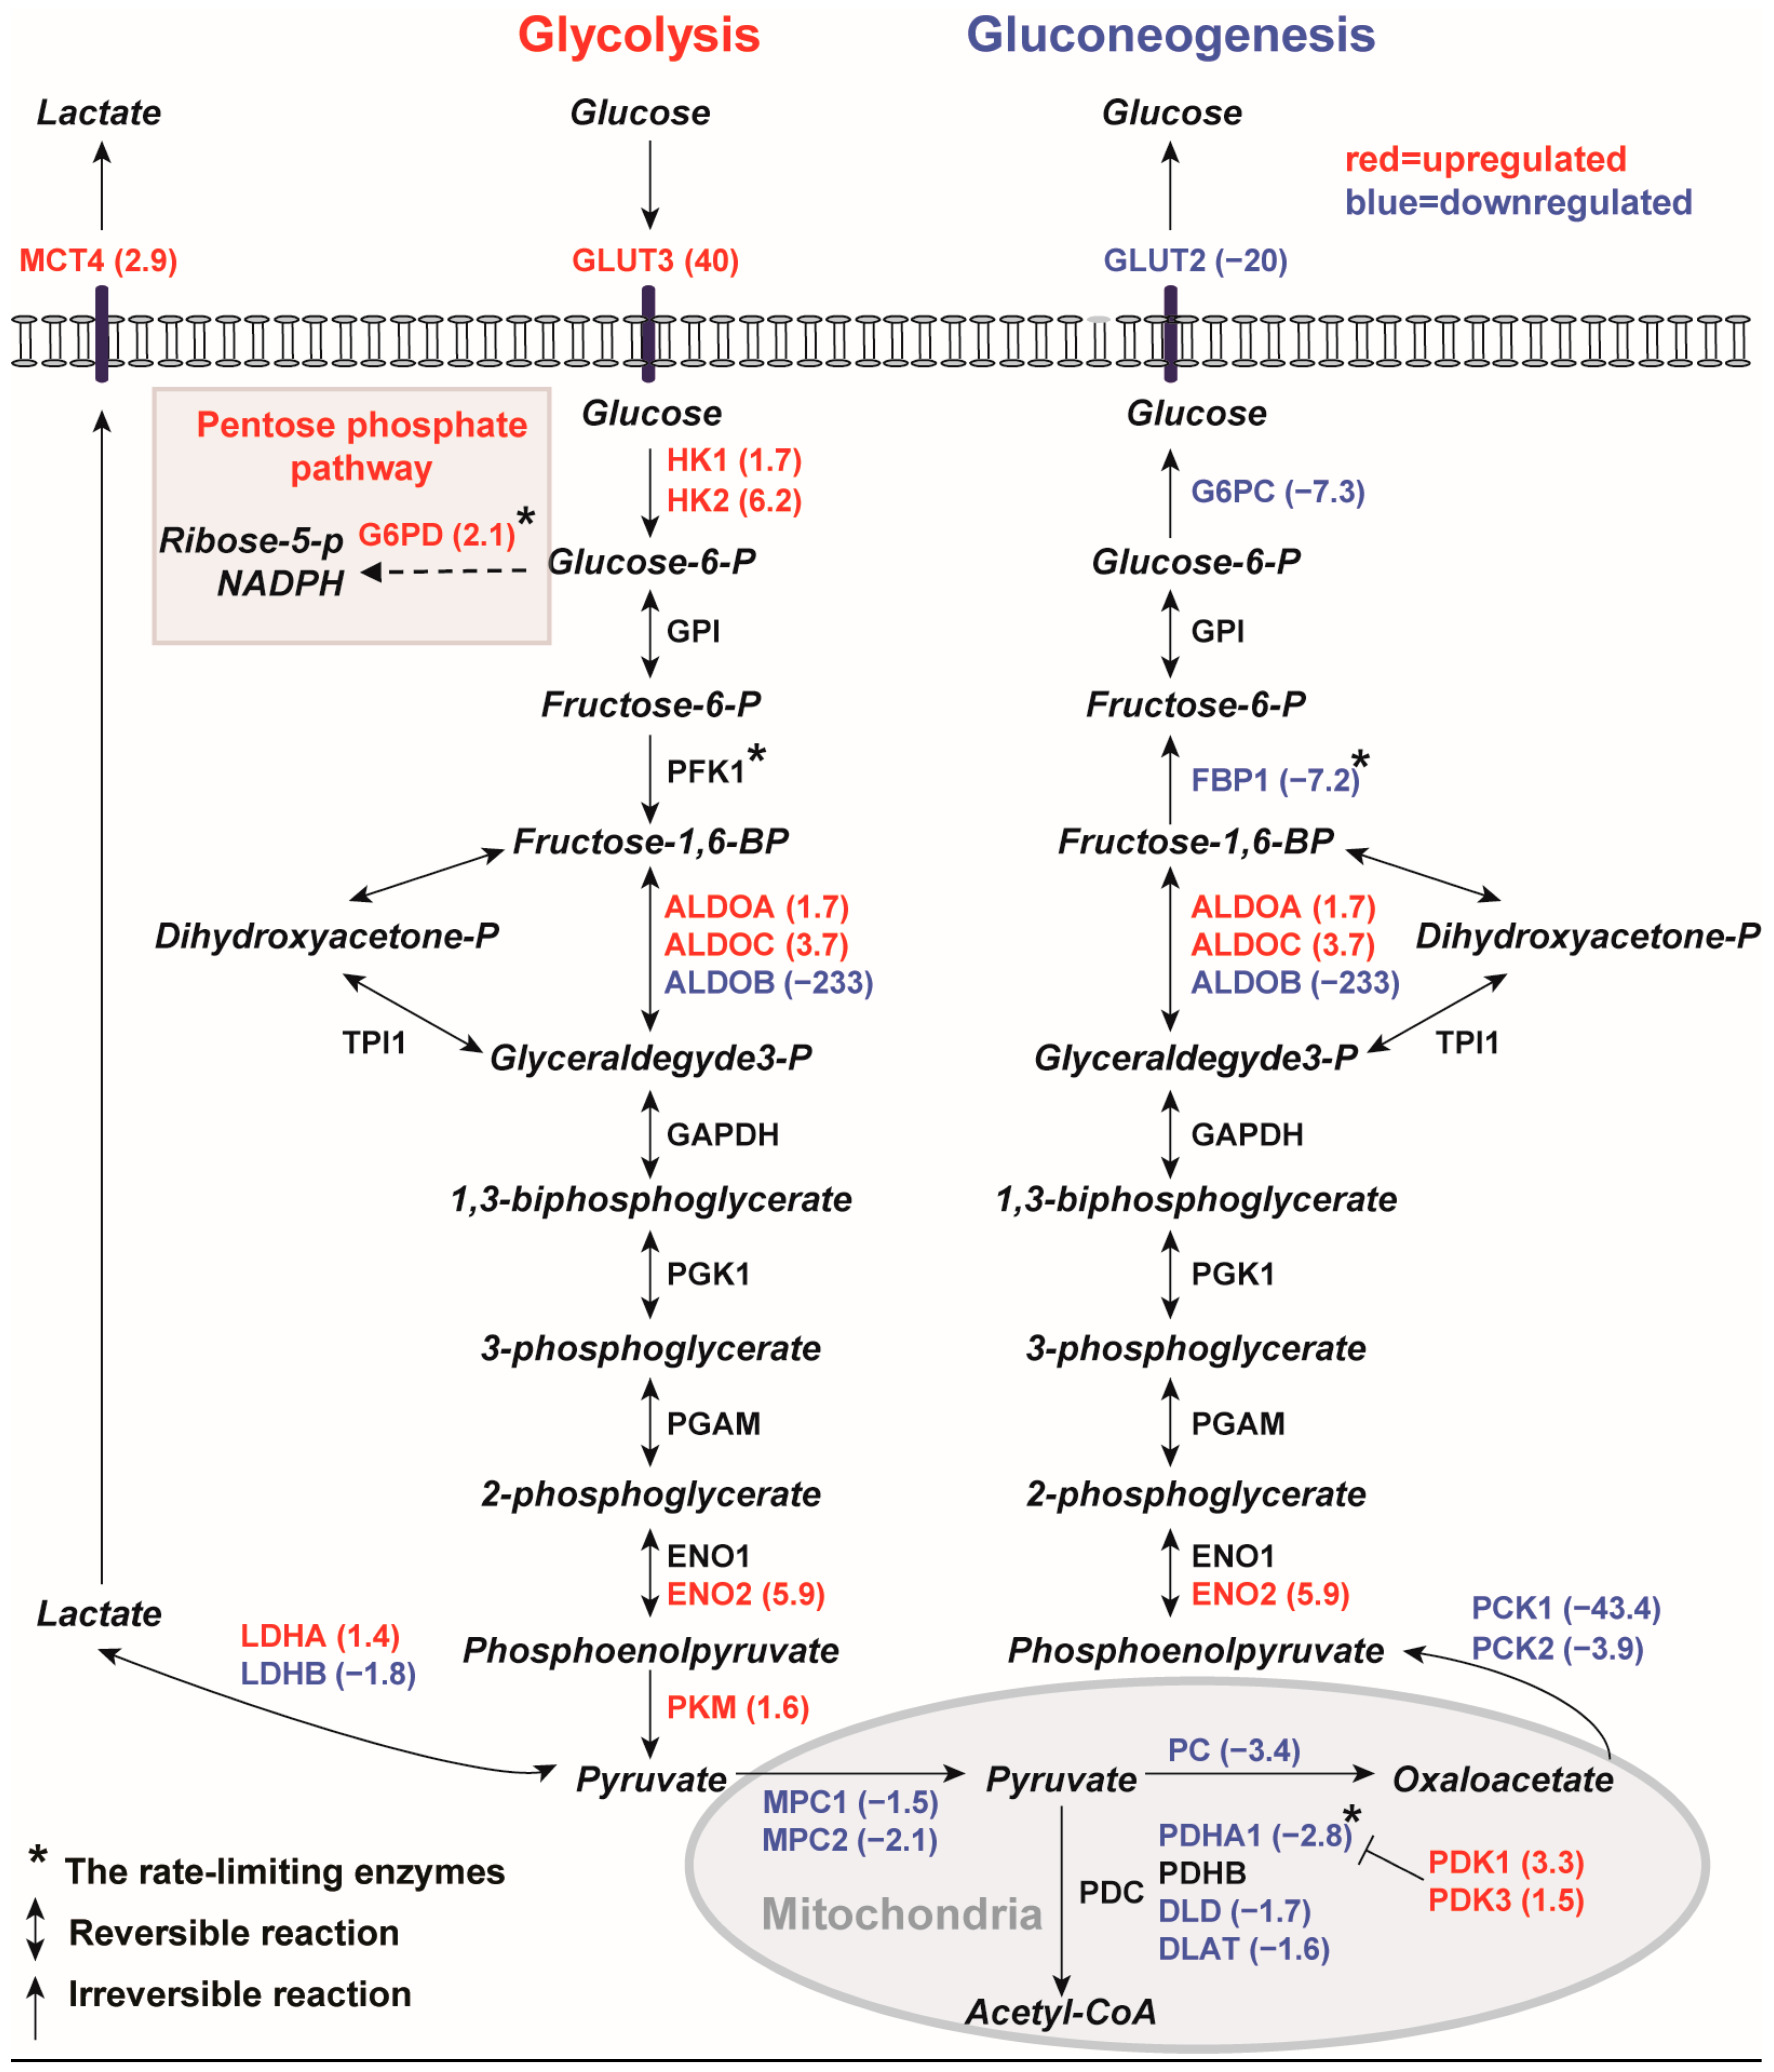
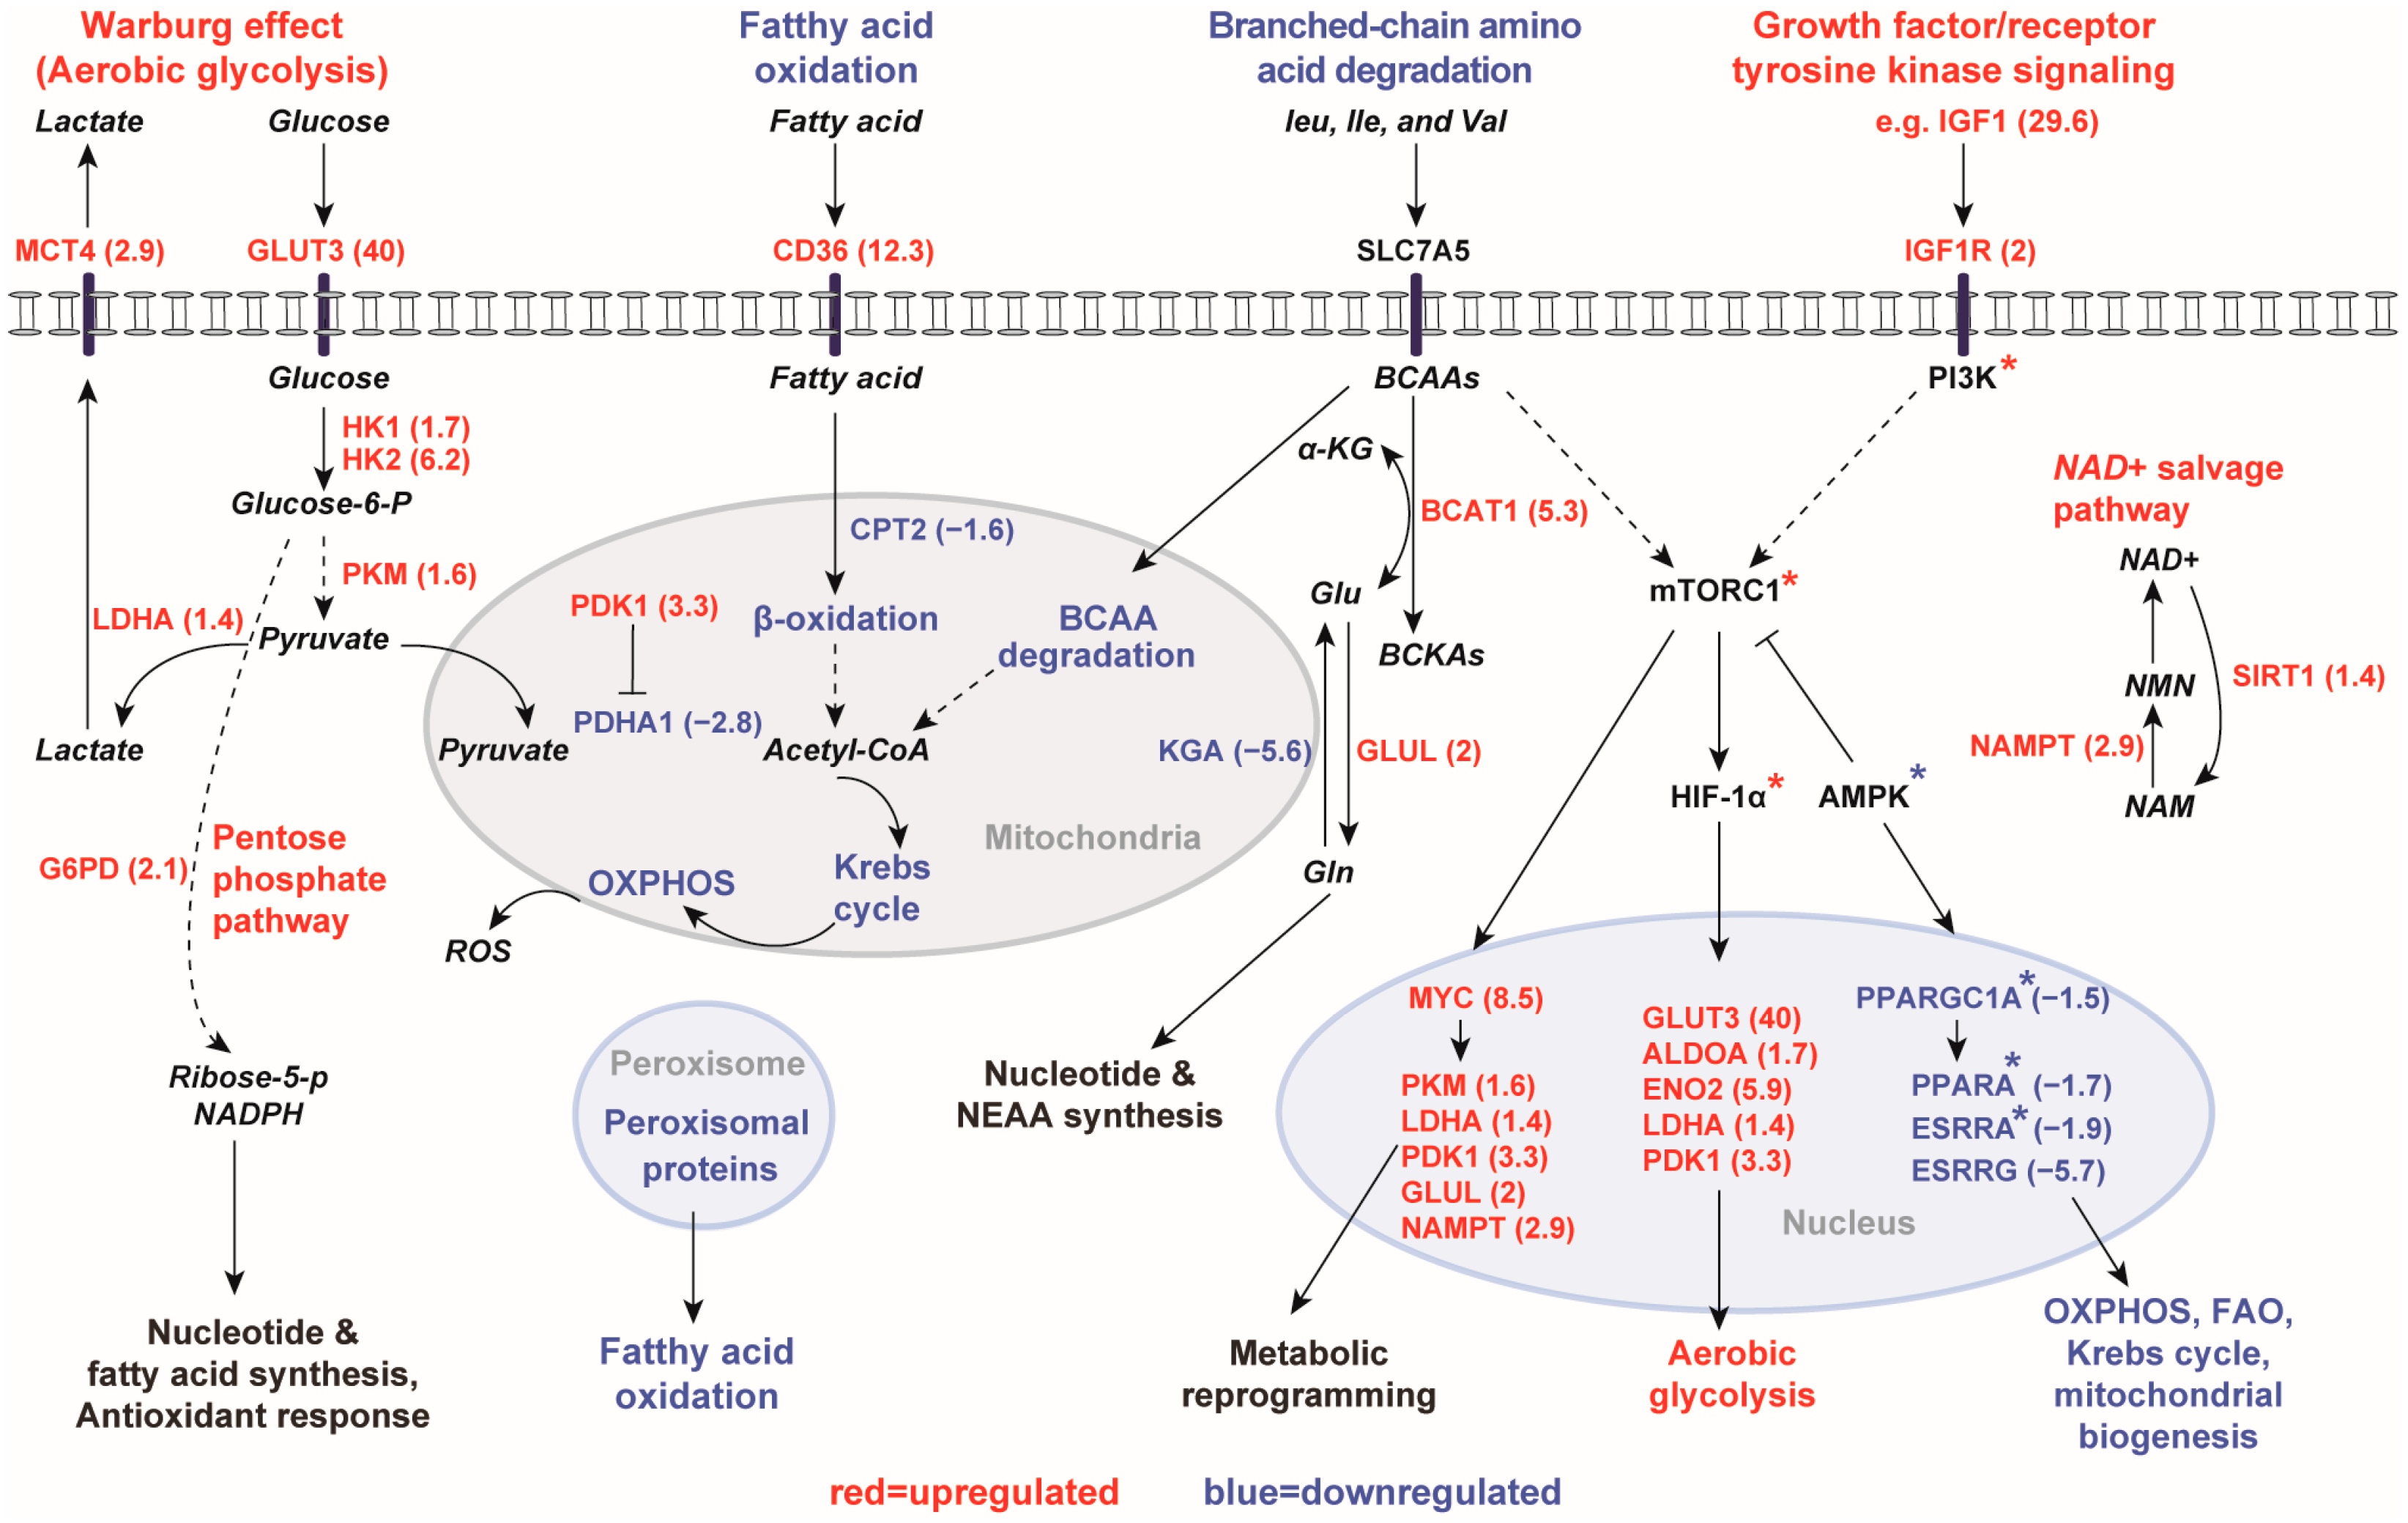
2.1.1. Gene Expression Profiles of Human PKD1 Renal Cysts Are Consistent with the Warburg Effect
2.1.2. Inhibition of Gluconeogenesis Gene Pathway
2.1.3. Downregulation of Mitochondrial Catalytic Gene Pathways in Renal Cysts
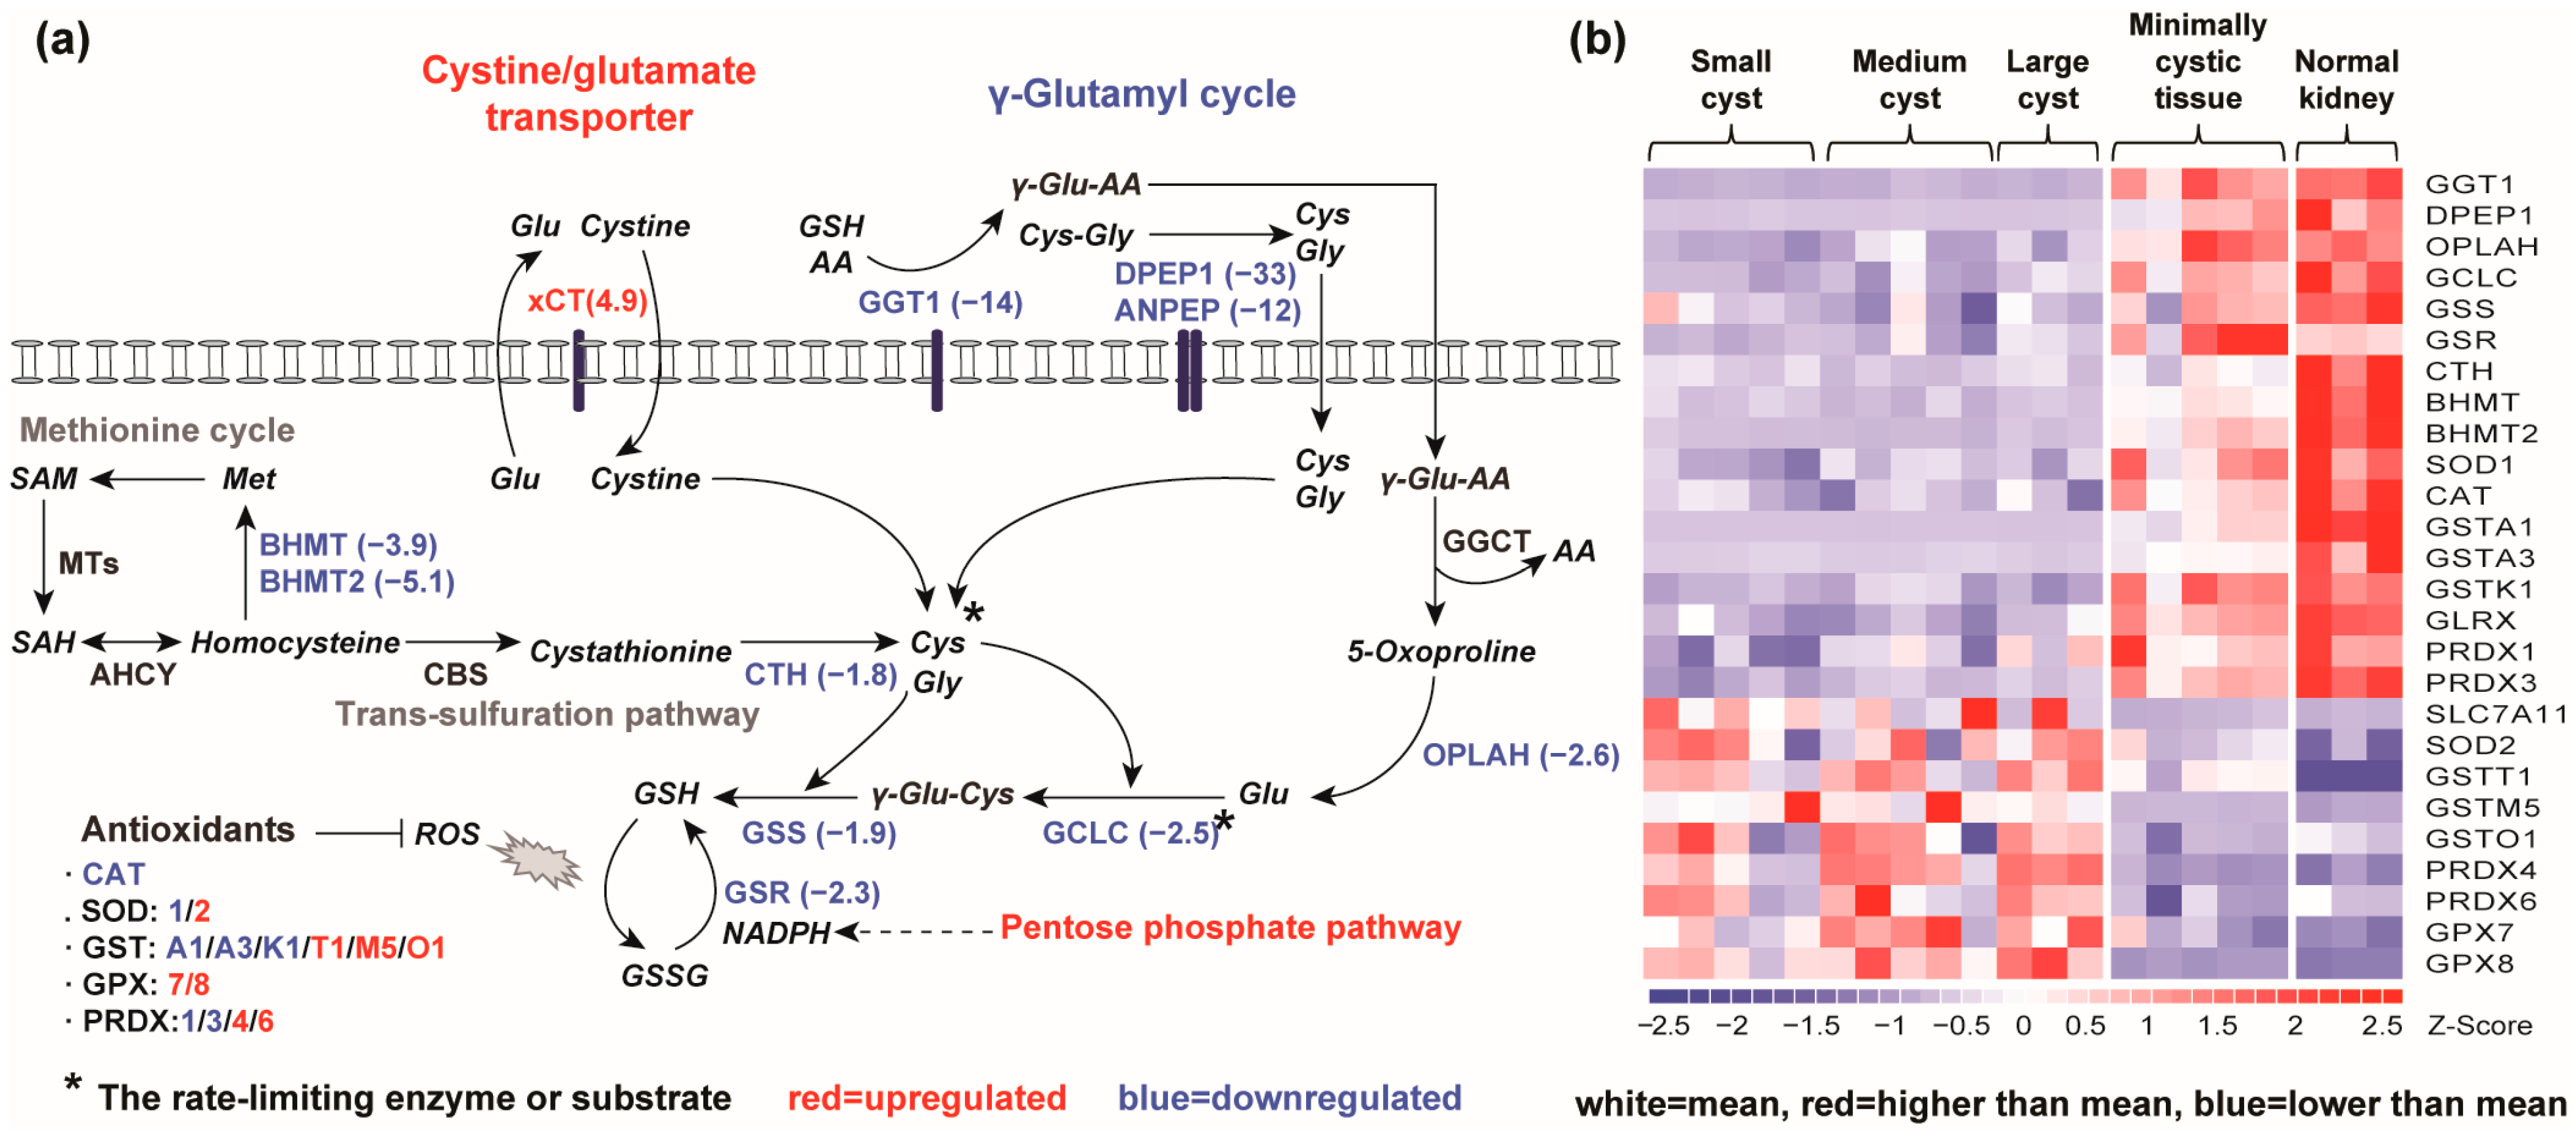
2.1.4. Alteration of GSH Synthesis and GSH-Dependent Antioxidant Response Genes in Renal Cysts
2.2. In Silico Prediction of Key Transcriptional Regulators Based on Differentially Expressed Genes
3. Discussion
4. Materials and Methods
4.1. Pathway Analysis
4.2. Upstream Regulator Analysis (URA)
5. Conclusions
Author Contributions
Funding
Institutional Review Board Statement
Informed Consent Statement
Data Availability Statement
Acknowledgments
Conflicts of Interest
Abbreviations
References
- Lanktree, M.B.; Haghighi, A.; Guiard, E.; Iliuta, I.A.; Song, X.; Harris, P.C.; Paterson, A.D.; Pei, Y. Prevalence estimates of polycystic kidney and liver disease by population sequencing. J. Am. Soc. Nephrol. 2018, 29, 2593–2600. [Google Scholar] [CrossRef] [PubMed]
- Grantham, J.J. Clinical practice. Autosomal dominant polycystic kidney disease. N. Engl. J. Med. 2008, 359, 1477–1485. [Google Scholar] [CrossRef] [PubMed]
- Peters, D.J.; Sandkuijl, L.A. Genetic heterogeneity of polycystic kidney disease in Europe. Contrib. Nephrol. 1992, 97, 128–139. [Google Scholar] [CrossRef] [PubMed]
- Hwang, Y.H.; Conklin, J.; Chan, W.; Roslin, N.M.; Liu, J.; He, N.; Wang, K.; Sundsbak, J.L.; Heyer, C.M.; Haider, M.; et al. Refining genotype-phenotype correlation in autosomal dominant polycystic kidney disease. J. Am. Soc. Nephrol. 2016, 27, 1861–1868. [Google Scholar] [CrossRef] [PubMed]
- Cornec-Le Gall, E.; Audrézet, M.P.; Chen, J.M.; Hourmant, M.; Morin, M.P.; Perrichot, R.; Charasse, C.; Whebe, B.; Renaudineau, E.; Jousset, P.; et al. Type of PKD1 mutation influences renal outcome in ADPKD. J. Am. Soc. Nephrol. 2013, 24, 1006–1013. [Google Scholar] [CrossRef] [PubMed]
- Heyer, C.M.; Sundsbak, J.L.; Abebe, K.Z.; Chapman, A.B.; Torres, V.E.; Grantham, J.J.; Bae, K.T.; Schrier, R.W.; Perrone, R.D.; Braun, W.E.; et al. Predicted mutation strength of nontruncating PKD1 mutations aids genotype-phenotype correlations in autosomal dominant polycystic kidney disease. J. Am. Soc. Nephrol. 2016, 27, 2872–2884. [Google Scholar] [CrossRef] [PubMed]
- Harris, P.C.; Torres, V.E. Genetic mechanisms and signaling pathways in autosomal dominant polycystic kidney disease. J. Clin. Investig. 2014, 124, 2315–2324. [Google Scholar] [CrossRef] [PubMed]
- Bergmann, C.; Guay-Woodford, L.M.; Harris, P.C.; Horie, S.; Peters, D.J.M.; Torres, V.E. Polycystic kidney disease. Nat Rev Dis Primers 2018, 4, 50. [Google Scholar] [CrossRef]
- Shillingford, J.M.; Murcia, N.S.; Larson, C.H.; Low, S.H.; Hedgepeth, R.; Brown, N.; Flask, C.A.; Novick, A.C.; Goldfarb, D.A.; Kramer-Zucker, A.; et al. The mTOR pathway is regulated by polycystin-1, and its inhibition reverses renal cystogenesis in polycystic kidney disease. Proc. Natl. Acad. Sci. USA 2006, 103, 5466–5471. [Google Scholar] [CrossRef]
- Shillingford, J.M.; Piontek, K.B.; Germino, G.G.; Weimbs, T. Rapamycin ameliorates PKD resulting from conditional inactivation of Pkd1. J. Am. Soc. Nephrol. 2010, 21, 489–497. [Google Scholar] [CrossRef]
- Novalic, Z.; van der Wal, A.M.; Leonhard, W.N.; Koehl, G.; Breuning, M.H.; Geissler, E.K.; de Heer, E.; Peters, D.J. Dose-dependent effects of sirolimus on mTOR signaling and polycystic kidney disease. J. Am. Soc. Nephrol. 2012, 23, 842–853. [Google Scholar] [CrossRef] [PubMed]
- Padovano, V.; Podrini, C.; Boletta, A.; Caplan, M.J. Metabolism and mitochondria in polycystic kidney disease research and therapy. Nat. Rev. Nephrol. 2018, 14, 678–687. [Google Scholar] [CrossRef] [PubMed]
- Menezes, L.F.; Germino, G.G. The pathobiology of polycystic kidney disease from a metabolic viewpoint. Nat. Rev. Nephrol. 2019, 15, 735–749. [Google Scholar] [CrossRef]
- Podrini, C.; Cassina, L.; Boletta, A. Metabolic reprogramming and the role of mitochondria in polycystic kidney disease. Cell. Signal. 2019, 67, 109495. [Google Scholar] [CrossRef] [PubMed]
- Nowak, K.L.; Hopp, K. Metabolic reprogramming in autosomal dominant polycystic kidney disease: Evidence and therapeutic potential. Clin. J. Am. Soc. Nephrol. 2020, 15, 577–584. [Google Scholar] [CrossRef] [PubMed]
- Song, X.; Tsakiridis, E.; Steinberg, G.R.; Pei, Y. Targeting AMP-activated protein kinase (AMPK) for treatment of autosomal dominant polycystic kidney disease. Cell. Signal. 2020, 73, 109704. [Google Scholar] [CrossRef] [PubMed]
- Iliuta, I.A.; Song, X.; Pickel, L.; Haghighi, A.; Retnakaran, R.; Scholey, J.; Sung, H.K.; Steinberg, G.R.; Pei, Y. Shared pathobiology identifies AMPK as a therapeutic target for obesity and autosomal dominant polycystic kidney disease. Front. Mol. Biosci. 2022, 9, 962933. [Google Scholar] [CrossRef] [PubMed]
- Rowe, I.; Chiaravalli, M.; Mannella, V.; Ulisse, V.; Quilici, G.; Pema, M.; Song, X.W.; Xu, H.; Mari, S.; Qian, F.; et al. Defective glucose metabolism in polycystic kidney disease identifies a new therapeutic strategy. Nat. Med. 2013, 19, 488–493. [Google Scholar] [CrossRef]
- Zhou, X.; Fan, L.X.; Sweeney, W.E., Jr.; Denu, J.M.; Avner, E.D.; Li, X. Sirtuin 1 inhibition delays cyst formation in autosomal-dominant polycystic kidney disease. J. Clin. Investig. 2013, 123, 3084–3098. [Google Scholar] [CrossRef]
- Takiar, V.; Nishio, S.; Seo-Mayer, P.; King, J.D., Jr.; Li, H.; Zhang, L.; Karihaloo, A.; Hallows, K.R.; Somlo, S.; Caplan, M.J. Activating AMP-activated protein kinase (AMPK) slows renal cystogenesis. Proc. Natl. Acad. Sci. USA 2011, 108, 2462–2467. [Google Scholar] [CrossRef]
- Yuajit, C.; Muanprasat, C.; Gallagher, A.R.; Fedeles, S.V.; Kittayaruksakul, S.; Homvisasevongsa, S.; Somlo, S.; Chatsudthipong, V. Steviol retards renal cyst growth through reduction of CFTR expression and inhibition of epithelial cell proliferation in a mouse model of polycystic kidney disease. Biochem. Pharmacol. 2014, 88, 412–421. [Google Scholar] [CrossRef] [PubMed]
- Warner, G.; Hein, K.Z.; Nin, V.; Edwards, M.; Chini, C.C.; Hopp, K.; Harris, P.C.; Torres, V.E.; Chini, E.N. Food restriction ameliorates the development of polycystic kidney disease. J. Am. Soc. Nephrol. 2016, 27, 1437–1447. [Google Scholar] [CrossRef]
- Lin, C.C.; Kurashige, M.; Liu, Y.; Terabayashi, T.; Ishimoto, Y.; Wang, T.; Choudhary, V.; Hobbs, R.; Liu, L.K.; Lee, P.H.; et al. A cleavage product of Polycystin-1 is a mitochondrial matrix protein that affects mitochondria morphology and function when heterologously expressed. Sci. Rep. 2018, 8, 2743. [Google Scholar] [CrossRef]
- Kahveci, A.S.; Barnatan, T.T.; Kahveci, A.; Adrian, A.E.; Arroyo, J.; Eirin, A.; Harris, P.C.; Lerman, A.; Lerman, L.O.; Torres, V.E.; et al. Oxidative stress and mitochondrial abnormalities contribute to decreased endothelial nitric oxide synthase expression and renal disease progression in early experimental polycystic kidney disease. Int. J. Mol. Sci. 2020, 21, 1994. [Google Scholar] [CrossRef] [PubMed]
- Kuo, I.Y.; Brill, A.L.; Lemos, F.O.; Jiang, J.Y.; Falcone, J.L.; Kimmerling, E.P.; Cai, Y.; Dong, K.; Kaplan, D.L.; Wallace, D.P.; et al. Polycystin 2 regulates mitochondrial Ca2+ signaling, bioenergetics, and dynamics through mitofusin 2. Sci. Signal. 2019, 12, eaat7397. [Google Scholar] [CrossRef]
- Cassina, L.; Chiaravalli, M.; Boletta, A. Increased mitochondrial fragmentation in polycystic kidney disease acts as a modifier of disease progression. FASEB J. 2020, 34, 6493–6507. [Google Scholar] [CrossRef]
- Ishimoto, Y.; Inagi, R.; Yoshihara, D.; Kugita, M.; Nagao, S.; Shimizu, A.; Takeda, N.; Wake, M.; Honda, K.; Zhou, J.; et al. Mitochondrial abnormality facilitates cyst formation in autosomal dominant polycystic kidney disease. Mol. Cell. Biol. 2017, 37, e00337-17. [Google Scholar] [CrossRef]
- Padovano, V.; Kuo, I.Y.; Stavola, L.K.; Aerni, H.R.; Flaherty, B.J.; Chapin, H.C.; Ma, M.; Somlo, S.; Boletta, A.; Ehrlich, B.E.; et al. The polycystins are modulated by cellular oxygen-sensing pathways and regulate mitochondrial function. Mol. Biol. Cell. 2017, 28, 261–269. [Google Scholar] [CrossRef] [PubMed]
- Torres, V.E.; Bengal, R.J.; Litwiller, R.D.; Wilson, D.M. Aggravation of polycystic kidney disease in Han:SPRD rats by buthionine sulfoximine. J. Am. Soc. Nephrol. 1997, 8, 1283–1291. [Google Scholar] [CrossRef]
- Maser, R.L.; Vassmer, D.; Magenheimer, B.S.; Calvet, J.P. Oxidant stress and reduced antioxidant enzyme protection in polycystic kidney disease. J. Am. Soc. Nephrol. 2002, 13, 991–999. [Google Scholar] [CrossRef] [PubMed]
- Menon, V.; Rudym, D.; Chandra, P.; Miskulin, D.; Perrone, R.; Sarnak, M. Inflammation, oxidative stress, and insulin resistance in polycystic kidney disease. Clin. J. Am. Soc. Nephrol. 2011, 6, 7–13. [Google Scholar] [CrossRef] [PubMed]
- Klawitter, J.; Reed-Gitomer, B.Y.; McFann, K.; Pennington, A.; Abebe, K.Z.; Klepacki, J.; Cadnapaphornchai, M.A.; Brosnahan, G.; Chonchol, M.; Christians, U.; et al. Endothelial dysfunction and oxidative stress in polycystic kidney disease. Am. J. Physio.L Ren. Physiol. 2014, 307, F1198–F1206. [Google Scholar] [CrossRef] [PubMed]
- Schreiber, R.; Buchholz, B.; Kraus, A.; Schley, G.; Scholz, J.; Ousingsawat, J.; Kunzelmann, K. Lipid peroxidation drives renal cyst growth in vitro through activation of TMEM16A. J. Am. Soc. Nephrol. 2019, 30, 228–242. [Google Scholar] [CrossRef]
- Menezes, L.F.; Lin, C.C.; Zhou, F.; Germino, G.G. Fatty acid oxidation is impaired in an orthologous mouse model of autosomal dominant polycystic kidney disease. EBioMedicine 2016, 5, 183–192. [Google Scholar] [CrossRef]
- Lakhia, R.; Yheskel, M.; Flaten, A.; Quittner-Strom, E.B.; Holland, W.L.; Patel, V. PPARalpha agonist fenofibrate enhances fatty acid beta-oxidation and attenuates polycystic kidney and liver disease in mice. Am. J. Physiol. Ren. Physiol. 2018, 314, F122–F131. [Google Scholar] [CrossRef] [PubMed]
- Podrini, C.; Rowe, I.; Pagliarini, R.; Costa, A.S.H.; Chiaravalli, M.; Di Meo, I.; Kim, H.; Distefano, G.; Tiranti, V.; Qian, F.; et al. Dissection of metabolic reprogramming in polycystic kidney disease reveals coordinated rewiring of bioenergetic pathways. Commun. Biol. 2018, 1, 194. [Google Scholar] [CrossRef]
- Soomro, I.; Sun, Y.; Li, Z.; Diggs, L.; Hatzivassiliou, G.; Thomas, A.G.; Rais, R.; Slusher, B.S.; Somlo, S.; Skolnik, E.Y. Glutamine metabolism via glutaminase 1 in autosomal-dominant polycystic kidney disease. Nephrol. Dial. Transplant. Off. Publ. Eur. Dial. Transpl. Assoc.-Eur. Ren. Assoc. 2018, 33, 1343–1353. [Google Scholar] [CrossRef] [PubMed]
- Trott, J.F.; Hwang, V.J.; Ishimaru, T.; Chmiel, K.J.; Zhou, J.X.; Shim, K.; Stewart, B.J.; Mahjoub, M.R.; Jen, K.Y.; Barupal, D.K.; et al. Arginine reprogramming in ADPKD results in arginine-dependent cystogenesis. Am. J. Physiol. Ren. Physiol. 2018, 315, F1855–F1868. [Google Scholar] [CrossRef]
- Malas, T.B.; Leonhard, W.N.; Bange, H.; Granchi, Z.; Hettne, K.M.; Van Westen, G.J.P.; Price, L.S.; ’t Hoen, P.A.C.; Peters, D.J.M. Prioritization of novel ADPKD drug candidates from disease-stage specific gene expression profiles. EBioMedicine 2020, 51, 102585. [Google Scholar] [CrossRef]
- Asawa, R.R.; Danchik, C.; Zahkarov, A.; Chen, Y.; Voss, T.; Jadhav, A.; Wallace, D.P.; Trott, J.F.; Weiss, R.H.; Simeonov, A.; et al. A high-throughput screening platform for Polycystic Kidney Disease (PKD) drug repurposing utilizing murine and human ADPKD cells. Sci. Rep. 2020, 10, 4203. [Google Scholar] [CrossRef]
- Riwanto, M.; Kapoor, S.; Rodriguez, D.; Edenhofer, I.; Segerer, S.; Wuthrich, R.P. Inhibition of aerobic glycolysis attenuates disease progression in polycystic kidney disease. PLoS ONE 2016, 11, e0146654. [Google Scholar] [CrossRef]
- Chiaravalli, M.; Rowe, I.; Mannella, V.; Quilici, G.; Canu, T.; Bianchi, V.; Gurgone, A.; Antunes, S.; D’Adamo, P.; Esposito, A.; et al. 2-Deoxy-d-Glucose Ameliorates PKD Progression. J Am Soc Nephrol 2016, 27, 1958–1969. [Google Scholar] [CrossRef]
- Lian, X.; Wu, X.; Li, Z.; Zhang, Y.; Song, K.; Cai, G.; Li, Q.; Lin, S.; Chen, X.; Bai, X.Y. The combination of metformin and 2-deoxyglucose significantly inhibits cyst formation in miniature pigs with polycystic kidney disease. Br. J. Pharmacol. 2019, 176, 711–724. [Google Scholar] [CrossRef]
- Hardie, D.G. AMPK: A target for drugs and natural products with effects on both diabetes and cancer. Diabetes 2013, 62, 2164–2172. [Google Scholar] [CrossRef]
- Garcia, D.; Shaw, R.J. AMPK: Mechanisms of cellular energy sensing and restoration of metabolic balance. Mol. Cell 2017, 66, 789–800. [Google Scholar] [CrossRef]
- Herzig, S.; Shaw, R.J. AMPK: Guardian of metabolism and mitochondrial homeostasis. Nat. Rev. Mol. Cell Biol. 2018, 19, 121–135. [Google Scholar] [CrossRef] [PubMed]
- Steinberg, G.R.; Carling, D. AMP-activated protein kinase: The current landscape for drug development. Nat. Rev. Drug Discov. 2019, 18, 527–551. [Google Scholar] [CrossRef] [PubMed]
- Kipp, K.R.; Rezaei, M.; Lin, L.; Dewey, E.C.; Weimbs, T. A mild reduction of food intake slows disease progression in an orthologous mouse model of polycystic kidney disease. Am. J. Physiol. Ren. Physiol. 2016, 310, F726–F731. [Google Scholar] [CrossRef] [PubMed]
- Torres, J.A.; Kruger, S.L.; Broderick, C.; Amarlkhagva, T.; Agrawal, S.; Dodam, J.R.; Mrug, M.; Lyons, L.A.; Weimbs, T. Ketosis ameliorates renal cyst growth in polycystic kidney disease. Cell Metab. 2019, 30, 1007–1023. [Google Scholar] [CrossRef] [PubMed]
- Leonhard, W.N.; Song, X.; Kanhai, A.A.; Iliuta, I.A.; Bozovic, A.; Steinberg, G.R.; Peters, D.J.M.; Pei, Y. Salsalate, but not metformin or canagliflozin, slows kidney cyst growth in an adult-onset mouse model of polycystic kidney disease. EBioMedicine 2019, 47, 436–445. [Google Scholar] [CrossRef] [PubMed]
- Pastor-Soler, N.M.; Li, H.; Pham, J.; Rivera, D.; Ho, P.Y.; Mancino, V.; Saitta, B.; Hallows, K.R. Metformin improves relevant disease parameters in an autosomal dominant polycystic kidney disease mouse model. Am. J. Physiol. Ren. Physiol. 2022, 322, F27–F41. [Google Scholar] [CrossRef] [PubMed]
- Song, X.; Leonhard, W.N.; Kanhai, A.A.; Steinberg, G.R.; Pei, Y.; Peters, D.J.M. Preclinical evaluation of tolvaptan and salsalate combination therapy in a Pkd1-mouse model. Front. Mol. Biosci. 2023, 10, 1058825. [Google Scholar] [CrossRef] [PubMed]
- Flowers, E.M.; Sudderth, J.; Zacharias, L.; Mernaugh, G.; Zent, R.; DeBerardinis, R.J.; Carroll, T.J. Lkb1 deficiency confers glutamine dependency in polycystic kidney disease. Nat. Commun. 2018, 9, 814. [Google Scholar] [CrossRef] [PubMed]
- Song, X.; Di Giovanni, V.; He, N.; Wang, K.; Ingram, A.; Rosenblum, N.D.; Pei, Y. Systems biology of autosomal dominant polycystic kidney disease (ADPKD): Computational identification of gene expression pathways and integrated regulatory networks. Hum. Mol. Genet. 2009, 18, 2328–2343. [Google Scholar] [CrossRef] [PubMed]
- Subramanian, A.; Tamayo, P.; Mootha, V.K.; Mukherjee, S.; Ebert, B.L.; Gillette, M.A.; Paulovich, A.; Pomeroy, S.L.; Golub, T.R.; Lander, E.S.; et al. Gene set enrichment analysis: A knowledge-based approach for interpreting genome-wide expression profiles. Proc. Natl. Acad. Sci. USA 2005, 102, 15545–15550. [Google Scholar] [CrossRef]
- Kanehisa, M.; Goto, S. KEGG: Kyoto encyclopedia of genes and genomes. Nucleic Acids Res. 2000, 28, 27–30. [Google Scholar] [CrossRef] [PubMed]
- Vander Heiden, M.G.; Cantley, L.C.; Thompson, C.B. Understanding the Warburg effect: The metabolic requirements of cell proliferation. Science 2009, 324, 1029–1033. [Google Scholar] [CrossRef] [PubMed]
- Hay, N. Reprogramming glucose metabolism in cancer: Can it be exploited for cancer therapy? Nat. Rev. Cancer 2016, 16, 635–649. [Google Scholar] [CrossRef]
- McCommis, K.S.; Finck, B.N. Mitochondrial pyruvate transport: A historical perspective and future research directions. Biochem. J. 2015, 466, 443–454. [Google Scholar] [CrossRef]
- Patel, M.S.; Nemeria, N.S.; Furey, W.; Jordan, F. The pyruvate dehydrogenase complexes: Structure-based function and regulation. J. Biol. Chem. 2014, 289, 16615–16623. [Google Scholar] [CrossRef]
- Scrutton, M.C.; Utter, M.F. Regulation of Glycolysis and Gluconeogenesis in Animal Tissues. Annu. Rev. Biochem. 1968, 37, 249–302. [Google Scholar] [CrossRef]
- Guder, W.G.; Rupprecht, A. Metabolism of isolated kidney tubules. Independent actions of catecholamines on renal cyclic adenosine 3′:5′-monophosphate levels and gluconeogenesis. Eur. J. Biochem. 1975, 52, 283–290. [Google Scholar] [CrossRef]
- Pietrocola, F.; Galluzzi, L.; Bravo-San Pedro, J.M.; Madeo, F.; Kroemer, G. Acetyl coenzyme A: A central metabolite and second messenger. Cell Metab. 2015, 21, 805–821. [Google Scholar] [CrossRef]
- Ananieva, E.A.; Wilkinson, A.C. Branched-chain amino acid metabolism in cancer. Curr. Opin. Clin. Nutr. Metab. Care 2018, 21, 64–70. [Google Scholar] [CrossRef]
- Yamamoto, J.; Nishio, S.; Hattanda, F.; Nakazawa, D.; Kimura, T.; Sata, M.; Makita, M.; Ishikawa, Y.; Atsumi, T. Branched-chain amino acids enhance cyst development in autosomal dominant polycystic kidney disease. Kidney Int. 2017, 92, 377–387. [Google Scholar] [CrossRef]
- Kang, H.M.; Ahn, S.H.; Choi, P.; Ko, Y.A.; Han, S.H.; Chinga, F.; Park, A.S.; Tao, J.; Sharma, K.; Pullman, J.; et al. Defective fatty acid oxidation in renal tubular epithelial cells has a key role in kidney fibrosis development. Nat. Med. 2015, 21, 37–46. [Google Scholar] [CrossRef] [PubMed]
- Yang, X.; Okamura, D.M.; Lu, X.; Chen, Y.; Moorhead, J.; Varghese, Z.; Ruan, X.Z. CD36 in chronic kidney disease: Novel insights and therapeutic opportunities. Nat. Rev. Nephrol. 2017, 13, 769–781. [Google Scholar] [CrossRef] [PubMed]
- Declèves, A.E.; Zolkipli, Z.; Satriano, J.; Wang, L.; Nakayama, T.; Rogac, M.; Le, T.P.; Nortier, J.L.; Farquhar, M.G.; Naviaux, R.K.; et al. Regulation of lipid accumulation by AMP-activated kinase in high fat diet-induced kidney injury. Kidney Int. 2014, 85, 611–623. [Google Scholar] [CrossRef] [PubMed]
- Kurutas, E.B. The importance of antioxidants which play the role in cellular response against oxidative/nitrosative stress: Current state. Nutr. J. 2016, 15, 71. [Google Scholar] [CrossRef] [PubMed]
- Cabrita, I.; Kraus, A.; Scholz, J.K.; Skoczynski, K.; Schreiber, R.; Kunzelmann, K.; Buchholz, B. Cyst growth in ADPKD is prevented by pharmacological and genetic inhibition of TMEM16A in vivo. Nat. Commun. 2020, 11, 4320. [Google Scholar] [CrossRef] [PubMed]
- Deneke, S.M.; Fanburg, B.L. Regulation of cellular glutathione. Am. J. Physiol. 1989, 257, L163–L173. [Google Scholar] [CrossRef] [PubMed]
- Lushchak, V.I. Glutathione homeostasis and functions: Potential targets for medical interventions. J. Amino Acids 2012, 2012, 736837. [Google Scholar] [CrossRef] [PubMed]
- Lu, S.C. Glutathione synthesis. Biochim. Biophys. Acta 2013, 1830, 3143–3153. [Google Scholar] [CrossRef]
- Koppula, P.; Zhang, Y.; Zhuang, L.; Gan, B. Amino acid transporter SLC7A11/xCT at the crossroads of regulating redox homeostasis and nutrient dependency of cancer. Cancer Commun. 2018, 38, 12. [Google Scholar] [CrossRef]
- Combs, J.A.; DeNicola, G.M. The non-essential amino acid cysteine becomes essential for tumor proliferation and survival. Cancers 2019, 11, E678. [Google Scholar] [CrossRef]
- Menezes, L.F.; Zhou, F.; Patterson, A.D.; Piontek, K.B.; Krausz, K.W.; Gonzalez, F.J.; Germino, G.G. Network analysis of a Pkd1-mouse model of autosomal dominant polycystic kidney disease identifies HNF4alpha as a disease modifier. PLoS Genet. 2012, 8, e1003053. [Google Scholar] [CrossRef]
- Mia, S.; Federico, G.; Feger, M.; Pakladok, T.; Meissner, A.; Voelkl, J.; Groene, H.J.; Alesutan, I.; Lang, F. Impact of AMP-activated protein kinase α1 deficiency on tissue injury following unilateral ureteral obstruction. PLoS ONE 2015, 10, e0135235. [Google Scholar] [CrossRef] [PubMed]
- Wang, Y.; Jia, L.; Hu, Z.; Entman, M.L.; Mitch, W.E. AMP-activated protein kinase/myocardin-related transcription factor-A signaling regulates fibroblast activation and renal fibrosis. Kidney Int. 2018, 93, 81–94. [Google Scholar] [CrossRef]
- Qiu, S.; Xiao, Z.; Piao, C.; Zhang, J.; Dong, Y.; Cui, W.; Liu, X.; Zhang, Y.; Du, J. AMPKα2 reduces renal epithelial transdifferentiation and inflammation after injury through interaction with CK2β. J. Pathol. 2015, 237, 330–342. [Google Scholar] [CrossRef]
- Cantó, C.; Auwerx, J. PGC-1alpha, SIRT1 and AMPK, an energy sensing network that controls energy expenditure. Curr. Opin. Lipidol. 2009, 20, 98–105. [Google Scholar] [CrossRef]
- Lin, J.; Handschin, C.; Spiegelman, B.M. Metabolic control through the PGC-1 family of transcription coactivators. Cell Metab. 2005, 1, 361–370. [Google Scholar] [CrossRef]
- Dominy, J.E.; Puigserver, P. Mitochondrial biogenesis through activation of nuclear signaling proteins. Cold Spring Harb. Perspect. Biol. 2013, 5, a015008. [Google Scholar] [CrossRef]
- Bhargava, P.; Schnellmann, R.G. Mitochondrial energetics in the kidney. Nat. Rev. Nephrol. 2017, 13, 629–646. [Google Scholar] [CrossRef]
- Cargill, K.; Sims-Lucas, S. Metabolic requirements of the nephron. Pediatr. Nephrol. 2018, 35, 1–8. [Google Scholar] [CrossRef] [PubMed]
- Stine, Z.E.; Walton, Z.E.; Altman, B.J.; Hsieh, A.L.; Dang, C.V. MYC, metabolism, and cancer. Cancer Discov. 2015, 5, 1024–1039. [Google Scholar] [CrossRef] [PubMed]
- Masoud, G.N.; Li, W. HIF-1α pathway: Role, regulation and intervention for cancer therapy. Acta Pharm. Sin. B 2015, 5, 378–389. [Google Scholar] [CrossRef] [PubMed]
- Hallows, K.R.; Mount, P.F.; Pastor-Soler, N.M.; Power, D.A. Role of the energy sensor AMP-activated protein kinase in renal physiology and disease. Am. J. Physiol. Ren. Physiol. 2010, 298, F1067–F1077. [Google Scholar] [CrossRef] [PubMed]
- Rajani, R.; Pastor-Soler, N.M.; Hallows, K.R. Role of AMP-activated protein kinase in kidney tubular transport, metabolism, and disease. Curr. Opin. Nephrol. Hypertens. 2017, 26, 375–383. [Google Scholar] [CrossRef] [PubMed]
- Glosse, P.; Föller, M. AMP-activated protein kinase (AMPK)-dependent regulation of renal transport. Int. J. Mol. Sci. 2018, 19, 3481. [Google Scholar] [CrossRef] [PubMed]
- Feng, Y.; Wang, S.; Zhang, Y.; Xiao, H. Metformin attenuates renal fibrosis in both AMPKα2-dependent and independent manners. Clin. Exp. Pharmacol. Physiol. 2017, 44, 648–655. [Google Scholar] [CrossRef] [PubMed]
- Lynch, M.R.; Tran, M.T.; Parikh, S.M. PGC1α in the kidney. Am. J. Physiol. Ren. Physiol. 2018, 314, F1–F8. [Google Scholar] [CrossRef] [PubMed]
- Fontecha-Barriuso, M.; Martin-Sanchez, D.; Martinez-Moreno, J.M.; Monsalve, M.; Ramos, A.M.; Sanchez-Niño, M.D.; Ruiz-Ortega, M.; Ortiz, A.; Sanz, A.B. The role of PGC-1α and mitochondrial biogenesis in kidney diseases. Biomolecules 2020, 10, 347. [Google Scholar] [CrossRef] [PubMed]
- Chambers, J.M.; Wingert, R.A. PGC-1α in disease: Recent renal insights into a versatile metabolic regulator. Cells 2020, 9, 2234. [Google Scholar] [CrossRef] [PubMed]
- Hajarnis, S.; Lakhia, R.; Yheskel, M.; Williams, D.; Sorourian, M.; Liu, X.; Aboudehen, K.; Zhang, S.; Kersjes, K.; Galasso, R.; et al. microRNA-17 family promotes polycystic kidney disease progression through modulation of mitochondrial metabolism. Nat. Commun. 2017, 8, 14395. [Google Scholar] [CrossRef] [PubMed]
- Kersten, S. Integrated physiology and systems biology of PPARα. Mol. Metab. 2014, 3, 354–371. [Google Scholar] [CrossRef] [PubMed]
- Tsushida, K.; Tanabe, K.; Masuda, K.; Tanimura, S.; Miyake, H.; Arata, Y.; Sugiyama, H.; Wada, J. Estrogen-related receptor α is essential for maintaining mitochondrial integrity in cisplatin-induced acute kidney injury. Biochem. Biophys Res. Commun. 2018, 498, 918–924. [Google Scholar] [CrossRef]
- Zhao, J.; Lupino, K.; Wilkins, B.J.; Qiu, C.; Liu, J.; Omura, Y.; Allred, A.L.; McDonald, C.; Susztak, K.; Barish, G.D.; et al. Genomic integration of ERRγ-HNF1β regulates renal bioenergetics and prevents chronic kidney disease. Proc. Natl. Acad. Sci. USA 2018, 115, E4910–E4919. [Google Scholar] [CrossRef] [PubMed]
- Chiarugi, A.; Dolle, C.; Felici, R.; Ziegler, M. The NAD metabolome--a key determinant of cancer cell biology. Nat. Rev. Cancer 2012, 12, 741–752. [Google Scholar] [CrossRef]
- Kramer, A.; Green, J.; Pollard, J., Jr.; Tugendreich, S. Causal analysis approaches in Ingenuity Pathway Analysis. Bioinformatics 2014, 30, 523–530. [Google Scholar] [CrossRef]
- Tusher, V.G.; Tibshirani, R.; Chu, G. Significance analysis of microarrays applied to the ionizing radiation response. Proc. Natl. Acad. Sci. USA 2001, 98, 5116–5121. [Google Scholar] [CrossRef]


| Upregulated (n = 30) | Size | NES | NOM p-val | FDR q-val | Rank by NES |
|---|---|---|---|---|---|
| RIBOSOME | 81 | 2.95 | 0.00 | 0.000 | 1 |
| TGF_BETA_SIGNALING_PATHWAY | 84 | 2.44 | 0.00 | 0.000 | 2 |
| SPLICEOSOME | 118 | 2.36 | 0.00 | 0.000 | 3 |
| WNT_SIGNALING_PATHWAY | 145 | 2.19 | 0.00 | 0.000 | 4 |
| NUCLEOTIDE_EXCISION_REPAIR | 43 | 2.00 | 0.00 | 0.002 | 5 |
| FOCAL_ADHESION | 197 | 1.86 | 0.00 | 0.013 | 6 |
| BASAL_CELL_CARCINOMA | 53 | 1.85 | 0.00 | 0.012 | 7 |
| PATHWAYS_IN_CANCER | 320 | 1.85 | 0.00 | 0.011 | 8 |
| ECM_RECEPTOR_INTERACTION | 82 | 1.80 | 0.00 | 0.018 | 9 |
| PATHOGENIC_ESCHERICHIA_COLI_INFECTION | 54 | 1.79 | 0.00 | 0.018 | 10 |
| COLORECTAL_CANCER | 62 | 1.78 | 0.00 | 0.018 | 11 |
| ACUTE_MYELOID_LEUKEMIA | 56 | 1.76 | 0.00 | 0.020 | 12 |
| UBIQUITIN_MEDIATED_PROTEOLYSIS | 132 | 1.76 | 0.00 | 0.020 | 13 |
| MELANOMA | 71 | 1.70 | 0.01 | 0.030 | 14 |
| PROSTATE_CANCER | 89 | 1.70 | 0.00 | 0.028 | 15 |
| RENAL_CELL_CARCINOMA | 69 | 1.68 | 0.01 | 0.032 | 16 |
| MELANOGENESIS | 98 | 1.67 | 0.00 | 0.032 | 17 |
| CELL_CYCLE | 123 | 1.66 | 0.00 | 0.035 | 18 |
| OOCYTE_MEIOSIS | 109 | 1.64 | 0.00 | 0.040 | 19 |
| CHRONIC_MYELOID_LEUKEMIA | 72 | 1.64 | 0.00 | 0.040 | 20 |
| CYTOSOLIC_DNA_SENSING_PATHWAY | 54 | 1.63 | 0.00 | 0.040 | 21 |
| NOD_LIKE_RECEPTOR_SIGNALING_PATHWAY | 61 | 1.63 | 0.01 | 0.039 | 22 |
| REGULATION_OF_ACTIN_CYTOSKELETON | 210 | 1.63 | 0.00 | 0.038 | 23 |
| AXON_GUIDANCE | 128 | 1.62 | 0.00 | 0.037 | 24 |
| JAK_STAT_SIGNALING_PATHWAY | 150 | 1.62 | 0.00 | 0.037 | 25 |
| VIRAL_MYOCARDITIS | 67 | 1.61 | 0.01 | 0.039 | 26 |
| DILATED_CARDIOMYOPATHY | 89 | 1.58 | 0.01 | 0.045 | 27 |
| HYPERTROPHIC_CARDIOMYOPATHY_HCM | 82 | 1.57 | 0.00 | 0.048 | 28 |
| MAPK_SIGNALING_PATHWAY | 261 | 1.57 | 0.00 | 0.047 | 29 |
| CHEMOKINE_SIGNALING_PATHWAY | 180 | 1.47 | 0.01 | 0.082 | 30 |
| Downregulated (n = 45) | Size | NES | NOM p-val | FDR q-val | Rank by NES |
| VALINE_LEUCINE_AND_ISOLEUCINE_DEGRADATION * | 44 | −2.99 | 0.00 | 0.000 | 1 |
| PROPANOATE_METABOLISM * | 32 | −2.90 | 0.00 | 0.000 | 2 |
| OXIDATIVE_PHOSPHORYLATION * | 122 | −2.72 | 0.00 | 0.000 | 3 |
| BUTANOATE_METABOLISM * | 33 | −2.71 | 0.00 | 0.000 | 4 |
| PYRUVATE_METABOLISM * | 39 | −2.62 | 0.00 | 0.000 | 5 |
| PEROXISOME | 77 | −2.61 | 0.00 | 0.000 | 6 |
| FATTY_ACID_METABOLISM * | 40 | −2.60 | 0.00 | 0.000 | 7 |
| PROXIMAL_TUBULE_BICARBONATE_RECLAMATION | 23 | −2.42 | 0.00 | 0.000 | 8 |
| CITRATE_CYCLE_TCA_CYCLE * | 30 | −2.41 | 0.00 | 0.000 | 9 |
| ARGININE_AND_PROLINE_METABOLISM | 49 | −2.39 | 0.00 | 0.000 | 10 |
| BETA_ALANINE_METABOLISM | 22 | −2.39 | 0.00 | 0.000 | 11 |
| ASCORBATE_AND_ALDARATE_METABOLISM | 14 | −2.32 | 0.00 | 0.000 | 12 |
| GLYCINE_SERINE_AND_THREONINE_METABOLISM | 30 | −2.29 | 0.00 | 0.000 | 13 |
| RENIN_ANGIOTENSIN_SYSTEM | 17 | −2.24 | 0.00 | 0.000 | 14 |
| PPAR_SIGNALING_PATHWAY | 67 | −2.19 | 0.00 | 0.000 | 15 |
| LYSINE_DEGRADATION | 41 | −2.17 | 0.00 | 0.000 | 16 |
| GLYCOLYSIS_GLUCONEOGENESIS | 60 | −2.15 | 0.00 | 0.000 | 17 |
| DRUG_METABOLISM_OTHER_ENZYMES | 39 | −2.15 | 0.00 | 0.000 | 18 |
| ALANINE_ASPARTATE_AND_GLUTAMATE_METABOLISM | 32 | −2.12 | 0.00 | 0.000 | 19 |
| FRUCTOSE_AND_MANNOSE_METABOLISM | 34 | −2.08 | 0.00 | 0.001 | 20 |
| MATURITY_ONSET_DIABETES_OF_THE_YOUNG | 24 | −1.99 | 0.00 | 0.002 | 21 |
| FOLATE_BIOSYNTHESIS | 11 | −1.97 | 0.00 | 0.002 | 22 |
| RETINOL_METABOLISM | 47 | −1.95 | 0.00 | 0.002 | 23 |
| TRYPTOPHAN_METABOLISM | 39 | −1.95 | 0.00 | 0.002 | 24 |
| TERPENOID_BACKBONE_BIOSYNTHESIS | 15 | −1.94 | 0.01 | 0.002 | 25 |
| PARKINSONS_DISEASE | 118 | −1.94 | 0.00 | 0.002 | 26 |
| PENTOSE_AND_GLUCURONATE_INTERCONVERSIONS | 16 | −1.94 | 0.00 | 0.002 | 27 |
| GLYCEROLIPID_METABOLISM | 42 | −1.94 | 0.00 | 0.002 | 28 |
| DRUG_METABOLISM_CYTOCHROME_P450 | 59 | −1.94 | 0.00 | 0.002 | 29 |
| LYSOSOME | 117 | −1.91 | 0.00 | 0.003 | 30 |
| HISTIDINE_METABOLISM | 28 | −1.90 | 0.00 | 0.003 | 31 |
| HUNTINGTONS_DISEASE | 174 | −1.88 | 0.00 | 0.003 | 32 |
| LIMONENE_AND_PINENE_DEGRADATION | 10 | −1.88 | 0.00 | 0.003 | 33 |
| METABOLISM_OF_XENOBIOTICS_BY_CYTOCHROME_P450 | 57 | −1.85 | 0.00 | 0.004 | 34 |
| VIBRIO_CHOLERAE_INFECTION | 53 | −1.82 | 0.00 | 0.006 | 35 |
| ALZHEIMERS_DISEASE | 158 | −1.82 | 0.00 | 0.006 | 36 |
| ARACHIDONIC_ACID_METABOLISM | 52 | −1.81 | 0.00 | 0.006 | 37 |
| STARCH_AND_SUCROSE_METABOLISM | 36 | −1.81 | 0.00 | 0.006 | 38 |
| PANTOTHENATE_AND_COA_BIOSYNTHESIS | 16 | −1.78 | 0.00 | 0.008 | 39 |
| PHENYLALANINE_METABOLISM | 18 | −1.75 | 0.01 | 0.010 | 40 |
| PENTOSE_PHOSPHATE_PATHWAY | 26 | −1.74 | 0.00 | 0.011 | 41 |
| TYROSINE_METABOLISM | 42 | −1.74 | 0.01 | 0.011 | 42 |
| STEROID_HORMONE_BIOSYNTHESIS | 43 | −1.71 | 0.00 | 0.013 | 43 |
| GLUTATHIONE_METABOLISM | 47 | −1.70 | 0.00 | 0.014 | 44 |
| PORPHYRIN_AND_CHLOROPHYLL_METABOLISM | 29 | −1.66 | 0.01 | 0.019 | 45 |
| Upstream Regulator | Molecule Type | Predicted Activation State | z-Score | p-Value of Overlap |
|---|---|---|---|---|
| Activated (z-score ≥ 2) | ||||
| TGFB1 | growth factor | Activated | 5.99 | 4.73 × 10⁻¹⁸ |
| NUPR1 | transcription regulator | Activated | 5.91 | 1.32 × 10⁻¹ |
| Tgf beta | growth factor | Activated | 4.50 | 2.81 × 10⁻⁵ |
| IL1B | cytokine | Activated | 4.39 | 2.34 × 10⁻⁷ |
| IL6 | cytokine | Activated | 3.82 | 3.60 × 10⁻² |
| NR0B2 | ligand-dependent nuclear receptor | Activated | 3.82 | 2.01 × 10⁻³ |
| SMAD4 | transcription regulator | Activated | 3.68 | 1.13 × 10⁻³ |
| TGFBR2 | kinase | Activated | 3.67 | 9.54 × 10⁻⁵ |
| Vegf | growth factor | Activated | 3.59 | 1.71 × 10⁻⁴ |
| WNT1 | cytokine | Activated | 3.59 | 1.97 × 10⁻⁵ |
| TGFB3 | growth factor | Activated | 3.51 | 1.45 × 10⁻⁹ |
| F2 | peptidase | Activated | 3.49 | 1.03 × 10⁻⁵ |
| TNF | cytokine | Activated | 3.48 | 1.54 × 10⁻¹¹ |
| TGFA | growth factor | Activated | 3.33 | 2.24 × 10⁻¹ |
| LDL | complex | Activated | 3.32 | 1.99 × 10⁻¹ |
| IL17A | cytokine | Activated | 3.18 | 8.81 × 10⁻² |
| SRF | transcription regulator | Activated | 3.17 | 2.43 × 10⁻² |
| IL1A | cytokine | Activated | 3.15 | 1.02 × 10⁻² |
| EDN1 | cytokine | Activated | 3.12 | 7.12 × 10⁻² |
| MKL1 | transcription regulator | Activated | 3.10 | 5.94 × 10⁻² |
| STAT4 | transcription regulator | Activated | 3.04 | 2.04 × 10⁻⁷ |
| SMAD3 | transcription regulator | Activated | 3.01 | 6.54 × 10⁻⁴ |
| EGF | growth factor | Activated | 2.94 | 3.73 × 10⁻⁵ |
| P38 MAPK | mitogen-activated protein kinase | Activated | 2.82 | 4.94 × 10⁻³ |
| CSF3 | cytokine | Activated | 2.82 | 5.17 × 10⁻¹ |
| FOXL2 | transcription regulator | Activated | 2.77 | 4.34 × 10⁻¹ |
| MTPN | transcription regulator | Activated | 2.75 | 1.05 × 10⁻⁴ |
| IFNG | cytokine | Activated | 2.71 | 3.54 × 10⁻⁵ |
| IGF2BP1 | translation regulator | Activated | 2.71 | 3.43 × 10⁻⁵ |
| HTT | transcription regulator | Activated | 2.68 | 4.33 × 10⁻⁵ |
| TGFBR1 | kinase | Activated | 2.67 | 2.17 × 10⁻⁵ |
| HGF | growth factor | Activated | 2.66 | 1.37 × 10⁻⁴ |
| C5 | cytokine | Activated | 2.66 | 1.00 × 100 |
| STAT3 | transcription regulator | Activated | 2.62 | 5.35 × 10⁻² |
| OSM | cytokine | Activated | 2.59 | 3.47 × 10⁻⁹ |
| F7 | peptidase | Activated | 2.59 | 1.65 × 10⁻⁵ |
| CYP1B1 | enzyme | Activated | 2.56 | 2.38 × 10⁻⁴ |
| Cg | complex | Activated | 2.56 | 3.21 × 10⁻⁸ |
| IRF8 | transcription regulator | Activated | 2.55 | 1.00 × 100 |
| MAP2K1/2 | MEK/ERK | Activated | 2.55 | 6.69 × 10⁻³ |
| HIF1A | transcription regulator | Activated | 2.55 | 7.28 × 10⁻⁵ |
| GDF9 | growth factor | Activated | 2.55 | 5.25 × 10⁻³ |
| SMAD2 | transcription regulator | Activated | 2.53 | 1.00 × 100 |
| NRG1 | growth factor | Activated | 2.53 | 1.74 × 10⁻² |
| CTNNB1 | transcription regulator | Activated | 2.50 | 9.74 × 10⁻¹¹ |
| MAP3K1 | kinase | Activated | 2.49 | 1.32 × 10⁻¹ |
| CSF1 | cytokine | Activated | 2.48 | 4.49 × 10⁻¹ |
| PDGF BB | complex | Activated | 2.47 | 9.83 × 10⁻¹⁷ |
| SRC | kinase | Activated | 2.45 | 8.64 × 10⁻⁴ |
| ADAM17 | peptidase | Activated | 2.43 | 2.63 × 10⁻¹ |
| Inhibited (z-score ≤ -2) | ||||
| PKD1 | ion channel | Inhibited | −7.82 | 3.64 × 10⁻²⁷ |
| HNF1A | transcription regulator | Inhibited | −7.29 | 2.31 × 10⁻⁶ |
| LHX1 | transcription regulator | Inhibited | −7.07 | 2.01 × 10⁻¹⁴ |
| PXR ligand-PXR-Retinoic acid-RXR | complex | Inhibited | −5.34 | 8.61 × 10⁻⁴ |
| HNF4A | transcription regulator | Inhibited | −4.97 | 1.10 × 10⁻⁸ |
| PPARGC1A | transcription regulator | Inhibited | −4.88 | 1.51 × 10⁻² |
| INSR | kinase | Inhibited | −4.54 | 3.69 × 10⁻³ |
| Alpha catenin | group | Inhibited | −4.16 | 1.24 × 10⁻⁷ |
| Ncoa-Nr1i2-Rxra | complex | Inhibited | −4.11 | 2.81 × 10⁻⁴ |
| CAR ligand-CAR-Retinoic acid-RXR | complex | Inhibited | −4.07 | 3.38 × 10⁻³ |
| Ncoa-Nr1i3-Rxra | complex | Inhibited | −3.68 | 1.01 × 10⁻² |
| HNF4 dimer | complex | Inhibited | −3.64 | 1.01 × 10⁻² |
| AHR | ligand-dependent nuclear receptor | Inhibited | −3.51 | 4.40 × 10⁻¹² |
| WISP2 | growth factor | Inhibited | −3.45 | 5.90 × 10⁻³ |
| PPARA | ligand-dependent nuclear receptor | Inhibited | −3.44 | 1.33 × 10⁻³ |
| FOXA2 | transcription regulator | Inhibited | −3.41 | 1.86 × 10⁻¹ |
| estrogen receptor | group | Inhibited | −3.25 | 3.21 × 10⁻⁹ |
| ESRRA | ligand-dependent nuclear receptor | Inhibited | −3.23 | 1.36 × 10⁻¹ |
| SOX2 | transcription regulator | Inhibited | −3.22 | 5.04 × 10⁻⁴ |
| NKX2-1 | transcription regulator | Inhibited | −3.20 | 8.61 × 10⁻³ |
| SGK1 | kinase | Inhibited | −3.16 | 2.07 × 10⁻¹ |
| FOXA3 | transcription regulator | Inhibited | −3.15 | 7.92 × 10⁻³ |
| DICER1 | enzyme | Inhibited | −2.97 | 3.94 × 10⁻³ |
| POU3F3 | transcription regulator | Inhibited | −2.91 | 3.95 × 10⁻² |
| RXRA | ligand-dependent nuclear receptor | Inhibited | −2.86 | 7.54 × 10⁻⁴ |
| FOXI1 | transcription regulator | Inhibited | −2.84 | 1.52 × 10⁻³ |
| SMAD7 | transcription regulator | Inhibited | −2.82 | 3.44 × 10⁻⁷ |
| FGF21 | growth factor | Inhibited | −2.71 | 1.25 × 10⁻¹ |
| Immunoglobulin | complex | Inhibited | −2.67 | 3.73 × 10⁻¹ |
| ALDH1A2 | enzyme | Inhibited | −2.67 | 1.73 × 10⁻⁴ |
| KRAS | enzyme | Inhibited | −2.63 | 8.58 × 10⁻⁸ |
| NR4A3 | ligand-dependent nuclear receptor | Inhibited | −2.58 | 3.87 × 10⁻¹ |
| DKK1 | growth factor | Inhibited | −2.40 | 1.29 × 10⁻³ |
| MAX | transcription regulator | Inhibited | −2.35 | 1.42 × 10⁻² |
| KLF2 | transcription regulator | Inhibited | −2.32 | 3.91 × 10⁻² |
| CFTR | ion channel | Inhibited | −2.32 | 2.12 × 10⁻³ |
| GSK3B | kinase | Inhibited | −2.29 | 3.75 × 10⁻¹ |
| NOG | growth factor | Inhibited | −2.29 | 2.88 × 10⁻¹ |
| PPIF | enzyme | Inhibited | −2.24 | 5.10 × 10⁻¹ |
| SPDEF | transcription regulator | Inhibited | −2.20 | 2.17 × 10⁻⁵ |
| DACH1 | transcription regulator | Inhibited | −2.15 | 3.50 × 10⁻³ |
| AMPKα2 | kinase | Inhibited | −2.13 | 2.97 × 10⁻¹ |
| PTPN1 | phosphatase | Inhibited | −2.10 | 1.00 × 100 |
| SPTLC2 | enzyme | Inhibited | −2.10 | 3.88 × 10⁻² |
| Laminin | complex | Inhibited | −2.07 | 5.25 × 10⁻⁴ |
| INHA | growth factor | Inhibited | −2.05 | 1.92 × 10⁻⁸ |
| KDM1A | enzyme | Inhibited | −2.03 | 1.00 × 100 |
| ERP29 | transporter | Inhibited | −2.00 | 1.48 × 10⁻¹ |
Disclaimer/Publisher’s Note: The statements, opinions and data contained in all publications are solely those of the individual author(s) and contributor(s) and not of MDPI and/or the editor(s). MDPI and/or the editor(s) disclaim responsibility for any injury to people or property resulting from any ideas, methods, instructions or products referred to in the content. |
© 2024 by the authors. Licensee MDPI, Basel, Switzerland. This article is an open access article distributed under the terms and conditions of the Creative Commons Attribution (CC BY) license (https://creativecommons.org/licenses/by/4.0/).
Share and Cite
Song, X.; Pickel, L.; Sung, H.-K.; Scholey, J.; Pei, Y. Reprogramming of Energy Metabolism in Human PKD1 Polycystic Kidney Disease: A Systems Biology Analysis. Int. J. Mol. Sci. 2024, 25, 7173. https://doi.org/10.3390/ijms25137173
Song X, Pickel L, Sung H-K, Scholey J, Pei Y. Reprogramming of Energy Metabolism in Human PKD1 Polycystic Kidney Disease: A Systems Biology Analysis. International Journal of Molecular Sciences. 2024; 25(13):7173. https://doi.org/10.3390/ijms25137173
Chicago/Turabian StyleSong, Xuewen, Lauren Pickel, Hoon-Ki Sung, James Scholey, and York Pei. 2024. "Reprogramming of Energy Metabolism in Human PKD1 Polycystic Kidney Disease: A Systems Biology Analysis" International Journal of Molecular Sciences 25, no. 13: 7173. https://doi.org/10.3390/ijms25137173
APA StyleSong, X., Pickel, L., Sung, H.-K., Scholey, J., & Pei, Y. (2024). Reprogramming of Energy Metabolism in Human PKD1 Polycystic Kidney Disease: A Systems Biology Analysis. International Journal of Molecular Sciences, 25(13), 7173. https://doi.org/10.3390/ijms25137173