
Differential Synonymous Codon Selection in the B56 Gene Family of PP2A Regulatory Subunits

Abstract
:1. Introduction
2. Results and Discussion
2.1. Nc
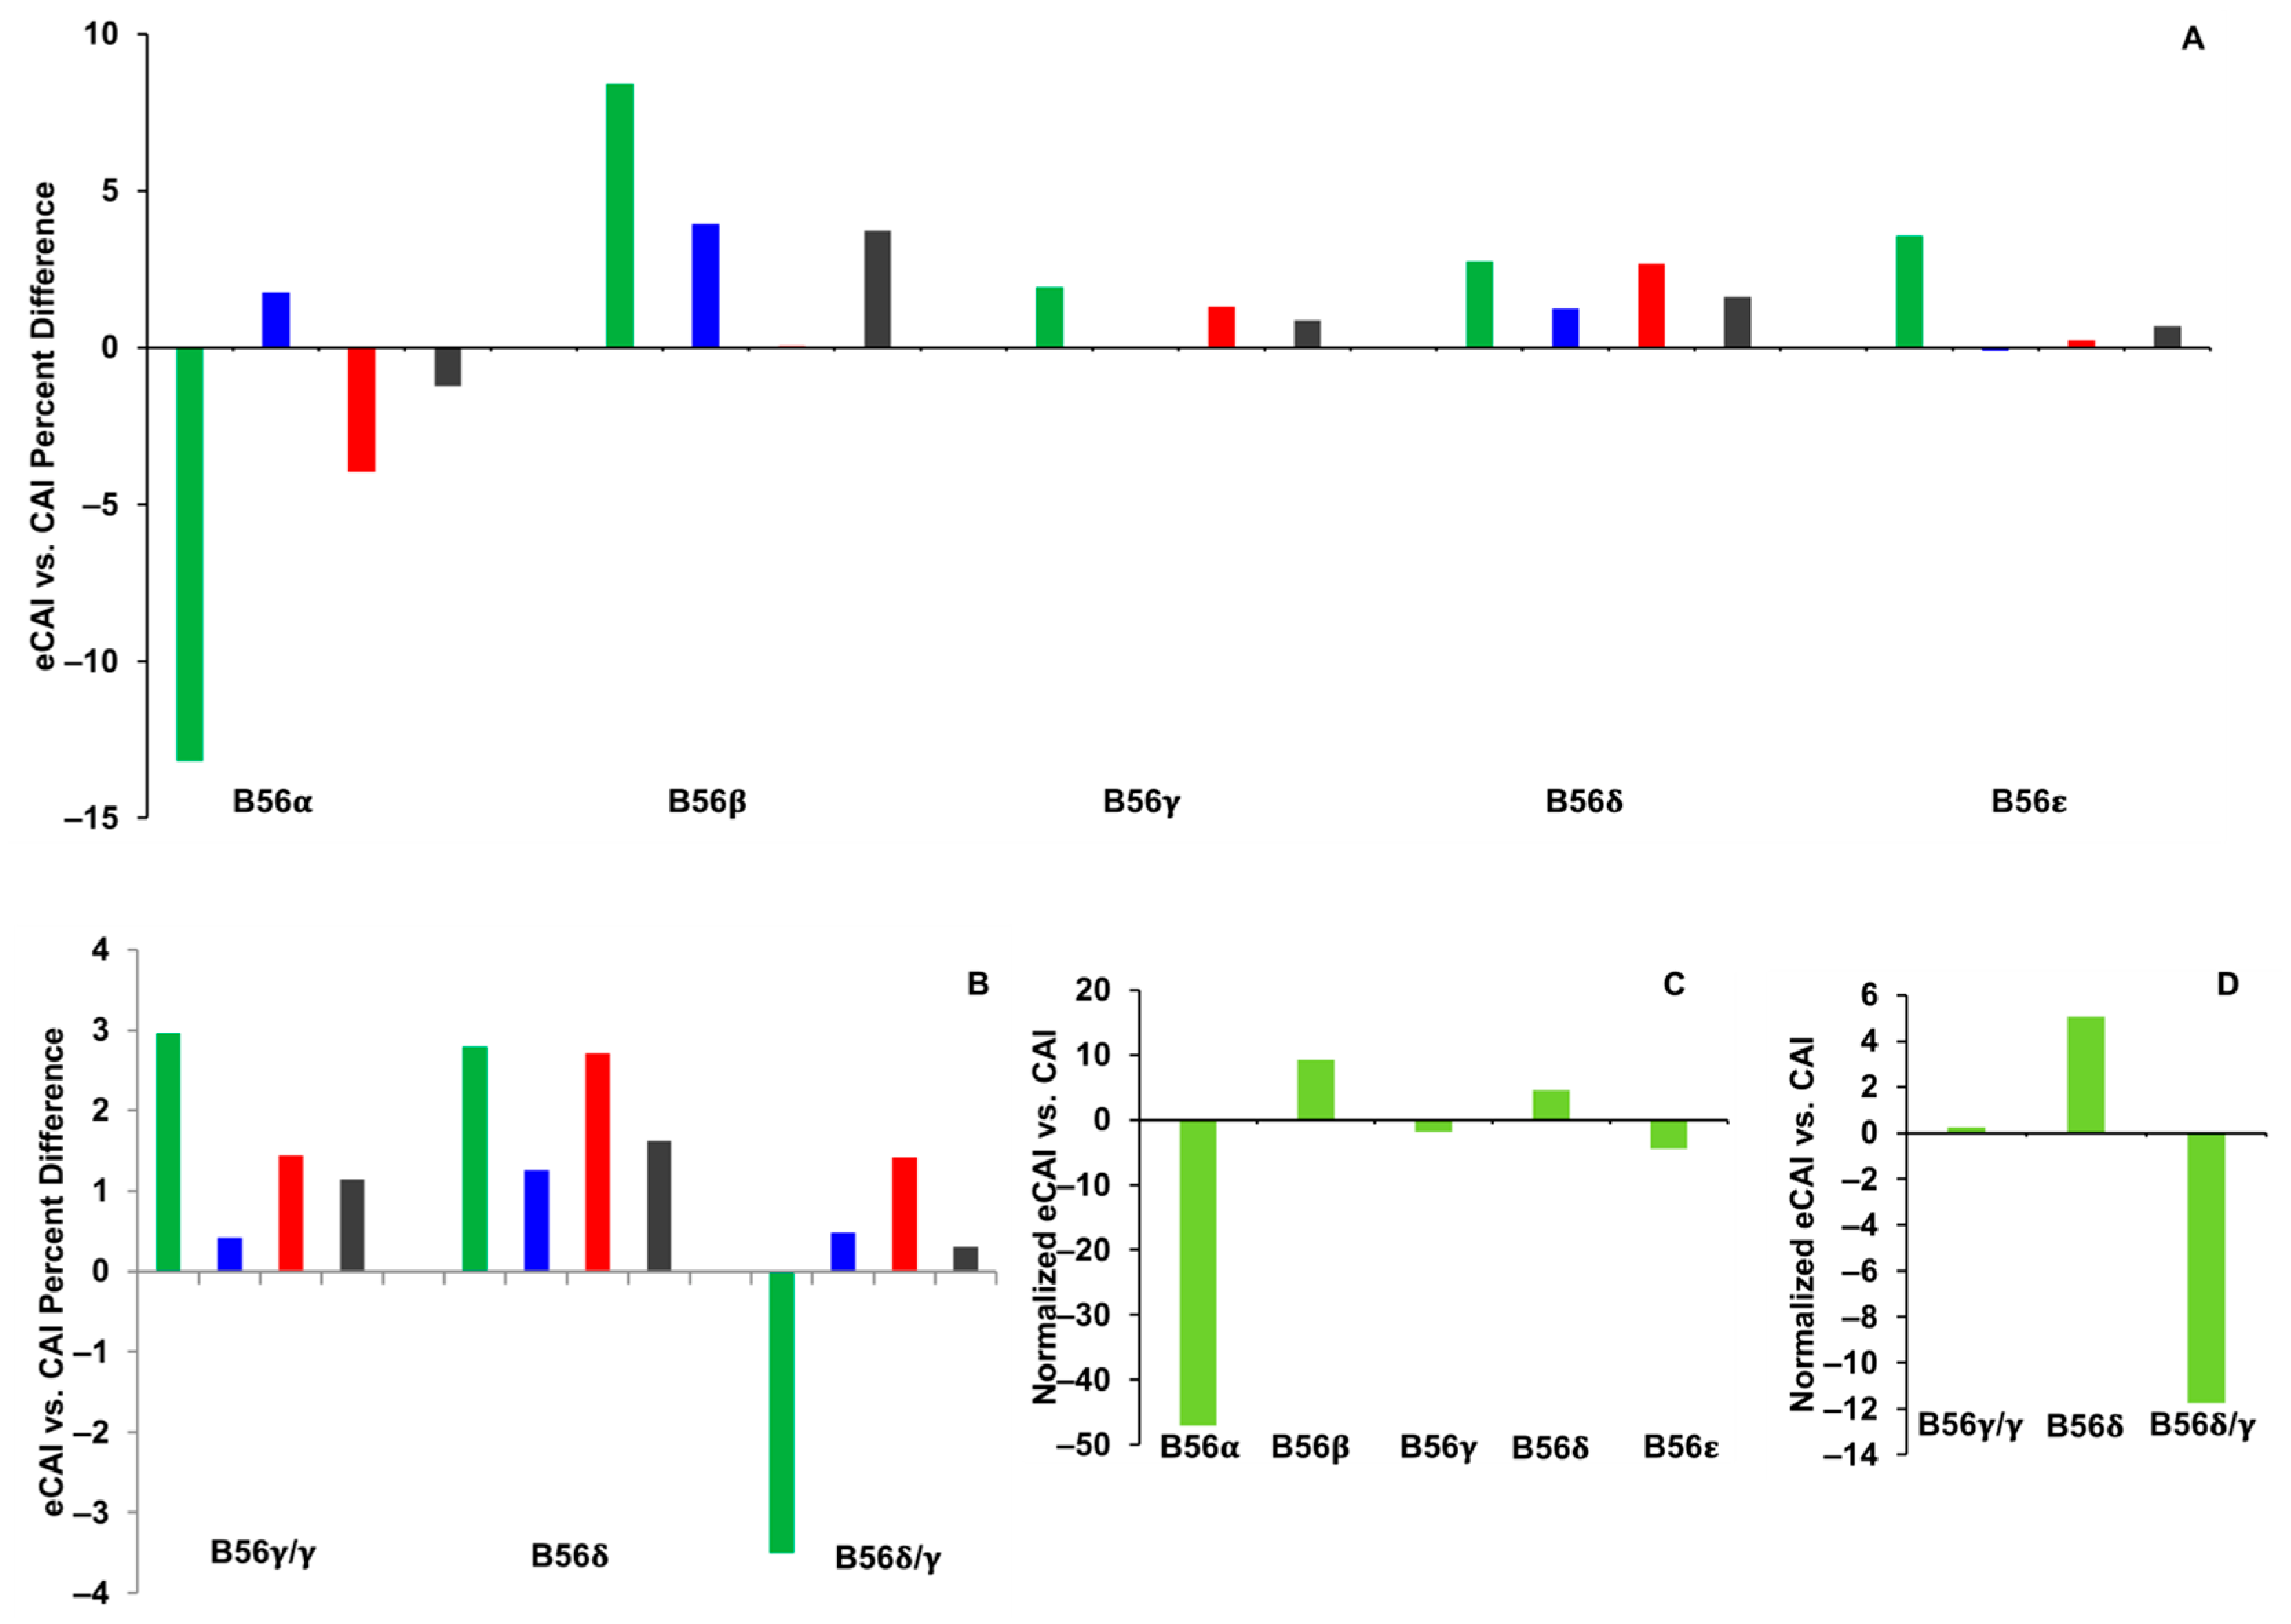
2.2. CAI
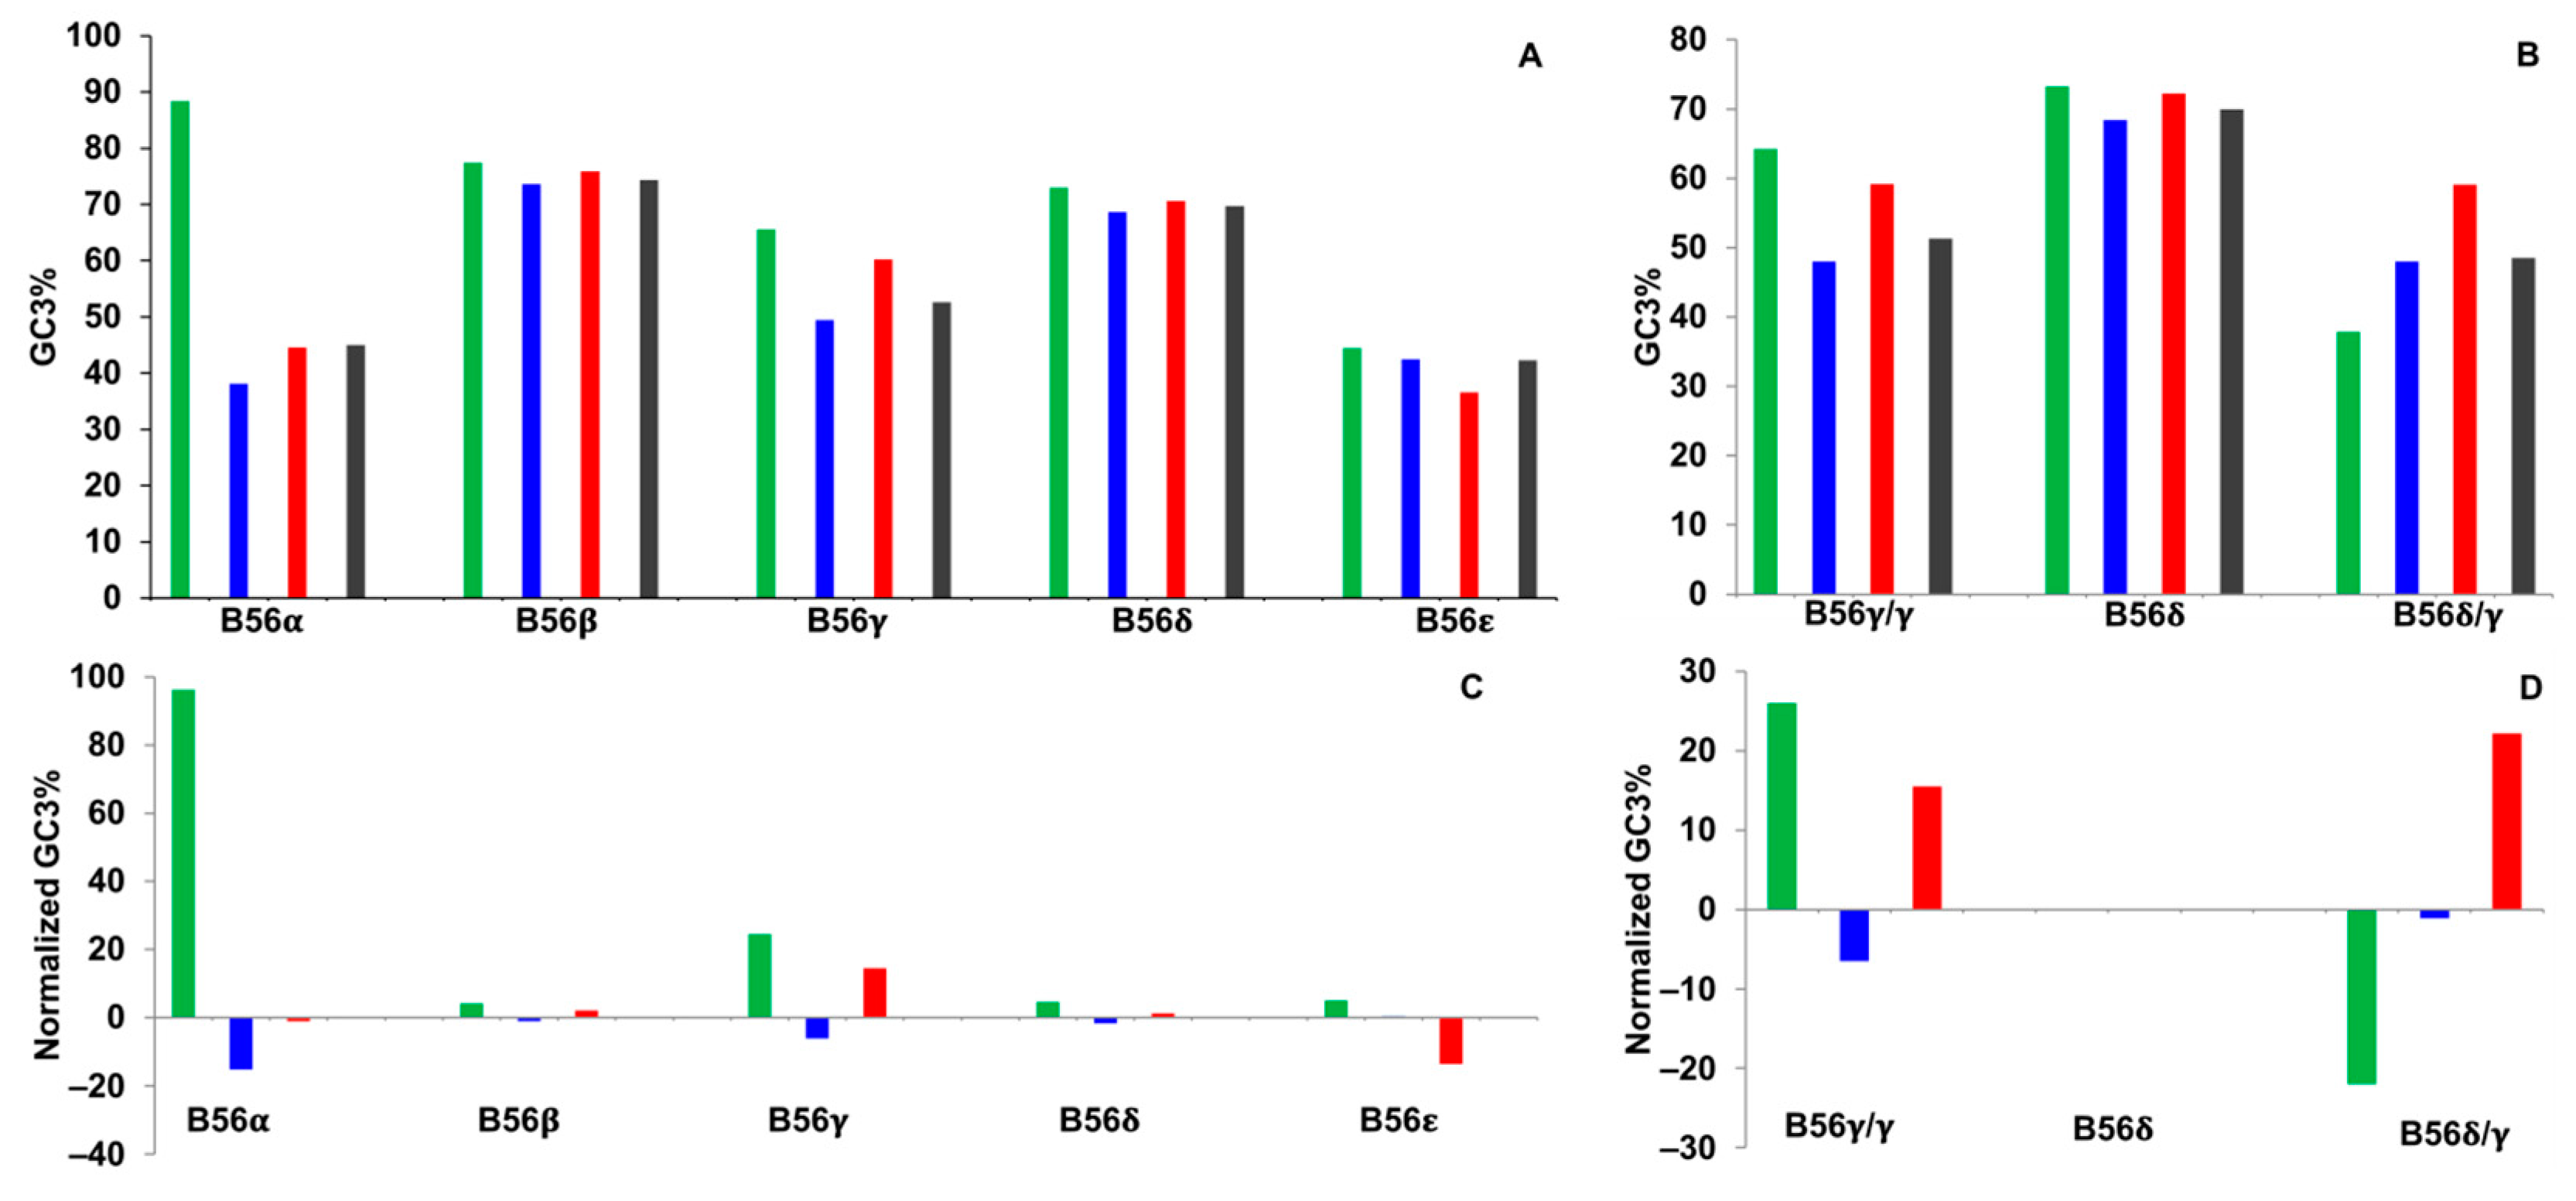
2.3. GC3%
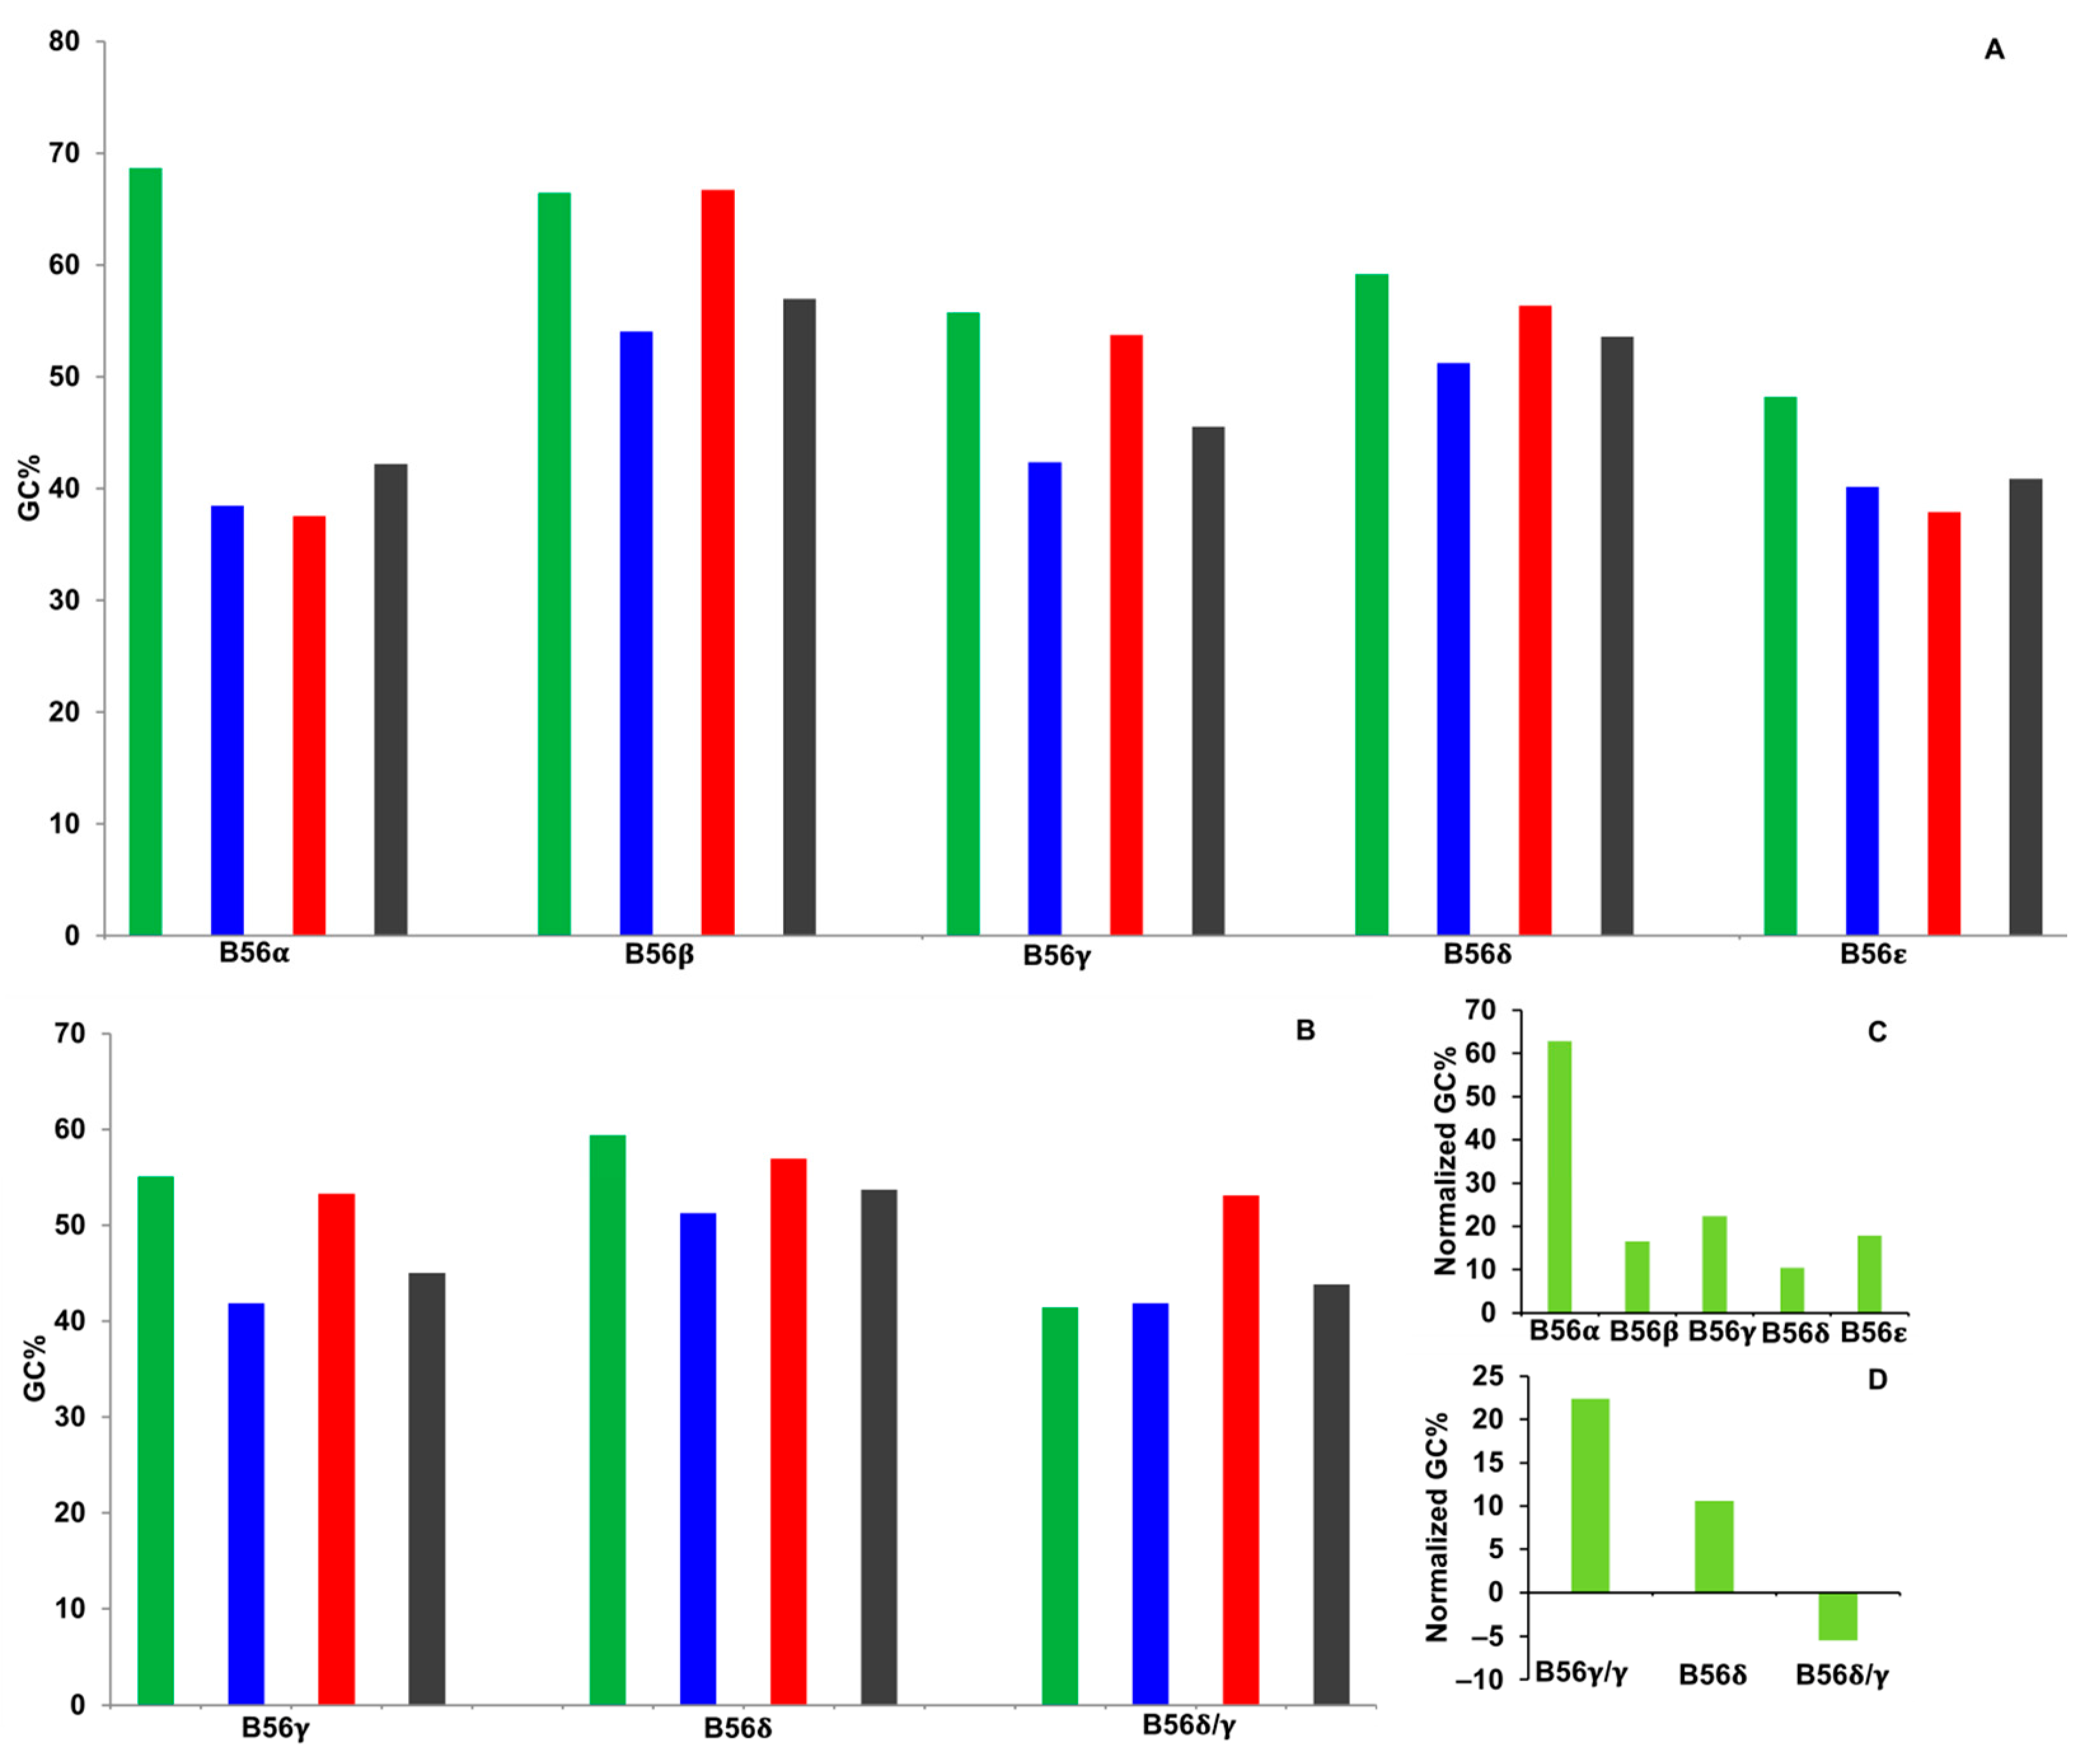
2.4. GC
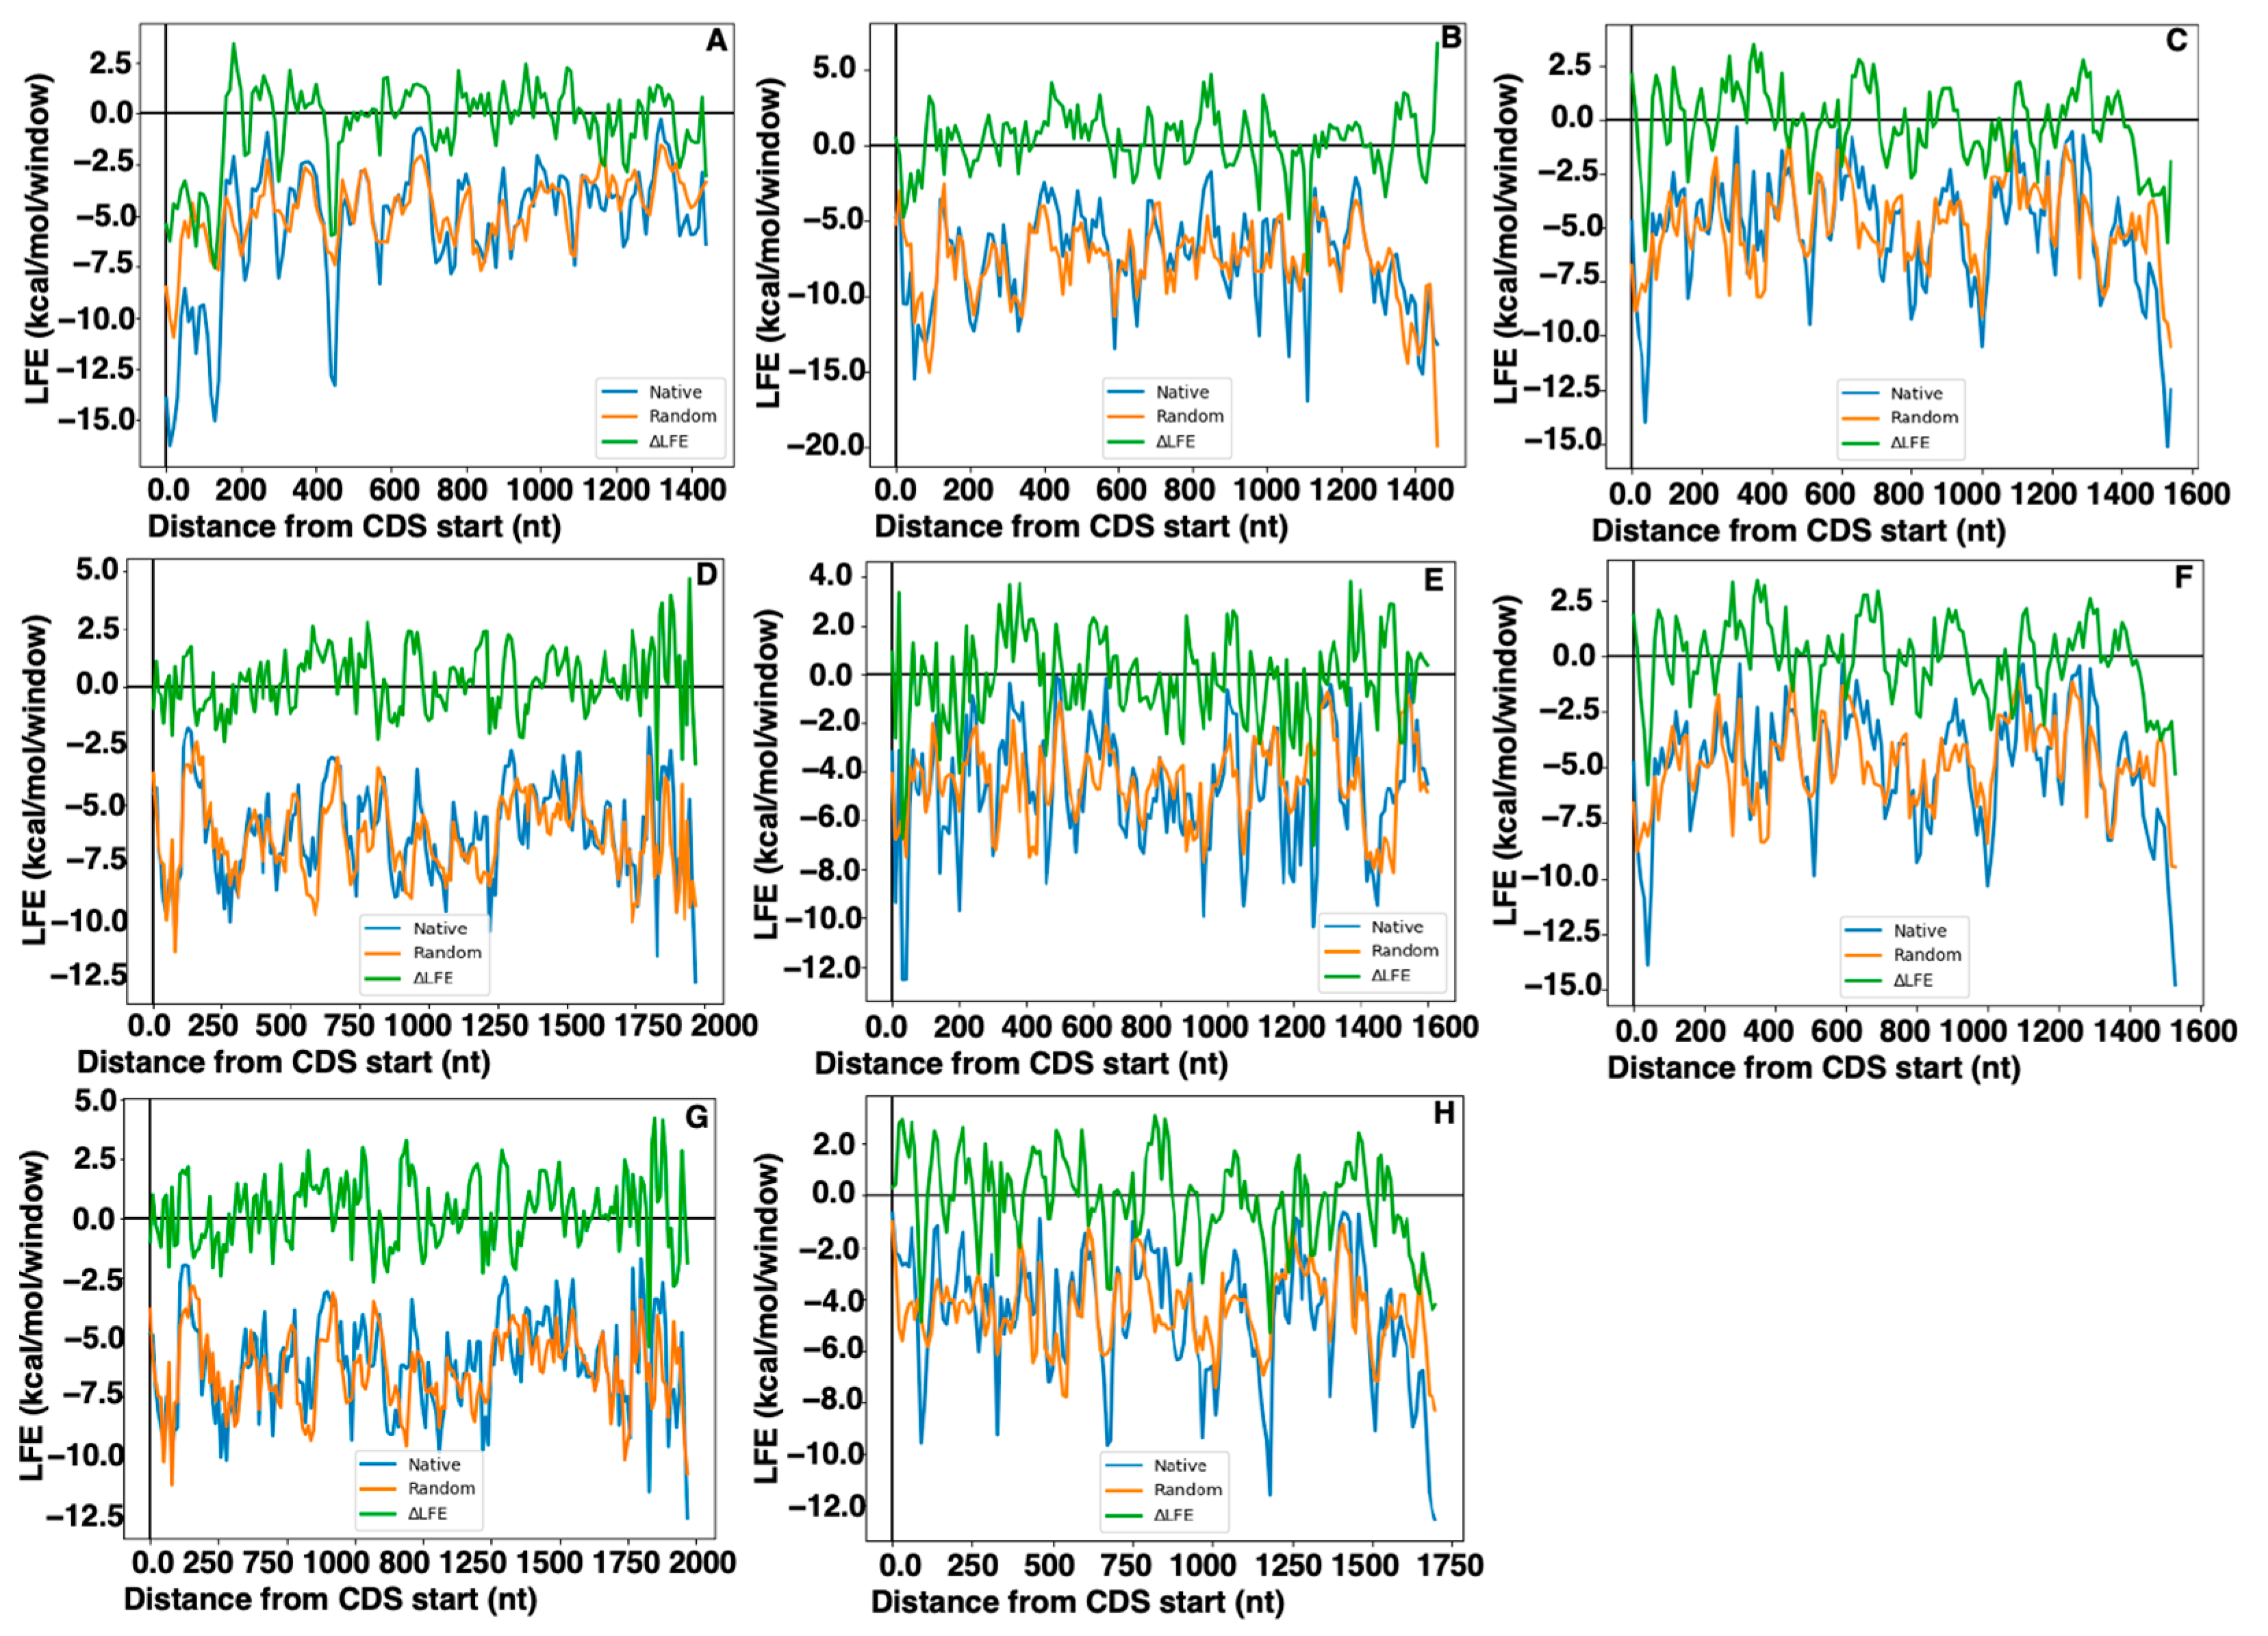
2.5. Local Folding Energy
2.6. Synonymous Mutations of B56 Isoforms in Cancer
3. Materials and Methods
3.1. Identification of B56 Isoform Homologs
3.2. CUB Calculations
3.3. RNA Local Free Energy Calculations
3.4. COSMIC Searches
4. Conclusions
Author Contributions
Funding
Institutional Review Board Statement
Informed Consent Statement
Data Availability Statement
Acknowledgments
Conflicts of Interest
References
- Yang, J.; Phiel, C. Functions of B56-containing PP2As in major developmental and cancer signaling pathways. Life Sci. 2010, 87, 659–666. [Google Scholar] [CrossRef] [PubMed]
- Thompson, J.J.; Williams, C.S. Protein Phosphatase 2A in the Regulation of Wnt Signaling, Stem Cells, and Cancer. Genes 2018, 9, 121. [Google Scholar] [CrossRef] [PubMed]
- Yang, J.; Wu, J.; Tan, C.; Klein, P.S. PP2A:B56epsilon is required for Wnt/beta-catenin signaling during embryonic development. Development 2003, 130, 5569–5578. [Google Scholar] [CrossRef]
- Gao, Z.H.; Seeling, J.M.; Hill, V.; Yochum, A.; Virshup, D.M. Casein kinase I phosphorylates and destabilizes the beta-catenin degradation complex. Proc. Natl. Acad. Sci. USA 2002, 99, 1182–1187. [Google Scholar] [CrossRef] [PubMed]
- Sommer, L.M.; Cho, H.; Choudhary, M.; Seeling, J.M. Evolutionary Analysis of the B56 Gene Family of PP2A Regulatory Subunits. Int. J. Mol. Sci. 2015, 16, 10134–10157. [Google Scholar] [CrossRef] [PubMed]
- Athey, J.; Alexaki, A.; Osipova, E.; Rostovtsev, A.; Santana-Quintero, L.V.; Katneni, U.; Simonyan, V.; Kimchi-Sarfaty, C. A new and updated resource for codon usage tables. BMC Bioinform. 2017, 18, 391. [Google Scholar] [CrossRef] [PubMed]
- Kudla, G.; Lipinski, L.; Caffin, F.; Helwak, A.; Zylicz, M. High guanine and cytosine content increases mRNA levels in mammalian cells. PLoS Biol. 2006, 4, e180. [Google Scholar] [CrossRef]
- Quax, T.E.; Claassens, N.J.; Soll, D.; van der Oost, J. Codon Bias as a Means to Fine-Tune Gene Expression. Mol. Cell 2015, 59, 149–161. [Google Scholar] [CrossRef]
- Peeri, M.; Tuller, T. High-resolution modeling of the selection on local mRNA folding strength in coding sequences across the tree of life. Genome Biol. 2020, 21, 63. [Google Scholar] [CrossRef]
- Zhou, Y.; Zhou, Y.S.; He, F.; Song, J.; Zhang, Z. Can simple codon pair usage predict protein-protein interaction? Mol. Biosyst. 2012, 8, 1396–1404. [Google Scholar] [CrossRef]
- Gutman, T.; Goren, G.; Efroni, O.; Tuller, T. Estimating the predictive power of silent mutations on cancer classification and prognosis. NPJ Genom. Med. 2021, 6, 67. [Google Scholar] [CrossRef] [PubMed]
- Tuller, T.; Carmi, A.; Vestsigian, K.; Navon, S.; Dorfan, Y.; Zaborske, J.; Pan, T.; Dahan, O.; Furman, I.; Pilpel, Y. An evolutionarily conserved mechanism for controlling the efficiency of protein translation. Cell 2010, 141, 344–354. [Google Scholar] [CrossRef] [PubMed]
- Dehal, P.; Boore, J.L. Two rounds of whole genome duplication in the ancestral vertebrate. PLoS Biol. 2005, 3, e314. [Google Scholar] [CrossRef] [PubMed]
- Lampson, B.L.; Pershing, N.L.; Prinz, J.A.; Lacsina, J.R.; Marzluff, W.F.; Nicchitta, C.V.; MacAlpine, D.M.; Counter, C.M. Rare codons regulate KRas oncogenesis. Curr. Biol. 2013, 23, 70–75. [Google Scholar] [CrossRef] [PubMed]
- Munk, M.; Villalobo, E.; Villalobo, A.; Berchtold, M.W. Differential expression of the three independent CaM genes coding for an identical protein: Potential relevance of distinct mRNA stability by different codon usage. Cell Calcium 2022, 107, 102656. [Google Scholar] [CrossRef] [PubMed]
- Bourret, J.; Borveto, F.; Bravo, I.G. Subfunctionalisation of paralogous genes and evolution of differential codon usage preferences: The showcase of polypyrimidine tract binding proteins. J. Evol. Biol. 2023, 36, 1375–1392. [Google Scholar] [CrossRef]
- Hia, F.; Yang, S.F.; Shichino, Y.; Yoshinaga, M.; Murakawa, Y.; Vandenbon, A.; Fukao, A.; Fujiwara, T.; Landthaler, M.; Natsume, T.; et al. Codon bias confers stability to human mRNAs. EMBO Rep. 2019, 20, e48220. [Google Scholar] [CrossRef]
- Tatarinova, T.; Elhaik, E.; Pellegrini, M. Cross-species analysis of genic GC3 content and DNA methylation patterns. Genome Biol. Evol. 2013, 5, 1443–1456. [Google Scholar] [CrossRef]
- Qureshi, O.; Cho, H.; Choudhary, M.; Seeling, J.M. A Nonsynonymous/Synonymous Substitution Analysis of the B56 Gene Family Aids in Understanding B56 Isoform Diversity. PLoS ONE 2015, 10, e0145529. [Google Scholar] [CrossRef]
- Parvathy, S.T.; Udayasuriyan, V.; Bhadana, V. Codon usage bias. Mol. Biol. Rep. 2022, 49, 539–565. [Google Scholar] [CrossRef]
- Baek, S.; Seeling, J.M. Identification of a novel conserved mixed-isoform B56 regulatory subunit and spatiotemporal regulation of protein phosphatase 2A during Xenopus laevis development. BMC Dev. Biol. 2007, 7, 139. [Google Scholar] [CrossRef] [PubMed]
- Hershberg, R.; Petrov, D.A. General rules for optimal codon choice. PLoS Genet. 2009, 5, e1000556. [Google Scholar] [CrossRef] [PubMed]
- Puigbo, P.; Bravo, I.G.; Garcia-Vallve, S. CAIcal: A combined set of tools to assess codon usage adaptation. Biol. Direct 2008, 3, 38. [Google Scholar] [CrossRef] [PubMed]
- Puigbo, P.; Bravo, I.G.; Garcia-Vallve, S. E-CAI: A novel server to estimate an expected value of Codon Adaptation Index (eCAI). BMC Bioinform. 2008, 9, 65. [Google Scholar] [CrossRef] [PubMed]
- Tuller, T.; Veksler-Lublinsky, I.; Gazit, N.; Kupiec, M.; Ruppin, E.; Ziv-Ukelson, M. Composite effects of gene determinants on the translation speed and density of ribosomes. Genome Biol. 2011, 12, R110. [Google Scholar] [CrossRef] [PubMed]
- Bentele, K.; Saffert, P.; Rauscher, R.; Ignatova, Z.; Bluthgen, N. Efficient translation initiation dictates codon usage at gene start. Mol. Syst. Biol. 2013, 9, 675. [Google Scholar] [CrossRef] [PubMed]
- Osterman, I.A.; Chervontseva, Z.S.; Evfratov, S.A.; Sorokina, A.V.; Rodin, V.A.; Rubtsova, M.P.; Komarova, E.S.; Zatsepin, T.S.; Kabilov, M.R.; Bogdanov, A.A.; et al. Translation at first sight: The influence of leading codons. Nucleic Acids Res. 2020, 48, 6931–6942. [Google Scholar] [CrossRef]
- Costantini, M.; Cammarano, R.; Bernardi, G. The evolution of isochore patterns in vertebrate genomes. BMC Genom. 2009, 10, 146. [Google Scholar] [CrossRef]
- Sharma, Y.; Miladi, M.; Dukare, S.; Boulay, K.; Caudron-Herger, M.; Gross, M.; Backofen, R.; Diederichs, S. A pan-cancer analysis of synonymous mutations. Nat. Commun. 2019, 10, 2569. [Google Scholar] [CrossRef]
- Wright, F. The ‘effective number of codons’ used in a gene. Gene 1990, 87, 23–29. [Google Scholar] [CrossRef]


| B56 Isoform | Abundance of Synonymous Mutations with Respect to All Mutations (%) | Abundance of Synonymous Mutations with Respect to Missense Mutations (%) |
|---|---|---|
| B56α | 17 | 36 |
| B56β | 25 | 40 |
| B56γ | 16 | 28 |
| B56δ | 27 | 55 |
| B56ε | 18 | 30 |
Disclaimer/Publisher’s Note: The statements, opinions and data contained in all publications are solely those of the individual author(s) and contributor(s) and not of MDPI and/or the editor(s). MDPI and/or the editor(s) disclaim responsibility for any injury to people or property resulting from any ideas, methods, instructions or products referred to in the content. |
© 2023 by the authors. Licensee MDPI, Basel, Switzerland. This article is an open access article distributed under the terms and conditions of the Creative Commons Attribution (CC BY) license (https://creativecommons.org/licenses/by/4.0/).
Share and Cite
Corzo, G.; Seeling-Branscomb, C.E.; Seeling, J.M. Differential Synonymous Codon Selection in the B56 Gene Family of PP2A Regulatory Subunits. Int. J. Mol. Sci. 2024, 25, 392. https://doi.org/10.3390/ijms25010392
Corzo G, Seeling-Branscomb CE, Seeling JM. Differential Synonymous Codon Selection in the B56 Gene Family of PP2A Regulatory Subunits. International Journal of Molecular Sciences. 2024; 25(1):392. https://doi.org/10.3390/ijms25010392
Chicago/Turabian StyleCorzo, Gabriel, Claire E. Seeling-Branscomb, and Joni M. Seeling. 2024. "Differential Synonymous Codon Selection in the B56 Gene Family of PP2A Regulatory Subunits" International Journal of Molecular Sciences 25, no. 1: 392. https://doi.org/10.3390/ijms25010392
APA StyleCorzo, G., Seeling-Branscomb, C. E., & Seeling, J. M. (2024). Differential Synonymous Codon Selection in the B56 Gene Family of PP2A Regulatory Subunits. International Journal of Molecular Sciences, 25(1), 392. https://doi.org/10.3390/ijms25010392