1. Introduction
Watermelon (
Citrullus lanatus L.), cucumber (
Cucumis sativus L.), pumpkin (
Cucurbita pepo L.), and squash (
Cucurbita moschata Duchesne) all belong to the Cucurbitaceae family. Originating in South Africa [
1], watermelon is a fruit with a diploid chromosomal count of 2n = 22; its genome contains approximately 424 million base pairs (bp) and 22,571 genes [
1]. Globally, watermelon is considered an important agricultural crop; for example, 1.1 million tons of watermelons were cultivated on 3.1 million hectares of land throughout the world in 2021 [
2]. Despite watermelon’s global significance in agriculture, there remain specific challenges and gaps in our understanding of the fruit’s color. These include limited insights into the genetic mechanisms driving color variation, the environmental influences on pigment accumulation, and the interaction between genetic and environmental factors. Addressing these gaps is essential for breeding strategies aimed at improving fruit quality and consumer appeal.
Fruit color is an essential breeding trait that significantly affects consumer preference and the market value of the fruit in relation to visual appeal and the associated health benefits. Watermelon flesh ranges in color, including white, light yellow, canary-yellow, salmon yellow, orange, pink, red (scarlet or coral), and green [
3,
4], and the color is primarily attributed to the composition of carotenoids that accumulate in the chromoplasts [
5]. For instance, the predominant red flesh of cultivated watermelons results from the accumulation of all-trans-lycopene, while the orange flesh primarily arises from the accumulation of either ζ-carotene and β-carotene or prolycopene (7,9,7’,9’-tetra-cis-lycopene) [
3,
4], and the canary-yellow flesh results from the synthesis of xanthophyll, including neoxanthin, violaxanthin, and zeaxanthin, from carotene via the carotenoid biosynthesis pathway [
4,
6,
7]. The carotenoid composition in watermelon, contributing to the orange flesh color, is primarily due to the accumulation of ζ-carotene, β-carotene, and prolycopene. This accumulation is influenced by a combination of environmental factors, such as light exposure and temperature, and genetic factors, particularly the expression and functionality of enzymes like phytoene synthase (PSY) in the carotenoid biosynthesis pathway. Genetically, the preference for one biosynthetic pathway over another is governed by the expression and activity of key enzymes in the carotenoid pathway. Variations in genes encoding these enzymes, such as phytoene synthase, can shift the balance towards either ζ-carotene or β-carotene/prolycopene production, thereby influencing the fruit color and carotenoid profile of the watermelon flesh.
In the initial stages of carotenoid synthesis in the watermelon flesh, geranylgeranyl pyrophosphate (GGPP) within the plastids is catalyzed by the first enzyme involved in the carotenogenic pathway, phytoene synthase (PSY), to produce phytoene. DNA sequence variations in the phytoene synthase gene (PSY1), which influences the early stages of carotenoid synthesis, have been recognized as being the cause of color differences between orange-, red-, and canary-yellow-fleshed watermelon cultivars [
8,
9] by altering their activity or expression, affecting phytoene production and downstream carotenoid. Enhanced PSY1 activity can increase β-carotene or lycopene levels, intensifying flesh colors to orange or red, while reduced activity can lead to lighter colors like canary-yellow. Therefore, these variations, including point mutations, insertions, deletions, and regulatory changes, crucially dictate the watermelon’s flesh color by impacting the early stages of the carotenoid pathway. Subsequent to the action of PSY, a series of enzymatic reactions involving phytoene desaturase (PDS), ζ-carotene desaturase (ZDS), ζ-carotene isomerase (Z-ISO), and prolycopene isomerase (CRTISO) desaturate isomerize phytoenes to produce prolycopene and all-trans-lycopene. To date, loss-of-function mutations in CRTISO have been observed in
Arabidopsis [
10], tomatoes [
11], and melons [
12], leading to the accumulation of prolycopene. Similarly, the relationship between a non-synonymous single-nucleotide polymorphism (SNP) in CRTISO and the development of orange flesh with a high prolycopene content has been identified in watermelons [
13]. In addition, the conversion of all-trans-lycopene into β-carotene is exclusively mediated by lycopene β-cyclase (
LCYB). Mutations in the LCYB gene lead to the accumulation of all-trans-lycopene, which is associated with the formation of red flesh in watermelons [
14]. Further downstream, β-carotene is enzymatically transformed into xanthophyll, which is primarily responsible for the occurrence of canary-yellow flesh. These conversions are facilitated by β-carotene hydroxylase (CHYB). However, although the presence of β-carotene in orange-fleshed watermelons is attributed to the function of CHYB, the relationship between the mutations in the CHYB gene and β-carotene accumulation has not been reported.
To determine the effect of a specific genetic mutation on a certain phenotype, individuals carrying the mutation can be compared with those that share an identical genetic background. However, identifying individuals with perfectly matched genetic profiles is challenging. In such situations, near-isogenic lines (NILs) offer highly efficient resources. NILs possess nearly indistinguishable genetic backgrounds, except for genes linked to the specific traits under investigation. These lines are typically developed by transferring the desired traits from a donor parent to a recipient parent through a series of repeated backcrossing steps. Subsequently, genome-wide comparisons of gene sequences between NILs and identification of introgressed chromosomal regions can be easily achieved through whole-genome resequencing (WGRS) using next-generation sequencing (NGS) technology. In the context of watermelon research, the comprehensive comparison of whole-genome sequences in NILs has been proven effective in identifying genomic regions associated with target traits, such as high trans-lycopene content, as demonstrated by Lee et al. [
15].
Therefore, this study aimed to determine the genetic factors responsible for the manifestation of orange flesh with a high β-carotene content in watermelons (herein referred to as orange-β). Three distinct breeding lines were employed in this study: orange-β, canary-yellow, and red flesh, and the selection of the three distinct breeding lines in our study was decisive for exploring the genetic underpinnings of carotenoid accumulation and flesh color variation in watermelon. The orange-β line, rich in β-carotene, contrasted with the canary-yellow and red-flesh lines, provides a diverse genetic spectrum for analyzing carotenoid accumulation. By using a red-fleshed line as the recurrent parent, two NILs were meticulously developed to produce orange-β- and canary-yellow-fleshed lines. The primary investigative approach encompassed an in-depth comparative analysis of whole-genome sequences among the parent lines and NILs to identify introgression regions and potential candidate genes. To substantiate a genetic linkage between the candidate gene within the introgressed region and the orange-β trait, genetic mapping was diligently executed employing an F2 progeny.
3. Discussion
Carotenoids are active biological pigments that affect the economic value of watermelon fruit. The various flesh colors of watermelon result from the distinct composition of carotenoids that accumulate in the chromoplasts. It is acknowledged that the manifestation of orange-colored flesh may be due to the accumulation of β-carotene, which is a precursor to vitamin A and is known for its antioxidant properties and immune-support functions. Therefore, gaining insights into the genetic mechanisms governing the development of orange flesh with a high β-carotene content is important for enhancing the quality and nutritional benefits of watermelons.
In this study, we investigated two NILs characterized by distinct orange-β and canary-yellow flesh colors as well as an F2 population derived from these NILs. Based on the results of our comparative analysis of the introgression regions in the NILs and genetic linkage analysis, we found that ClPSY1 on Chr. 1 was the most likely candidate gene responsible for the development of orange-β flesh. An SNP that alters lysine to glutamine at the 149th position in PSY1 was distinguished between the ClPSY1 alleles that dictate orange-β and non-orange-β fruit flesh, and it was determined that the presence of the ClLCYB allele that dictates canary-yellow flesh is required for the expression of orange-β flesh. This inference was drawn from the enzymatic role of LCYB in converting all-trans-lycopene (responsible for the formation of red flesh) into β-carotene, which forms orange-β flesh through the carotenoid metabolic pathway. We also conducted genotyping on 22 different watermelon cultivars using the CAPS markers developed from non-synonymous SNPs detected in these two genes and CRTISO for orange-p flesh. Our results confirmed the potential application of these three gene-based markers in MAS for determining the carotenoid composition and flesh color of watermelons.
PSY plays a major rate-limiting role in carotenoid biosynthesis [
16]. At the upstream of carotenoid biosynthesis, PSY condenses two GGPPs to produce phytoene, which is the first carotenoid product. Although the correlation between PSY protein levels and the carotenoid content has been reported in
Arabidopsis and carrots [
17], the mechanism by which
ClPSY1 regulates β-carotene accumulation in orange watermelon flesh is not fully understood. However, the mutant allele of
CRTISO, which catalyzes the conversion of phytoene into red-colored lycopene, is associated with a high prolycopene content in a range of fruit flesh types. Similarly, the mutation in
CHYB, which converts β-carotene into xanthophyll, may be responsible for β-carotene accumulation in watermelon flesh. However, no studies to date have supported such an inference. By conducting quantitative trait locus (QTL) mapping for orange-β flesh based on the genotyping-by-sequencing (GBS) results of F
2:3, Branham et al. [
18] identified a significant SNP at 8,973,472 bp on Chr. 1. This locus is located approximately 1.5 Mb upstream of
ClPSY and 2.0 Mb downstream of
CHYB. Although the results suggested
CHYB as a candidate gene responsible for high β-carotene accumulation, the cloning and sequencing of this gene revealed no sequence variation in
CHYB between the parents of the F
2:3 population. Furthermore, in our results,
CHYB was not located in the introgression regions of NB-DAH NIL, and no SNPs were detected in this gene among the parents; thus,
CHYB may not be associated with β-carotene accumulation in orange watermelon flesh.
Recently, two independent studies suggested that
PSY1 is a candidate gene for orange flesh. Song et al. [
19] conducted a comparative analysis of the whole-genome sequence of 24 watermelon inbred lines (six orange-, nine red-, and nine yellow-fleshed) and reported that the non-synonymous SNP (A>G) in the first exon of
ClPSY1, which is the same SNP discovered in our study, exhibited an 87.5% matching rate to flesh color; the SNP (G) for orange color was present in all six orange-fleshed lines, two red-, and one yellow-fleshed lines. In addition, by performing a high-resolution genetic mapping of an F
2 population derived from red- and orange-β-fleshed inbreds, Nie et al. [
4] identified two carotenoid biosynthesis genes in the QTL intervals:
ClPSY1 on Chr. 1 and
RCCR encoding red chlorophyll catabolite reductase (RCCR) on Chr. 2. The non-synonymous SNP (A>G) in
ClPSY1 was also detected by Nie et al. [
4]. In higher plants, RCCR is essential for chlorophyll degradation during leaf senescence and fruit ripening. Although Nie et al. [
4] suggested the possible role of
RCCR in the regulation of lycopene and β-carotene biosynthesis, we were unable to determine a sequence variant in the coding region of this gene from the WGRS data of parental lines in our study.
In melons, the
CmOr gene (
MELO3C005449) encodes the orange protein that controls the accumulation of β-carotene, the predominant carotenoid in orange-fleshed melon fruits [
20,
21].
CmOr induces chromoplast formation with arrested β-carotene turnover in orange-fleshed melon fruits through the posttranscriptional regulation of
PSY. An SNP that replaces arginine (Arg) with histidine (His) in the orange protein leads to a higher accumulation of β-carotene. Thus, a CAPS marker based on this SNP allows for differentiation between orange and green melon fruits. An orange gene-homologue (Orange-Orange,
Cla97C01G005050) in watermelon is located at approximately 5.3 Mb upstream of
PSY1 on Chr. 1. However, this gene was not included in the introgression regions of NB-DAH NIL, and no SNPs were detected in this gene among the parents.
4. Materials and Methods
4.1. Development of Near Isogenic Lines (NILs) and F2 Population
The canary-yellow-fleshed (OTO-DAH NIL) and orange-β-fleshed (NB-DAH NIL) NILs were developed using inbred canary-yellow-fleshed OTO9491 and orange-β-fleshed NB5410 as the donor parents and red-fleshed inbred DAH as the recurrent parent (
Figure 5). To develop each NIL, F
1 plants obtained by crossing the donor and recurrent parents were backcrossed to the recurrent parent. Subsequently, a canary-yellow-fleshed or an orange-β-fleshed individual was selected from the BC
1F
1 generation, and the selected individuals were then backcrossed to the recurrent parent to produce the BC
2F
1 generation. Canary-yellow- and orange-fleshed BC
2F
1 individuals were selected for self-pollination. The selection of individuals and self-pollination were repeated for additional two generations to form the BC
2F
4 generation and develop genetically fixed NILs: canary-yellow-fleshed OTO-DAH NIL and orange-β-fleshed NB-DAH NIL (
Figure 5). Thus, the OTO-DAH and NB-DAH NILs shared the genetic background of DAH while exhibiting canary-yellow and orange flesh, respectively.
For genetic mapping, an F
2 population was developed by self-pollinating an F
1 individual derived from crossing the OTO-DAH NIL and NB-DAH NIL (
Figure 5). The NILs and the F
2 population were obtained through artificial pollination in a greenhouse located at the breeding field of Partner Seed Company (Ansung, Republic of Korea) from 2015 to 2020.
4.2. Analysis of Flesh Color and β-Carotene
The seedlings of watermelon plants were grafted onto squash rootstocks (“Shin-toza”) at the first true-leaf stage. Twenty days after grafting, three to six plants per line were transplanted in a vinyl greenhouse (Changwon, Republic of Korea). The watermelons were cultivated using the typical summer cultivation method practiced in the Republic of Korea, where each plant is grown on the ground and produces one fruit. For flesh color and carotenoid analysis, the fruits were harvested 40 days after flowering, cut in half, and photographed, and four cubes (approximately 5 g of fresh weight) were sliced from both halves, starting from the center. After removing the seeds, flesh samples were freeze-dried using a vacuum freeze-drying system (Biocryos, Daegu, Republic of Korea).
For high-performance liquid chromatography (HPLC), the freeze-dried flesh samples were powdered, and 1.0 g of the powdered samples was used for each extraction. Three crushed samples from each variety were placed in a 50-mL Falcon tube, and 20 mL of acetone was added. The samples were then sonicated for 3 min to achieve complete homogenization. Following the complete homogenization of the samples, they were left undisturbed at a low temperature (4 °C) in the dark for 12 h. The supernatant was collected by centrifugation at 1500× g for 5 min, and the supernatant was dried using a rotary evaporator at 25 °C. Subsequently, the concentrated extract was dissolved in a mixture of methyl tert-butyl ether and methanol (1:1, 2 mL v/v) and passed through a 0.45 μm filter for HPLC analysis.
HPLC was performed using an Agilent Technologies 1100 Series HPLC system (Palo Alto, CA, USA) equipped with a degasser, pump, autosampler, and column oven. Separation was conducted on an MGII C18 column (4.6 mm × 250 mm, 5 μm; Shiseido, Tokyo, Japan) maintained at 25 °C. The mobile phase consisted of 90% acetonitrile (A) and 100% ethyl acetate (B). The linear gradient conditions were as follows: 0–16 min, 0–57% (B); 16–30 min, 57% (B); and 30–40 min, 57–100% (B). The flow rate was set at 1.0 mL/min, and the injection volume was 20 μL. β-carotene was identified and quantified based on the absorbance value at 450–471 nm. The standard for β-carotene was obtained from Sigma-Aldrich (St. Louis, MO, USA).
4.3. Analysis of Genetic Inheritance of Orange-β Flesh
The F2 plants were categorized based on their flesh color: “A” for NB-DAH NIL, “B” for OTO-DAH NIL, and “H” for the intermediate of these lines, similar to the F1 progeny. The expected and observed values were calculated in accordance with the Mendelian segregation ratios for a single dominant gene. To assess the fit of the genetic inheritance model, a chi-square test was performed using the CHISQ.DIST.RT function in Microsoft Excel v.1618 (Microsoft, Albuquerque, NM, USA).
4.4. DNA Extraction and Whole-Genome Resequencing (WGRS)
For WGRS, genomic DNA was extracted from young leaves collected at the second or third true-leaf stages. Leaf samples were rapidly frozen in liquid nitrogen and pulverized using a mortar and pestle, and DNA was subsequently isolated using the GenEx™ Plant kit (Geneall, Seoul, Republic of Korea) following the manufacturer’s instructions. The extracted DNA was stored at −75 °C until further use in subsequent analyses.
Sequencing libraries were constructed using 250 ng of genomic DNA per sample, and quality control analysis of the constructed libraries was performed using gel electrophoresis. The prepared library was purified using a Qiagen MinElute column (Hilden, Germany), and sequencing was performed using the Hiseq2000 NGS platform (Illumina, San Diego, CA, USA) in paired-end sequencing mode by Seeders (Daejeon, Republic of Korea). Sequence preprocessing was conducted by demultiplexing and trimming the adapter of the raw sequence using Cutadapt (v. 1.8.3) and sequence quality trimming using the SolexaQA (v.1.13) package. The cleaned reads were aligned to the Charleston gray watermelon reference genome (
http://cucurbitgenomics.org, accessed on 14 August 2022) [
22], and the alignment results were converted to BAM files using the Burrows–Wheeler alignment tool (BWA) program (v. 0.6.1-r104) [
23]. SNP validation was conducted using the SEEDERS in-house script [
24] based on the following conditions: minimum mapping quality for SNPs = 30, minimum mapping quality for gaps = 15, minimum read depth = 3, maximum read depth = 257, minimum indel score for nearby SNP filtering = 30, SNP within INT bp around a gap to be filtered = 30, and window size for filtering dense SNPs = 30. Raw SNPs were detected, and consensus sequences were extracted using the SAMtools program (v.0.1.16) and the SEEDERS in-house script.
4.5. SNP Discovery and Chromosome-Specific Distribution Analysis
A consolidated SNP matrix was created from the samples to perform a comparative analysis of the SNPs among samples. Raw SNP loci were obtained by comparing each sample with the reference genome, and a union list was constructed using these candidate loci. During this process, missing SNP loci were filled in from the consensus sequences of the samples to create the matrix. Subsequently, the SNP loci that were miscalled during sample comparison were filtered to create the final SNP matrix. Based on these loci, the SNPs were classified according to the following types: homozygous SNP: read rate ≥ 90%, heterozygous SNP: 40% ≤ read rate ≤ 60%, others: 20% ≤ read rate < 90%.
4.6. Identification of Introgression Region in Near Isogenic Lines (NILs) and Detection of Candidate Genes
To identify the introgression regions in each NIL sample, SNPs with the following traits were selected: those that exhibited nucleotide sequences identical to those of the donor parents (OTO9491 and NB5410) or those that were polymorphic to the recurrent parent (DAH). Chromosome-specific SNP distribution plots were created based on the identified SNPs, with a specific focus on homozygous SNPs. The genomic distribution of the filtered SNPs was visualized using the basic plotting function of the Circos program [
25] in R v.2.1.5.2 (
http://www.r-project.org). The candidate genes for orange-β flesh were selected from those involved in the carotenoids’ metabolic pathway and are located in the introgression regions and exhibit SNPs between the NILs.
4.7. Development of Candidate-Gene-Based Cleaved Amplified Polymorphic Sequences (CAPS) and Genotyping
Primer design and restriction enzyme search for CAPS were performed using Primer3 v.0.4.0 and NEB Cutter v.2.0. The derived-CAPS (dCAPS) marker was designed using the dCAPS Finder 2.0. The PCR mixture (10 µL) was prepared using 20 ng of genomic DNA, 1 µL 10 × PCR buffer, 0.2 mM dNTP, 0.5 µL 10 pmol forward primer, 0.5 µL 10 pmol reverse primer, 0.5 U Taq polymerase (Solgent, Daejeon, Republic of Korea), and distilled water. The PCR conditions were as follows: one cycle at 95 °C for 5 min, 35 cycles of denaturation at 94 °C for 30 s, annealing at the melting temperature of each primer for 30 s, extension at 72 °C for 1 min, and one cycle of final extension at 72 °C for 7 min. Restriction enzymes were added to the PCR amplicons according to the instructions of the manufacturer. Afterwards, the amplicons were electrophoresed using 3% agarose gel (Philekorea, Seoul, Republic of Korea) containing 3 µL of ethidium bromide per 100 mL at 200 V for 1 h. The gels were photographed under UV light using a Davinchi imaging system (Davinchi-K, Seoul, Republic of Korea). Genotyping of the
CRTISO gene-based CAPS marker (CAPS-C
1976) for orange flesh with a high prolycopene content (referred to as orange-p) was conducted according to the methods described by Jin et al. [
13].


 and
and 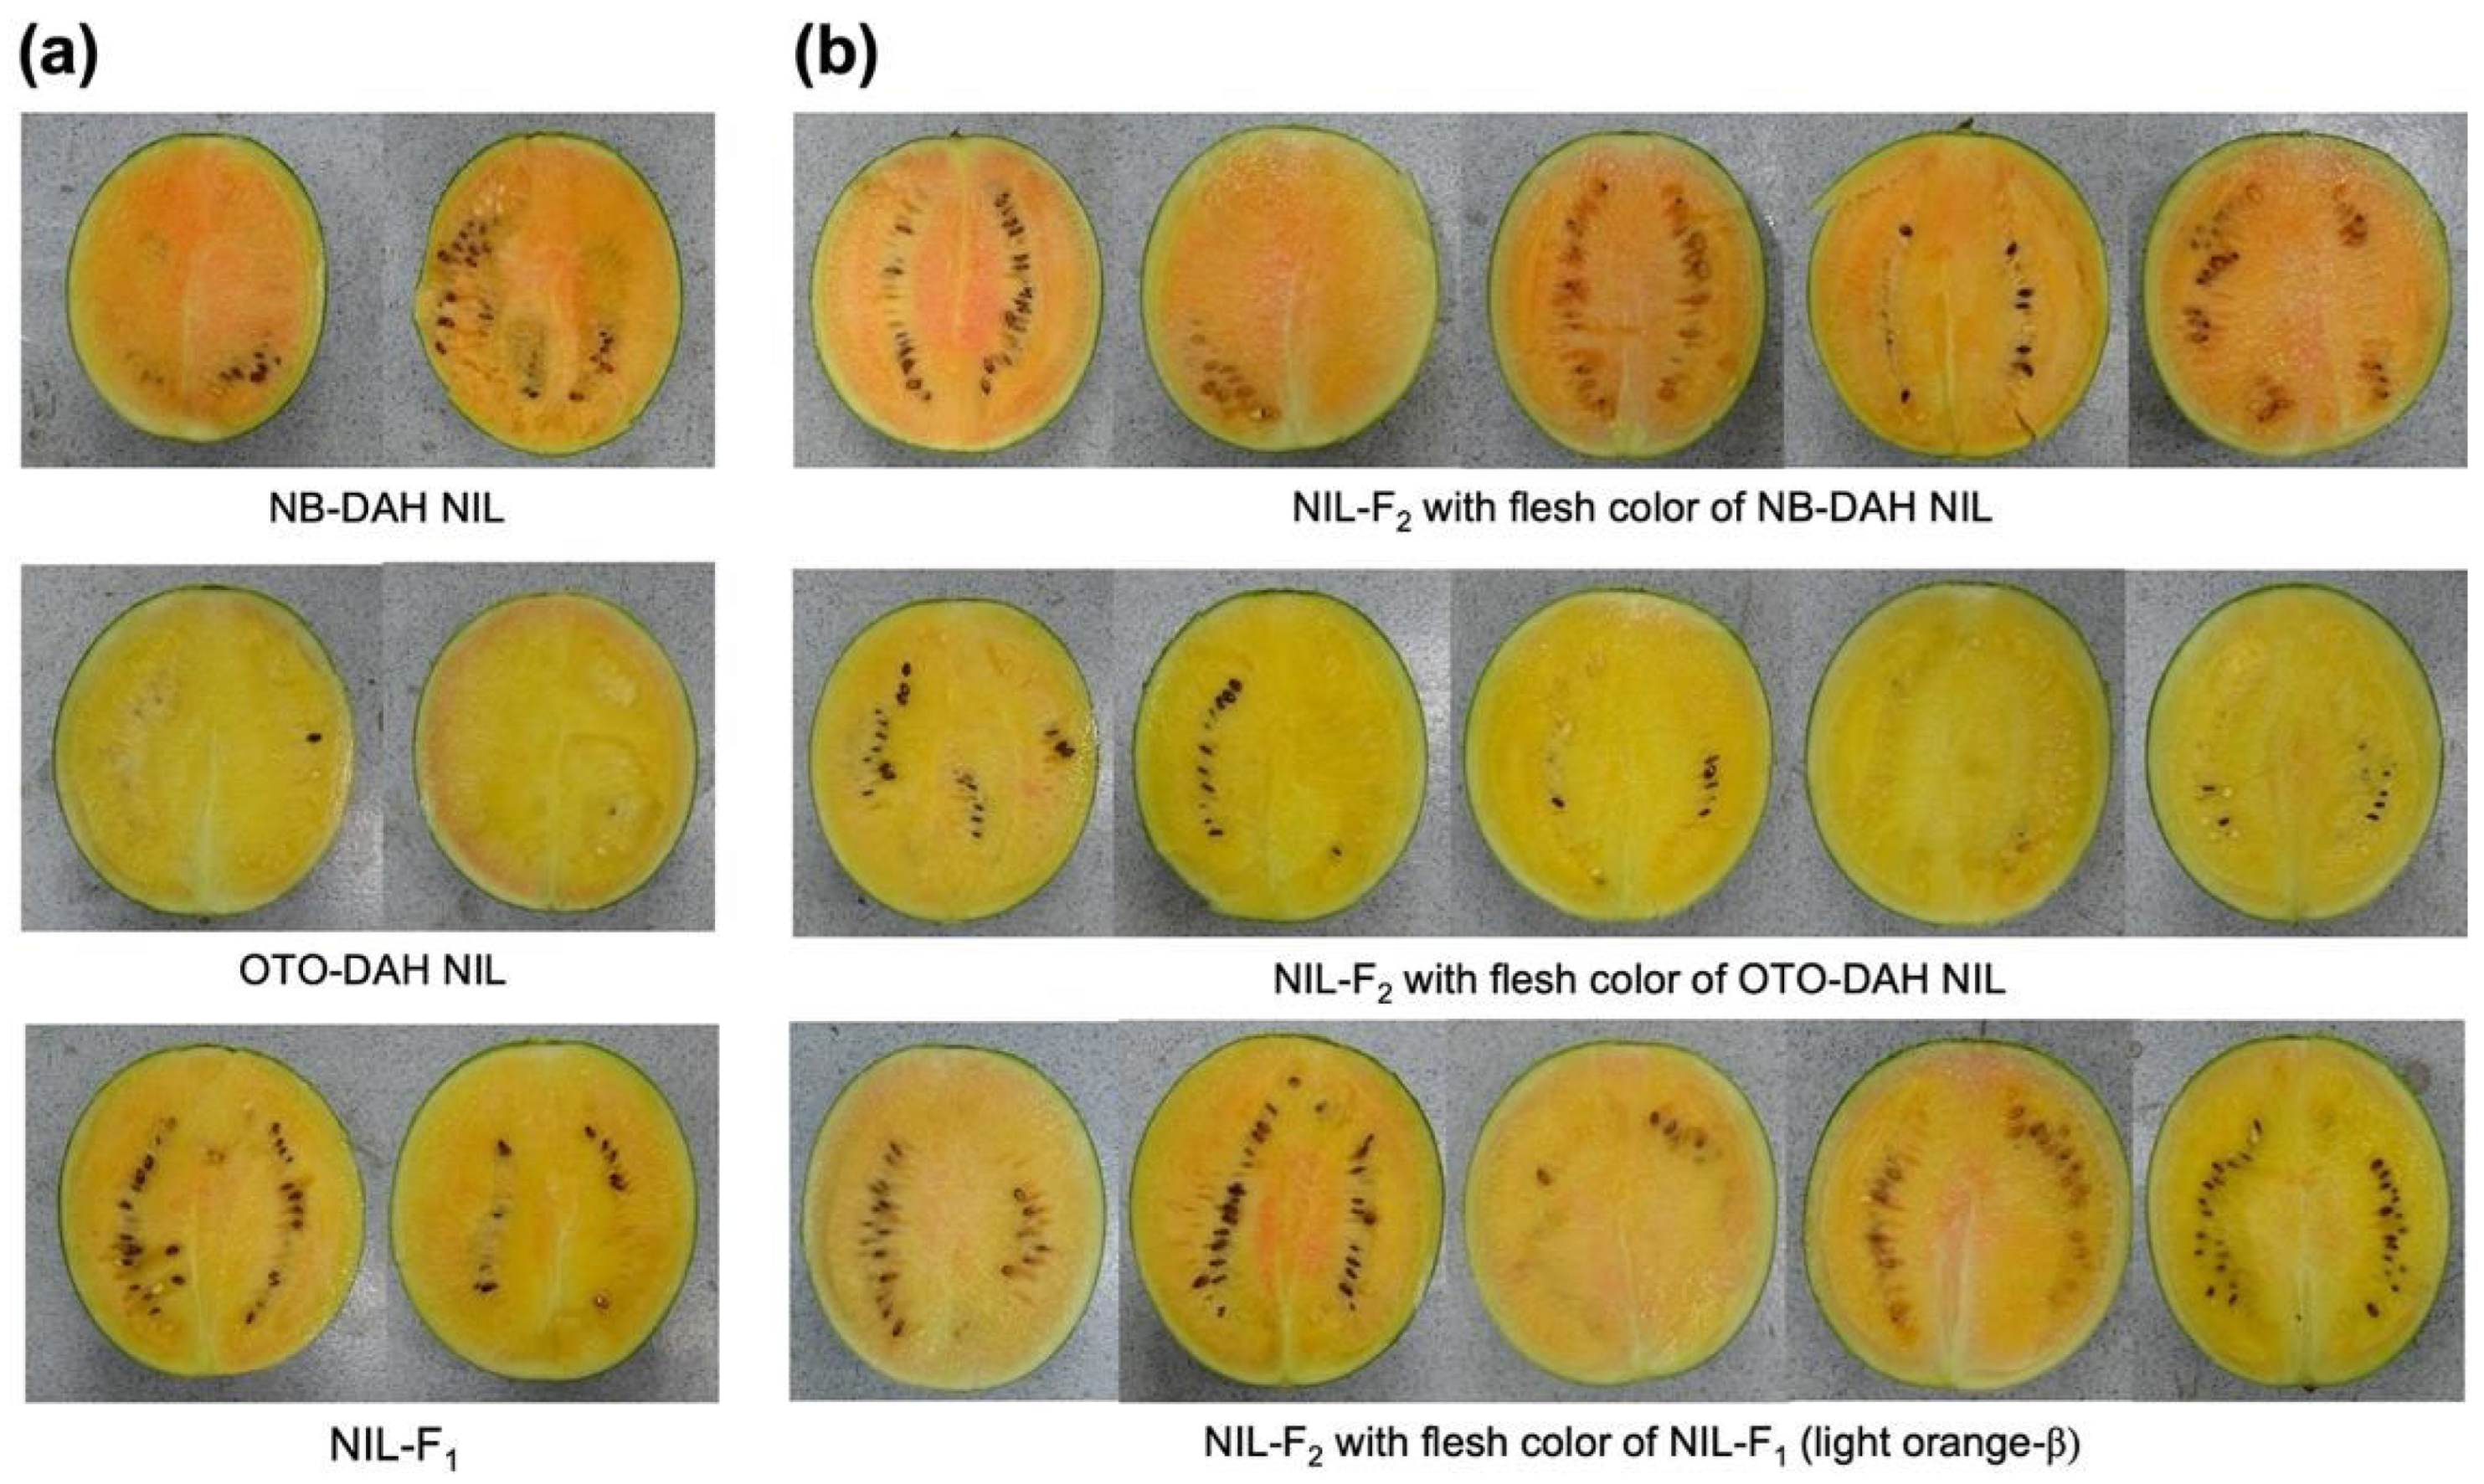


