
The Antiviral Effect of Isatis Root Polysaccharide against NADC30-like PRRSV by Transcriptome and Proteome Analysis

 , and
, and
Abstract
:1. Introduction
2. Results
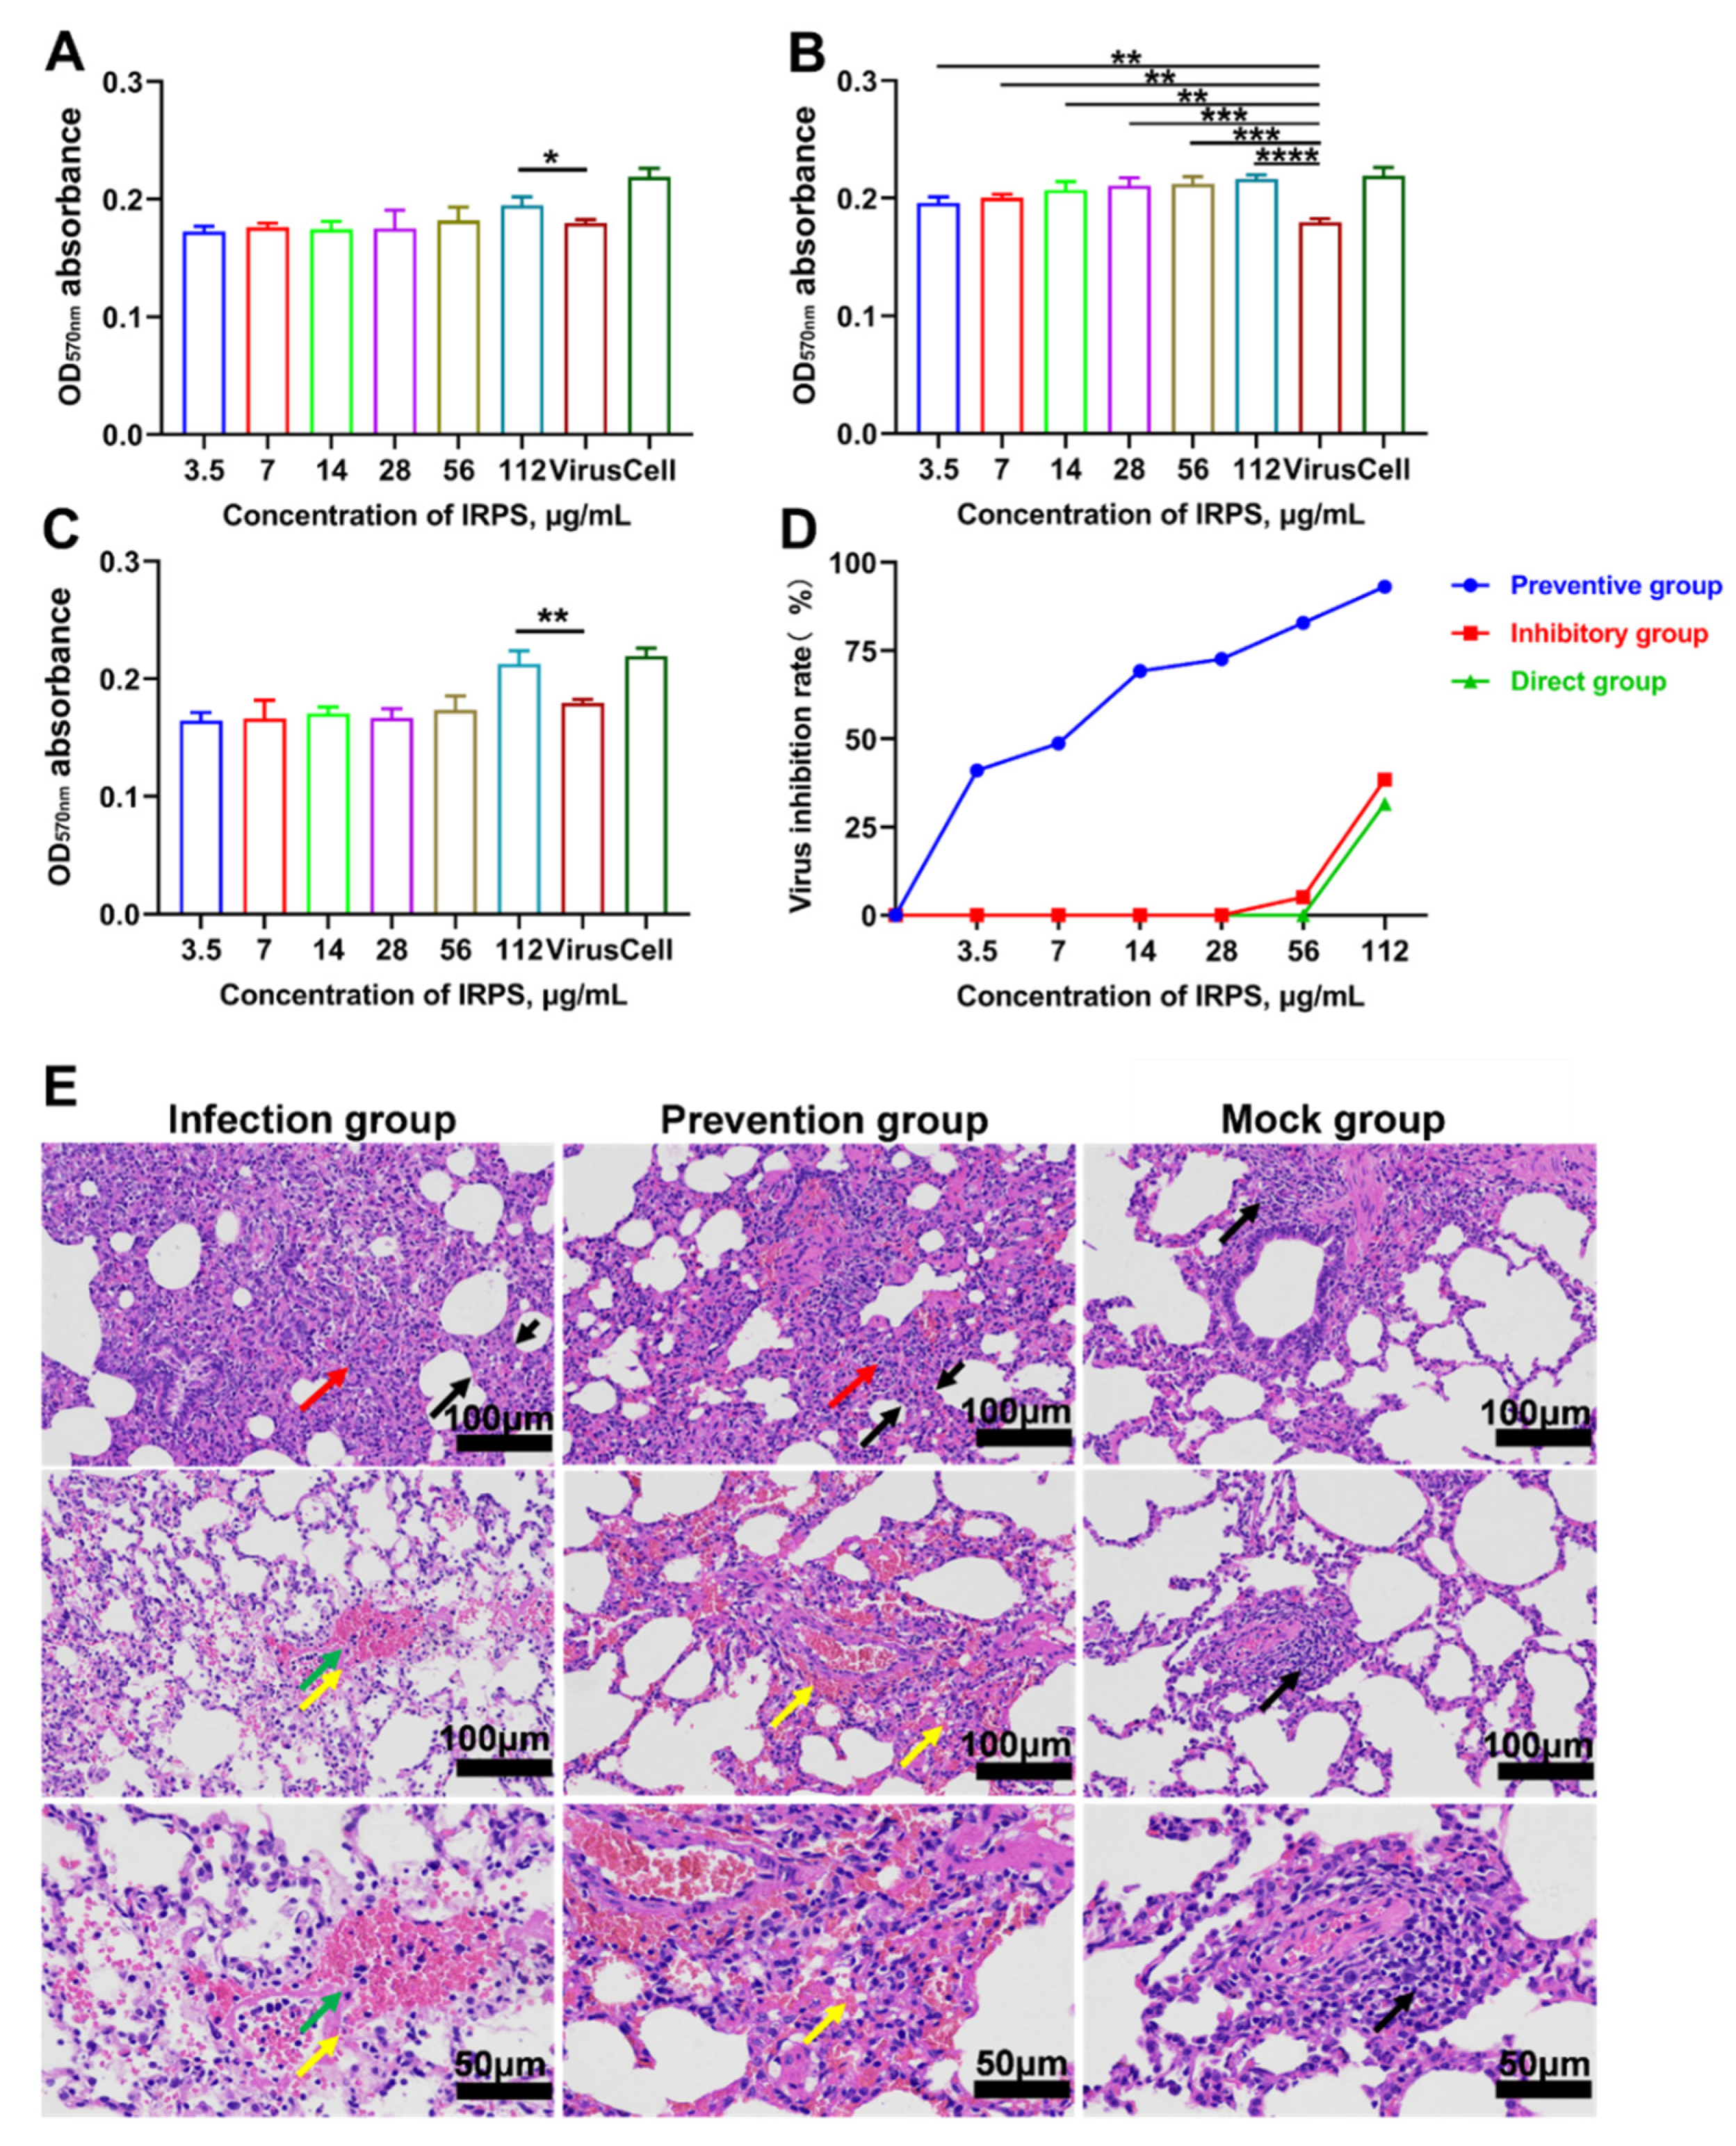
2.1. Toxicity of IRPS on the Viability of Marc-145 Cells
2.2. Antiviral Effect of IRPS on NADC30-like PRRSV
2.3. Clinical Signs and Histopathology
2.4. Overview of Transcriptomic Analyses
2.5. Gene Ontology Analysis and KEGG Pathway of DEGs
2.6. Proteomic Analysis and Identification of Differentially Expressed Proteins
2.7. Correlation Analysis of DEGs and DEPs
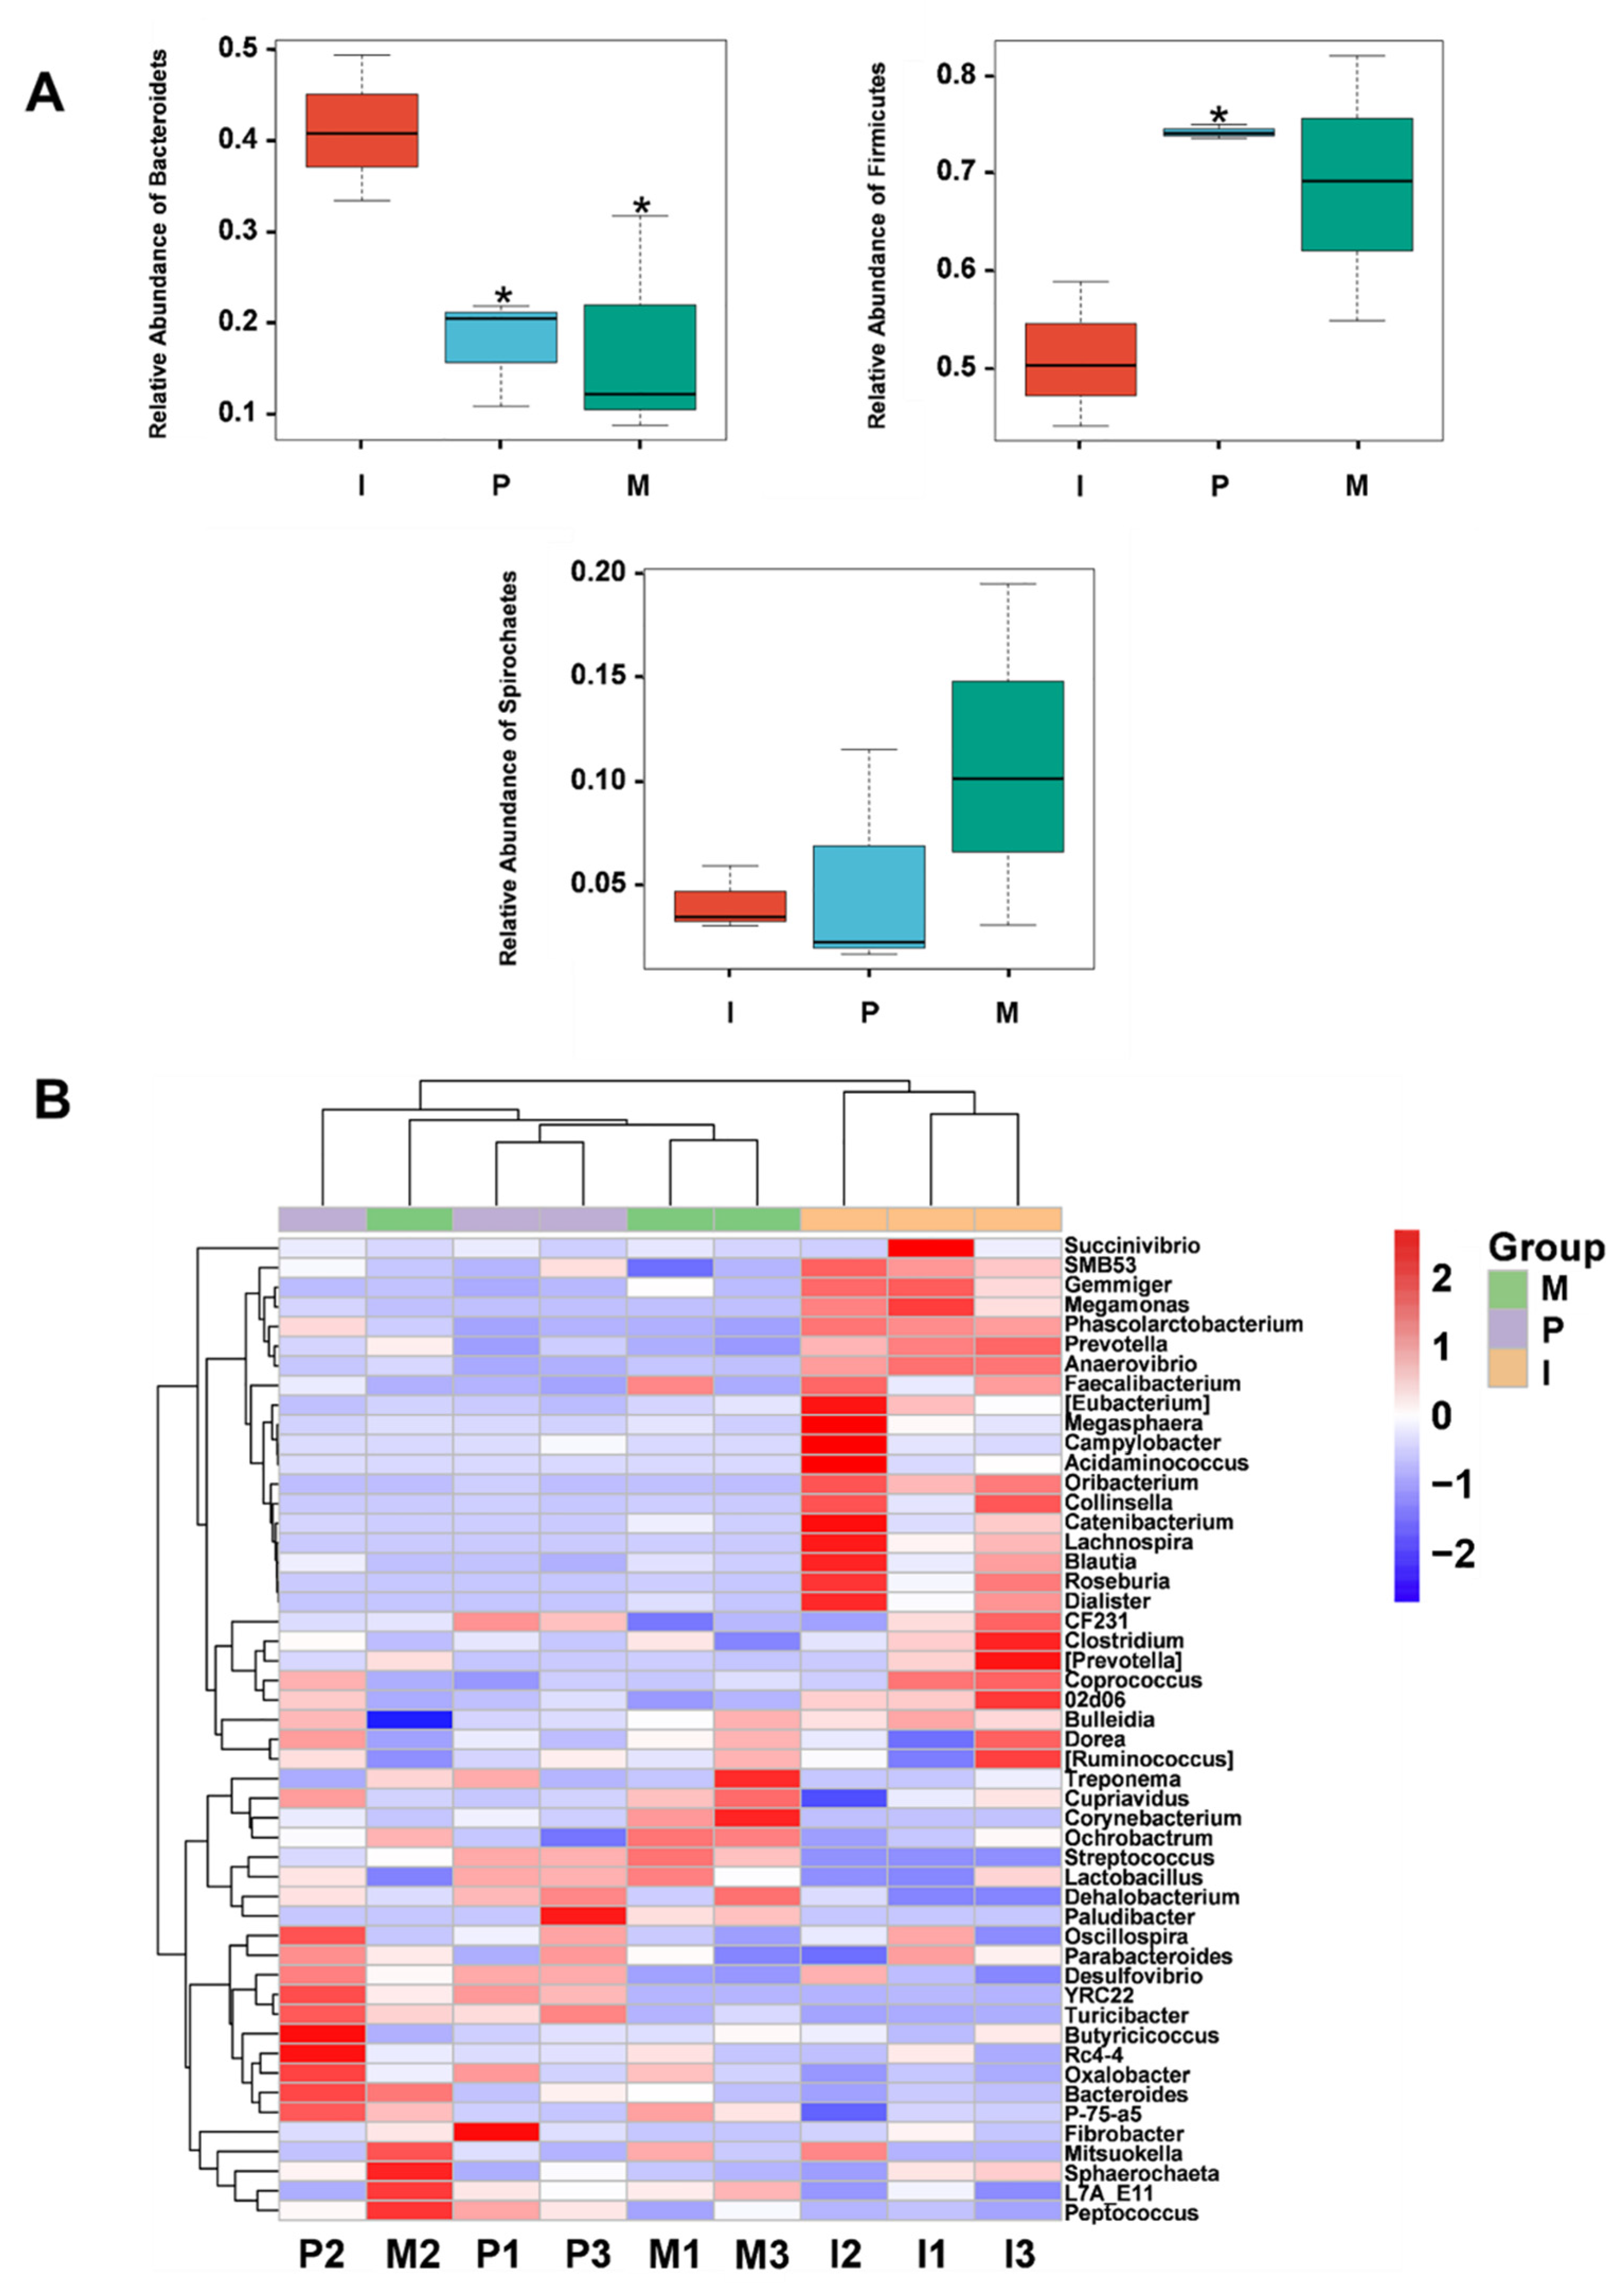
2.8. Effects of IRPS on Gut Microbiota Diversity
2.8.1. The Microbial Community Diversity of Piglets
2.8.2. Alpha Diversity and Beta Diversity
2.8.3. Gut Microbiota Community Structure Analysis
2.8.4. Comparison of the Microbial Community Structure among Different Piglet Groups
3. Discussion
4. Materials and Methods
4.1. Preparation of IRPS
4.2. Virus and Cells
4.3. Animal Protocol and Statement
4.4. Anti-NADC30-like PRRSV Activity In Vitro
4.4.1. Determination of IRPS Cytotoxicity
4.4.2. Determination of IRPS Cytotoxicity
4.4.3. Antiviral Effect of IRPS In Vivo
4.5. RNA Extraction and Sequencing
4.6. Quantitative Real-Time PCR Validation
4.7. Tandem Mass Tag-Based on Proteomics
4.8. DNA Extraction of Intestinal Contents and Sequencing
5. Conclusions
Supplementary Materials
Author Contributions
Funding
Institutional Review Board Statement
Informed Consent Statement
Data Availability Statement
Conflicts of Interest
References
- Guo, Z.; Chen, X.; Li, R.; Qiao, S.; Zhang, G. The prevalent status and genetic diversity of porcine reproductive and respiratory syndrome virus in China: A molecular epidemiological perspective. Virol. J. 2018, 15, 2. [Google Scholar] [CrossRef] [PubMed] [Green Version]
- Mateu, E.; Diaz, I. The challenge of PRRS immunology. Vet. J. 2008, 177, 345–351. [Google Scholar] [CrossRef] [PubMed]
- Oie, A. Manual of Diagnostic Tests and Vaccines for Terrestrial Animals; Bulletin—Office International des Epizooties: Paris, France, 2015; pp. 1092–1106. [Google Scholar]
- Brockmeier, S.L.; Loving, C.L.; Vorwald, A.C.; Kehrli, M.J.; Baker, R.B.; Nicholson, T.L.; Lager, K.M.; Miller, L.C.; Faaberg, K.S. Genomic sequence and virulence comparison of four Type 2 porcine reproductive and respiratory syndrome virus strains. Virus Res. 2012, 169, 212–221. [Google Scholar] [CrossRef]
- Li, C.; Zhuang, J.; Wang, J.; Han, L.; Sun, Z.; Xiao, Y.; Ji, G.; Li, Y.; Tan, F.; Li, X.; et al. Outbreak Investigation of NADC30-Like PRRSV in South-East China. Transbound. Emerg. Dis. 2016, 63, 474–479. [Google Scholar] [CrossRef]
- Tian, K. NADC30-Like Porcine Reproductive and Respiratory Syndrome in China. Open Virol. J. 2017, 11, 59–65. [Google Scholar] [CrossRef] [PubMed] [Green Version]
- Sun, Y.F.; Yu, H.; Jiang, X.; Ma, J.F.; Xu, C.Q.; Yu, X.X.; Li, L.A. Novel ORF5 deletion of NADC30-like porcine reproductive and respiratory syndrome viruses circulating in northern China from 2016 to 2018. J. Vet. Diagn. Investig. 2020, 32, 928–932. [Google Scholar] [CrossRef] [PubMed]
- Wang, H.M.; Liu, Y.G.; Tang, Y.D.; Liu, T.X.; Zheng, L.L.; Wang, T.Y.; Liu, S.G.; Wang, G.; Cai, X.H. A natural recombinant PRRSV between HP-PRRSV JXA1-like and NADC30-like strains. Transbound. Emerg. Dis. 2018, 65, 1078–1086. [Google Scholar] [CrossRef]
- Bian, T.; Sun, Y.; Hao, M.; Zhou, L.; Ge, X.; Guo, X.; Han, J.; Yang, H. A recombinant type 2 porcine reproductive and respiratory syndrome virus between NADC30-like and a MLV-like: Genetic characterization and pathogenicity for piglets. Infect. Genet. Evol. 2017, 54, 279–286. [Google Scholar] [CrossRef]
- Li, Y.; Ji, G.; Wang, J.; Tan, F.; Zhuang, J.; Li, X.; Tian, K. Complete Genome Sequence of an NADC30-Like Porcine Reproductive and Respiratory Syndrome Virus Characterized by Recombination with Other Strains. Genome Announc. 2016, 4, e00330-16. [Google Scholar] [CrossRef] [Green Version]
- Li, X.; Bao, H.; Wang, Y.; Tian, K. Widespread of NADC30-like PRRSV in China: Another Pandora’s box for Chinese pig industry as the outbreak of highly pathogenic PRRSV in 2006? Infect. Genet. Evol. 2017, 49, 12–13. [Google Scholar] [CrossRef]
- Ding, Y.; Wubshet, A.K.; Ding, X.; Zhang, Z.; Li, Q.; Dai, J.; Hou, Q.; Hu, Y.; Zhang, J. Evaluation of Four Commercial Vaccines for the Protection of Piglets against the Highly Pathogenic Porcine Reproductive and Respiratory Syndrome Virus (hp-PRRSV) QH-08 Strain. Vaccines 2021, 9, 1020. [Google Scholar] [CrossRef] [PubMed]
- Zhang, Q.; Jiang, P.; Song, Z.; Lv, L.; Li, L.; Bai, J. Pathogenicity and antigenicity of a novel NADC30-like strain of porcine reproductive and respiratory syndrome virus emerged in China. Vet. Microbiol. 2016, 197, 93–101. [Google Scholar] [CrossRef] [PubMed]
- Leng, C.; Zhang, W.; Zhang, H.; Kan, Y.; Yao, L.; Zhai, H.; Li, M.; Li, Z.; Liu, C.; An, T.; et al. ORF1a of highly pathogenic PRRS attenuated vaccine virus plays a key role in neutralizing antibody induction in piglets and virus neutralization In Vitro. Virol. J. 2017, 14, 159. [Google Scholar] [CrossRef] [PubMed] [Green Version]
- Wang, X.X.; Wang, F.X.; Li, Z.G.; Wen, Y.J.; Wang, X.; Song, N.; Wu, H. Development of an indirect enzyme-linked immunosorbent assay (ELISA) to differentiate antibodies against wild-type porcine reproductive and respiratory syndrome from the vaccine strain TJM-F92 based on a recombinant Nsp2 protein. J. Virol. Methods 2018, 251, 151–154. [Google Scholar] [CrossRef]
- Liu, C.; Zhang, W.; Gong, W.; Zhang, D.; She, R.; Xu, B.; Ning, Y. Comparative Respiratory Pathogenicity and Dynamic Tissue Distribution of Chinese Highly Pathogenic Porcine Reproductive and Respiratory Syndrome Virus and its Attenuated Strain in Piglets. J. Comp. Pathol. 2015, 153, 38–49. [Google Scholar] [CrossRef]
- Zhou, L.; Yang, B.; Xu, L.; Jin, H.; Ge, X.; Guo, X.; Han, J.; Yang, H. Efficacy evaluation of three modified-live virus vaccines against a strain of porcine reproductive and respiratory syndrome virus NADC30-like. Vet. Microbiol. 2017, 207, 108–116. [Google Scholar] [CrossRef]
- Wei, Z.; Zhang, J.; Zhuang, J.; Sun, Z.; Gao, F.; Yuan, S. Immunization of pigs with a type 2 modified live PRRSV vaccine prevents the development of a deadly long lasting hyperpyrexia in a challenge study with highly pathogenic PRRSV JX143. Vaccine 2013, 31, 2062–2066. [Google Scholar] [CrossRef]
- Li, T.; Peng, T. Traditional Chinese herbal medicine as a source of molecules with antiviral activity. Antivir. Res. 2013, 97, 1–9. [Google Scholar] [CrossRef]
- Pan, M.H.; Chiou, Y.S.; Tsai, M.L.; Ho, C.T. Anti-inflammatory activity of traditional Chinese medicinal herbs. J. Tradit. Complement. Med. 2011, 1, 8–24. [Google Scholar] [CrossRef] [Green Version]
- Zhou, W.; Zhang, X.Y. Research progress of Chinese herbal medicine Radix isatidis (banlangen). Am. J. Chin. Med. 2013, 41, 743–764. [Google Scholar] [CrossRef]
- Ping, X.; Huang, H.; Chen, J.; Xiang, L. In Vitro antioxidant and anti-inflammatory activities of Radix Isatidis extract and bioaccessibility of six bioactive compounds after simulated gastro-intestinal digestion. J. Ethnopharmacol. 2014, 157, 55–61. [Google Scholar]
- Wei, Z.Y.; Wang, X.B.; Zhang, H.Y.; Yang, C.H.; Wang, Y.B.; Xu, D.H.; Chen, H.Y.; Cui, B.A. Inhibitory effects of indigowoad root polysaccharides on porcine reproductive and respiratory syndrome virus replication In Vitro. Antivir. Ther. 2011, 16, 357–363. [Google Scholar] [CrossRef] [PubMed] [Green Version]
- Wang, X.; Xue, Y.; Li, Y.; Liu, F.; Yan, Y.; Zhang, H.; Jin, Q. Effects of Isatis root polysaccharide in mice infected with H3N2 swine influenza virus. Res. Vet. Sci. 2018, 119, 91–98. [Google Scholar] [CrossRef] [PubMed]
- Li, L.; Yao, H.; Li, X.; Zhang, Q.; Wu, X.; Wong, T.; Zheng, H.; Fung, H.; Yang, B.; Ma, D.; et al. Destiny of Dendrobium officinale Polysaccharide after Oral Administration: Indigestible and Nonabsorbing, Ends in Modulating Gut Microbiota. J. Agric. Food Chem. 2019, 67, 5968–5977. [Google Scholar] [CrossRef]
- Fang, Q.; Hu, J.; Nie, Q.; Nie, S. Effects of polysaccharides on glycometabolism based on gut microbiota alteration. Trends Food Sci. Technol. 2019, 92, 65–70. [Google Scholar] [CrossRef]
- Chen, R.; Liu, B.; Wang, X.; Chen, K.; Zhang, K.; Zhang, L.; Fei, C.; Wang, C.; Liu, Y.; Xue, F.; et al. Effects of polysaccharide from Pueraria lobata on gut microbiota in mice. Int. J. Biol. Macromol. 2020, 158, 740–749. [Google Scholar] [CrossRef]
- Ghatak, A.; Chaturvedi, P.; Weckwerth, W. Cereal Crop Proteomics: Systemic Analysis of Crop Drought Stress Responses towards Marker-Assisted Selection Breeding. Front. Plant Sci. 2017, 8, 757. [Google Scholar] [CrossRef] [Green Version]
- Meng, L.; Zhang, T.; Geng, S.; Scott, P.B.; Li, H.; Chen, S. Comparative proteomics and metabolomics of JAZ7-mediated drought tolerance in Arabidopsis. J. Proteom. 2019, 196, 81–91. [Google Scholar] [CrossRef]
- Jiang, J.; Ren, X.; Li, L.; Hou, R.; Dong, Y. H2S Regulation of Metabolism in Cucumber in Response to Salt-Stress Through Transcriptome and Proteome Analysis. Front. Plant Sci. 2020, 11, 1283. [Google Scholar] [CrossRef]
- Wang, L.; Zhang, Y.; Zhang, B.; Zhong, H.; Lu, Y.; Zhang, H. Candidate gene screening for lipid deposition using combined transcriptomic and proteomic data from Nanyang black pigs. BMC Genom. 2021, 22, 441. [Google Scholar] [CrossRef]
- Dai, W.; Wang, Q.; Zhao, F.; Liu, J.; Liu, H. Understanding the regulatory mechanisms of milk production using integrative transcriptomic and proteomic analyses: Improving inefficient utilization of crop by-products as forage in dairy industry. BMC Genom. 2018, 19, 403. [Google Scholar] [CrossRef]
- Cheng, X.Y.; Liu, X.Y.; Wang, H.M.; Su, C.T.; Zhao, R.; Bodelier, P.; Wang, W.Q.; Ma, L.Y.; Lu, X.L. USCgamma Dominated Community Composition and Cooccurrence Network of Methanotrophs and Bacteria in Subterranean Karst Caves. Microbiol. Spectr. 2021, 9, e00820-21. [Google Scholar] [CrossRef] [PubMed]
- Lim, B.; Kim, S.; Lim, K.S.; Jeong, C.G.; Kim, S.C.; Lee, S.M.; Park, C.K.; Te, P.M.; Gho, H.; Kim, T.H.; et al. Integrated time-serial transcriptome networks reveal common innate and tissue-specific adaptive immune responses to PRRSV infection. Vet. Res. 2020, 51, 128. [Google Scholar] [CrossRef] [PubMed]
- Lozupone, C.; Knight, R. UniFrac: A new phylogenetic method for comparing microbial communities. Appl. Environ. Microbiol. 2005, 71, 8228–8235. [Google Scholar] [CrossRef] [PubMed] [Green Version]
- Kristiansen, H.; Gad, H.H.; Eskildsen-Larsen, S.; Despres, P.; Hartmann, R. The oligoadenylate synthetase family: An ancient protein family with multiple antiviral activities. J. Interferon Cytokine Res. 2011, 31, 41–47. [Google Scholar] [CrossRef]
- Welch, S.K.; Calvert, J.G. A brief review of CD163 and its role in PRRSV infection. Virus Res. 2010, 154, 98–103. [Google Scholar] [CrossRef]
- Van Gorp, H.; Van Breedam, W.; Delputte, P.L.; Nauwynck, H.J. Sialoadhesin and CD163 join forces during entry of the porcine reproductive and respiratory syndrome virus. J. Gen. Virol. 2008, 89, 2943–2953. [Google Scholar] [CrossRef]
- Calvert, J.G.; Slade, D.E.; Shields, S.L.; Jolie, R.; Mannan, R.M.; Ankenbauer, R.G.; Welch, S.K. CD163 expression confers susceptibility to porcine reproductive and respiratory syndrome viruses. J. Virol. 2007, 81, 7371–7379. [Google Scholar] [CrossRef] [Green Version]
- Du, T.; Nan, Y.; Xiao, S.; Zhao, Q.; Zhou, E.M. Antiviral Strategies against PRRSV Infection. Trends Microbiol. 2017, 25, 968–979. [Google Scholar] [CrossRef]
- Li, Y.; Renner, D.M.; Comar, C.E.; Whelan, J.N.; Reyes, H.M.; Cardenas-Diaz, F.L.; Truitt, R.; Tan, L.H.; Dong, B.; Alysandratos, K.D.; et al. SARS-CoV-2 induces double-stranded RNA-mediated innate immune responses in respiratory epithelial-derived cells and cardiomyocytes. Proc. Natl. Acad. Sci. USA 2021, 118, e2022643118. [Google Scholar] [CrossRef]
- Sola, I.; Almazan, F.; Zuniga, S.; Enjuanes, L. Continuous and Discontinuous RNA Synthesis in Coronaviruses. Annu. Rev. Virol. 2015, 2, 265–288. [Google Scholar] [CrossRef] [PubMed] [Green Version]
- Bi, J.; Song, S.; Fang, L.; Wang, D.; Jing, H.; Gao, L.; Cai, Y.; Luo, R.; Chen, H.; Xiao, S. Porcine reproductive and respiratory syndrome virus induces IL-1beta production depending on TLR4/MyD88 pathway and NLRP3 inflammasome in primary porcine alveolar macrophages. Mediat. Inflamm. 2014, 2014, 403515. [Google Scholar] [CrossRef] [PubMed] [Green Version]
- Wang, C.; Shi, X.; Zhang, X.; Wang, A.; Wang, L.; Chen, J.; Deng, R.; Zhang, G. The Endoribonuclease Activity Essential for the Nonstructural Protein 11 of Porcine Reproductive and Respiratory Syndrome Virus to Inhibit NLRP3 Inflammasome-Mediated IL-1beta Induction. DNA Cell Biol. 2015, 34, 728–735. [Google Scholar] [CrossRef] [PubMed]
- Schroder, K.; Tschopp, J. The inflammasomes. Cell 2010, 140, 821–832. [Google Scholar] [CrossRef] [Green Version]
- Atianand, M.K.; Rathinam, V.A.; Fitzgerald, K.A. SnapShot: Inflammasomes. Cell 2013, 153, 272–272.e1. [Google Scholar] [CrossRef] [Green Version]
- Okamura, H.; Nagata, K.; Komatsu, T.; Tanimoto, T.; Nukata, Y.; Tanabe, F.; Akita, K.; Torigoe, K.; Okura, T.; Fukuda, S.; et al. A novel costimulatory factor for gamma interferon induction found in the livers of mice causes endotoxic shock. Infect. Immun. 1995, 63, 3966–3972. [Google Scholar] [CrossRef] [Green Version]
- Larsen, J.M. The immune response to Prevotella bacteria in chronic inflammatory disease. Immunology 2017, 151, 363–374. [Google Scholar] [CrossRef] [Green Version]
- Mutlu, E.A.; Keshavarzian, A.; Losurdo, J.; Swanson, G.; Siewe, B.; Forsyth, C.; French, A.; Demarais, P.; Sun, Y.; Koenig, L. A Compositional Look at the Human Gastrointestinal Microbiome and Immune Activation Parameters in HIV Infected Subjects. PLoS Pathog. 2014, 10, e1003829. [Google Scholar] [CrossRef] [Green Version]
- Yang, L.; Poles, M.A.; Fisch, G.S.; Ma, Y.; Nossa, C.; Phelan, J.A.; Pei, Z. HIV-induced immunosuppression is associated with colonization of the proximal gut by environmental bacteria. AIDS 2016, 30, 19–29. [Google Scholar] [CrossRef] [Green Version]
- Tian, Z.; Liu, Y.; Yang, B.; Zhang, J.; He, H.; Ge, H.; Wu, Y.; Shen, Z. Astagalus Polysaccharide Attenuates Murine Colitis through Inhibiton of the NLRP3 Inflammasome. Planta Med. 2017, 83, 70–77. [Google Scholar] [CrossRef] [Green Version]
- Li, E.; Sun, N.; Zhao, J.X.; Sun, Y.G.; Huang, J.G.; Lei, H.M.; Guo, J.H.; Hu, Y.L.; Wang, W.K.; Li, H.Q. In Vitro evaluation of antiviral activity of tea seed saponins against porcine reproductive and respiratory syndrome virus. Antivir. Ther. 2015, 20, 743–752. [Google Scholar] [CrossRef] [Green Version]
- Mosmann, T. Rapid colorimetric assay for cellular growth and survival: Application to proliferation and cytotoxicity assays. J. Immunol. Methods 1983, 65, 55–63. [Google Scholar] [CrossRef]
- Kim, D.; Langmead, B.; Salzberg, S.L. HISAT: A fast spliced aligner with low memory requirements. Nat. Methods 2015, 12, 357–360. [Google Scholar] [CrossRef] [Green Version]
- Chen, S.; Zhou, Y.; Chen, Y.; Jia, G. Fastp: An ultra-fast all-in-one FASTQ preprocessor. Bioinformatics 2018, 34, 884–890. [Google Scholar] [CrossRef] [PubMed]
- Trapnell, C.; Williams, B.A.; Pertea, G.; Mortazavi, A.; Kwan, G.; van Baren, M.J.; Salzberg, S.L.; Wold, B.J.; Pachter, L. Transcript assembly and quantification by RNA-Seq reveals unannotated transcripts and isoform switching during cell differentiation. Nat. Biotechnol. 2010, 28, 511–515. [Google Scholar] [CrossRef] [PubMed] [Green Version]
- Li, Y.; Lin, B.; Yang, L. Comparative Transcriptomic Analysis of Multiple Cardiovascular Fates from Embryonic Stem Cells Predicts Novel Regulators in Human Cardiogenesis. Sci. Rep. 2015, 5, 9758. [Google Scholar] [CrossRef] [Green Version]
- Trapnell, C.; Roberts, A.; Goff, L.; Pertea, G.; Kim, D.; Kelley, D.R.; Pimentel, H.; Salzberg, S.L.; Rinn, J.L.; Pachter, L. Differential gene and transcript expression analysis of RNA-seq experiments with TopHat and Cufflinks. Nat. Protoc. 2012, 7, 562–578. [Google Scholar] [CrossRef] [PubMed] [Green Version]
- Livak, K.J.; Schmittgen, T.D. Analysis of relative gene expression data using real-time quantitative PCR and the 2(-Delta Delta C(T)) Method. Methods 2001, 25, 402–408. [Google Scholar] [CrossRef] [PubMed]
- Jakoby, T.; van den Berg, B.H.; Tholey, A. Quantitative protease cleavage site profiling using tandem-mass-tag labeling and LC-MALDI-TOF/TOF MS/MS analysis. J. Proteome Res. 2012, 11, 1812–1820. [Google Scholar] [CrossRef] [PubMed]
- Chen, X.; Liu, H.; Wang, S.; Zhang, C.; Liu, L.; Yang, M.; Zhang, J. Combined transcriptome and proteome analysis provides insights into anthocyanin accumulation in the leaves of red-leaved poplars. Plant Mol. Biol. 2021, 106, 491–503. [Google Scholar] [CrossRef]
- Bolyen, E.; Rideout, J.R.; Dillon, M.R.; Bokulich, N.A.; Abnet, C.C.; Al-Ghalith, G.A.; Alexander, H.; Alm, E.J.; Arumugam, M.; Asnicar, F.; et al. Reproducible, interactive, scalable and extensible microbiome data science using QIIME 2. Nat. Biotechnol. 2019, 37, 852–857. [Google Scholar] [CrossRef] [PubMed]
- Callahan, B.J.; McMurdie, P.J.; Rosen, M.J.; Han, A.W.; Johnson, A.J.; Holmes, S.P. DADA2: High-resolution sample inference from Illumina amplicon data. Nat. Methods 2016, 13, 581–583. [Google Scholar] [CrossRef] [PubMed] [Green Version]
- Rosen, M.J.; Callahan, B.J.; Fisher, D.S.; Holmes, S.P. Denoising PCR-amplified metagenome data. BMC Bioinform. 2012, 13, 283. [Google Scholar] [CrossRef] [PubMed] [Green Version]
- DeSantis, T.Z.; Hugenholtz, P.; Larsen, N.; Rojas, M.; Brodie, E.L.; Keller, K.; Huber, T.; Dalevi, D.; Hu, P.; Andersen, G.L. Greengenes, a chimera-checked 16S rRNA gene database and workbench compatible with ARB. Appl. Environ. Microbiol. 2006, 72, 5069–5072. [Google Scholar] [CrossRef] [Green Version]
- Bokulich, N.A.; Kaehler, B.D.; Rideout, J.R.; Dillon, M.; Bolyen, E.; Knight, R.; Huttley, G.A.; Gregory, C.J. Optimizing taxonomic classification of marker-gene amplicon sequences with QIIME 2’s q2-feature-classifier plugin. Microbiome 2018, 6, 90. [Google Scholar] [CrossRef]
- Shannon, C.E. The mathematical theory of communication. 1963. MD Comput. 1997, 14, 306–317. [Google Scholar]
- Simpson, E.H. Measurement of Diversity. Nature 1949, 163, 688. [Google Scholar] [CrossRef]
- Chao, A. Nonparametric estimation of the number of classes in a population. Scand. J. Statist. 1984, 11, 265–270. [Google Scholar]
- Yang, C.M.C.K. Stopping rules and estimation for recapture debugging with unequal failure rates. Biometrika 1993, 80, 193–201. [Google Scholar]
- Faith, D.P. Conservation evaluation and phylogenetic diversity. Biol. Conserv. 1992, 61, 1–10. [Google Scholar] [CrossRef]
- Pielou, E.C.J. The Measurement of Diversity in Different Types of Biological Collections. J. Theor. Biol. 1966, 13, 131–144. [Google Scholar] [CrossRef]
- Good, I.J. The population frequencies of species and the estimation of population parameters. Biometrika 1953, 40, 237–264. [Google Scholar] [CrossRef]
- Ramette, A. Multivariate analyses in microbial ecology. FEMS Microbiol. Ecol. 2007, 62, 142–160. [Google Scholar] [CrossRef] [PubMed] [Green Version]


 activation;
  expression;
  indirect effect;
  inhibitory effect.
activation; expression; indirect effect; inhibitory effect.
inhibitory effect.
activation; expression; indirect effect; inhibitory effect.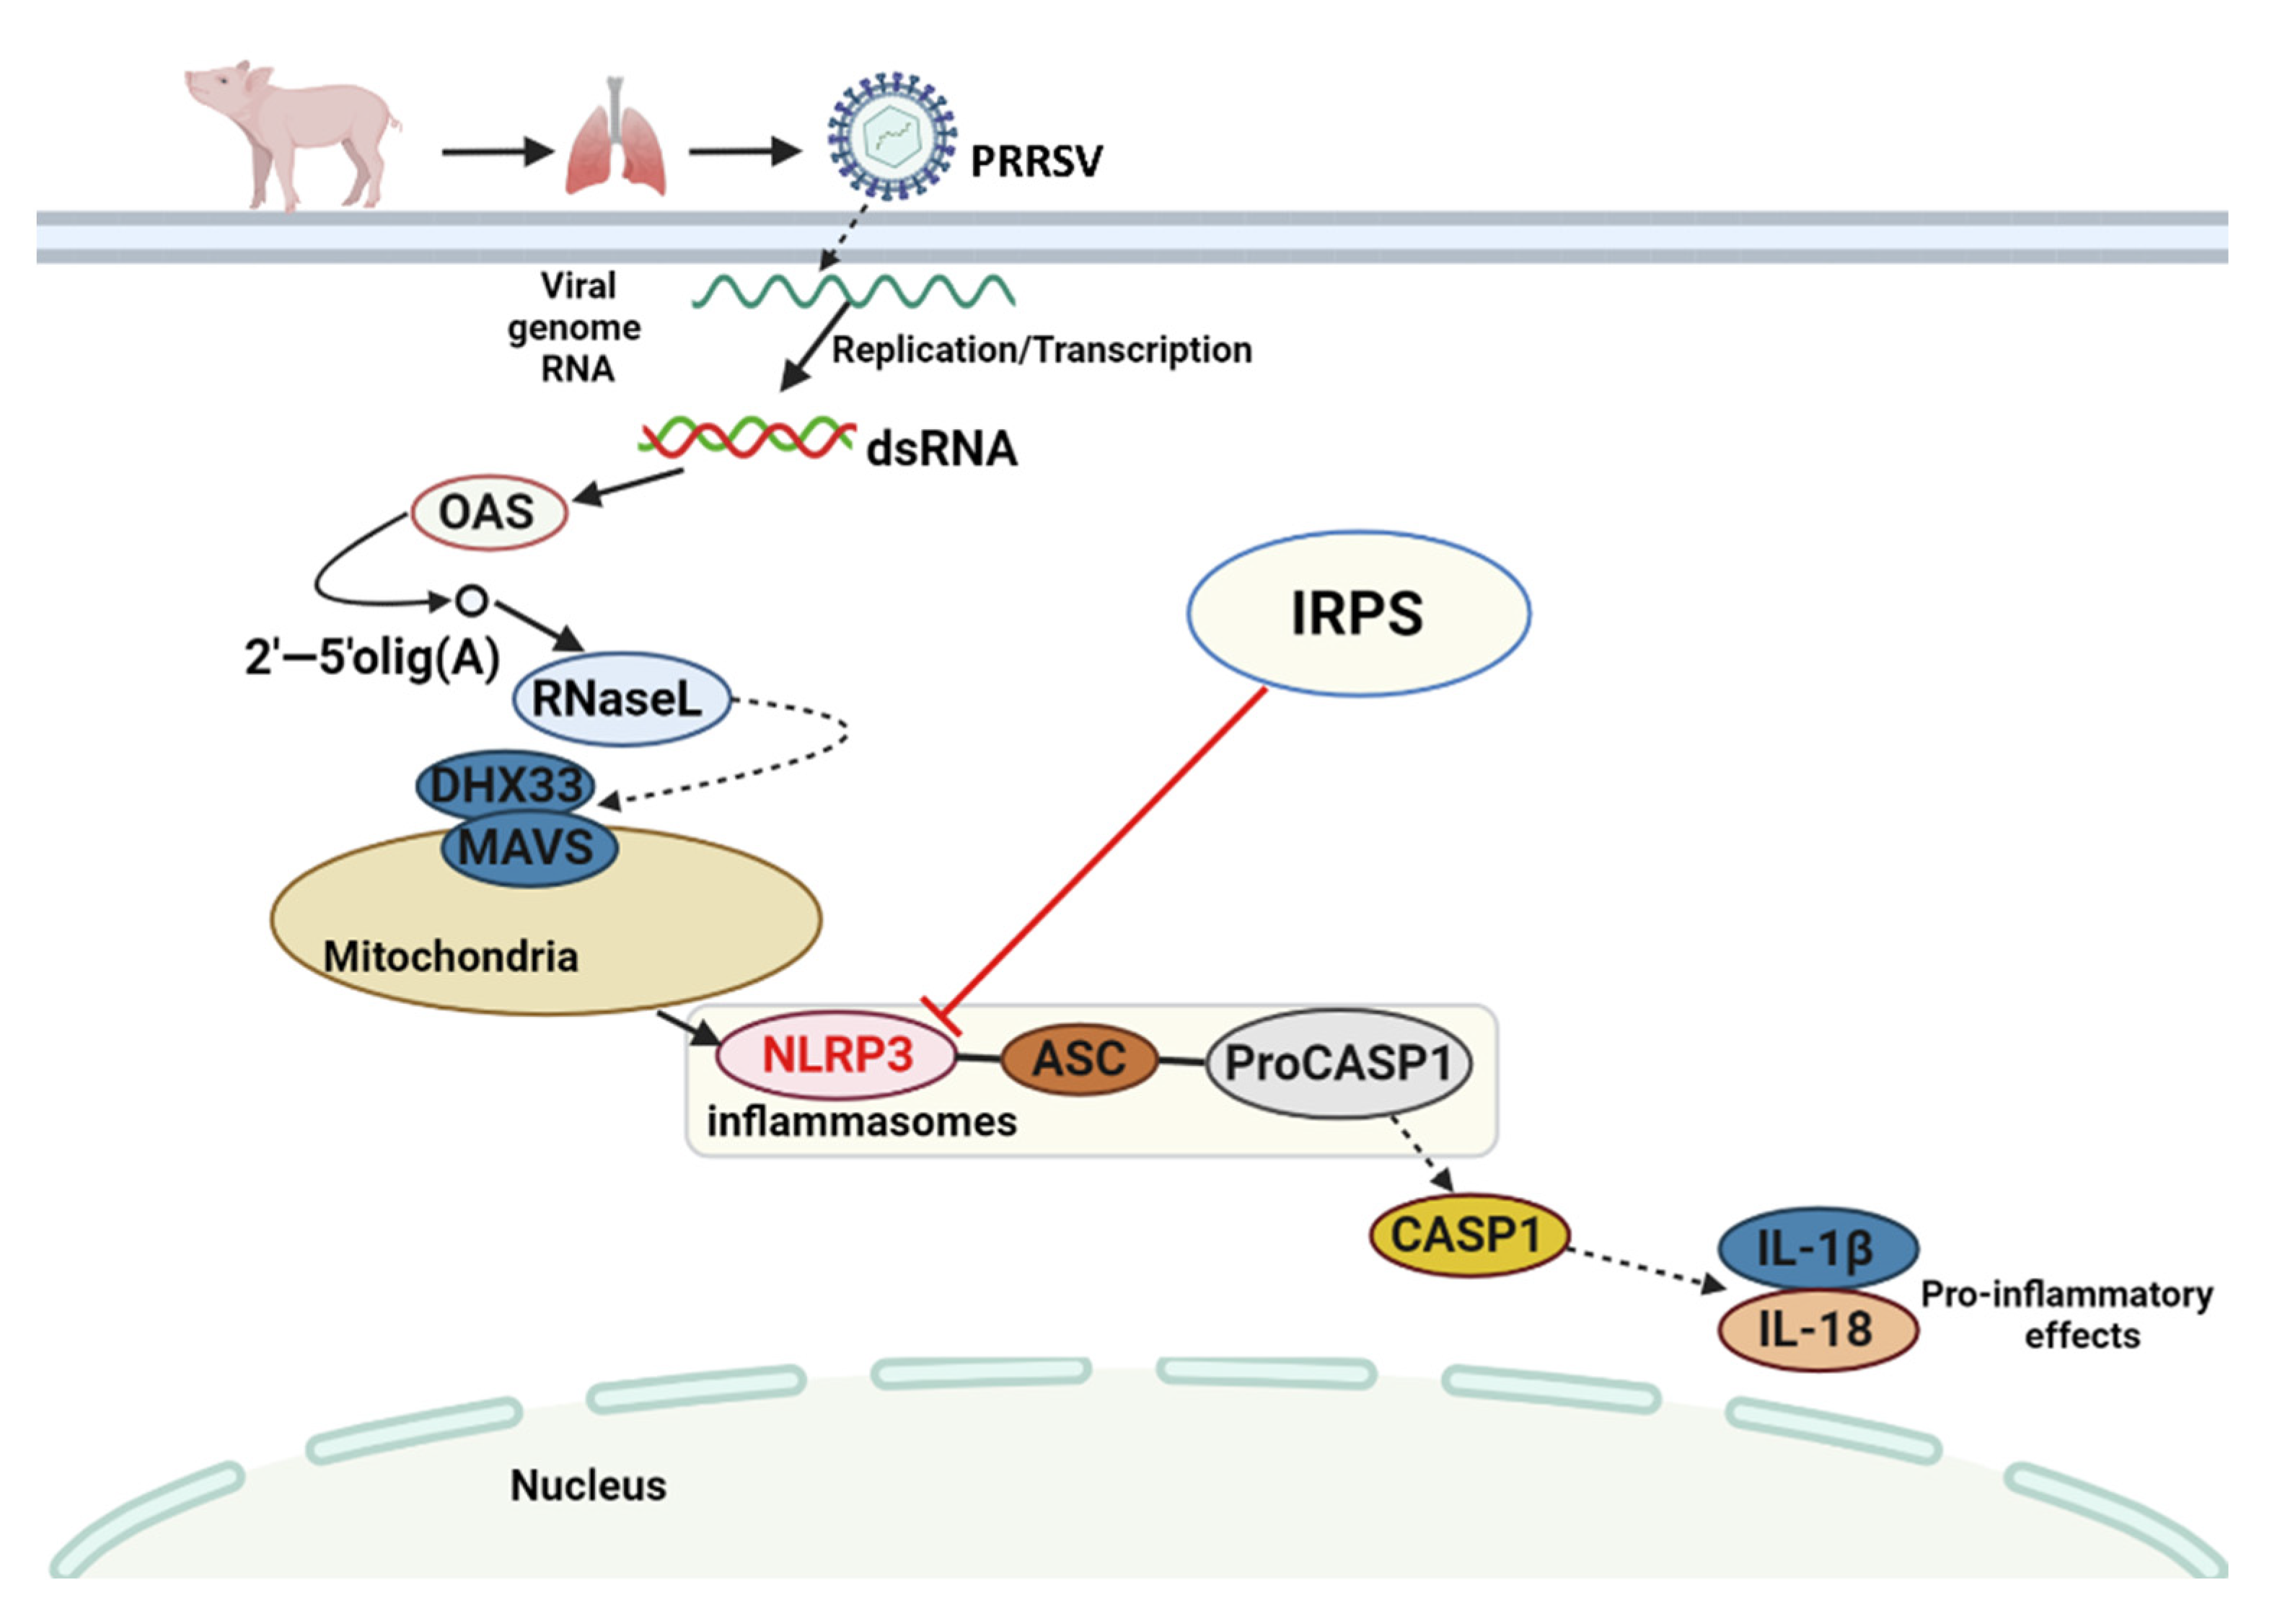

| Item | Value |
|---|---|
| Type of search | MS/MS Ion search |
| Enzyme | Trypsin |
| Mass Values | Monoisotopic |
| Max Missed Cleavages | 2 |
| Fixed modifications | Cabamidomethyl (C), TMT 10 plex (N-term), TMT 10 plex (K) |
| Variable modifications | Oxidation (M), TMT 10 plex (Y) |
| Peptide Mass Tolerance | ±20 ppm |
| Fragment Mass Tolerance | 0.1 Da |
| Protein Mass | Unrestricted |
| Database | uniprot_Sus_scrofa_180744_20200117.fasta |
| FDR | ≤0.01 |
| Protein Quantification | Use only unique peptides |
| Experimental Bias | Normalize on protein median |
Publisher’s Note: MDPI stays neutral with regard to jurisdictional claims in published maps and institutional affiliations. |
© 2022 by the authors. Licensee MDPI, Basel, Switzerland. This article is an open access article distributed under the terms and conditions of the Creative Commons Attribution (CC BY) license (https://creativecommons.org/licenses/by/4.0/).
Share and Cite
Jiang, D.; Zhang, L.; Zhu, G.; Zhang, P.; Wu, X.; Yao, X.; Luo, Y.; Yang, Z.; Ren, M.; Wang, X.; et al. The Antiviral Effect of Isatis Root Polysaccharide against NADC30-like PRRSV by Transcriptome and Proteome Analysis. Int. J. Mol. Sci. 2022, 23, 3688. https://doi.org/10.3390/ijms23073688
Jiang D, Zhang L, Zhu G, Zhang P, Wu X, Yao X, Luo Y, Yang Z, Ren M, Wang X, et al. The Antiviral Effect of Isatis Root Polysaccharide against NADC30-like PRRSV by Transcriptome and Proteome Analysis. International Journal of Molecular Sciences. 2022; 23(7):3688. https://doi.org/10.3390/ijms23073688
Chicago/Turabian StyleJiang, Dike, Ling Zhang, Guangheng Zhu, Pengfei Zhang, Xulong Wu, Xueping Yao, Yan Luo, Zexiao Yang, Meishen Ren, Xinping Wang, and et al. 2022. "The Antiviral Effect of Isatis Root Polysaccharide against NADC30-like PRRSV by Transcriptome and Proteome Analysis" International Journal of Molecular Sciences 23, no. 7: 3688. https://doi.org/10.3390/ijms23073688
APA StyleJiang, D., Zhang, L., Zhu, G., Zhang, P., Wu, X., Yao, X., Luo, Y., Yang, Z., Ren, M., Wang, X., Chen, S., & Wang, Y. (2022). The Antiviral Effect of Isatis Root Polysaccharide against NADC30-like PRRSV by Transcriptome and Proteome Analysis. International Journal of Molecular Sciences, 23(7), 3688. https://doi.org/10.3390/ijms23073688