
Discrimination between NSIP- and IPF-Derived Fibroblasts Based on Multi-Parameter Characterization of Their Growth, Morphology and Physic-Chemical Properties


 ,
,
Abstract
1. Introduction
2. Results
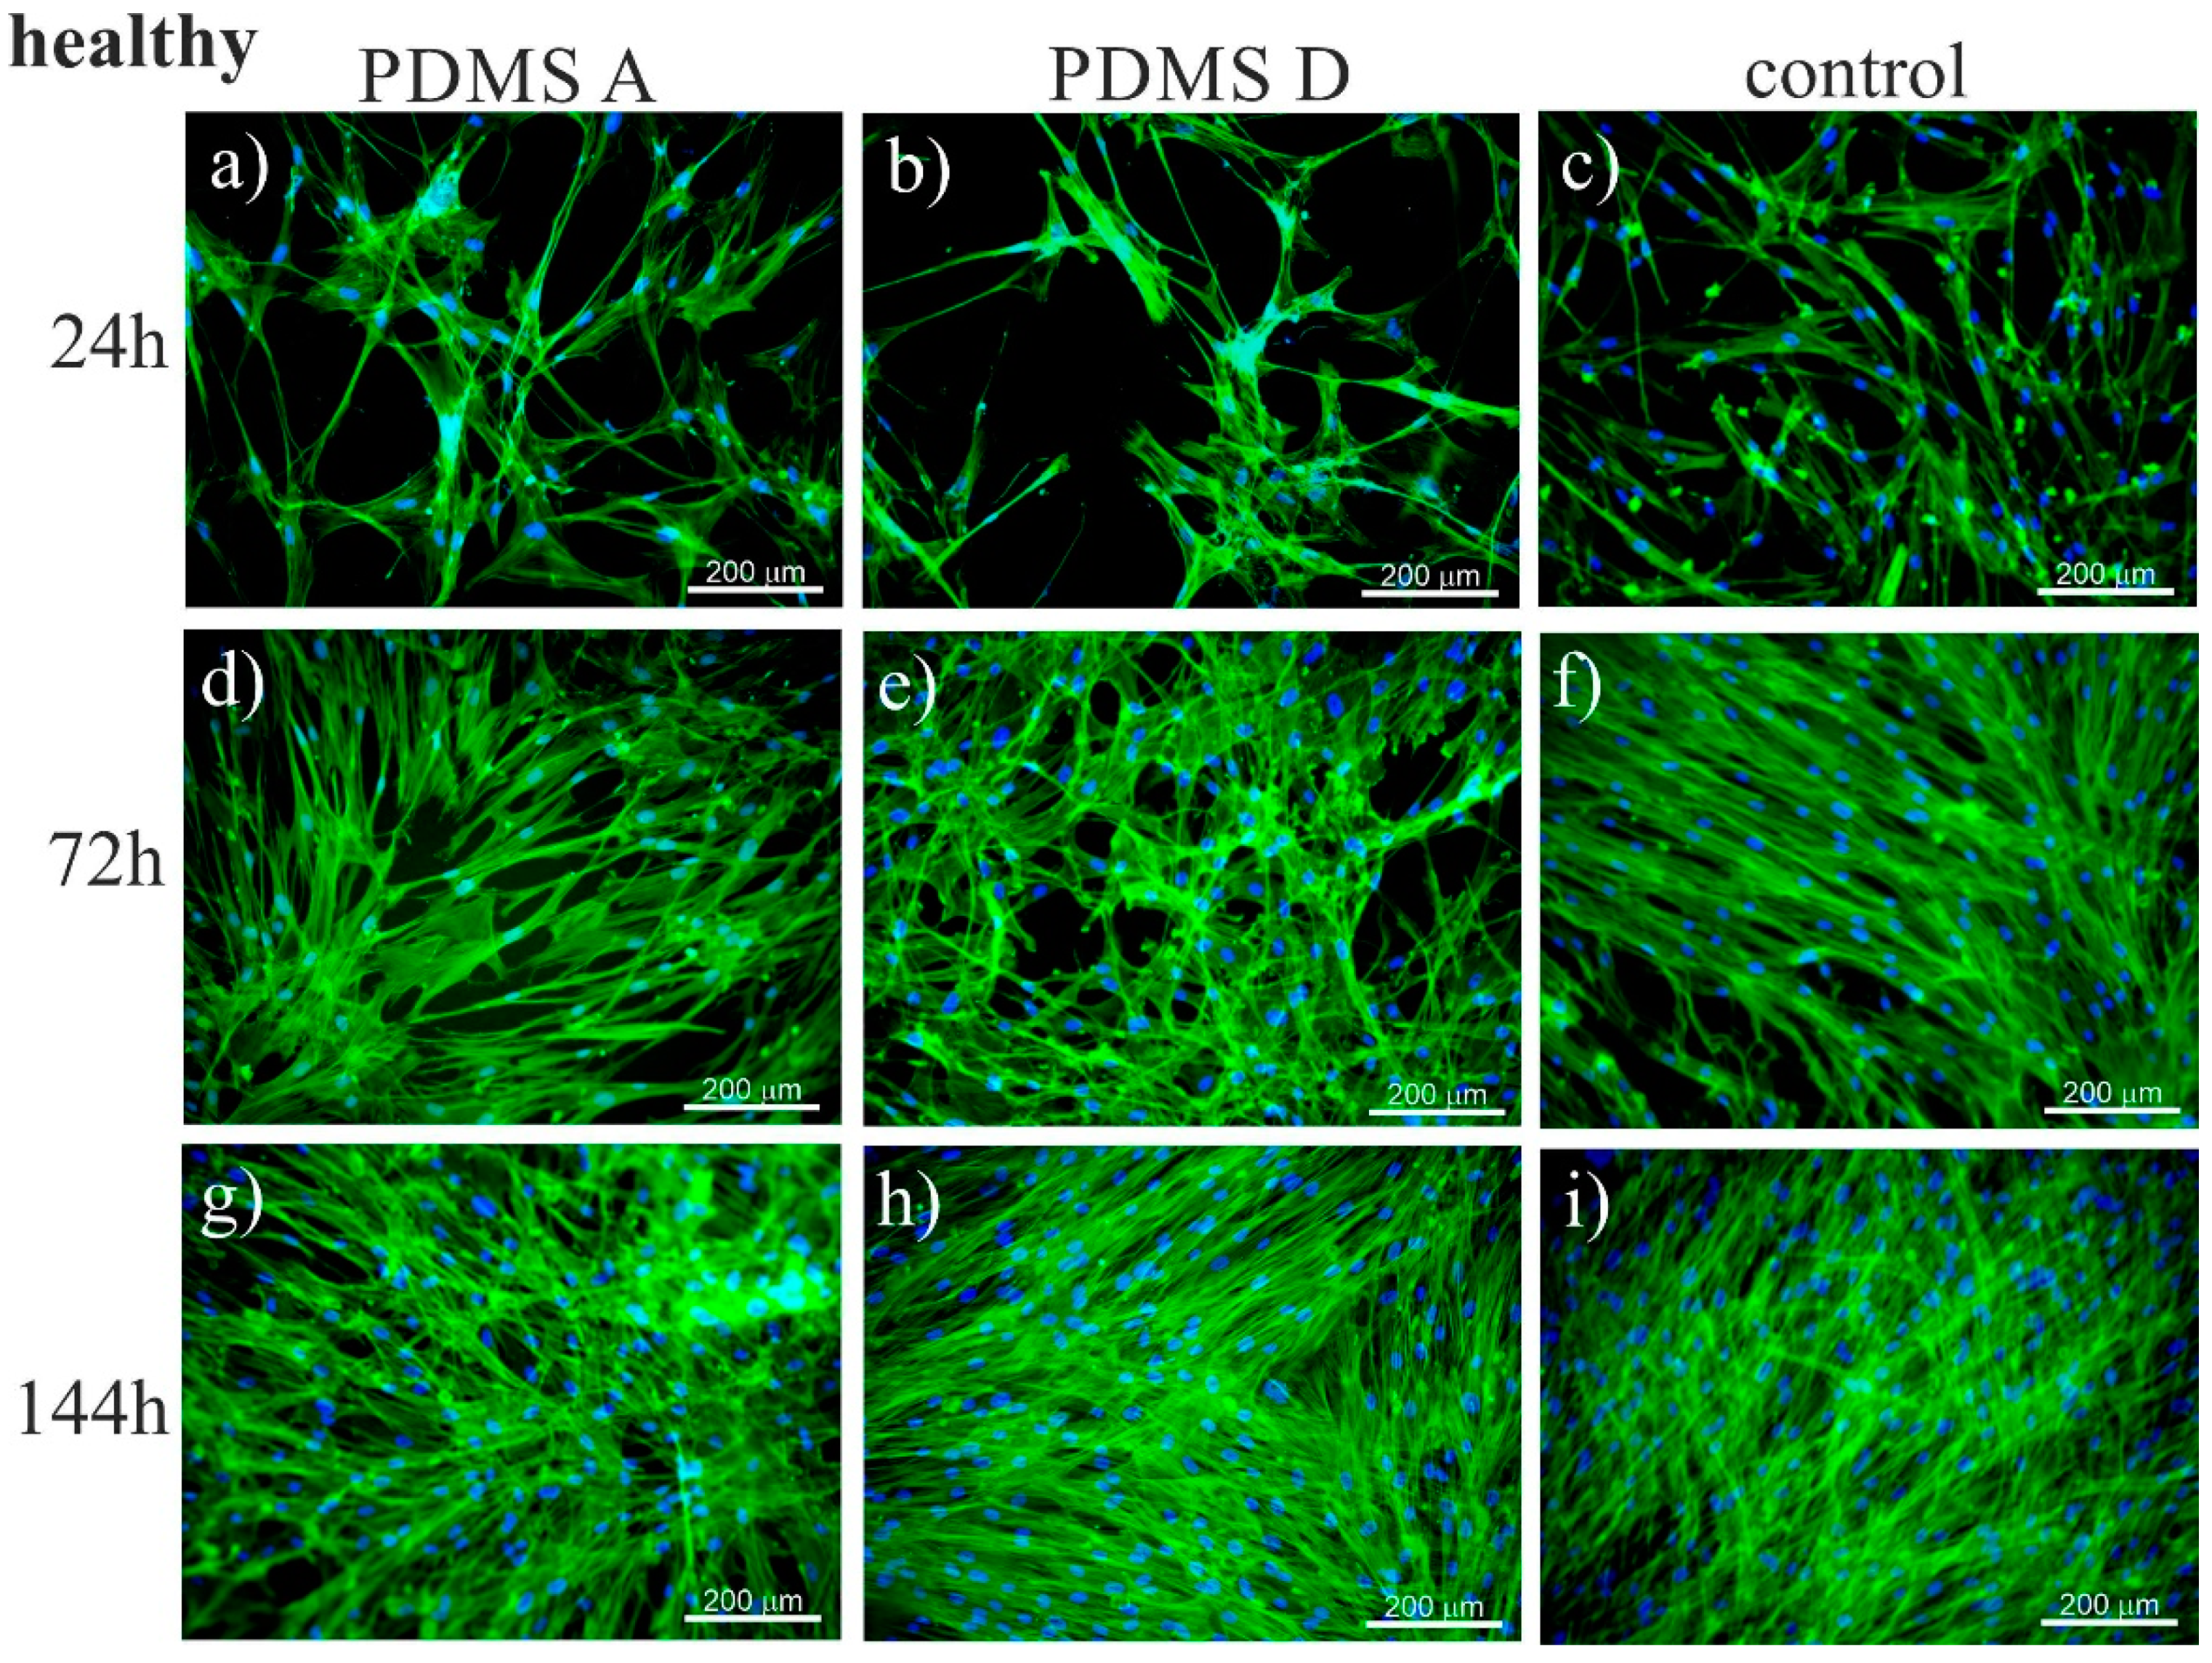
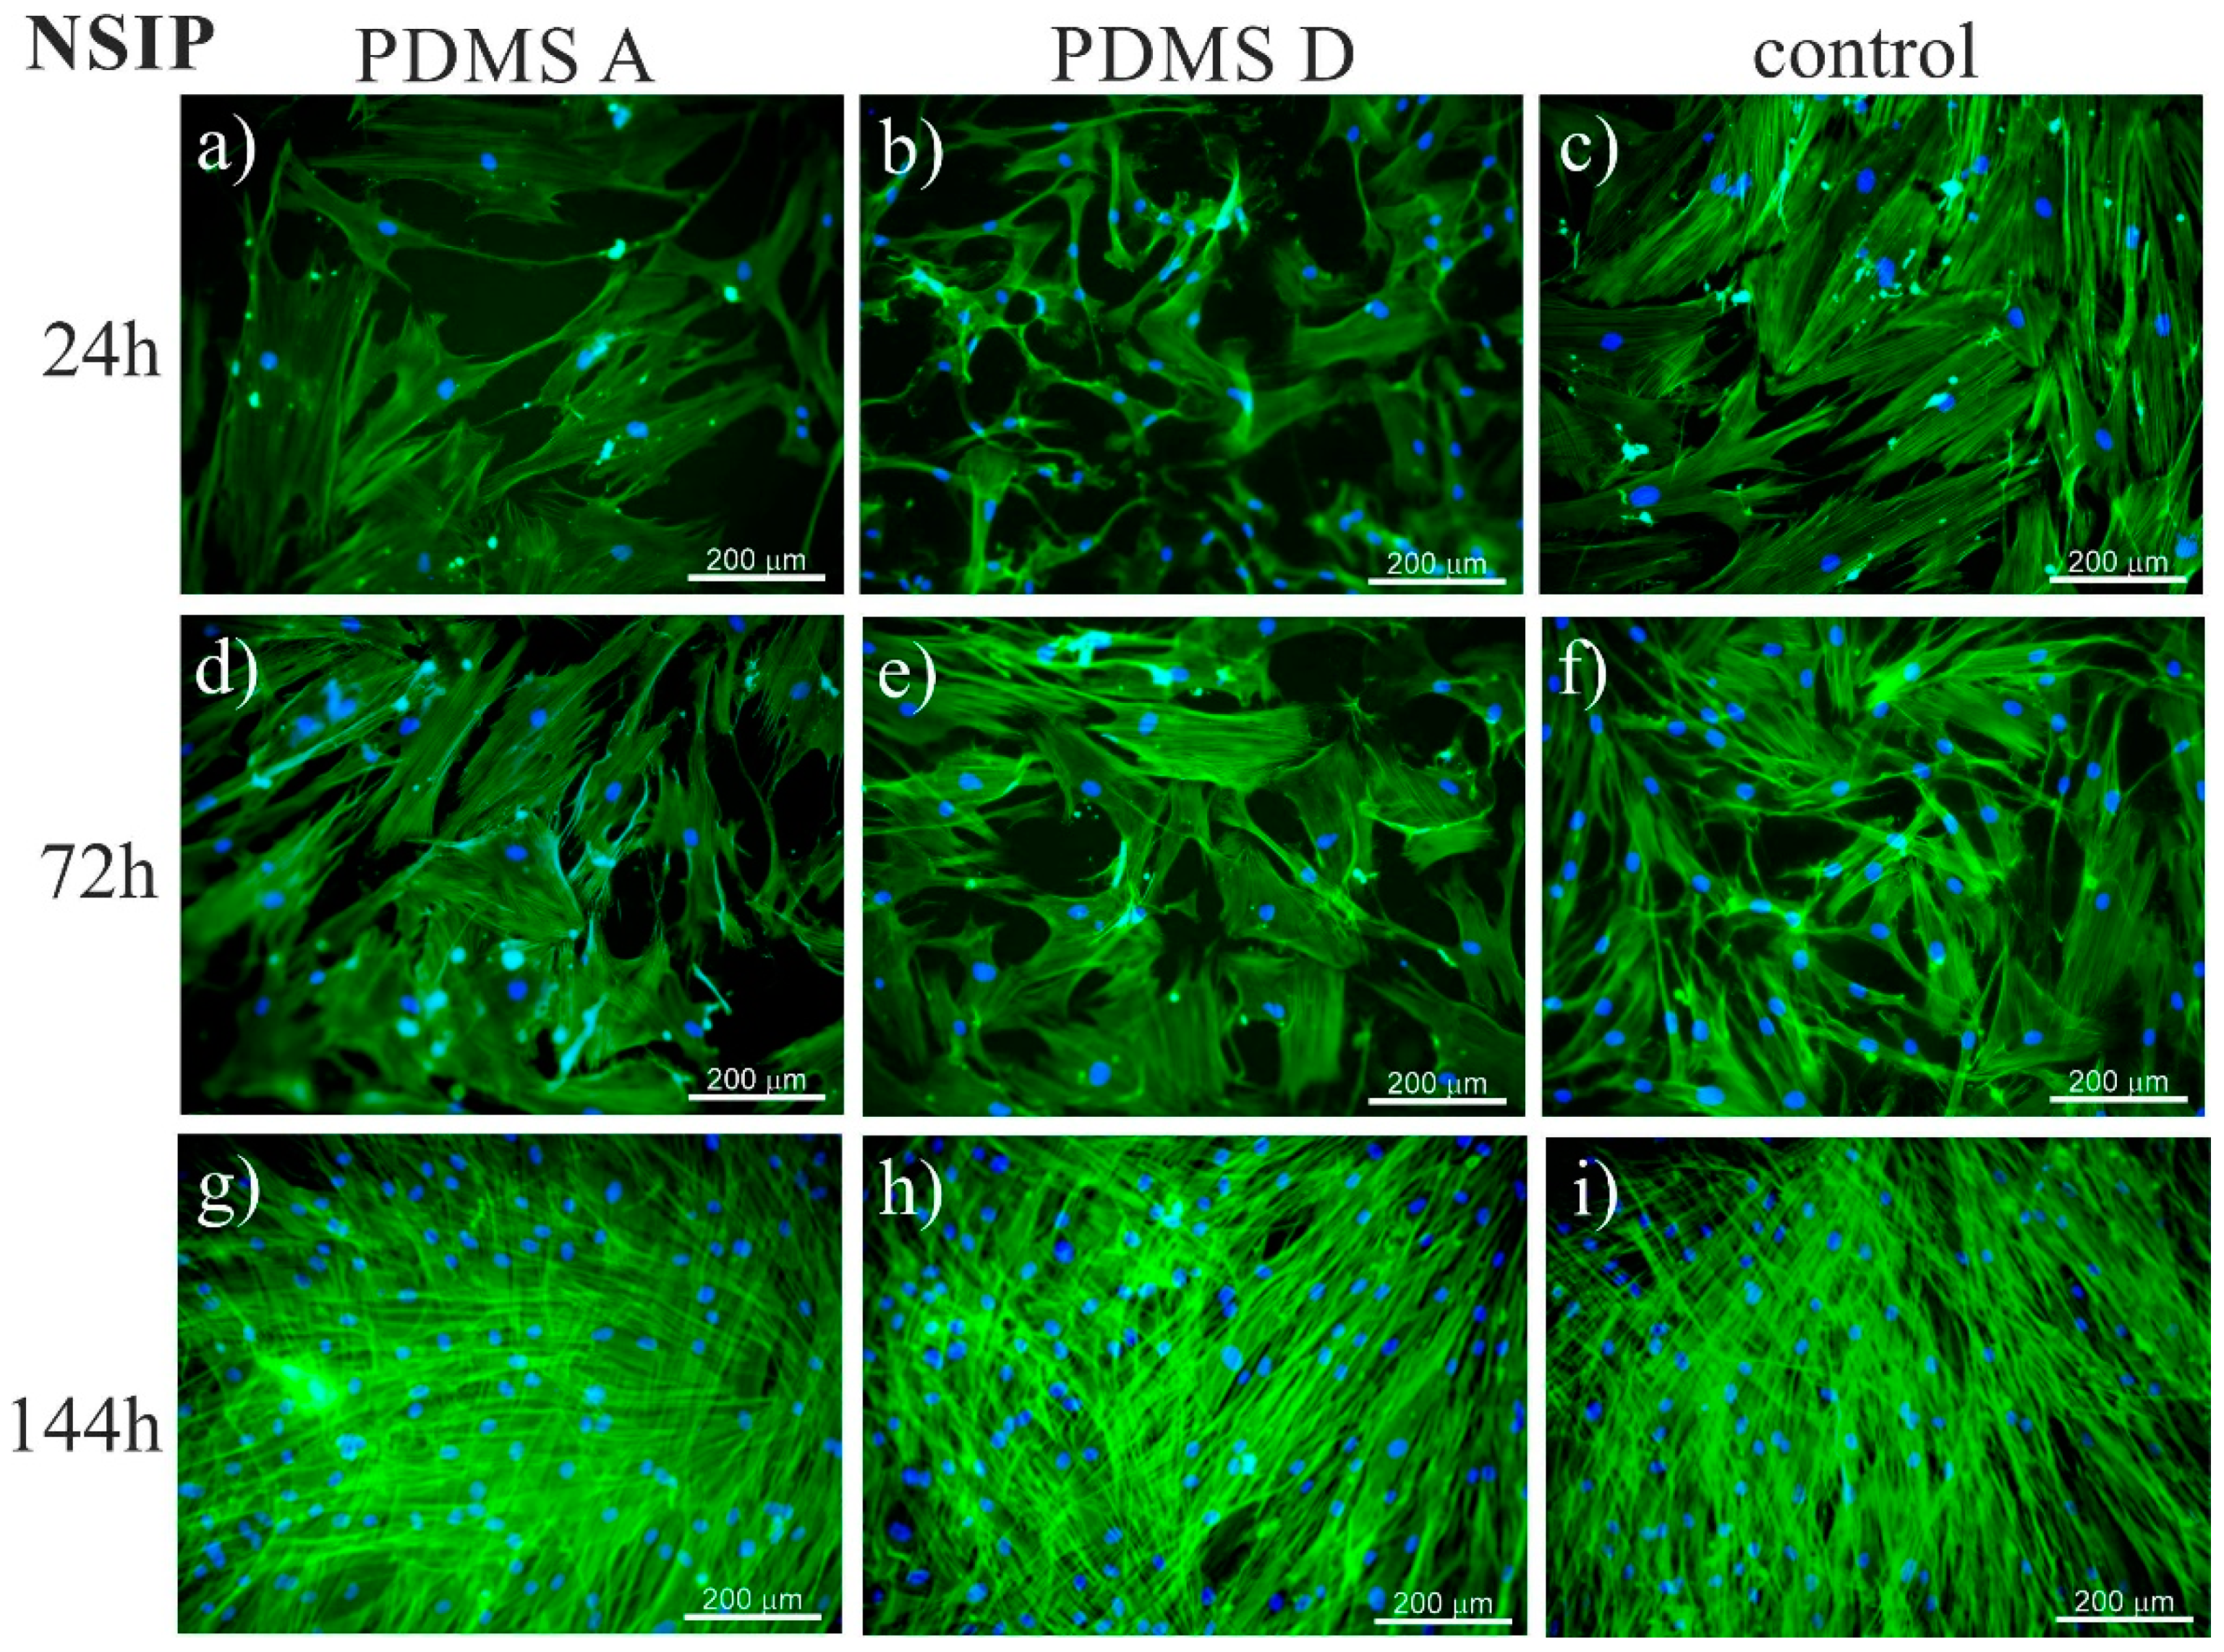
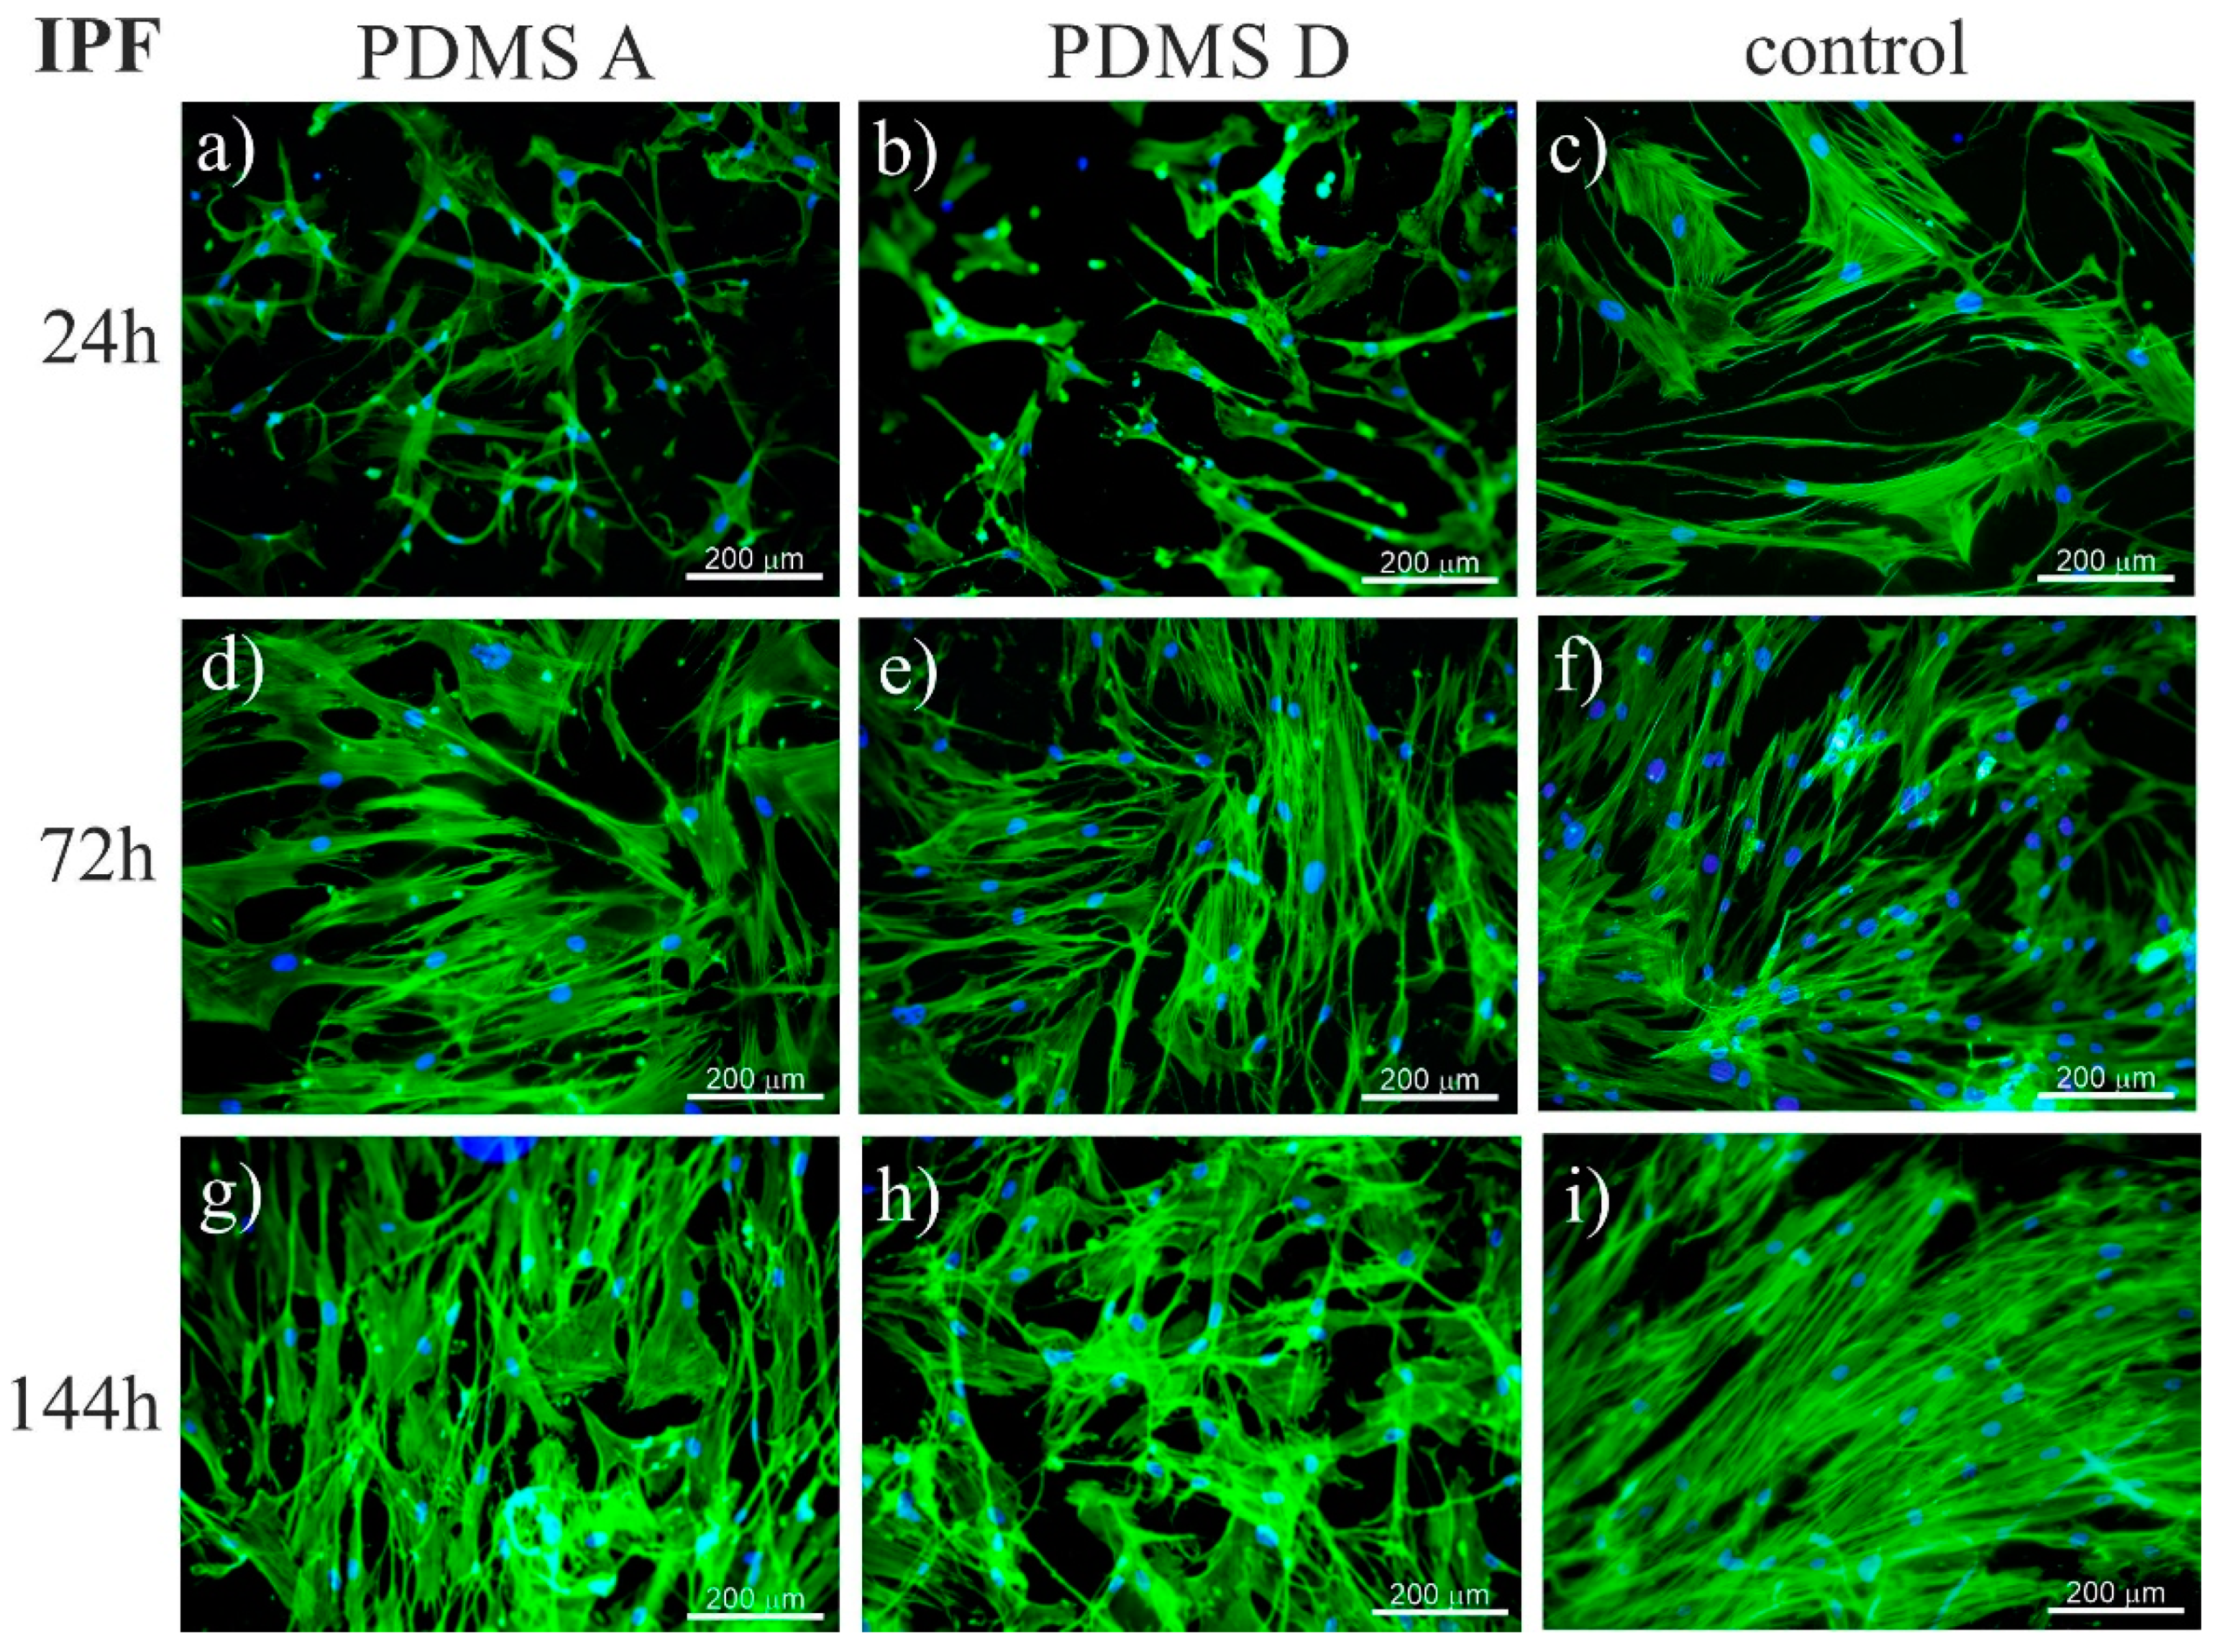
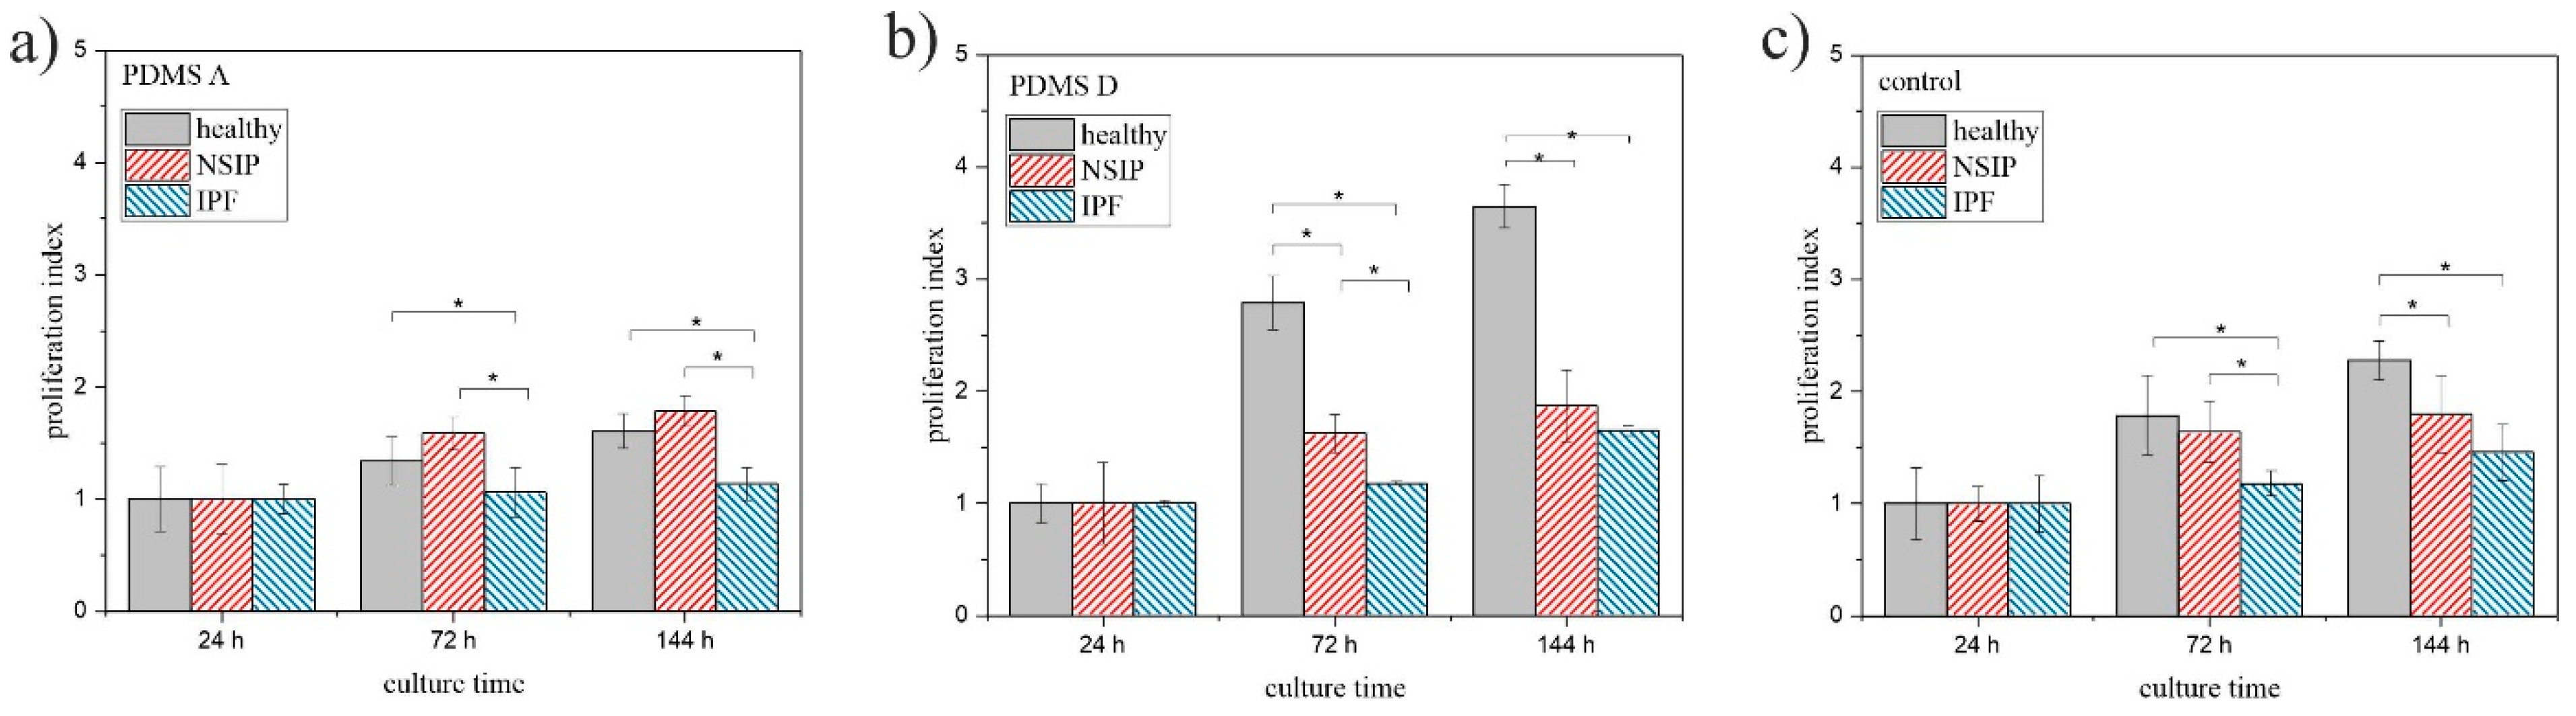
2.1. Cell Growth
2.1.1. Fluorescence Microscopy
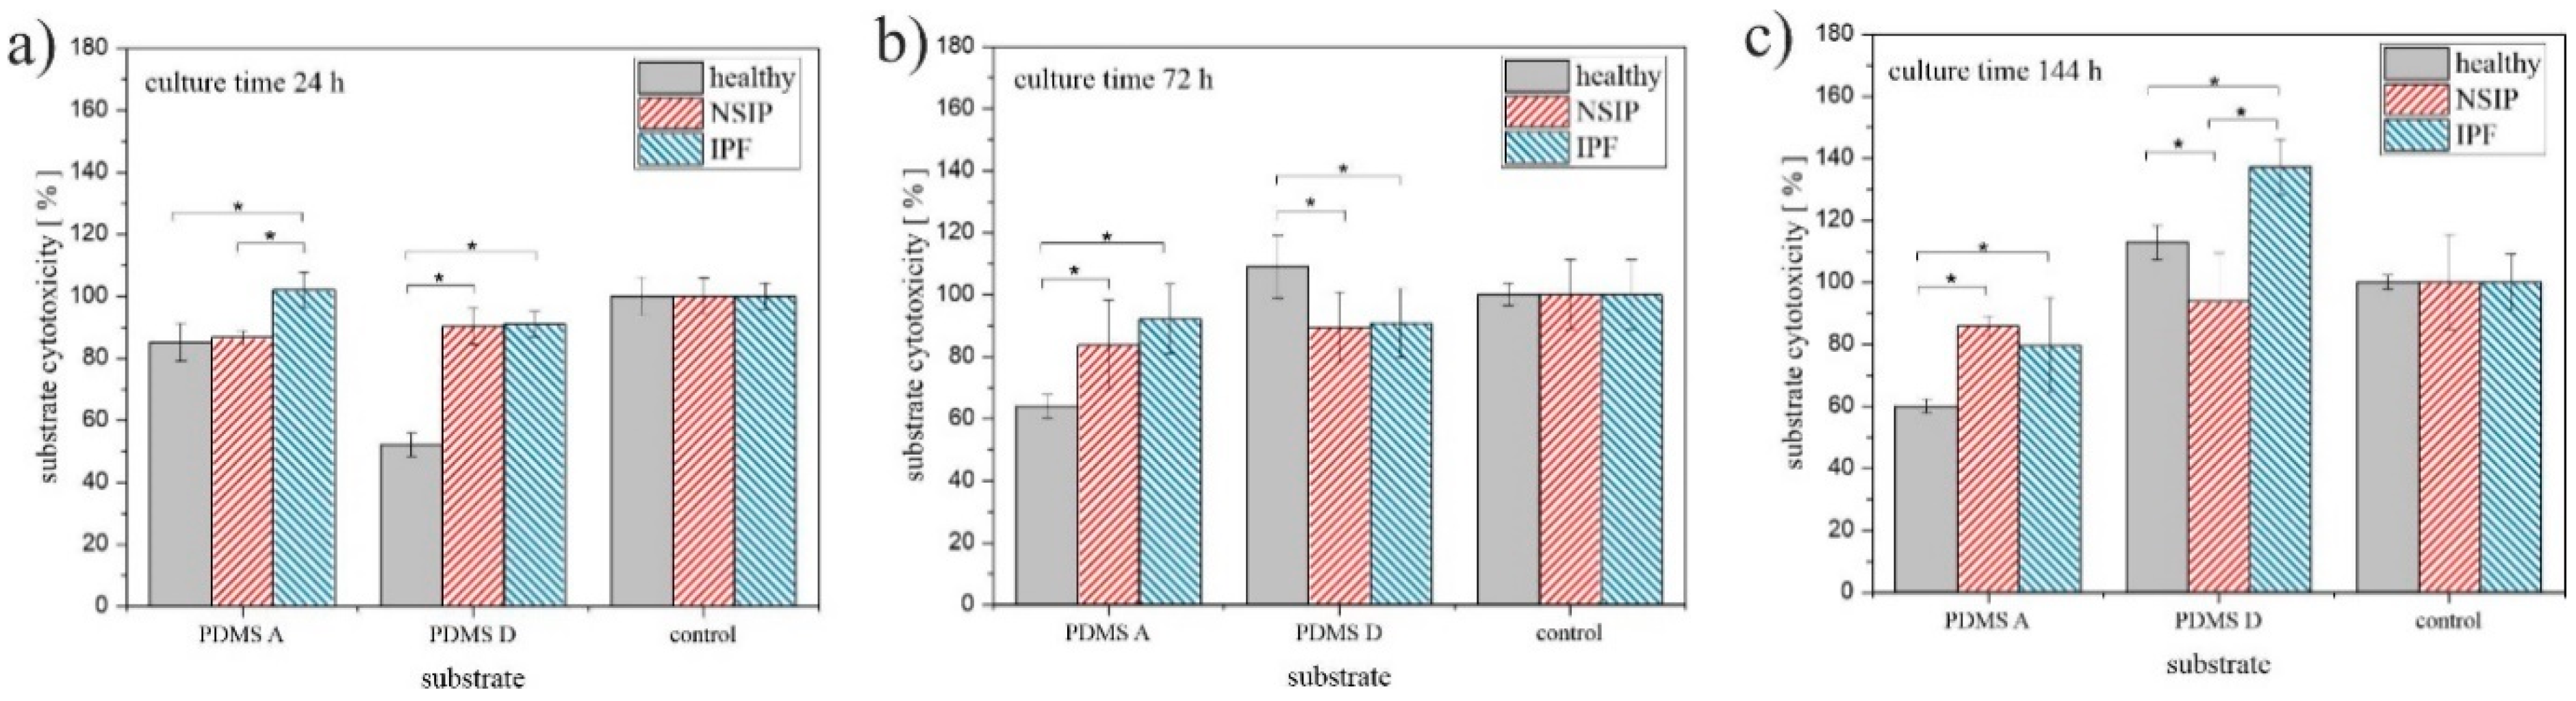
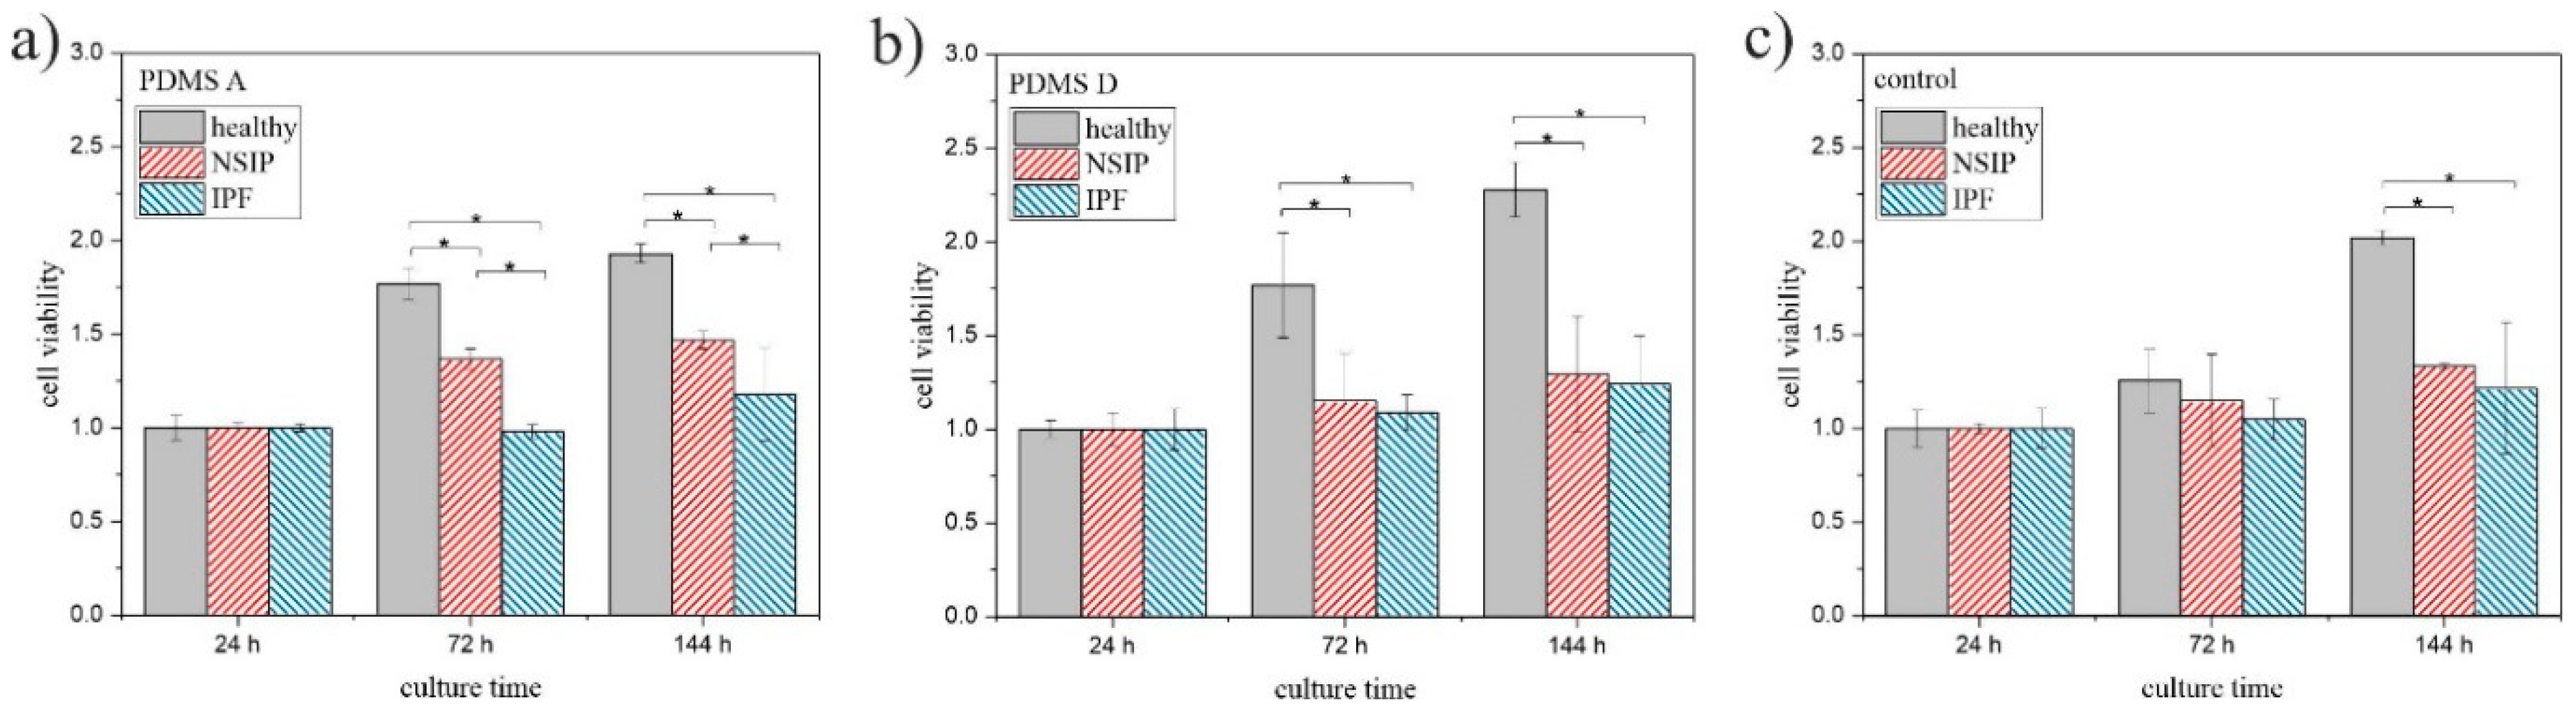
2.1.2. MTS
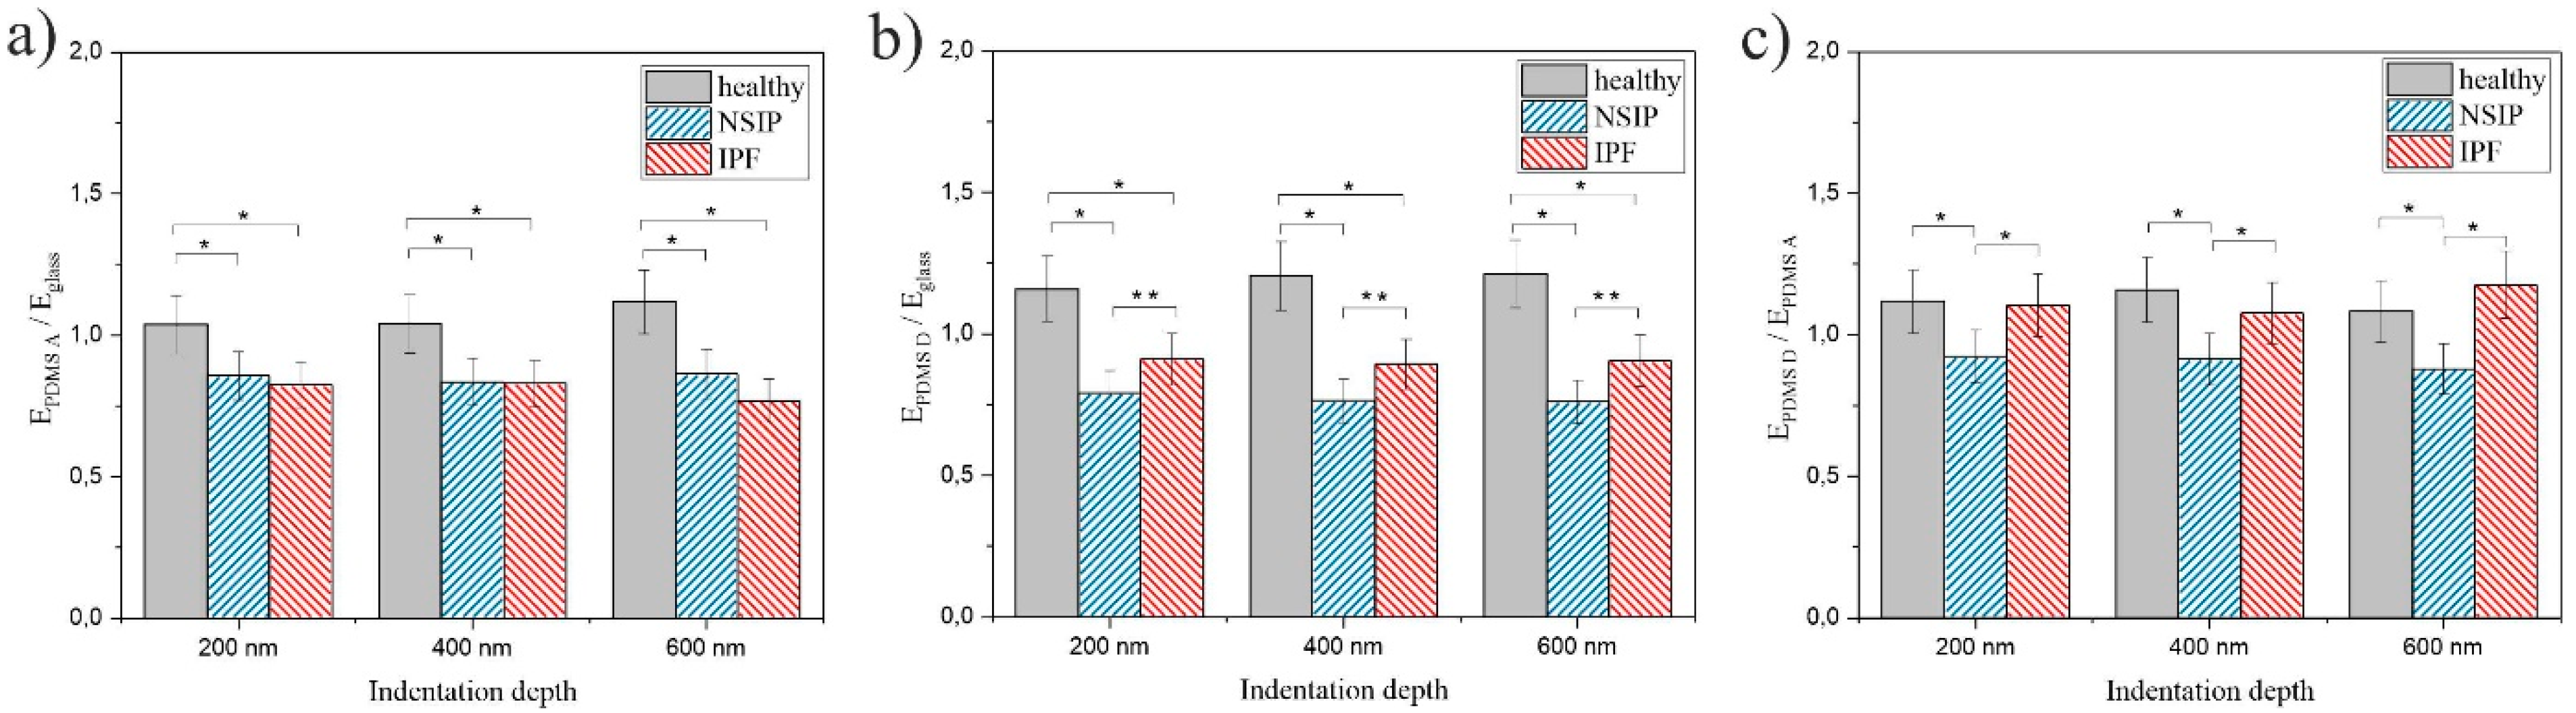
2.2. Elasticity
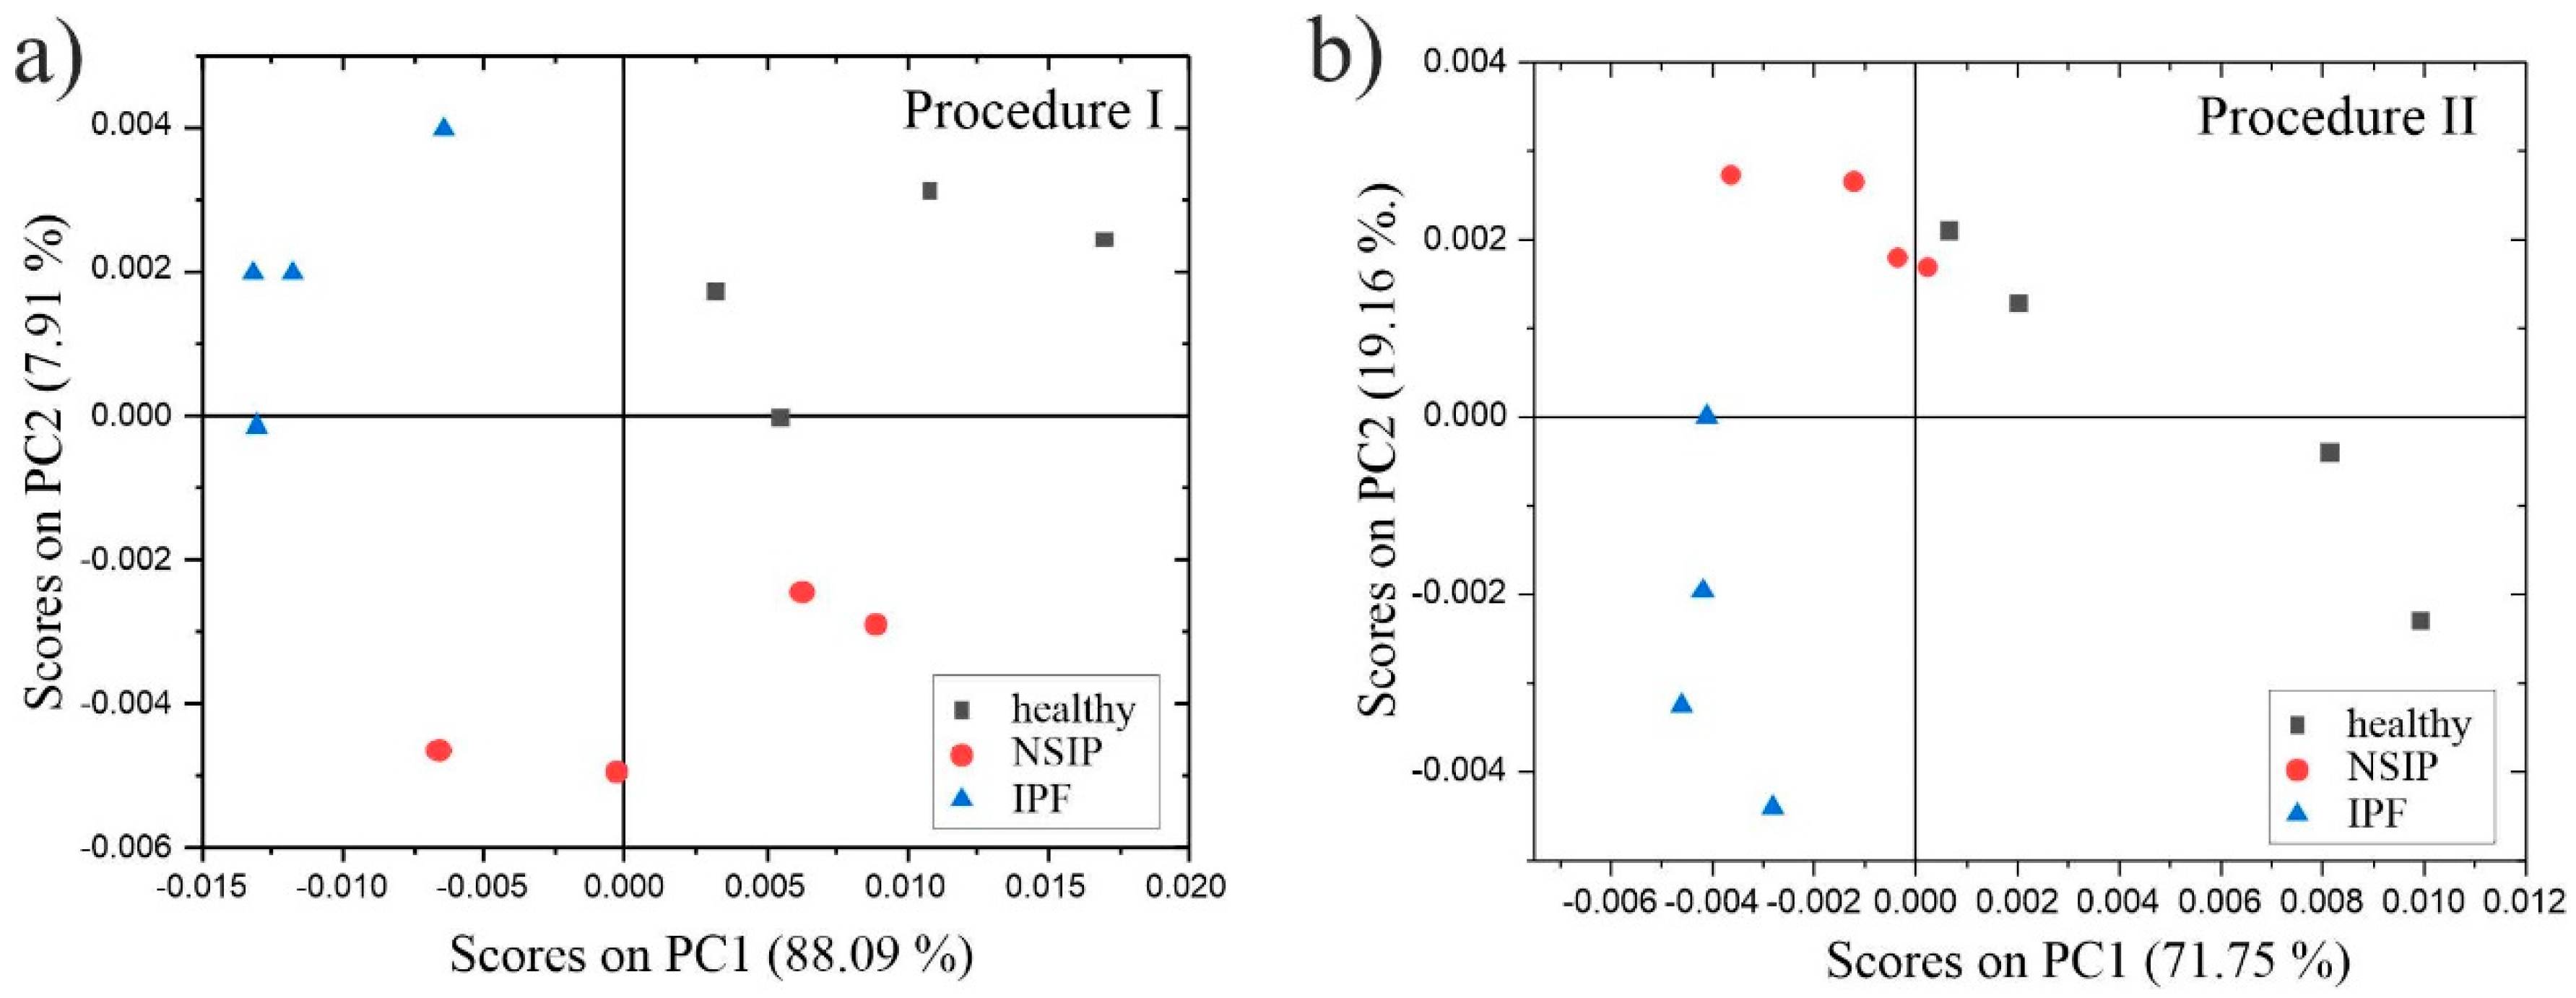
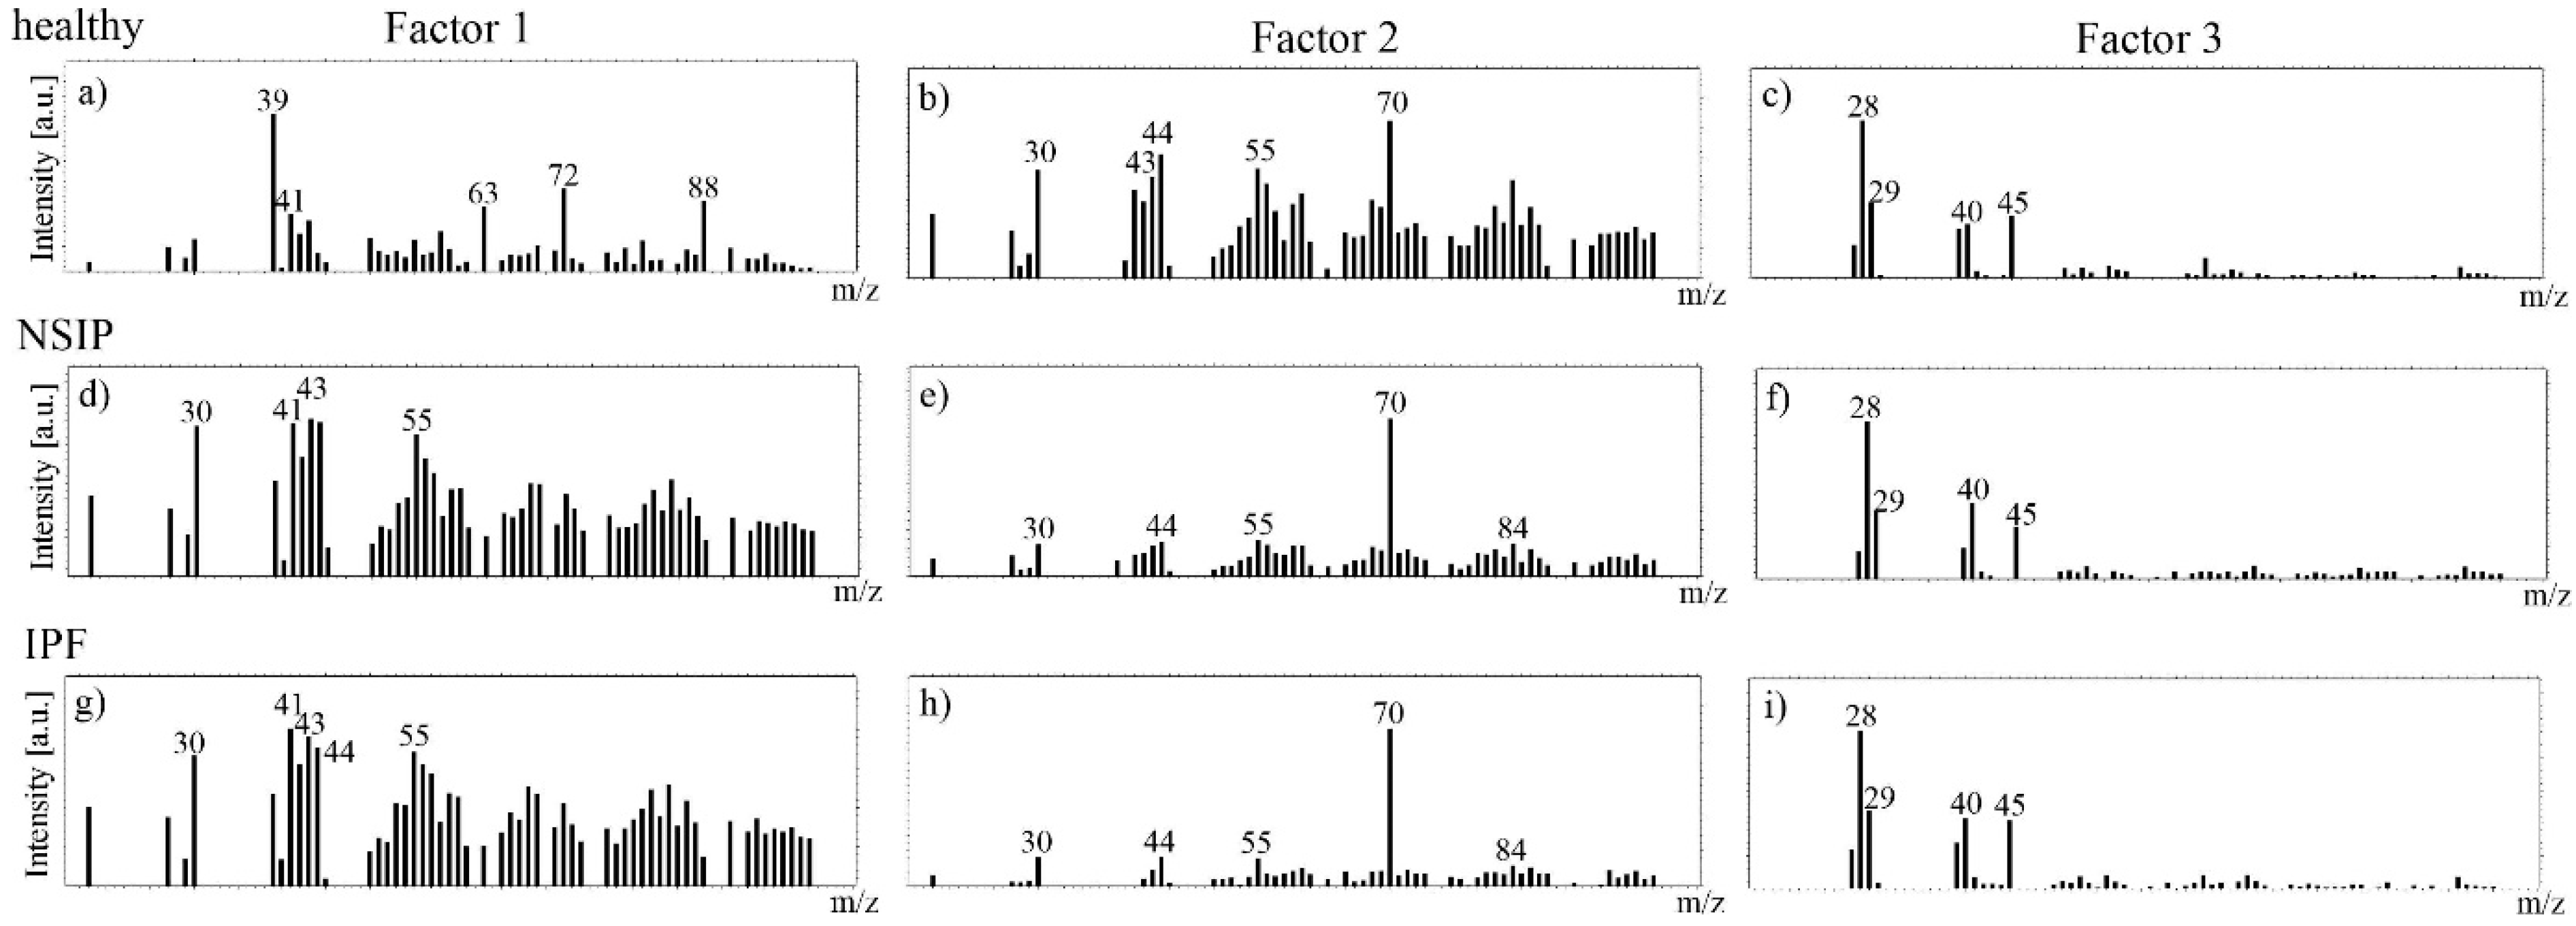
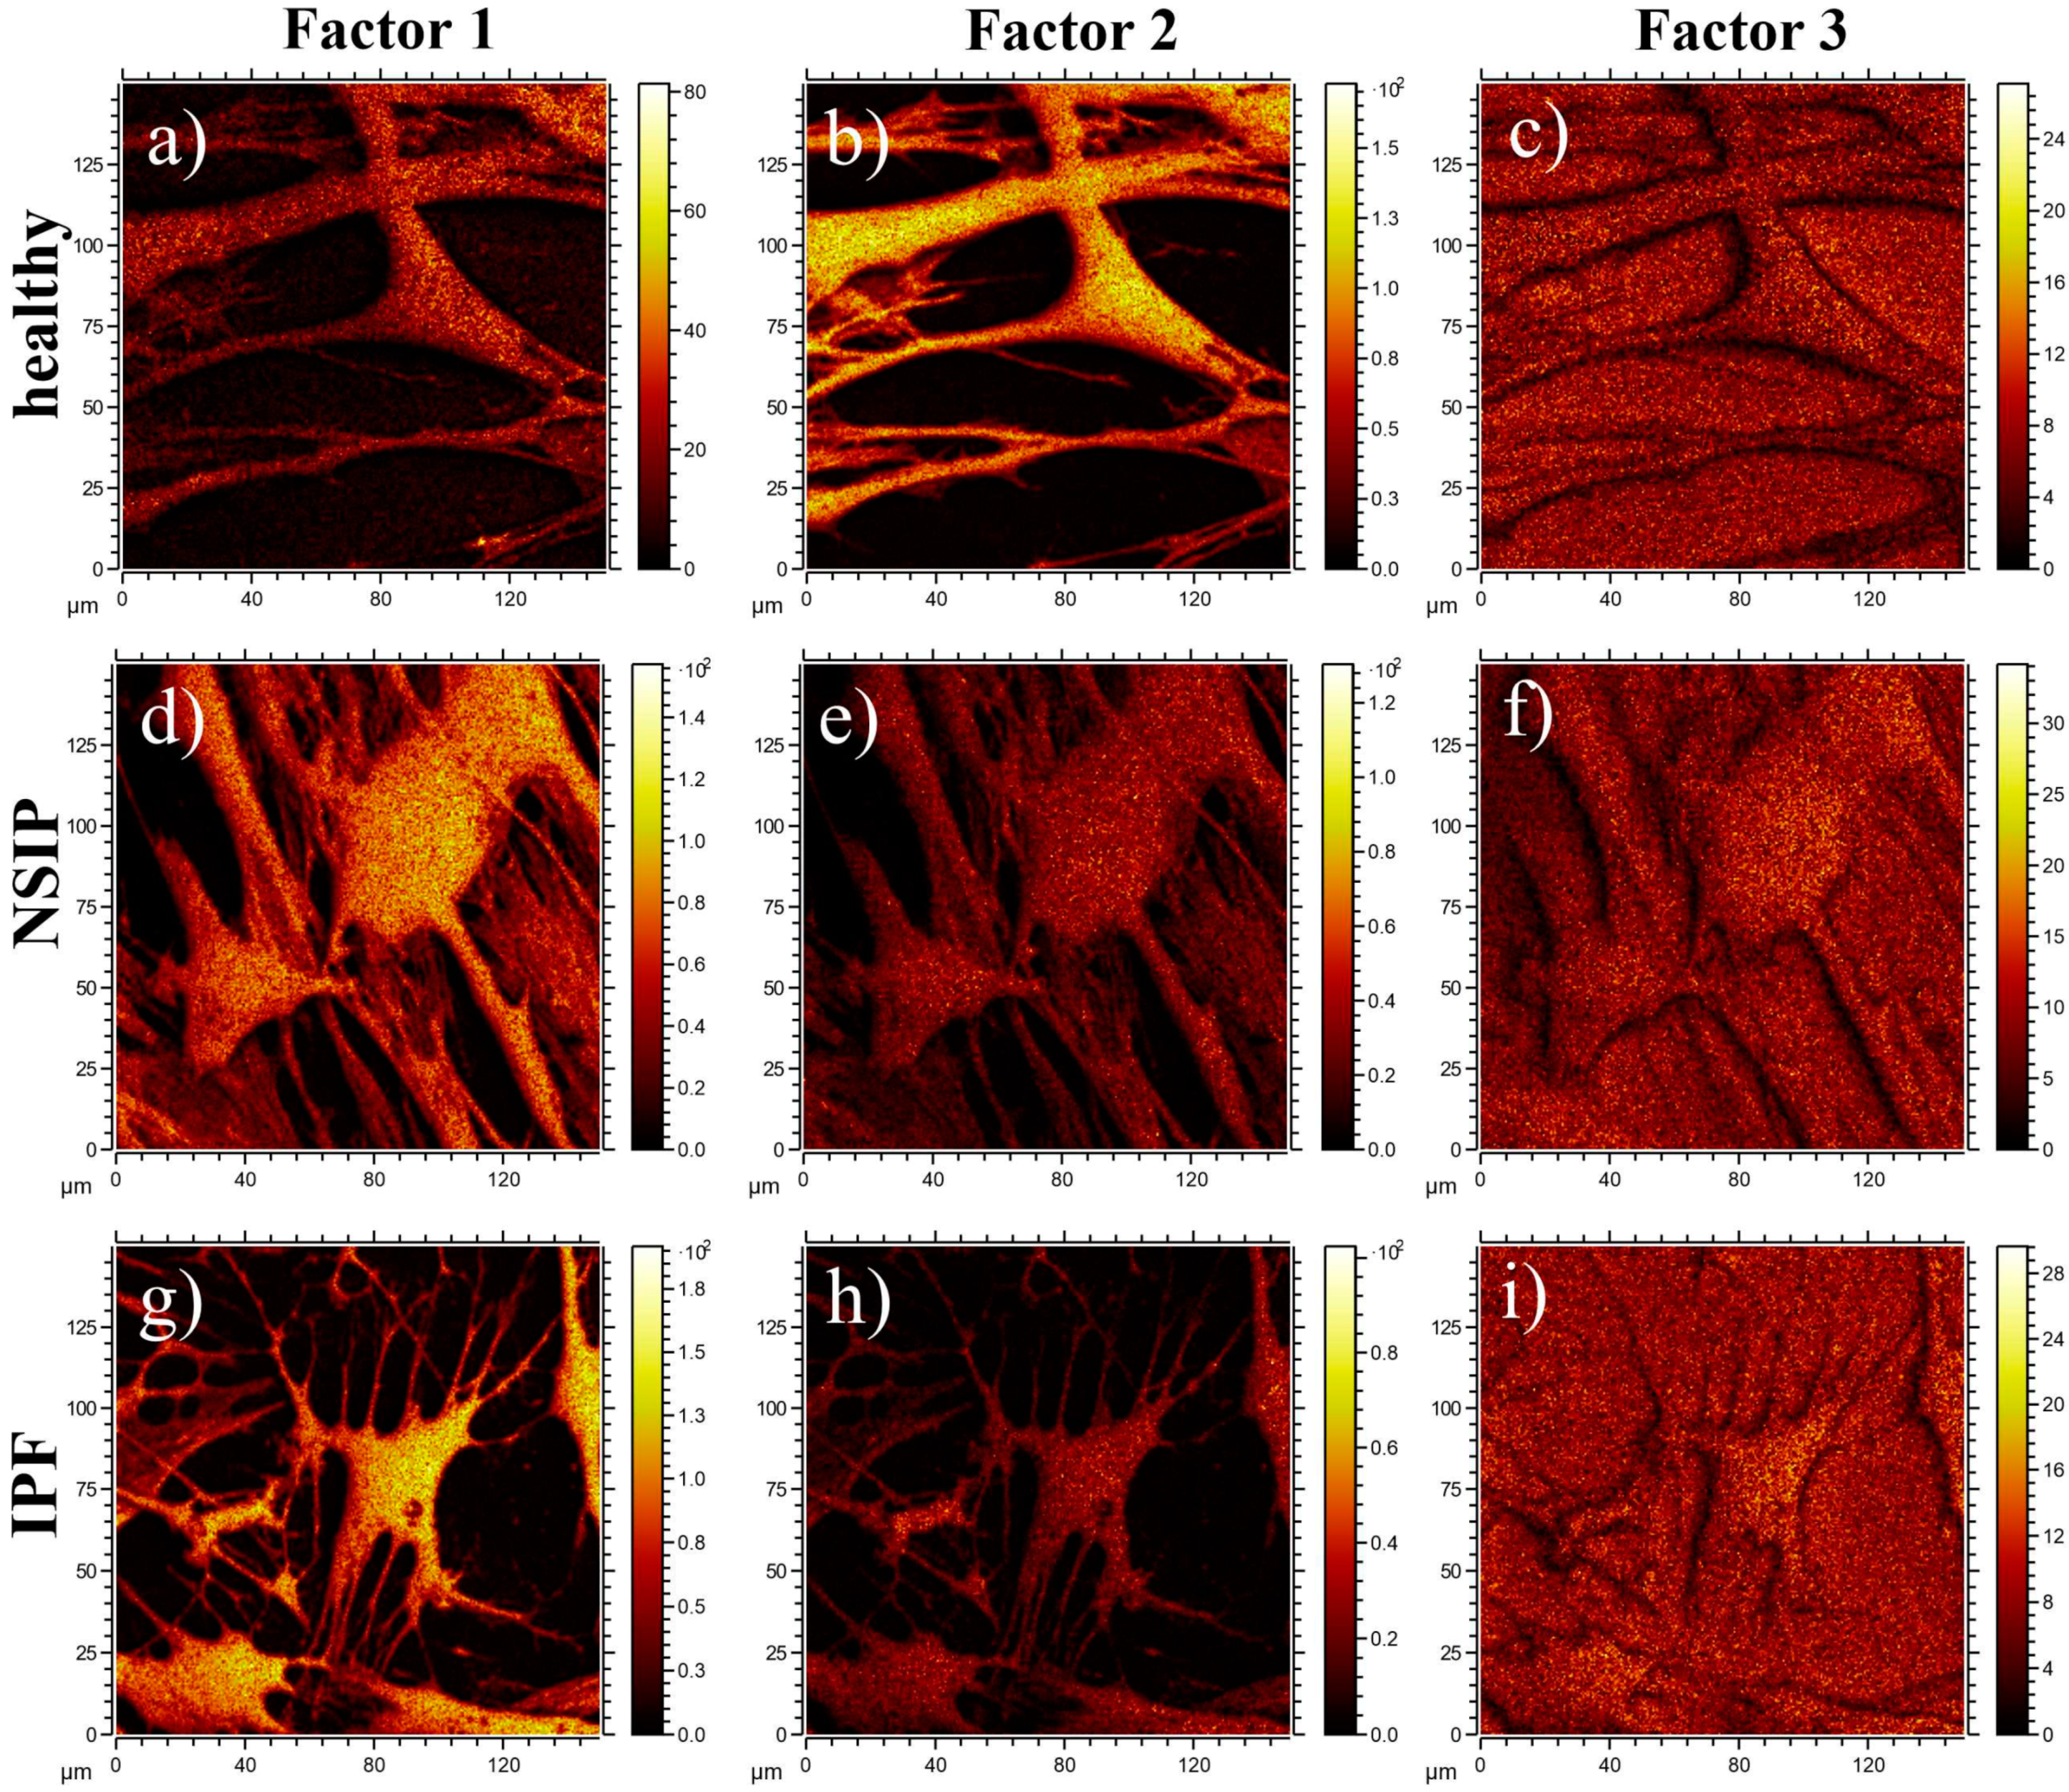
2.3. Chemical Analysis
3. Discussion
3.1. Growth of Cells
3.2. Elasticity
3.3. Chemical Analysis
4. Materials and Methods
4.1. Cell Culture
4.2. Bronchial Bronchoscopy and Primary Cells Isolation
4.3. Preparation of PDMS Substrates
4.4. Ethics Statement
4.5. Force Spectroscopy
4.6. ToF-SIMS
4.7. Colorimetric MTS Assay
4.8. Fluorescence Microscopy
4.9. Statistical Analysis
5. Conclusions
Supplementary Materials
Author Contributions
Funding
Institutional Review Board Statement
Informed Consent Statement
Acknowledgments
Conflicts of Interest
References
- Raghu, G.; Brown, K.K. Interstitial lung disease: Clinical evaluation and keys to an accurate diagnosis. Clin. Chest Med. 2004, 25, 409–419. [Google Scholar] [CrossRef] [PubMed]
- King, T.E. Clinical advances in the diagnosis and therapy of the interstitial lung diseases. Am. J. Respir. Crit. Care Med. 2005, 172, 268–279. [Google Scholar] [CrossRef]
- Moua, T.; Ryu, J.H. Obstacles to early treatment of idiopathic pulmonary fibrosis: Current perspectives. Ther. Clin. Risk Manag. 2019, 15, 73–81. [Google Scholar] [CrossRef]
- Sundar, M.K. Sleep Apnea Management in “Possible IPF” and “Idiopathic NSIP”: A Case-Series. J. Sleep Disord. Ther. 2014, 3, 1–6. [Google Scholar] [CrossRef]
- Vancheri, C.; Failla, M.; Crimi, N.; Raghu, G. Idiopathic pulmonary fibrosis: A disease with similarities and links to cancer biology. Eur. Respir. J. 2010, 35, 496–504. [Google Scholar] [CrossRef] [PubMed]
- Baratella, E.; Ruaro, B.; Giudici, F.; Wade, B.; Santagiuliana, M.; Salton, F.; Confalonieri, P.; Simbolo, M.; Scarpa, A.; Tollot, S.; et al. Evaluation of correlations between genetic variants and high-resolution computed tomography patterns in idiopathic pulmonary fibrosis. Diagnostics 2021, 11, 762. [Google Scholar] [CrossRef] [PubMed]
- Yoon, H.Y.; Moon, S.J.; Song, J.W. Lung Tissue Microbiome Is Associated with Clinical Outcomes of Idiopathic Pulmonary Fibrosis. Front. Med. 2021, 8, 1–10. [Google Scholar] [CrossRef] [PubMed]
- Travis, W.D.; Costabel, U.; Hansell, D.M.; King, T.E.; Lynch, D.A.; Nicholson, A.G.; Ryerson, C.J.; Ryu, J.H.; Selman, M.; Wells, A.U.; et al. An official American Thoracic Society/European Respiratory Society statement: Update of the international multidisciplinary classification of the idiopathic interstitial pneumonias. Am. J. Respir. Crit. Care Med. 2013, 188, 733–748. [Google Scholar] [CrossRef]
- Du Bois, R.; King, T.E. Challenges in pulmonary fibrosis 5: The NSIP/UIP debate. Thorax 2007, 62, 1008–1012. [Google Scholar] [CrossRef] [PubMed]
- Kim, D.S.; Nagai, S. Idiopathic nonspecific interstitial pneumonia: An unrecognized autoimmune disease? Am. J. Respir. Crit. Care Med. 2007, 176, 632–633. [Google Scholar] [CrossRef] [PubMed]
- Glaspole, I.; Goh, N.S.L. Differentiating between IPF and NSIP. Chron. Respir. Dis. 2010, 7, 187–195. [Google Scholar] [CrossRef]
- Flaherty, K.R.; Andrei, A.C.; King, T.E.; Raghu, G.; Colby, T.V.; Wells, A.; Bassily, N.; Brown, K.; Du Bois, R.; Flint, A.; et al. Idiopathic interstitial pneumonia: Do community and academic physicians agree on diagnosis? Am. J. Respir. Crit. Care Med. 2007, 175, 1054–1060. [Google Scholar] [CrossRef] [PubMed]
- Schär, B. A brief overview of IPF and NSIP. Contin. Med. Educ. 2013, 31, 342–343. [Google Scholar]
- Salonen, J.; Purokivi, M.; Bloigu, R.; Kaarteenaho, R. Prognosis and causes of death of patients with acute exacerbation of fibrosing interstitial lung diseases. BMJ Open Respir. Res. 2020, 7, e000563. [Google Scholar] [CrossRef] [PubMed]
- Ley, B.; Collard, H.R.; King, T.E. Clinical course and prediction of survival in idiopathic pulmonary fibrosis. Am. J. Respir. Crit. Care Med. 2011, 183, 431–440. [Google Scholar] [CrossRef] [PubMed]
- Souza, C.A.; Müller, N.L.; Flint, J.; Wright, J.L.; Churg, A. Idiopathic pulmonary fibrosis: Spectrum of high-resolution CT findings. Am. J. Roentgenol. 2005, 185, 1531–1539. [Google Scholar] [CrossRef] [PubMed]
- Fernández Pérez, E.R.; Daniels, C.E.; Schroeder, D.R.; St. Sauver, J.; Hartman, T.E.; Bartholmai, B.J.; Yi, E.S.; Ryu, J.H. Incidence, prevalence, and clinical course of idiopathic pulmonary fibrosis a population-based study. Chest 2010, 137, 129–137. [Google Scholar] [CrossRef] [PubMed]
- Sauleda, J.; Núñez, B.; Sala, E.; Soriano, J. Idiopathic Pulmonary Fibrosis: Epidemiology, Natural History, Phenotypes. Med. Sci. 2018, 6, 110. [Google Scholar] [CrossRef]
- Agabiti, N.; Porretta, M.A.; Bauleo, L.; Coppola, A.; Sergiacomi, G.; Fusco, A.; Cavalli, F.; Zappa, M.C.; Vignarola, R.; Carlone, S.; et al. Idiopathic Pulmonary Fibrosis (IPF) incidence and prevalence in Italy. Sarcoidosis Vasc. Diffus. Lung Dis. 2014, 31, 191–197. [Google Scholar]
- Ebner, L.; Christodoulidis, S.; Stathopoulou, T.; Geiser, T.; Stalder, O.; Limacher, A.; Heverhagen, J.T.; Mougiakakou, S.G.; Christe, A. Meta-analysis of the radiological and clinical features of Usual Interstitial Pneumonia (UIP) and Nonspecific Interstitial Pneumonia (NSIP). PLoS ONE 2020, 15, e0226084. [Google Scholar] [CrossRef]
- Belloli, E.A.; Beckford, R.; Hadley, R.; Flaherty, K.R. Idiopathic non-specific interstitial pneumonia. Respirology 2016, 21, 259–268. [Google Scholar] [CrossRef] [PubMed]
- Travis, W.D.; Hunninghake, G.; King, T.E.; Lynch, D.A.; Colby, T.V.; Galvin, J.R.; Brown, K.K.; Man, P.C.; Cordier, J.F.; Du Bois, R.M.; et al. Idiopathic nonspecific interstitial pneumonia: Report of an American Thoracic Society Project. Am. J. Respir. Crit. Care Med. 2008, 177, 1338–1347. [Google Scholar] [CrossRef] [PubMed]
- Tsuchiya, Y.; Takayanagi, N.; Sugiura, H.; Miyahara, Y.; Tokunaga, D.; Kawabata, Y.; Sugita, Y. Lung diseases directly associated with rheumatoid arthritis and their relationship to outcome. Eur. Respir. J. 2011, 37, 1411–1417. [Google Scholar] [CrossRef] [PubMed]
- Torrisi, S.E.; Pavone, M.; Vancheri, A.; Vancheri, C. When to start and when to stop antifibrotic therapies. Eur. Respir. Rev. 2017, 26, 170053. [Google Scholar] [CrossRef]
- Maher, T.M.; Strek, M.E. Antifibrotic therapy for idiopathic pulmonary fibrosis. Respir. Res. 2019, 20, 205–214. [Google Scholar] [CrossRef] [PubMed]
- Sathiyamoorthy, G.; Sehgal, S.; Ashton, R. Pirfenidone and Nintedanib for Treatment of Idiopathic Pulmonary Fibrosis. South Med. J. 2017, 110, 393–398. [Google Scholar] [CrossRef]
- Belhassen, M.; Dalon, F.; Nolin, M.; Van Ganse, E. Comparative outcomes in patients receiving pirfenidone or nintedanib for idiopathic pulmonary fibrosis. Respir. Res. 2021, 22, 135. [Google Scholar] [CrossRef] [PubMed]
- Flaherty, K.R.; Fell, C.D.; Huggins, J.T.; Nunes, H.; Sussman, R.; Valenzuela, C.; Petzinger, U.; Stauffer, J.L.; Gilberg, F.; Bengus, M.; et al. Safety of nintedanib added to pirfenidone treatment for idiopathic pulmonary fibrosis. Eur. Respir. J. 2018, 52, 1800230. [Google Scholar] [CrossRef] [PubMed]
- Raghu, G.; Remy-Jardin, M.; Myers, J.L.; Richeldi, L.; Ryerson, C.J.; Lederer, D.J.; Behr, J.; Cottin, V.; Danoff, S.K.; Morell, F.; et al. Diagnosis of idiopathic pulmonary fibrosis An Official ATS/ERS/JRS/ALAT Clinical practice guideline. Am. J. Respir. Crit. Care Med. 2018, 198, e44–e68. [Google Scholar] [CrossRef]
- Aburto, M.; Herráez, I.; Iturbe, D.; Jiménez-Romero, A. Diagnosis of Idiopathic Pulmonary Fibrosis: Differential Diagnosis. Med. Sci. 2018, 6, 73. [Google Scholar] [CrossRef] [PubMed]
- Furini, F.; Carnevale, A.; Casoni, G.L.; Guerrini, G.; Cavagna, L.; Govoni, M.; Sciré, C.A. The role of the multidisciplinary evaluation of interstitial lung diseases: Systematic literature review of the current evidence and future perspectives. Front. Med. 2019, 6, 246. [Google Scholar] [CrossRef] [PubMed]
- Cavagna, L.; Monti, S.; Grosso, V.; Boffini, N.; Scorletti, E.; Crepaldi, G.; Caporali, R. The multifaceted aspects of interstitial lung disease in rheumatoid arthritis. Biomed. Res. Int. 2013, 2013, 759760. [Google Scholar] [CrossRef] [PubMed]
- Yoo, H.; Hino, T.; Han, J.; Franks, T.J.; Im, Y.; Hatabu, H.; Chung, M.P.; Lee, K.S. Connective tissue disease-related interstitial lung disease (CTD-ILD) and interstitial lung abnormality (ILA): Evolving concept of CT findings, pathology and management. Eur. J. Radiol. Open 2021, 8, 100311. [Google Scholar] [CrossRef] [PubMed]
- Raghu, G.; Collard, H.R.; Egan, J.J.; Martinez, F.J.; Behr, J.; Brown, K.K.; Colby, T.V.; Cordier, J.F.; Flaherty, K.R.; Lasky, J.A.; et al. An Official ATS/ERS/JRS/ALAT Statement: Idiopathic pulmonary fibrosis: Evidence-based guidelines for diagnosis and management. Am. J. Respir. Crit. Care Med. 2011, 183, 788–824. [Google Scholar] [CrossRef]
- Flaherty, K.R.; King, T.E.; Raghu, G.; Lynch, J.P.; Colby, T.V.; Travis, W.D.; Gross, B.H.; Kazerooni, E.A.; Toews, G.B.; Long, Q.; et al. Idiopathic interstitial pneumonia: What is the effect of a multidisciplinary approach to diagnosis? Am. J. Respir. Crit. Care Med. 2004, 170, 904–910. [Google Scholar] [CrossRef]
- Ruaro, B.; Baratella, E.; Confalonieri, P.; Wade, B.; Marrocchio, C.; Geri, P.; Busca, A.; Pozzan, R.; Andrisano, A.G.; Cova, M.A.; et al. High-resolution computed tomography: Lights and shadows in improving care for SSc-ILD patients. Diagnostics 2021, 11, 1960. [Google Scholar] [CrossRef] [PubMed]
- Peng, M.; Wang, W.; Qin, L.; Liu, H.; Qin, M.; Zheng, W.; Shi, J.; Xu, W.; Zhu, Y. Association between nonspecific interstitial pneumonia and presence of CD20+ B lymphocytes within pulmonary lymphoid follicles. Sci. Rep. 2017, 7, 16912. [Google Scholar] [CrossRef] [PubMed]
- Salvatore, M.; Ishikawa, G.; Padilla, M. Is it idiopathic pulmonary fibrosis or not? J. Am. Board Fam. Med. 2018, 31, 151–162. [Google Scholar] [CrossRef] [PubMed]
- Blokland, K.E.C.; Waters, D.W.; Schuliga, M.; Read, J.; Pouwels, S.D.; Grainge, C.L.; Jaffar, J.; Westall, G.; Mutsaers, S.E.; Prêle, C.M.; et al. Senescence of ipf lung fibroblasts disrupt alveolar epithelial cell proliferation and promote migration in wound healing. Pharmaceutics 2020, 12, 389. [Google Scholar] [CrossRef] [PubMed]
- Azadeh, N.; Limper, A.H.; Carmona, E.M.; Ryu, J.H. The Role of Infection in Interstitial Lung Diseases: A Review. Chest 2017, 152, 842–852. [Google Scholar] [CrossRef] [PubMed]
- Ramos, C.; Montaño, M.; García-Alvarez, J.; Ruiz, V.; Uhal, B.D.; Selman, M.; Pardo, A. Fibroblasts from idiopathic pulmonary fibrosis and normal lungs differ in growth rate, apoptosis, and tissue inhibitor of metalloproteinases expression. Am. J. Respir. Cell Mol. Biol. 2001, 24, 591–598. [Google Scholar] [CrossRef]
- Prasad, S.; Hogaboam, C.M.; Jarai, G. Deficient repair response of IPF fibroblasts in a co-culture model of epithelial injury and repair. Fibrogenes. Tissue Repair 2014, 7, 7. [Google Scholar] [CrossRef]
- Vicens-Zygmunt, V.; Estany, S.; Colom, A.; Montes-Worboys, A.; Machahua, C.; Sanabria, A.J.; Llatjos, R.; Escobar, I.; Manresa, F.; Dorca, J.; et al. Fibroblast viability and phenotypic changes within glycated stiffened three-dimensional collagen matrices. Respir. Res. 2015, 16, 82. [Google Scholar] [CrossRef] [PubMed]
- Booth, A.J.; Hadley, R.; Cornett, A.M.; Dreffs, A.A.; Matthes, S.A.; Tsui, J.L.; Weiss, K.; Horowitz, J.C.; Fiore, V.F.; Barker, T.H.; et al. Acellular normal and fibrotic human lung matrices as a culture system for in vitro investigation. Am. J. Respir. Crit. Care Med. 2012, 186, 866–876. [Google Scholar] [CrossRef] [PubMed]
- Balestrini, J.L.; Chaudhry, S.; Sarrazy, V.; Koehler, A.; Hinz, B. The mechanical memory of lung myofibroblasts. Integr. Biol. 2012, 4, 410–421. [Google Scholar] [CrossRef]
- Ebihara, T.; Venkatesan, N.; Tanaka, R.; Ludwig, M.S. Changes in extracellular matrix and tissue viscoelasticity in bleomycin-induced lung fibrosis: Temporal aspects. Am. J. Respir. Crit. Care Med. 2000, 162, 1569–1576. [Google Scholar] [CrossRef] [PubMed]
- Marinković, A.; Liu, F.; Tschumperlin, D.J. Matrices of physiologic stiffness potently inactivate idiopathic pulmonary fibrosis fibroblasts. Am. J. Respir. Cell Mol. Biol. 2013, 48, 422–430. [Google Scholar] [CrossRef] [PubMed]
- Solon, J.; Levental, I.; Sengupta, K.; Georges, P.C.; Janmey, P.A. Fibroblast adaptation and stiffness matching to soft elastic substrates. Biophys. J. 2007, 93, 4453–4461. [Google Scholar] [CrossRef] [PubMed]
- Tsai, M.J.; Chang, W.A.; Liao, S.H.; Chang, K.F.; Sheu, C.C.; Kuo, P.L. The effects of epigallocatechin gallate (EGCG) on pulmonary fibroblasts of idiopathic pulmonary fibrosis (Ipf)—a next-generation sequencing and bioinformatic approach. Int. J. Mol. Sci. 2019, 20, 1958. [Google Scholar] [CrossRef]
- Germanguz, I.; Aranda, E.; Xiong, J.; Kissel, N.; Nichols, A.; Gadee, E.; O’Neill, J. Fibrotic human lung extracellular matrix as a disease-specific substrate for 3D in-vitro models of pulmonary fibrosis. J. Respir. Med. Lung Dis. 2019, 4, 1043. [Google Scholar] [CrossRef]
- Parra, E.R.; Kairalla, R.A.; De Carvalho, C.R.R.; Capelozzi, V.L. Abnormal deposition of collagen/elastic vascular fibres and prognostic significance in idiopathic interstitial pneumonias. Thorax 2007, 62, 428–437. [Google Scholar] [CrossRef] [PubMed][Green Version]
- Jaffar, J.; Yang, S.H.; Kim, S.Y.; Kim, H.W.; Faiz, A.; Chrzanowski, W.; Burgess, J.K. Greater cellular stiffness in fibroblasts from patients with idiopathic pulmonary fibrosis. Am. J. Physiol. Lung Cell. Mol. Physiol. 2018, 315, L59–L65. [Google Scholar] [CrossRef]
- Faffe, D.S.; Zin, W.A. Lung parenchymal mechanics in health and disease. Physiol. Rev. 2009, 89, 759–775. [Google Scholar] [CrossRef]
- Miki, H.; Mio, T.; Nagai, S.; Hoshino, Y.; Nagao, T.; Kitaichi, M.; Izumi, T. Fibroblast Contractility. Am. J. Respir. Crit. Care Med. 2000, 162, 2259–2264. [Google Scholar] [CrossRef] [PubMed]
- Griese, M.; Kirmeier, H.G.; Liebisch, G.; Rauch, D.; Stückler, F.; Schmitz, G.; Zarbock, R. Surfactant lipidomics in healthy children and childhood interstitial lung disease. PLoS ONE 2015, 10, e0117985. [Google Scholar] [CrossRef]
- Spickett, C.M.; Pitt, A.R. Oxidative lipidomics coming of age: Advances in analysis of oxidized phospholipids in physiology and pathology. Antioxid. Redox Signal. 2015, 22, 1646–1666. [Google Scholar] [CrossRef]
- Zuo, Y.Y.; Veldhuizen, R.A.W.; Neumann, A.W.; Petersen, N.O.; Possmayer, F. Current perspectives in pulmonary surfactant—Inhibition, enhancement and evaluation. Biochim. Biophys. Acta Biomembr. 2008, 1778, 1947–1977. [Google Scholar] [CrossRef]
- Bjermer, L.; Hallgren, O.; Zhou, X.H.; Tykesson, E.; Åhrman, E.; Maccarana, M.; Wildt, M.; Eriksson, L.; Hallgren, O. Increased deposition of glycosaminoglycans and altered structure of heparan sulfate in idiopathic pulmonary fibrosis. Int. J. Biochem. Cell Biol. 2017, 83, 27–38. [Google Scholar] [CrossRef]
- Egashira, R.; Jacob, J.; Kokosi, M.A.; Brun, A.L.; Rice, A.; Nicholson, A.G.; Wells, A.U.; Hansell, D.M. Diffuse pulmonary ossification in fibrosing interstitial lung diseases: Prevalence and associations. Radiology 2017, 284, 255–263. [Google Scholar] [CrossRef] [PubMed]
- Chan, E.D.; Morales, D.V.; Welsh, C.H.; McDermott, M.T.; Schwarz, M.I. Calcium deposition with or without bone formation in the lung. Am. J. Respir. Crit. Care Med. 2002, 165, 1654–1669. [Google Scholar] [CrossRef] [PubMed]
- Scruggs, A.M.; Grabauskas, G.; Huang, S.K. The role of KCNMB1 and BK channels in myofibroblast differentiation and pulmonary fibrosis. Am. J. Respir. Cell Mol. Biol. 2020, 62, 191–203. [Google Scholar] [CrossRef] [PubMed]
- Huang, S.K.; Scruggs, A.M.; McEachin, R.C.; White, E.S.; Peters-Golden, M. Lung fibroblasts from patients with idiopathic pulmonary fibrosis exhibit genome-wide differences in DNA methylation compared to fibroblasts from nonfibrotic lung. PLoS ONE 2014, 9, e107055. [Google Scholar] [CrossRef]
- Roach, K.M.; Wulff, H.; Feghali-Bostwick, C.; Amrani, Y.; Bradding, P. Increased constitutive αSMA and Smad2/3 expression in idiopathic pulmonary fibrosis myofibroblasts is KCa3.1-dependent. Respir. Res. 2014, 15, 155. [Google Scholar] [CrossRef] [PubMed]
- Lee, J.U.; Chang, H.S.; Jung, C.A.; Kim, R.H.; Park, C.S.; Park, J.S. Upregulation of Potassium Voltage-Gated Channel Subfamily J Member 2 Levels in the Lungs of Patients with Idiopathic Pulmonary Fibrosis. Can. Respir. J. 2020, 2020, 3406530. [Google Scholar] [CrossRef] [PubMed]
- Raczkowska, J.; Rysz, J.; Budkowski, A.; Lekki, J.; Lekka, M.; Bernasik, A.; Kowalski, K.; Czuba, P. Surface patterns in solvent-cast polymer blend films analyzed with an integral-geometry approach. Macromolecules 2003, 36, 2419–2427. [Google Scholar] [CrossRef]
- Pogoda, K.; Jaczewska, J.; Wiltowska-Zuber, J.; Klymenko, O.; Zuber, K.; Fornal, M.; Lekka, M. Depth-sensing analysis of cytoskeleton organization based on AFM data. Eur. Biophys. J. 2012, 41, 79–87. [Google Scholar] [CrossRef] [PubMed]
- Guz, N.; Dokukin, M.; Kalaparthi, V.; Sokolov, I. If Cell Mechanics Can Be Described by Elastic Modulus: Study of Different Models and Probes Used in Indentation Experiments. Biophys. J. 2014, 107, 564–575. [Google Scholar] [CrossRef] [PubMed]
- Ding, Y.; Wang, J.; Xu, G.K.; Wang, G.F. Are elastic moduli of biological cells depth dependent or not? Another explanation using a contact mechanics model with surface tension. Soft Matter 2018, 14, 7534–7541. [Google Scholar] [CrossRef] [PubMed]
- Gostek, J.; Awsiuk, K.; Pabijan, J.; Rysz, J.; Budkowski, A.; Lekka, M. Differentiation between Single Bladder Cancer Cells Using Principal Component Analysis of Time-of-Flight Secondary Ion Mass Spectrometry. Anal. Chem. 2015, 87, 3195–3201. [Google Scholar] [CrossRef] [PubMed]
- Bobrowska, J.; Moffat, J.; Awsiuk, K.; Pabijan, J.; Rysz, J.; Budkowski, A.; Reading, M.; Lekka, M. Comparing surface properties of melanoma cells using time of flight secondary ions mass spectrometry. Analyst 2016, 141, 6217–6225. [Google Scholar] [CrossRef] [PubMed]
- Graham, D.J.; Castner, D.G. Multivariate analysis of ToF-SIMS data from multicomponent systems: The why, when, and how. Biointerphases 2012, 7, 49. [Google Scholar] [CrossRef]
- Aram, P.; Shen, L.; Pugh, J.A.; Vaidyanathan, S.; Kadirkamanathan, V. An efficient TOF-SIMS image analysis with spatial correlation and alternating non-negativity-constrained least squares. Bioinformatics 2015, 31, 753–760. [Google Scholar] [CrossRef] [PubMed][Green Version]
- Raczkowska, J.; Orzechowska, B. Effect of tuned elasticity and chemical modification of substrate on fibrotic and healthy lung fibroblasts. Micron 2020, 139, 102948. [Google Scholar] [CrossRef] [PubMed]
- Raczkowska, J.; Prauzner-Bechcicki, S. Discrimination between HCV29 and T24 by controlled proliferation of cells co-cultured on substrates with different elasticity. J. Mech. Behav. Biomed. Mater. 2018, 88, 217–222. [Google Scholar] [CrossRef] [PubMed]
- Prauzner-Bechcicki, S.; Raczkowska, J.; Madej, E.; Pabijan, J.; Lukes, J.; Sepitka, J.; Rysz, J.; Awsiuk, K.; Bernasik, A.; Budkowski, A.; et al. PDMS substrate stiffness affects the morphology and growth profiles of cancerous prostate and melanoma cells. J. Mech. Behav. Biomed. Mater. 2015, 41, 13–22. [Google Scholar] [CrossRef] [PubMed]
- Raczkowska, J.; Prauzner-Bechcicki, S. Precise positioning of cancerous cells on PDMS substrates with gradients of elasticity. Biomed. Microdevices 2016, 18, 90. [Google Scholar] [CrossRef] [PubMed][Green Version]
- Hinz, B. Mechanical aspects of lung fibrosis: A spotlight on the myofibroblast. Proc. Am. Thorac. Soc. 2012, 9, 137–147. [Google Scholar] [CrossRef]
- D’Urso, M.; Kurniawan, N.A. Mechanical and Physical Regulation of Fibroblast–Myofibroblast Transition: From Cellular Mechanoresponse to Tissue Pathology. Front. Bioeng. Biotechnol. 2020, 8, 1459. [Google Scholar] [CrossRef]
- Raczkowska, J.; Prauzner-Bechcicki, S.; Lukes, J.; Sepitka, J.; Bernasik, A.; Awsiuk, K.; Paluszkiewicz, C.; Pabijan, J.; Lekka, M.; Budkowski, A. Physico-chemical properties of PDMS surfaces suitable as substrates for cell cultures. Appl. Surf. Sci. 2016, 389, 247–254. [Google Scholar] [CrossRef]
- Palchesko, R.N.; Zhang, L.; Sun, Y.; Feinberg, A.W. Development of polydimethylsiloxane substrates with tunable elastic modulus to study cell mechanobiology in muscle and nerve. PLoS ONE 2012, 7, e51499. [Google Scholar] [CrossRef]
- Sun, K.; Xie, Y.; Ye, D.; Zhao, Y.; Cui, Y.; Long, F.; Zhang, W.; Jiang, X. Mussel-inspired anchoring for patterning cells using polydopamine. Langmuir 2012, 28, 2131–2136. [Google Scholar] [CrossRef] [PubMed]
- Lee, J.N.; Jiang, X.; Ryan, D.; Whitesides, G.M. Compatibility of mammalian cells on surfaces of poly(dimethylsiloxane). Langmuir 2004, 20, 11684–11691. [Google Scholar] [CrossRef] [PubMed]
- Chou, S.Y.; Lin, C.Y.; Cassino, T.; Wan, L.; LeDuc, P.R. Probing coordinated co-culture cancer related motility through differential micro-compartmentalized elastic substrates. Sci. Rep. 2020, 10, 18519. [Google Scholar] [CrossRef]
- Park, J.Y.; Yoo, S.J.; Lee, E.J.; Lee, D.H.; Kim, J.Y.; Lee, S.H. Increased poly(dimethylsiloxane) stiffness improves viability and morphology of mouse fibroblast cells. Biochip J. 2010, 4, 230–236. [Google Scholar] [CrossRef]
- Raychoudhury, S.; Raychoudhury, K.; Millette, C. Biotechnological evaluation of extracellular matrix proteins expressed by cultured testicular cells. J. Biotech Res. 2011, 3, 62–71. [Google Scholar]
- Michalik, M.; Pierzchalska, M.; Legutko, A.; Ura, M.; Ostaszewska, A.; Soja, J.; Sanak, M. Asthmatic bronchial fibroblasts demonstrate enhanced potential to differentiate into myofibroblasts in culture. Med. Sci. Monit. 2009, 15, 194–201. [Google Scholar]
- López-García, J.; Lehocký, M.; Humpolíček, P.; Sáha, P. HaCaT Keratinocytes Response on Antimicrobial Atelocollagen Substrates: Extent of Cytotoxicity, Cell Viability and Proliferation. J. Funct. Biomater. 2014, 5, 43–57. [Google Scholar] [CrossRef] [PubMed]
- Janmey, P.A.; Fletcher, D.A.; Reinhart-King, C.A. Stiffness sensing by cells. Physiol. Rev. 2020, 100, 695–724. [Google Scholar] [CrossRef] [PubMed]
- Gabasa, M.; Duch, P.; Jorba, I.; Giménez, A.; Lugo, R.; Pavelescu, I.; Rodríguez-Pascual, F.; Molina-Molina, M.; Xaubet, A.; Pereda, J.; et al. Epithelial contribution to the profibrotic stiff microenvironment and myofibroblast population in lung fibrosis. Mol. Biol. Cell 2017, 28, 3741–3755. [Google Scholar] [CrossRef] [PubMed]
- Brown, A.C.; Fiore, V.F.; Sulchek, T.A.; Barker, T.H. Physical and chemical microenvironmental cues orthogonally control the degree and duration of fibrosis-associated epithelial-to-mesenchymal transitions. J. Pathol. 2013, 229, 25–35. [Google Scholar] [CrossRef]
- Sarna, M.; Wojcik, K.A.; Hermanowicz, P.; Wnuk, D.; Burda, K.; Sanak, M.; Czyö, J.; Michalik, M. Undifferentiated bronchial fibroblasts derived from asthmatic patients display higher elastic modulus than their non-asthmatic counterparts. PLoS ONE 2015, 10, e0116840. [Google Scholar] [CrossRef] [PubMed]
- Liu, F.; Mih, J.D.; Shea, B.S.; Kho, A.T.; Sharif, A.S.; Tager, A.M.; Tschumperlin, D.J. Feedback amplification of fibrosis through matrix stiffening and COX-2 suppression. J. Cell Biol. 2010, 190, 693–706. [Google Scholar] [CrossRef] [PubMed]
- Gavara, N.; Chadwick, R.S. Relationship between cell stiffness and stress fiber amount, assessed by simultaneous atomic force microscopy and live-cell fluorescence imaging. Biomech. Model. Mechanobiol. 2016, 15, 511–523. [Google Scholar] [CrossRef] [PubMed]
- Gowdy, K.M.; Fessler, M.B. Emerging roles for cholesterol and lipoproteins in lung disease. Pulm. Pharmacol. Ther. 2013, 26, 430–437. [Google Scholar] [CrossRef]
- Sokolowski, J.W.; Burgher, L.W.; Jones, F.L.; Patterson, J.R.; Selecky, P.A. Guidelines for fiberoptic bronchoscopy in adults. American Thoracic Society. Medical Section of the American Lung Association. Am. Rev. Respir. Dis. 1987, 136, 1066. [Google Scholar] [CrossRef] [PubMed]
- Wnuk, D.; Paw, M.; Ryczek, K.; Bochenek, G.; Sładek, K.; Madeja, Z.; Michalik, M. Enhanced asthma-related fibroblast to myofibroblast transition is the result of profibrotic TGF-β/Smad2/3 pathway intensification and antifibrotic TGF-β/Smad1/5/(8)9 pathway impairment. Sci. Rep. 2020, 10, 16492. [Google Scholar] [CrossRef] [PubMed]
- Kuznetsova, T.G.; Starodubtseva, M.N.; Yegorenkov, N.I.; Chizhik, S.A.; Zhdanov, R.I. Atomic force microscopy probing of cell elasticity. Micron 2007, 38, 824–833. [Google Scholar] [CrossRef]
- Graham, D.J.; Castner, D.G. Image and Spectral Processing for ToF-SIMS Analysis of Biological Materials. Mass Spectrom. 2013, 2, S0014. [Google Scholar] [CrossRef] [PubMed]


| Young Modulus E [kPa] | |||
|---|---|---|---|
| Healthy | NSIP | IPF | |
| PDMS A 200 nm | 20.29 ± 0.76 | 20.86 ± 1.06 | 18.61 ± 0.67 |
| PDMS A 400 nm | 17.32 ± 0.91 | 17.93 ± 0.82 | 16.33 ± 0.60 |
| PDMS A 600 nm | 16.80 ± 0.82 | 17.47 ± 0.84 | 13.82 ± 0.54 |
| PDMS D 200 nm | 22.67 ± 0.83 | 19.27 ± 0.74 | 20.56 ± 0.59 |
| PDMS D 400 nm | 20.09 ± 0.79 | 16.40 ± 0.65 | 17.58 ± 0.56 |
| PDMS D 600 nm | 18.21 ± 0.92 | 15.37 ± 0.66 | 16.27 ± 0.50 |
| control 200 nm | 19.57 ± 0.89 | 24.36 ± 0.90 | 22.56 ± 0.83 |
| control 400 nm | 16.67 ± 0.75 | 21.47 ± 0.84 | 19.70 ± 0.81 |
| control 600 nm | 15.02 ± 0.71 | 20.22 ± 0.81 | 17.98 ± 0.63 |
| NSIP | IPF | |||||||
|---|---|---|---|---|---|---|---|---|
| Mass [u] | Determined Formula | Assignment | Mass [u] | Determined Formula | Assignment | Mass [u] | Determined Formula | Assignment |
| 71.98 | CNNa2+ | 28.02 | CH2N+ | 29.04 | C2H5+ | fatty acid | ||
| 87.98 | CNONa2+ | 30.04 | CH4N+ | all amino acids | 41.04 | C3H5+ | fatty acid | |
| 104.99 | C4H2O2Na+ | 43.06 | C3H7+ | fatty acid | ||||
| 142.95 | C2HPO4Na+ | 55.05 | C4H7+ | fatty acid | ||||
| 164.94 | Na3PO4H+ | 57.07 | C4H9+ | fatty acid | ||||
| 58.07 | C3H8N+ | fatty acid | ||||||
| 67.06 | C5H7+ | fatty acid | ||||||
| 91.39 | C7H7+ | fatty acid | ||||||
| Healthy | NSIP | IPF | ||||||
|---|---|---|---|---|---|---|---|---|
| Mass [u] | Determined Formula | Assignment | Mass [u] | Determined Formula | Assignment | Mass [u] | Determined Formula | Assignment |
| 28.02 | CH2N+ | 30.04 | CH4N+ | all amino acids | 27.02 | C2H3+ | fatty acid | |
| 38.96 | K+ | 55.02 | C3H3O+ | 39.02 | C3H3+ | |||
| 71.98 | CNNa2+ | 56.05 | C3H6N+ | all amino acids | 39.96 | Ca+ | ||
| except for Gly | ||||||||
| 123.94 | Na2PO3+ | 59.05 | C3H7O+ | all amino acids | 43.05 | C3H7+ | fatty acid | |
| except for Gly | ||||||||
| 70.07 | C4H8N+ | multiple amino acids | 56.96 | CaOH+ | ||||
| 84.05 | C4H6NO+ | multiple amino acids | 81.96 | CNOCa+ | ||||
| 84.08 | C5H10N+ | multiple amino acids | ||||||
Publisher’s Note: MDPI stays neutral with regard to jurisdictional claims in published maps and institutional affiliations. |
© 2022 by the authors. Licensee MDPI, Basel, Switzerland. This article is an open access article distributed under the terms and conditions of the Creative Commons Attribution (CC BY) license (https://creativecommons.org/licenses/by/4.0/).
Share and Cite
Orzechowska, B.; Awsiuk, K.; Wnuk, D.; Pabijan, J.; Stachura, T.; Soja, J.; Sładek, K.; Raczkowska, J. Discrimination between NSIP- and IPF-Derived Fibroblasts Based on Multi-Parameter Characterization of Their Growth, Morphology and Physic-Chemical Properties. Int. J. Mol. Sci. 2022, 23, 2162. https://doi.org/10.3390/ijms23042162
Orzechowska B, Awsiuk K, Wnuk D, Pabijan J, Stachura T, Soja J, Sładek K, Raczkowska J. Discrimination between NSIP- and IPF-Derived Fibroblasts Based on Multi-Parameter Characterization of Their Growth, Morphology and Physic-Chemical Properties. International Journal of Molecular Sciences. 2022; 23(4):2162. https://doi.org/10.3390/ijms23042162
Chicago/Turabian StyleOrzechowska, Barbara, Kamil Awsiuk, Dawid Wnuk, Joanna Pabijan, Tomasz Stachura, Jerzy Soja, Krzysztof Sładek, and Joanna Raczkowska. 2022. "Discrimination between NSIP- and IPF-Derived Fibroblasts Based on Multi-Parameter Characterization of Their Growth, Morphology and Physic-Chemical Properties" International Journal of Molecular Sciences 23, no. 4: 2162. https://doi.org/10.3390/ijms23042162
APA StyleOrzechowska, B., Awsiuk, K., Wnuk, D., Pabijan, J., Stachura, T., Soja, J., Sładek, K., & Raczkowska, J. (2022). Discrimination between NSIP- and IPF-Derived Fibroblasts Based on Multi-Parameter Characterization of Their Growth, Morphology and Physic-Chemical Properties. International Journal of Molecular Sciences, 23(4), 2162. https://doi.org/10.3390/ijms23042162